Abstract
From a value-added trade perspective, this study utilizes the world input–output tables and the water footprint data of each industry in each country in the Eora database to explore the virtual water resources of 19 countries (the G20 countries excluding the European Union) in 2016. We calculated nine value chain decompositions and the pattern of virtual water flows and then explored the implied virtual water use due to the trade of intermediate goods and final goods, and we also analyzed the unequal trade of virtual water and added value among countries. The results indicate the following. Firstly, in most countries, the largest portion of virtual water is attributed to exports of intermediate inputs that are produced in the source country and fully utilized by the direct import countries, followed by the foreign value-added component of intermediate goods, while the smallest share of virtual water is returned to the country. Secondly, in value-added trade, excluding the rest of the world (ROW), China, France, Italy, Japan, Mexico, South Korea, South Africa, Saudi Arabia, and Germany are net importers in the virtual water trade between G20 countries, and the USA is the largest net exporter of virtual water. Thirdly, intermediate product trade is the dominant form of implied virtual water trade among countries, which leads to a net flow ratio of implied virtual water of about 80% to 90%. Lastly, the Virtual Water Inequality Index shows that thirteen country combinations, including Brazil and Argentina, exhibit significant inequality, and most countries are in a relatively equal state. In addition, the virtual water and added value of the relatively economically developed regions benefit more from the virtual water trade. Therefore, it is crucial for countries to reduce their consumption of virtual water when trading intermediate products to develop high-value-added and low-water-consumption industries and to choose appropriate virtual water trade targets.
1. Introduction
Water resources, as a particularly important and fundamental resource for people’s livelihoods in the natural world and in the socio-economic environment, are being consumed in increasing quantities due to the rapid development of the global economy and the deepening of industrialization, urbanization, and the modernization of agriculture. Thus, addressing the pressing issue of water scarcity is of the utmost importance. The United Nations’ Sustainable Development Goals (SDGs) highlight that ensuring the sustainability of and accessibility to water and sanitation facilities is a requirement in the management and sustainable development of water resources. Afkhami et al. [1] pointed out that international trade may lead to an uneven distribution of water content of consumption. These development trends and studies have prompted countries to consider the issue of the sustainable management of water resources in policy formulation and international trade. Virtual water is the amount of water consumed in the process of producing a product. British academic Allan first introduced this concept in 1993 [2], using it to measure the amount of water used in the production of food and consumer goods. For example, when we take water from a river, water consumption refers to the actual amount of water extracted and used from the river, reflecting human water consumption behavior, while water resources refer to the amount of water available for use by the river at a specific time, taking into account ecology and sustainability. Virtual water can flow with the trade of commodities; when commodity trade occurs between countries, the virtual water will flow with commodities to other countries. Moreover, compared with actual water resources, virtual water can be more clearly reflected in the transnational trade, leading people realize to that water resources are not only internal resources of a country but also flow out abroad with international trade. With the increasing depth and intensity of the circulation of international trade, the levels of water resource use and virtual water exchange between countries is increasing, and virtual water exports will cause a certain degree of water resource loss, meaning that the study of virtual water is extremely important to enhance the efficiency of water resource allocation and relieve water resource shortages. The global value chain is an important part of today’s global economic system, which involves products and services across national borders, and in this process, virtual water trade is also gradually attracting people’s attention as an indispensable element. Therefore, studying virtual water between countries is highly significant for water resources’ management and sustainable development in terms of value-added trade.
Since the concept of virtual water was first put forward, the relevant content for virtual water trade has become the focus of research, and the main areas of research involve the following three aspects: 1. The flow pattern and development trend of virtual water trade between different areas: Shen et al. [3] studied the evolution of virtual water flow patterns in the primary, secondary, and tertiary industries in Northwest China and analyzed the driving factors, and their results showed that from 2002 to 2007, the virtual water flow in Northwest China shifted from net inflow to net outflow, and it mainly flowed to the Beijing–Tianjin area, followed by the northern coastal region, and the main virtual water inflow came from the central region. Du et al. [4], based on the coupling framework, concentrated on the global virtual water trade pattern and its dynamic changes from 2005 to 2015, finding that the internal coupling strength is greater than the external coupling strength and the strength of internal and peripheral coupling is increasing, while the strength of remote coupling is slightly lower. 2. The virtual water accounting and change trend of a particular basin: Yang et al. [5] studied the evolution of the spatio-temporal pattern of virtual water in the Yangtze River Economic Zone and found that although the virtual water pattern of transferring water from downstream developed regions remains unchanged, the regional gap is gradually narrowing, and the upstream regions are transferring more water resources outward. Zhang et al. [6] measured the total level of virtual water trade between the Yellow River Delta and other provinces and evaluated the degree of dependence of the Yellow River Delta on external water resources, and the results of their study showed that exports of virtual water exceed imports and that the virtual water trade intensifies the scarcity of water resources in the Yellow River Delta. Chen et al. [7] calculated the water footprint and virtual water trade in the Chaohu Lake Basin of China, demonstrating a significant improvement in water use efficiency in the Chaohu Lake Basin. 3. Studies on virtual water consumption for individual sectors: Cazcarro et al. [8] assessed the sustainability of virtual water consumed in the international trade of wood products. Wang et al. [9] used a network model to track virtual water consumption implicit in electricity trade in the 27 European Union countries in 2017. In addition, there is a growing trend in research related to analyzing the virtual water trade in a top-down manner using an input–output approach. For example, Wei et al. [10] quantified the risk of virtual water shortages in the Yellow River Basin by building the MRIO (Multi-Regional Input–Output) model, which provides a new point of view on policy decisions to address water shortages. Li et al. [11] assessed the spatial distribution and trends of inter-regional virtual water trade in China from 2014 to 2019 through the application of the MRIO model, and their results showed that water-scarce regions export more high-water-use-coefficient products, while water-rich regions export more low-water-use-coefficient products. Deng et al. [12] measured the virtual water trade in 19 major countries (the G20 countries excluding the EU) from 2006 to 2015 using the MRIO model, and their conclusions showed that the virtual water trade imports and exports of 19 major countries experienced varying degrees of growth during this period. Deng et al. [13] calculated the regional water footprint of China in 2002 and 2007 based on an interregional input–output model and analyzed its changing trends, and the results showed significant changes in water footprint in each region. Chen et al. [14] used an interregional input–output model to estimate the water footprints of Chinese provinces and quantify interprovincial virtual water transfer, and their results showed that there is sizable variation in provinces’ water footprints: regions with larger populations and a greater GDP (Gross Domestic Product) exhibit larger water footprints, while more developed areas demonstrate a higher percentage of external water footprints. Zhang et al. [15] studied the water–energy relationship in China based on the MRIO model.
The above literature demonstrates that domestic and foreign scholars have used different methods to analyze virtual water trade at the country and sectoral levels from different perspectives. However, current research mainly focuses on the perspective of traditional trade, with a particular emphasis on virtual water trade between countries. Under the conditions of economic globalization, the production process requires multiple enterprises from multiple countries and regions to work together. Different countries and regions complete different production processes and generate their added value, and the trade that ensues is referred to as value-added trade [16]. The global value chain is an economic system formed by the sources and destinations of added value in each country. At present, these new perspectives have received great attention of scholars in the study of carbon dioxide (Dai et al. [17]; Meng et al. [18]; Wang et al. [19]; Zhu et al. [20]) and embodied energy (Deng et al. [21]; Li et al. [22]).Therefore, this study decomposes the value chain of multi-country virtual water from the perspective of value added, studies the pattern of virtual water flows between countries, and assesses the inequality between virtual water and value added in the process of virtual water trade. There are two primary innovations of this study: 1. Based on the value-added trade perspective, the research subjects are 19 countries with a large volume of virtual water imports and exports (the G20 countries excluding the EU) and the ROW, composed of other countries. Based on the data from the EORA database, a Multi-Regional Input–Output model is constructed to decompose virtual water at the national level into nine trade paths. The flow patterns and virtual water flows caused by the different trade structures of each country are calculated, and the virtual water status and role in the global value chain are studied. 2. We select the Virtual Water Inequality Index (VWI) to study the degree of inequality in virtual water and value added, evaluate the unequal allocation of virtual water resources among different countries, provide data in support of improving virtual water trade in low-VWI countries, and offer reliable suggestions for promoting the efficient use and long-term sustainability of virtual water.
2. Methods and Data
2.1. Research Methodology
2.1.1. Virtual Water Accounting Methodology
The water footprint is a concept that measures the amount and impact of water resources used by an individual, organization, or product during production and consumption and can be used to assess the efficiency and sustainability of water use in a region, country, or globally. The water footprint can be divided into blue water, green water, gray water, and so on. In this study, the virtual water was based on the water footprint for accounting purposes.
Input–output analysis is a research approach usually used to identify inter-industry and inter-regional resource consumption linkages, which can be used for single-region or multi-region resource accounting depending on the different research objects. Based on the world input–output table in the EORA database, in this study, the national level was considered, referring to the research method of Xu et al. [23]. According to the balance relationship based on the input–output table, we used Equations (1) and (2):
In the above equations, is the column vector of the total output of country s, and is the direct consumption coefficient matrix for using self-products in the intermediate inputs of country s. is the final product demand matrix of country s originating from itself. is the total exports from country s to country r and is the sum of intermediate goods and the final demand from country s to country r. is the unit matrix, and is the Leontief inverse matrix, denoted as .
We defined the direct water use coefficient vector according to Equation (3):
where is the total water use in country s and is the total output of country s.
Direct water use only includes the consumption of water resources for final production, ignoring the intermediate inputs to production, and therefore underestimates the total use of water for production. Since water is used both directly and indirectly in the process of production, a measure of total water use was introduced, which is the sum of direct and indirect water use. The coefficient of total water use refers to the amount of water used by each department of society and the economy in the entire production process to satisfy the need for final goods displayed by the unit department and is a true reflection of the sector’s water use. The total water input coefficient is the product of the direct water use coefficient and the Leontief inverse matrix . Equation (4) provides the formula for the total water input coefficient ds:
The virtual water matrix for country s is calculated via Equation (5):
Virtual water exports can be calculated using Equation (6):
Virtual water imports can be calculated using Equation (7):
Then, the net export of the virtual water trade of country s can be calculated via Equation (8):
2.1.2. Momentum of Virtual Water Flows Due to Different Trade Structures
After establishing the direct water use coefficient matrix , the intermediate goods matrix , and the total output matrix , the implied virtual water intensity matrix can be calculated via Equation (9):
The implied virtual water volume in the intermediate goods imports in country s, the implied virtual water volume in the intermediate goods exports, the implied virtual water volume in the final goods imports, and the implied virtual water volume in the final goods exports are defined in Equations (10), (11), (12), and (13), respectively:
where denote the final demand from sector i in country s to country r, the final demand from sector j in country r to country s, the intermediate inputs from sector j in country s to sector i in country r, and the intermediate inputs from sector i in country r to sector j in country s, respectively. Therefore, the implied virtual water volume in total imports and total exports for each country is calculated as follows (Equations (14) and (15)):
2.1.3. Cross-Border and Cross-Industry Virtual Water Decomposition Model
The decomposition model used in this paper was drawn from the studies of Xu et al. [23] and Koopman [16] and also draws on the conceptual framework of the global value chain and resource trade integration proposed by Wang et al. [24] to examine cross-country and cross-industry virtual water trade from a value-added perspective.
Suppose that there are G countries and each country has N industrial sectors. Let and represent the N-order final product demand column vectors obtained by country r from country s, country s from country r, country t from country r, region r itself, and region s itself, respectively. denotes the matrix of value-added coefficients, which is the ratio of domestic value added to its total output. Define as a 1 × N unit vector. and are the N-th-order intermediate demand coefficient matrices of region s to region r, region r to region s, region s itself, and region r itself, respectively, and can be expressed as Equation (16):
The G × GN matrix , representing the direct value-added coefficients for all countries, is denoted as Equation (17):
where and are the N-th order block matrices in the Leontief inverse matrix , representing the total input generated by the final output of country s itself, country r satisfying country s, country s satisfying country r, and country t satisfying one unit of country s in N departments. Then, the Leontief inverse matrix can be presented as Equation (18):
Ultimately, the total exports of a country can be divided into the following nine value-added components (Equation (19)):
where is the totals export from country s to the remaining countries, which can be obtained via Equation (20):
Accordingly, from a value-added perspective, the virtual water is decomposed into the following nine components (Equation (21)):
Equations (19) and (21) both contain 9 terms, with each term being described in detail below: V1 and W1 denote that the value added or virtual water is implicitly contained in the final product and is transferred to different regions to satisfy the demand for the final product in the other regions. V2 and W2 indicate that the value added or virtual water is implicitly included in the intermediate inputs produced by the source country s and fully absorbed by the direct importer r. V3 and W3 represent the value added or virtual water of intermediate inputs exported from country s, which are used by the direct importer r to produce the final products, and then ultimately consumed by a third country. V4 and W4 represent the value added or virtual water of exports of domestically produced intermediate inputs, which are produced by the direct importer r for the final goods and ultimately imported and utilized by the domestic market. V5 and W5 represent the value added or virtual water of intermediate inputs produced domestically for export, which are used by direct importers to produce intermediate goods and ultimately imported and absorbed by the home country. V7 and W7 represent the foreign value added or virtual water for domestically produced final goods. V8 and W8 represent the foreign value added or virtual water for domestically produced intermediate inputs. V6 and W6 and V9 and W9 are the double-counted items. Moreover, V1, V2, and V3 represent value-added exports, and the formula for calculating the gross value added of exports is Equation (22):
2.1.4. Virtual Water Inequality Index
In order to quantify the degree of inequality between virtual water and value added, the Virtual Water Inequality Index is introduced. Referring to Wei et al. [25], we obtain the net virtual water (NVW) and net value added (NVA). The net virtual water is calculated in the same way as in Equation (22) mentioned above, and then the NVW between country s and country r (NVWsr) can be represented by Equation (23):
where and denote the VW inflow from country s to country r and VW inflow from country r to country s, respectively. Similarly, the NVA between country s and country r can be calculated as Equation (24):
where and denote the transfer of VA from country s to country r and from country r to country s, respectively.
We define an absolute equality line, , which is used as a reference for measuring the degree of deviation in the equilibrium between VW and VA in each country. Equation (25) shows the formula for :
The deviation can be represented by Equation (26):
The function is proposed to normalize the results of the Virtual Water Inequality Index (VWI), which takes values between 0 and 1. The VWI can be calculated by Equation (27):
The closer the is to 1, the greater the equality in the trade between virtual water and value added is. represents absolute equality. The closer the is to 0, the more unequal the trade between virtual water and value added is. represents absolute inequality.
2.2. Data Sources
In this paper, the raw data on the water resource use of each sector in each country and the world input–output table were obtained from the EORA database. The EORA database contains a large amount of data regarding the intermediate inputs, final demand, imports and exports, value added, and total output of 26 industries in each country (region) from 1990 to 2016. The 26 sectors are divided as shown in Table 1. In this study, we chose the world input–output table of 2016 and calculated the water footprint for our virtual water trade study by adding up the usage of blue water, green water, and gray water. In order to make it easier to calculate and compare virtual water imports and exports, referring to Deng et al. [8], 19 countries (the G20 countries excluding EU) with large virtual water trade volumes were selected, and the other countries were merged into the ROW (rest of the world). The 19 countries used were Argentina (ARG), Australia (AUS), Brazil (BRA), Canada (CAN), China (CHN), France (FRA), Germany (DEU), India (IND), Indonesia (IDN), Italy (ITA), Japan (JPN), Korea (KOR), Mexico (MEX), Saudi Arabia (SAU), South Africa (ZAF), Turkey (TUR), the United Kingdom (UK), the United States (USA), and Russia (RUS).

Table 1.
Industrial virtual water use coefficients (unit: m3/USD 10,000).
3. Results and Analysis
3.1. Virtual Water Path Decomposition
3.1.1. Virtual Water Decomposition of the Nine Trade Routes at the National Level
The results of the virtual water decomposition share of the nine trade routes for the G20 countries and ROW in 2016 are shown in Figure 1. This figure shows that regarding the total virtual water volume, the ROW, China, and the USA rank in the top three in order, while SAU has the lowest volume of virtual water, followed by South Africa and Turkey.
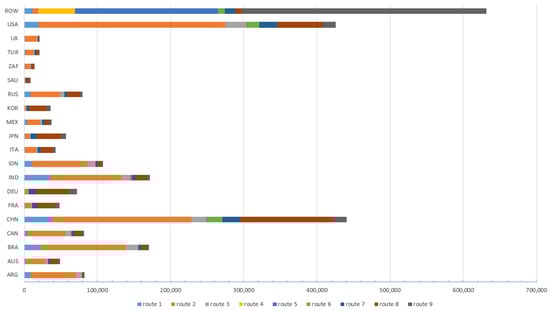
Figure 1.
The virtual water decomposition of the nine trade routes at the country level.
We analyze the share of the nine routes as follows:
- (1)
- Among the developed countries, France, Japan, Korea, and Germany have a much larger share of virtual water on route 8 than on the other routes, while Australia, Canada, Italy, the UK, and the USA have the largest share on route 2, accounting for more than 50 percent of their total virtual water trade (except for Italy), and all countries have their smallest share of virtual water on route 4. This suggests that developed countries are generally large players in value-added export trade and have comparatively little virtual water trade on the domestic trade route.
- (2)
- Saudi Arabia has the highest percentage of virtual water on route 8 among the developing countries, while Argentina, Brazil, China, India, Indonesia, Mexico, Russia, South Africa, and Turkey have the largest share of virtual water on route 2, in the range of 42–75%, especially Argentina and India, whose share of virtual water on route 2 reaches more than 70%, indicating that the scale of intermediate inputs produced in these countries and directly absorbed by other countries is very large. All developing countries have the smallest share of virtual water on route 5, with the largest share being only 0.14%. Similarly, developing countries also have a large share of value-added trade and a relatively small share of trade in virtual water on the domestic trade route, with Argentina, Brazil and Indonesia all having a share of more than 90 percent of trade in value-added exports.
- (3)
- The ROW has the largest proportion of virtual water on route 9 and the smallest share on route 3. The proportion of ROW in domestic trade routes is relatively larger than that of the other 19 countries, accounting for approximately 40.32% of its gross virtual water trade.
3.1.2. Virtual Water Decomposition of the Nine Trade Routes at the Sectoral Level
Direct water use coefficients usually take into account only the direct water usage in the production process and do not fully reflect the actual demand for water resources in various sectors. In reality, sectors require not only the direct use of water in the production of products and provision of services but also a certain amount of other goods and services as intermediate inputs, which also require water resources in their production process. Therefore, in order to more accurately assess the demand for water resources in each sector, the complete water use coefficient is introduced.
Table 1 shows the direct and complete water use coefficients for 26 sectors. The differences in the water use coefficients among these sectors are relatively small, indicating that the gap between various industries’ water use efficiency is relatively small. The sector with the largest direct water use coefficient is agriculture, with 15.806, and the sector with the largest complete water use coefficient is also agriculture, with 34.174, because agriculture, as a highly water-dependent sector, requires a great quantity of water resources both directly and indirectly in the cultivation process, and therefore, its direct water use coefficient and complete water use coefficient are relatively high. Meanwhile, the sector with the smallest direct water use coefficients is related to petroleum, chemical, and non-metallic mineral products, and the sector with the smallest complete water use coefficient is maintenance and repair. Mining and quarrying, wood and paper, fishing, textiles and wearing apparel, and petroleum, chemical, and non-metallic mineral products, whose rankings of the complete water use coefficients increase rapidly compared to the direct water use coefficients, are associated with the great demand for intermediate products, which use up plenty of water in these industries, reflecting the fact that the complete water use coefficients can provide a true indication of the water use of an industry. In addition, from the standpoint of conserving water, the development of industries that are less dependent on water resources, such as maintenance and repair, financial intermediation and business activities, and public administration, will be the key to improving the water utilization rate.
The results regarding the virtual water decomposition share of the nine trade routes at the sectoral level are displayed in Figure 2. Overall, the re-exports and re-imports sector has the largest virtual water trade, confirming that with the gradual increase in trade interactions between countries, the virtual water in various forms of imports, processing, and re-exports in cross-border trade has increased, while fishing has the smallest virtual water trade. All sectors have the largest share of virtual water decomposition on route 2 and the smallest on route 4, and there is not much of a difference in the proportion of virtual water decomposition among sectors on route 1, 3, 6, 7, and 8.
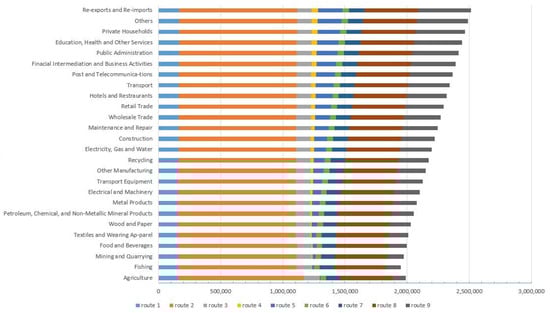
Figure 2.
Virtual water decomposition of nine trade routes at the sectoral level.
The three largest shares of virtual water on route 2 are agriculture, fishing, and mining and quarrying, all of which belong to the primary sector, while these three industries also have the smallest share of virtual water on route 4. Most sectors have a large share of intermediate goods that are imported directly and a small share that are used by importers to produce final goods and are ultimately imported by the home country, meaning that they have a large export trade and a small domestic trade, while private households, other sectors, and re-exports and re-imports have larger domestic trade.
3.2. Analysis of Virtual Water in Value-Added Trade
3.2.1. Analysis of Import and Export Volume of Virtual Water
In this study, the virtual water exports, virtual water imports, and net virtual water of the G20 countries as well as the ROW in 2016 are calculated according to Equations (6)–(8), and the results are shown in Table 2. Overall, except for Germany and the ROW, the exports of the virtual water of the remaining 18 countries are greater than their virtual water imports, with Germany being a virtual water importing country and the remaining 18 countries being virtual water exporting countries, and the ROW comprises more virtual water importing countries. In addition, through accounting, the sum of the net virtual water of the G20 countries as well as the ROW is equal to zero, which verifies the correctness of the calculations in this paper.
Table 2.
The volume of virtual water imports and exports in 2016 (m3).
- (1)
- The largest virtual water export countries in 2016 were the USA and China, both exporting more than 2.00 × 10⁶ m3, at 27.65 ×10⁵ m3 and 24.21 × 10⁵ m3, respectively, followed by Brazil, India, and Indonesia. The smallest virtual water export country was Saudi Arabia, at only 17.63 × 10³ m3. In addition to the ROW, in 2016, the largest virtual water import country was the USA with 77.97 × 10³ m3, followed by China with 74.93 × 10³ m3 and Germany, France, and Japan. The smallest virtual water import country was the UK, at only 1.98 × 10³ m3. The largest net virtual water countries were the USA and China with 26.87 × 10⁵ m3 and 23.46 × 10⁵ m3, respectively, followed by Brazil, India, and Indonesia, while the smallest was South Korea, with only 9.03 × 10³ m3 of net virtual water. These calculation results reflect the fact that although countries such as India and Indonesia are less economically developed, their populations are among the world’s highest. Countries such as the USA, China, and Brazil not only have large populations and developed economies but also have excellent geographical locations and vast territories. Therefore, these countries have obvious competitive advantages in international trade, with frequent virtual water trade between countries and relatively large virtual water import and export volumes. In contrast, countries such as the UK and South Korea have smaller populations and smaller land areas, while Saudi Arabia’s economy is relatively less developed, resulting in smaller virtual water imports and exports.
- (2)
- Although countries such as China and India have scarce water resources per capita, as developing countries with a strong global economic power, they have gradually become important participants in the allocation of labor and production in the global value chain. They produce a large amount of goods for export to foreign countries, which are absorbed by other countries, and therefore have become large net export virtual water countries. Germany is a net import virtual water country, meaning that its development depends on virtual water imports, and with water resources decreasing globally, it may face a certain degree of water stress. In addition, the sum virtual water exports of the 19 studied countries account for 96.75% of the global virtual water exports, indicating that global virtual water trade exports are concentrated among the G20 countries.
3.2.2. Analysis of Repeated Implied Virtual Water in Value-Added Trade
Virtual water flows can be measured more realistically and accurately by comparing different trade calculation methods. Table 3 shows virtual water embedded in traditional trade statistics and value-added trade statistics in the G20 countries and the ROW in 2016. It can be seen that the volume of export repeated trade is larger than the volume of import repeated trade for all countries. In addition, the volume of import repeated implied virtual water is smaller than that of export repeated implied virtual water for Australia, Canada, France, Germany, Mexico, South Korea, South Africa, and the ROW, while the volume of import repeated implied virtual water is larger than that of the export repeated implied virtual water for the remaining 12 countries. Moreover, except for the ROW, where the value-added ratio is more extreme (0.26% and 5.14%, respectively), all countries have an export value-added ratio in the range of 30–70% and an import value-added ratio in the range of 20–80%, which suggests that the size of international trade as calculated by traditional trade is in fact grossly overstated to a large extent, resulting in large double-counting of trade volumes, especially in China and the USA, where both have a net repeated trade volume of more than USD 10 million and the net repeated implied virtual water volume is also large, and these repeated trade volumes suggest that traditional trade calculations can lead to an overestimation of virtual water flows in international trade.
Table 3.
Global trade volumes and implied virtual water in 2016.
Specifically, the largest volumes of repeated implied virtual water exports and imports were observed for China, the USA, and India. Compared to value-added trade, traditional trade calculations resulted in the largest volume of net repeated trade for China, with the largest volume of repeated trade in exports of USD 305.11 billion and repeated trade in imports of USD 30.12 billion, resulting in 1305.44 m3 of export repeated implied virtual water and 1561.64 m3 of import repeated implied virtual water, followed by the USA, with the largest volume of repeated trade in exports of USD 176.35 billion and USD 30.23 billion in import repeated trade, resulting in an overestimation of 907.55 m3 of virtual water exports and 1734.30 m3 of virtual water imports. Germany’s export repeated trade volume was USD 103.55 billion and its import repeated trade volume was USD 17.45 billion, resulting in an export implied virtual water volume of 37.52 m3 and import implied virtual water volume of 36.65 m3. The smallest net repeated trade volume was observed for the UK, with USD 4.23 billion in export repeated trade volume and USD 0.63 billion in import repeated trade volume, resulting in 119.22 m3 of export implied virtual water and 124.29 m3 of import implied virtual water.
These data show that traditional trade accounting methods can easily cause large errors when calculating virtual water volume, which ultimately leads to the overestimation or underestimation of virtual water trade data in certain countries or regions, resulting in the irrational use of water resources, which is likely to harm the environment and, at the same time, may lead to unfair trade relations, so it is more reasonable to adopt a value-added trade method to measure virtual water flows.
3.2.3. Analysis of Implied Virtual Water Due to Different Trade Structures
According to Equation (10) to Equation (13), the implied virtual water trade volume in the intermediate and final products of each country was calculated, with the results shown in Table 4. For an individual country, regardless of the implied virtual water in intermediate products or implied virtual water in the final products, its import implied virtual water volume is smaller than the corresponding export implied virtual water volume. Thus, the gross imports of each country are smaller than the gross exports of implied virtual water. In addition, the sum of all countries’ gross import implied virtual water volume is equal to the sum of all countries’ gross export implied virtual water volume, confirming the accuracy of this study’s results.
Table 4.
Implied virtual water volume in intermediate and final products (m3).
- (1)
- The largest import implied virtual water volume in intermediate products was observed for China, Germany, the USA, and France, among which the import implied virtual water volumes of China, Germany, and the USA were greater than 13.00 × 10⁵ m3, at 1498.50 × 103 m3, 1475.87 × 103 m3, and 1327.98 × 103 m3, respectively, and the gap among them was relatively small. However, the USA and France (671.35 × 10³ m3), which closely follow, have a large (two-fold) difference. The smallest import implied virtual water volume in intermediate products was observed for Argentina, at only 29.24 × 10³ m3, while China’s import implied virtual water volume is 51 times that of Argentina. The export implied virtual water volumes of intermediate products for the USA, China, Brazil, Argentina, Indonesia, and India were more than 13.00 × 10⁵ m3, with that of the USA being 67.27 × 10⁶ m3 and that of China being 58.65 × 10⁶ m3, while the smallest was observed for Saudi Arabia, at only 775.71 × 10³ m3, 87 times smaller than that of the USA. The largest import implied virtual water volumes of final products were observed for the USA and China, at 856.41 × 10³ m3 and 532.32 × 10³ m3, respectively, and the smallest import implied virtual water volume in final products was observed for the UK, which was about 186 times lower than that of the USA, at only 4.60 × 10³ m3. China is the only country for which the export implied virtual water volume in final products is more than 10.00 × 10⁶ m3, reaching 10.29 × 10⁶ m3, followed by the USA, Brazil, and India in order, with those for the USA and Brazil being 8696.78 × 103 m3 and 7833.84 × 103 m3, respectively, and there being a difference of about 1.6 times between Brazil and India (4788.58 × 103 m3), which follows. Meanwhile, the smallest export implied virtual water volume in final products was observed for Saudi Arabia, at 232.28 × 10³ m3, and the maximum volume of its export implied virtual water was 44 times higher than the minimum volume.
- (2)
- The largest trade volumes of gross import implied virtual water were observed for the USA, China, Germany, France, and Japan, with those for the USA and China being above 2.00 × 10⁶ m3, at 21.84 × 10⁵ m3 and 20.31 × 10⁵ m3, respectively. The countries with an implied virtual water trade volume in total imports below 1.00 × 10⁵ m3 were South Africa, Argentina, and the UK, with only 94.78 × 10³ m3, 59.36 × 10³ m3, and 53.37 × 10³ m3, respectively. The USA, China, Brazil, Argentina, and Indonesia had the highest implied virtual water volume in total exports, with those of the USA and China reaching 75.97 × 10⁶ m3 and 68.95 × 10⁶ m3, respectively. Saudi Arabia had the lowest implied virtual water volume in total exports, at 1007.99 m3, which is 75 times the maximum implied virtual water volume in total exports.
- (3)
- Argentina’s export implied virtual water volume in intermediate products was about five times that of the export implied virtual water of final products, and the import implied virtual water volume in intermediate products was about 0.97 times that of the import implied virtual water of final products. South Africa’s export implied virtual water volume in intermediate products was about 6 times that of the export implied virtual water of final products, and its import implied virtual water volume in intermediate products is about 0.95 times that of the import implied virtual water of final products, meaning that except for Argentina and South Africa, where the import implied virtual water volume in intermediate products did not reach more than two times the import implied virtual water volume in final products, the import and export implied virtual water volume in intermediate products in all other countries is more than twice the import and export implied virtual water volume in final products. Trade in intermediate products is becoming a major form of foreign trade between countries, dominating the trade in implied virtual water in these countries. From the perspective of the sustainable development of virtual water, the export implied virtual water of intermediate products belongs to the mode of “domestic commitment, foreign consumption”, which provides short-term economic benefits which will inevitably be sacrificed at the expense of long-term ecological benefits and may even pay for the national “health costs”. In addition, the import implied virtual water of intermediate products will indirectly increase the dependence on external virtual water resources, constituting a potential impact on the security of virtual water. Therefore, ensuring a safe and sustainable virtual water system by optimizing the structure of imported and exported intermediate products, improving related technologies, and implementing targeted restrictive measures have become a top priority for countries to improve their water resource management.
We calculated the net implied virtual water flows caused by intermediate and final products in each country according to Table 4, and it can be seen from Table 5 that for all countries, the net implied virtual water flows due to intermediate products occupy a much larger proportion of the total net implied virtual water flows than those caused by final products, which is consistent with the results of a study by Xia et al. [26]—that is, whether from a global or a Chinese perspective, the proportion of intermediate product trade in total trade is higher and displays a continuously expanding trend. The proportion of net implied virtual water flows due to intermediate products is about 80% to 90%, with the largest proportion in Canada (91.49%), followed by the UK (90.21%) and South Korea (89.91%) and smaller proportions in Brazil (79.18%), Mexico (78.11%), and India (74.57%). Accordingly, net virtual water flows due to final products took up a small proportion of the total net implied virtual water flows, with India, Mexico, and Brazil accounting for the largest proportion and South Korea, the UK, and Canada accounting for the smallest proportion. The country with the largest trade volume of net implied virtual water flows of intermediate products is the USA, followed by China and Brazil, respectively, while the smallest is observed for Saudi Arabia, with 661.46 × 10³ m3. The largest trade volume of implied virtual water flows of final products is displayed by China, followed by the USA and Brazil, and the smallest is also seen for Saudi Arabia, at only 155.88 × 10³ m3. The USA and China are far ahead of the net implied virtual water flows, with Brazil, Argentina, and so on displaying a large gap.
Table 5.
Net implied virtual water flows in value-added trade (m3).
Both Table 4 and Table 5 show that, in recent years, globalization and industrial chain restructuring have both promoted the expansion of trade in intermediate products, while the trade in intermediate products is the dominant form of trade, leading to a larger proportion of implied virtual water caused by intermediate products, especially concentrated among countries such as the USA, China, Brazil, and Argentina. Meanwhile, in South Africa, Saudi Arabia and other countries, the intermediate product trade volume is small. Taking into account the fact that different countries are at different economic stages and have varying water and energy costs during intermediate product production, there is an imbalanced distribution of implied virtual water in cross-border trade. At the same time, countries such as the USA and Brazil may focus on the production of energy-intensive industries, further exacerbating the imbalance of implied virtual water in the trade of intermediate products. There is a need for technological transformation and cooperation between developed and developing countries to promote the balanced allocation of virtual water of intermediate products in trade and to jointly encourage the advancement of the sustainable development of global virtual water resources.
3.3. Analysis of Virtual Water Flow Characteristics
3.3.1. Overall Analysis of Virtual Water Flows in Value-Added Trade
Due to the large virtual water flow of the ROW, it is not convenient to analyze its virtual water transfers with G20 countries, so the virtual water transfers measured in Figure 3 do not include the ROW. As shown in Figure 3 below, after excluding the data from the ROW, the countries whose virtual water outflow is smaller than their virtual water inflow are China, Germany, France, Italy, Japan, Mexico, South Korea, South Africa, and Saudi Arabia, meaning that China, France, Italy, Japan, Mexico, South Korea, South Africa, and Saudi Arabia have changed from “virtual water net exporters” to “virtual water net importers”. Meanwhile, Germany is still an importer of virtual water, which means that the virtual water in these countries mostly flows out to other countries outside of these 19 countries. Intuitively, it can be observed that the countries with the highest amount of virtual water are the USA, Canada, Argentina, and China, while the countries with the smallest virtual water trade volume are South Korea and South Africa, related to their economic conditions and population size. In addition, there are not many countries that import virtual water from Mexico. The virtual water flow from Mexico to the USA basically accounts for the vast majority of Mexico’s total outflow. Most of Canada’s virtual water inflow comes from the USA, and most of Argentina’s virtual water inflow comes from Brazil.
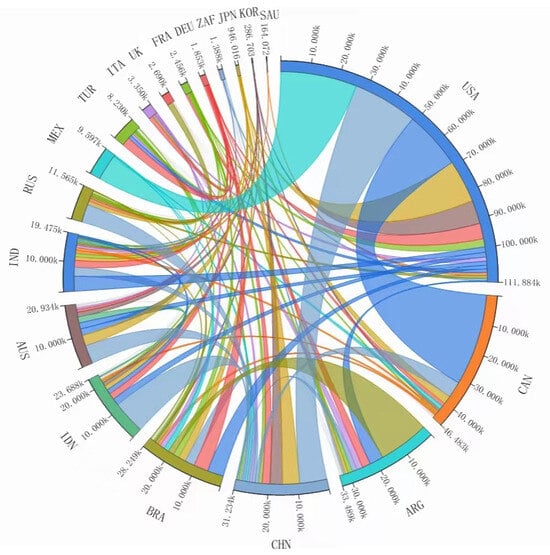
Figure 3.
Virtual water flows based on value-added trade for 19 countries. Different colors represent different countries’ virtual water outflow or virtual water inflow; lines with the same color as each node of the country denote virtual water outflow; and lines with different node colors represent virtual water inflow from other countries. The thicker the lines are, the larger the volumes of the virtual water flows are.
3.3.2. Specific Analysis of Virtual Water Flows in Value-Added Trade
The volume of virtual water inflow and outflow between countries as well as major inflow and outflow countries in 2016 are calculated by using the value-added trade method, and in order to analyze the results more closely, only the top five virtual water exporters and importers and their specific flows are listed.
The top five countries that export the most virtual water and their major outflow countries are shown in Table 6. The largest virtual water exporter is the USA, with 11.19 × 10³ m3, and its virtual water outflows mostly occur to Mexico, China, Canada, Japan, and South Korea and other economically more developed countries, and the trade volume gap is relatively small, and its total export volume of virtual water is three times that of Canada’s (4.65 × 10³ m3). Canada, Argentina, China, and Brazil’s virtual water export volumes are relatively similar to each other, with Canada’s virtual water flow to the USA accounting for about 68% of Canada’s gross export volume of virtual water and Argentina’s virtual water flow to Brazil accounting for 55% of Argentina’s total export volume of virtual water. A possible reason for this is that the virtual water flow is influenced by both population factors in the urbanization process and the time conditions of transportation losses and resource demands. The overall transportation direction presents a pattern of regional centers near to transportation. Therefore, due to the prosperous trade development of these countries and the convenient trade between Argentina and Brazil and Mexico and the USA, the majority of virtual water trade occurs between them. China and Brazil’s virtual water major outflow countries are concentrated in the USA, Japan, Germany, and France. China’s virtual water exports to the neighboring developed countries of Japan and South Korea are also larger, at 0.59 × 10³ m3 and 0.43 × 10³ m3, respectively, accounting for approximately 33% of China’s total export volume of virtual water. The gap in Brazil’s major virtual water outflow countries is small, and the export markets are evenly diversified.
Table 6.
Major virtual water exporting countries and outflows (unit: 103 m3).
Table 7 shows the top five importers of virtual water and their major inflow countries. The largest virtual water importer is the USA, at up to 7.24 × 10³ m3, with virtual water imported from Canada taking up 44% of the total import volume of virtual water of the USA, closely followed by its virtual water import volume from China, Mexico, Brazil, and India, and the total import volume of virtual water between the USA and these four countries is lower than that between the USA and Canada. China’s import volume of virtual water is 6.23 × 10³ m3; because India is a populous country and geographically close to China, India is the second primary source of virtual water for China, while Russia also borders China and has the world’s largest freshwater lakes and so has also become a major source of virtual water for China, which intuitively reveals that economically developed regions obtain virtual water directly from the nearest region with good resources or industries. Mexico is also adjacent to the USA and has a fast flow of virtual water, meaning that the virtual water inflow from the USA to Mexico is 2.64 × 10³ m3, which is 83% of Mexico’s gross virtual water import volume (3.18 × 10³ m3), while the phenomenon of Mexico’s virtual water imports from Brazil, Canada, China, and India is also notable. Germany’s import volume of virtual water amounts to 2.97 × 10³ m3, with a small gap between the inflows to it from the USA, Brazil, Turkey, Argentina, and China.
Table 7.
Major virtual water importing countries and inflows (103 m3).
From Table 6 and Table 7, we can see that the majority of virtual water trade is concentrated among countries with a higher economic level and a greater geographical area. Although some countries’ economies are not developed enough, such as India (which is China’s major source of virtual water), they have become major sources or outflow countries of virtual water because of their advantageous geographical location.
Table 8 shows the five countries with the largest net virtual water volume and their major flows. It can be observed that the USA, Argentina, Canada, Australia, and India have assumed the role of “suppliers of virtual water”, meaning that these countries are all net exporters of virtual water. Although the total export and import volumes of virtual water of Australia and India are not large, their net virtual water volumes are the highest, and the countries that possess the greatest amount of net virtual water are the USA, Argentina, Canada, Australia, and India, with 3.95 × 10³ m3, 3.08 × 10³ m3, 2.15 × 10³ m3, 1.79 × 10³ m3, and 1.78 × 10³ m3, respectively. The net virtual water volumes of the USA and Mexico, Japan and China, Argentina and Brazil, and Canada and the USA are all above 1000 m3. The USA and Mexico’s net virtual water volume is the largest, at 1.79 × 10³ m3. Although China, Germany, Japan are not at the forefront of net virtual water, they are among the countries which are the main destination of net virtual water. The main destinations of the top five countries regarding net virtual water all include China, and the volume flow out to China from these five countries is not small, at 33%, 5%, 21%, 32%, and 12%, respectively, indicating that China is a major virtual water trading party. In order for China to transform its mode of economic development, it must reshape its virtual water import and export structure and accelerate industrial transformation and upgrading in order to speed up the growth of virtual water trade.
Table 8.
Major net virtual water countries and flows (103 m3).
3.4. Inequality Analysis of Virtual Water and Value Added
3.4.1. Inequality between NVW and NVA
According to Equations (23) and (24), the NVA and NVW of the 19 countries are calculated. Since NVWsr and NVAsr denote the NVW and NVA from region s to region r, respectively, it is suggested that they can be both positive and negative between any two countries, and thus NVWsr = −NVWrs. Taking the NVA between Argentina and Australia as an example, when NVAARG-AUS is positive, then NVAAUS-ARG must be negative, even though they represent the same situation (the NVA between Argentina and Australia). Thus, this study exclusively focuses on the case where NVAsr < 0 and its counterpart NVWsr. The results are shown in Figure 4, where the axes are divided into four quadrants and the solid yellow line is the absolute equality line for these data.
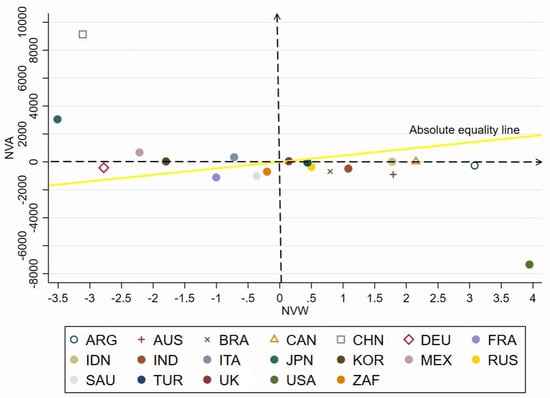
Figure 4.
Inequality between NVW and NVA in 19 countries.
In quadrants I and III, there are no countries that appear to have deviated particularly significantly from the absolute equality line. In quadrantⅡ, China, Japan, and Mexico display significant deviations from the absolute equality line, where they should have exported an economic cost but received a great benefit—China imported 3.11 × 10³ m3 of VW and received up to USD 9.13 million VA when it should have spent USD 2.61 million VA; Japan imported 3.51 × 10³ m3 of VW and actually received USD 3.05 million VA when the expected VA outflow should have been USD 2.95 million VA; and Mexico imported 2.22 × 10³ m3 of VW and received USD 334.65 thousand VA when it should have actually exported USD 1.87 million VA. In quadrant IV, there is a significant deviation between the USA, Argentina, and Australia and the absolute equality line; these countries exported VW and should have received benefits, but instead, they paid high VA. The USA exported 3.95 × 10³ m3 of VW and USD 7.35 million VA when it should have actually received USD 3.31 million USD VA; Argentina exported 3.08 × 10³ m3 of VW and USD 2.61 million USD VA while it should have received USD 2.59 million VA; and Australia exported 1.79 × 10³ m3 of VW and should have received USD 1.50 million VA while actually exported USD 903.78 thousand VA.
3.4.2. Discussion of the Virtual Water Inequality Index
The Virtual Water Inequality Index for the 19 country combinations was obtained according to Equation (27), as shown in Figure 5. The value at the intersection point of the same country is 0, and its meaning is different from the meaning of different country combinations. For example, 0 at the intersection of Argentina and Argentina is meaningless, while 0 at the intersection of Australia and the USA indicates that the VWI between Australia and the USA is 0, indicating significant trade inequality between the two countries. Figure 6 and Figure 7 show the NVW and NVA between the 19 countries, respectively. There are three specific scenarios, as follows:
- (1)
- From Figure 5, it can be seen that the VWI between Australia and Brazil, the UK and Canada, and other country combinations is the largest, at 0.99, followed by that between Turkey and South Africa (0.96), that of Indonesia and South Africa (0.91), and that of South Africa and Australia (0.90). These VWIs are close to 1, indicating a more balanced NVW and NVA between them. Specifically, combining Figure 6 and Figure 7, Australia imported 58.20 m3 of VW from Brazil and paid USD 3.47 thousand VA, the UK exported 3.28 m3 of VW to Canada and received USD 2.78 thousand VA, and Turkey exported 33.13 m3 of VW to South Africa and received USD 2.89 thousand VA. These country combinations with a VWI close to 1, where a country receives an economic benefit that equals the amount of VW (if it exports VW) and pays an economic cost that equals the amount of VW (if it imports VW), play the role of “co-beneficiaries” of both VW and VA in the global value chain.
- (2)
- The VWI in the thirteen country combinations of Brazil and Argentina, Italy and Argentina, Indonesia and Australia, Turkey and Brazil, Russia and India, Mexico and Italy, Germany and Japan, Saudi Arabia and Japan, Mexico and South Korea, Saudi Arabia and South Korea, Germany and Russia, France and the UK, and South Korea and the USA is 0, indicating that their NVW and NVA show an absolutely unequal status. This may be the result of importing VW without paying the corresponding costs, as seen for Brazil, which imported 15.38 × 10³ m3 of VW from Argentina, meaning that it should have paid USD 129.30 million VA, but it instead received USD 114.30 thousand VA, and Italy, which imported 2081.97 m3 of VW from Argentina, and should have paid the corresponding VA, yet received USD 18.41 thousand VA. It is also possible that VW was exported without a corresponding VA gain, as in the case of Germany, which exported 24.23 m3 of VW to Japan and not only did not gain VA but also paid USD 1340.60 thousand VA.
- (3)
- In most cases, there are two reasons for why a VWI is between 0 and 1 but far from 1 or 0: firstly, the country exports VW and obtains economic benefits, but the benefits do not reach the expected value or exceed the expected value by a lot, and secondly, the country imports VW and pays an economic cost but does not pay the expected value or pays too much. For example, the VWI between Germany and Brazil is 0.37—Germany imported 5000.32 m3 of VW from Brazil and paid USD 894.49 VA, which is much less than the estimated VA of USD 420.00 thousand. Another example is that the VWI between Indonesia and Brazil is 0.39—Indonesia exported 8.72 m3 of VW to Brazil and gained USD 110.20 thousand VA, which was USD 12.87 thousand VA more than the estimated VA of 7.33 thousand USD VA.
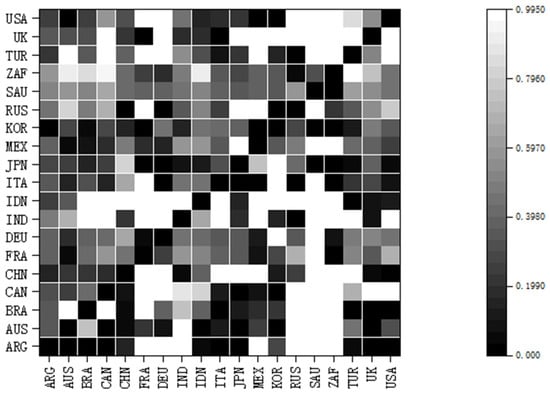 Figure 5. VWI between 19 countries.Figure 5. VWI between 19 countries.
 Figure 6. NVW flows between 19 countries.Figure 6. NVW flows between 19 countries.
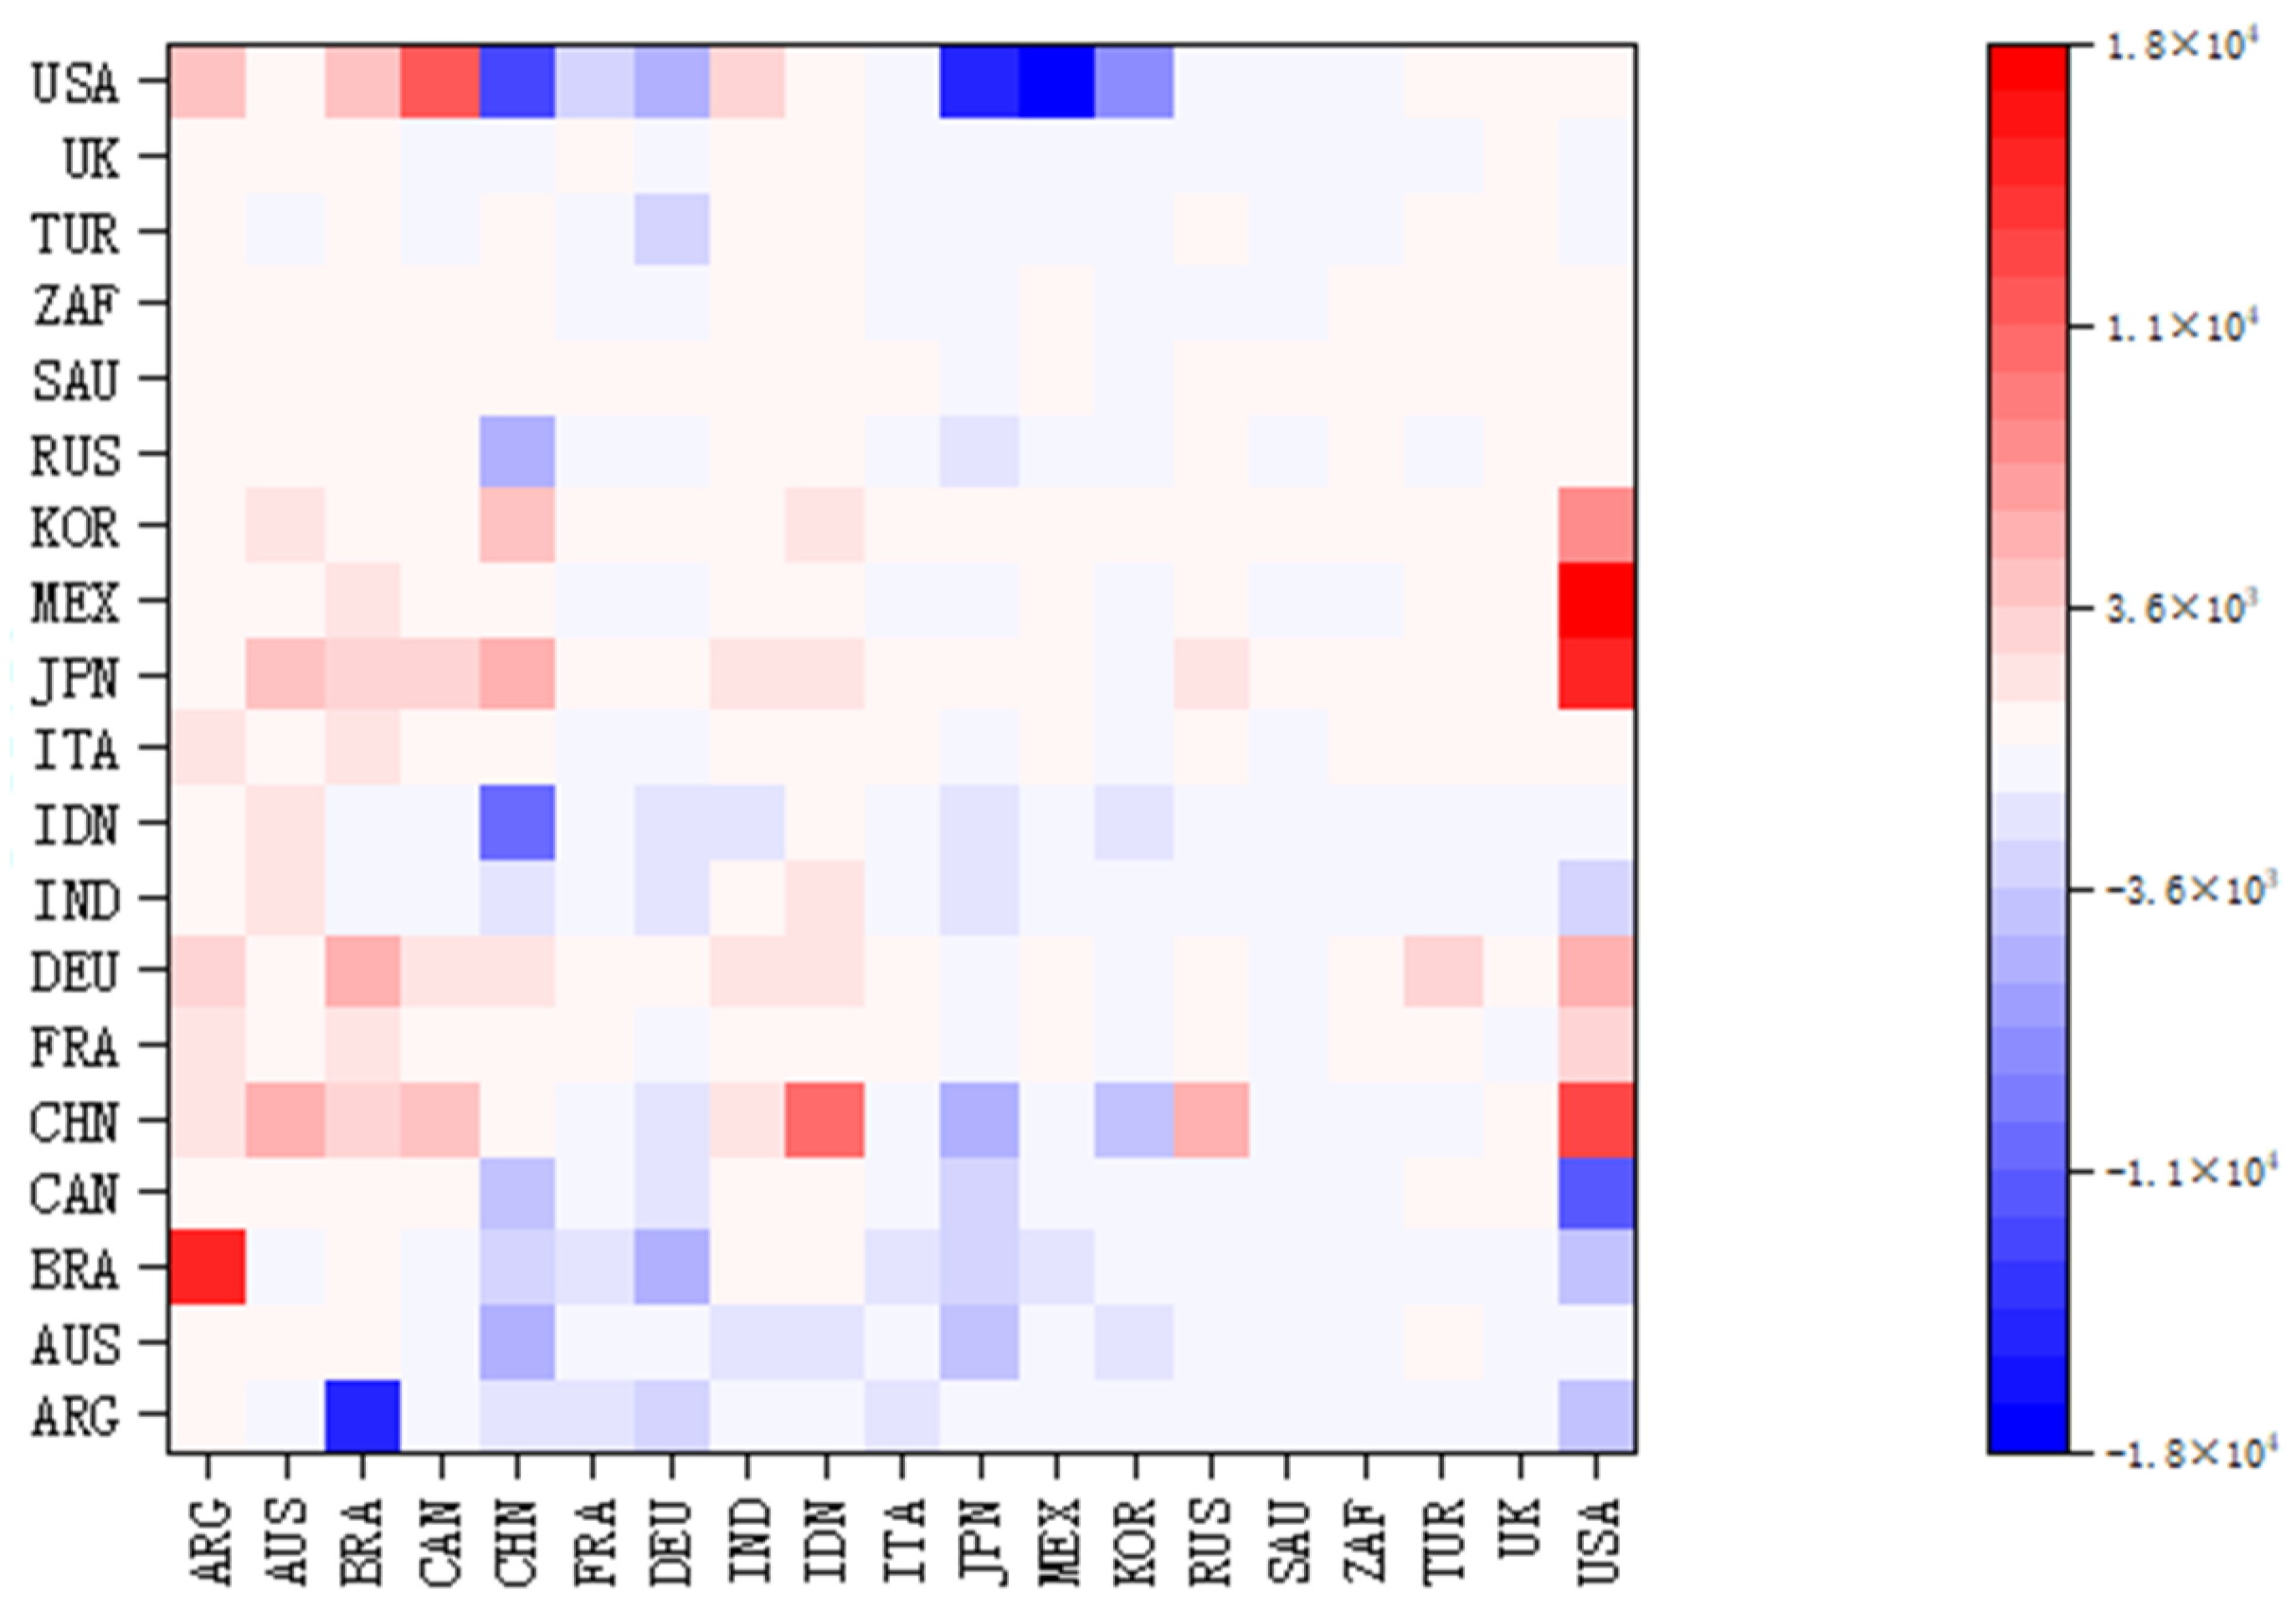
 Figure 7. NVA transfer between 19 countries.Figure 7. NVA transfer between 19 countries.
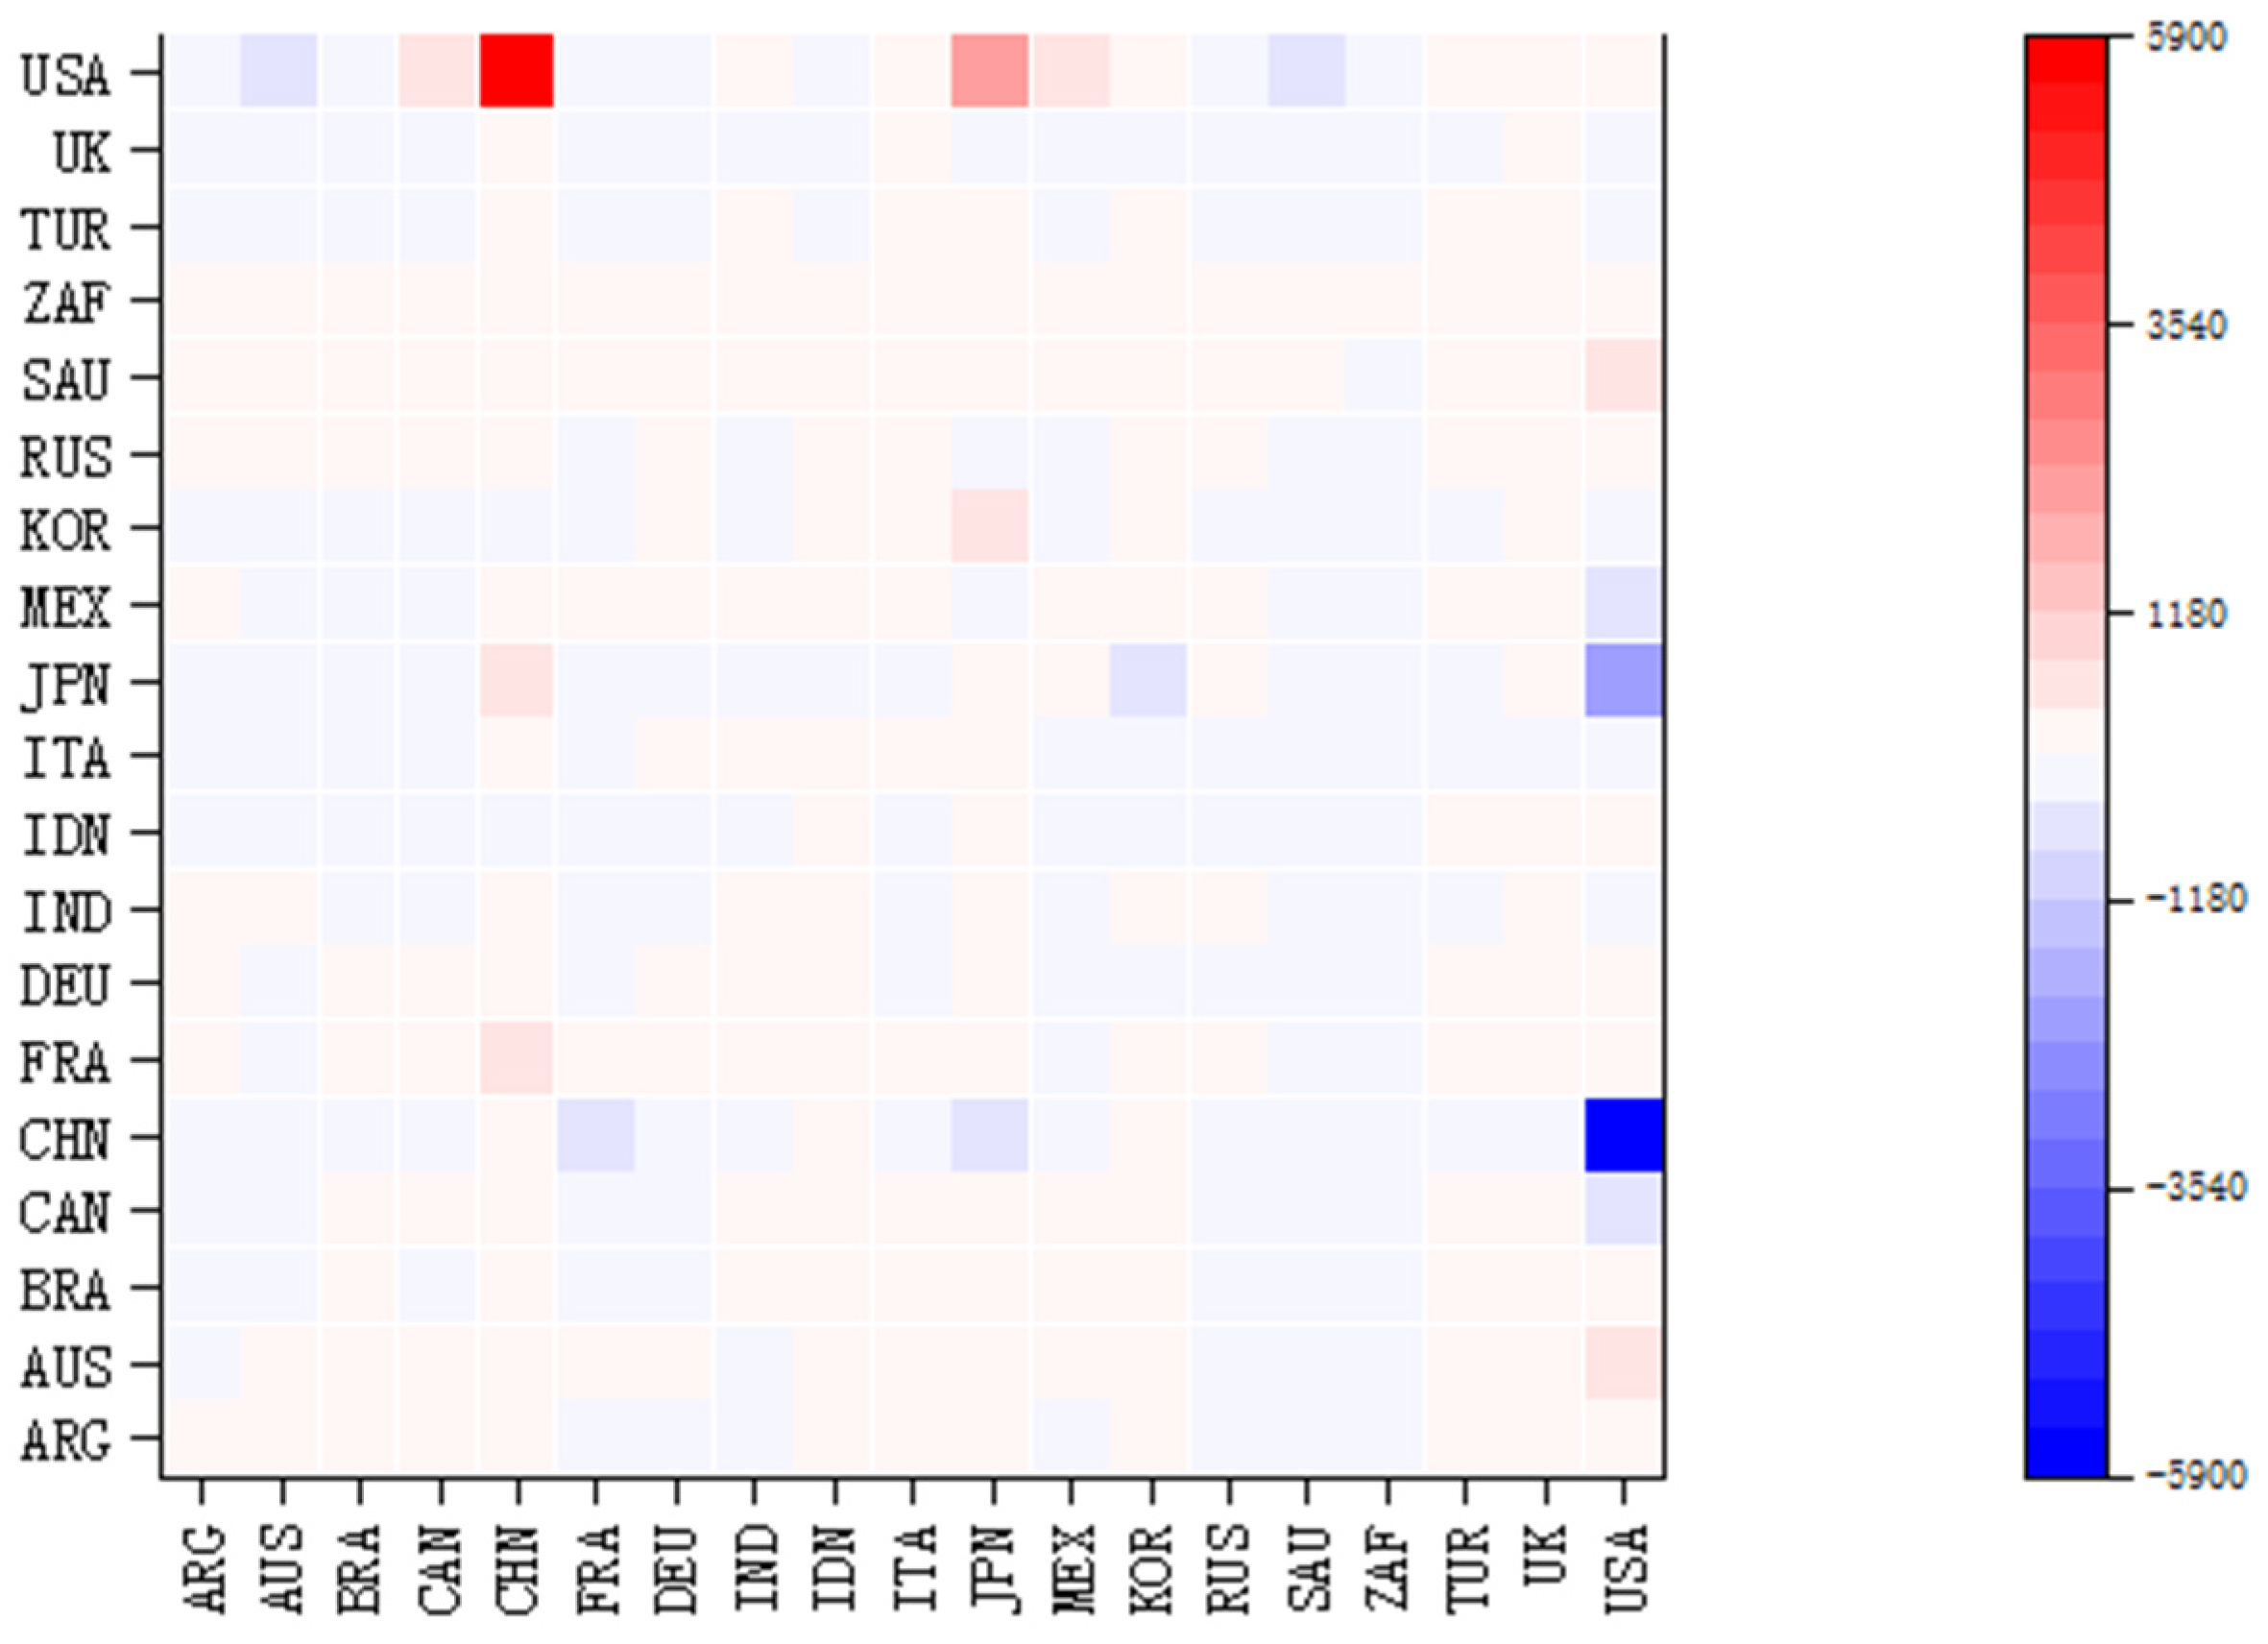
4. Conclusions and Suggestions
4.1. Conclusions
This study is based on the value-added accounting method, which uses raw water resource use data and the world input–output table from the EORA database. The research object is divided into 19 countries and the ROW according to the volume of virtual water, the added value and virtual water volume for different value chains of each industry in each country in 2016 is systematically analyzed, the virtual water import and export volumes and inter-country flow pattern under value-added trade are measured, and the Virtual Water Inequality Index between countries is calculated. The main results and conclusion are presented below:
- (1)
- In 2016, after the decomposition of the nine trade value chains at national and departmental levels, the proportion of routes shows the same pattern: there is greater trade in value-added exports and relatively less virtual water trade on the domestic trade routes. The routes with the highest proportion of value chain decomposition in developed countries are routes 8 and 2, with the smallest proportion seen on route 5. The route with the highest proportion of value chain decomposition in developing countries is mainly route 2, while the proportion of virtual water is also the lowest on route 5. Meanwhile, other countries have a larger share of the domestic trade routes compared to the 19 countries studied. At the sectoral level, sectors have the largest share of virtual water decomposition on route 2 and the smallest share on route 4, with most sectors having a large share of intermediate goods that are imported directly, a small share that is used by importers to produce final goods that are ultimately imported by the home country, and a large share of domestic trade in private households, other sectors, and re-exports and -imports.
- (2)
- In 2016, the countries with the largest volume of net exports of virtual water were, in descending order, the USA, China, Brazil, India and Indonesia (mainly economically developed countries with large populations). According to the virtual water roles undertaken by each country, Germany is an importer of virtual water, and there are more virtual water importers included in the ROW, while the remaining 18 countries are exporters of virtual water. Excluding ROW-related data, China, France, Italy, Japan, Mexico, South Korea, South Africa, and Saudi Arabia changed from “virtual water net exporters” to “virtual water net importers”. In addition, the largest virtual water net exporters became the USA, Argentina, Canada, Australia and India; the main export destinations were the USA, China, Japan, Germany and other more developed countries; and the main export destinations of all countries included China, indicating that China should quickly adjust its structure of virtual water imports and exports to develop its virtual water trade quickly.
- (3)
- Trade in intermediate products dominates inter-country implied virtual water trade. For the 19 countries studied, the net flow of implied virtual water caused by intermediate products is larger than that caused by final products, and the country with largest net flow of implied virtual water caused by intermediate products is the USA, followed by China and Brazil. The proportion of net flow of implied virtual water caused by intermediate products ranges from 80% to 90%, with the largest proportions accounted for by Canada and the UK. Therefore, regulating the balanced allocation and utilization of virtual water resources in the trade of intermediate products is essential.
- (4)
- Virtual water trade between most countries is relatively equal, and individual virtual water inequalities mainly occur between Brazil and Argentina, Italy and Argentina, Indonesia and Australia, Turkey and Brazil, Russia and India, Mexico and Italy, Germany and Japan, Saudi Arabia and Japan, Mexico and South Korea, Saudi Arabia and South Korea, Germany and Russia, France and the UK, and South Korea and the USA, revealing that the virtual water and added value of relatively economically developed regions benefit more from virtual water trade, while economically less developed regions may be at a disadvantage when trading virtual water with economically developed regions. Therefore, countries at a disadvantage in the virtual water trade need to strengthen their transformation of export industries, improve the effectiveness of water utilization in their industries, and reduce the logistical costs of trading their industrial and agricultural products in order to further minimize or reverse the disadvantages of the consumption of virtual water and other resources in trade exports.
4.2. Suggestions
According to the above measurement and analysis results, the following suggestions are put forward: (1) As the scale of value-added export trade is growing in every country, enhancing the management and efficient use of virtual water in the value-added export trade route is essential to reduce the waste of virtual water during export to foreign countries. Meanwhile, it is also imperative to optimize the domestic trade route and strengthen the efficient utilization of virtual water on this route in order to maximize resource utilization. (2) Developed countries should help exporters of virtual water to improve the efficiency of their water utilization through technical assistance and cooperation. China, France, Italy, Japan, and other countries need to be aware of the changes in the role of virtual water, quickly adjust their structure of virtual water imports and exports, and increase the volume of their virtual water exports to economically developed countries. For countries with a unsuitable geographical location, it is necessary to accelerate the optimization of their logistical and transportation network and reduce their energy consumption and trade transportation costs in order to cope with changes in the supply and demand of virtual water under the new environmental conditions and to achieve rapid growth in the virtual water trade. (3) Importance should be systematically attached to the indirect virtual water flow of commodities, especially at the present stage when the trade of intermediate products is the dominant virtual water trade structure, and we need to be highly vigilant about the utilization of virtual water when trading intermediate products. (4) Countries that have a disadvantage in the virtual water trade need to improve their industrial transformation, improve their industrial water use efficiency, promote the rapid advancement of high-value-added and low-water-consumption industries, reduce their dependence on traditional high-water-consumption industries, and enhance their competitiveness in the international market. It is also necessary to enhance international cooperation and synergy and set up a virtual water trade balance mechanism through bilateral or multilateral cooperation to help disadvantaged countries improve their utilization of virtual water resources.
Author Contributions
Methodology, G.D.; Data curation, K.D.; Writing—original draft, G.D. and K.D.; Writing—review & editing, G.D. and K.D.; Funding acquisition, G.D. All authors have read and agreed to the published version of the manuscript.
Funding
This work was supported by the Natural Science Foundation of China under grant number 72363021 and 12101279; the Outstanding Youth Fund of Gansu Province [number 20JR5RA206]; the Longyuan Youth Talent Project [2022]; the Double First-class Scientific Research Key Project of the Gansu Provincial Department of Education [GSSYLXM-06]; and the key scientific research project of the Silk Road Economic Research Institute of the Lanzhou University of Finance and Economics [JYYZ202102].
Data Availability Statement
Data is contained within the article.
Conflicts of Interest
The authors declare no conflicts of interest. The authors confirm that this article has not been published in any other journal and that no plagiarism has occurred.
References
- Afkhami, M.; Bassetti, T.; Ghoddusi, H.; Pavesi, F. Virtual water and the inequality in water content of consumption. Environ. Dev. Econ. 2022, 27, 470–490. [Google Scholar] [CrossRef]
- Allan, J.A. Fortunately there are substitutes for water otherwise our hydropo-litical futures would be impossible. Priorit. Water Resour. Alloc. Manag. 1993, 13, 26. [Google Scholar]
- Shen, S.; Jiang, Y.; Chen, C. Inversed virtual water flow pattern and its influencing factors in Northwest China. Ecol. Ind. 2024, 158, 111340. [Google Scholar] [CrossRef]
- Du, Y.; Zhao, D.; Qiu, S.; Zhou, F.; Peng, J. How can virtual water trade reshape water stress pattern? A global evaluation based on the metacoupling perspective. Ecol. Ind. 2022, 145, 109712. [Google Scholar] [CrossRef]
- Yang, Y.; Tian, G.; Li, J.; Sun, Z. Evolution of spatiotemporal pattern of virtual water in the Yangtze River economic belt. Ecol. Ind. 2024, 161, 111967. [Google Scholar] [CrossRef]
- Zhang, F.; Jin, G.; Liu, G. Evaluation of virtual water trade in the Yellow River Delta, China. Sci. Total Environ. 2021, 784, 147285. [Google Scholar] [CrossRef]
- Chen, Y.; Wang, Y.; Ding, T.; Wang, K.; Wu, H. Water footprint and virtual water trade analysis in water-rich basins: Case of the Chaohu Lake Basin in China. Sci. Total Environ. 2022, 843, 156906. [Google Scholar] [CrossRef]
- Cazcarro, I.; Schyns, J.F.; Arto, I.; Sanz, M.J. Nations’ water footprints and virtual water trade of wood products. Adv. Water Resour. 2022, 164, 104188. [Google Scholar] [CrossRef]
- Wang, L.; Fan, Y.V.; Jiang, P.; Varbanov, P.S.; Klemeš, J.J. Virtual water and CO2 emission footprints embodied in power trade: EU-27. Energy Policy 2021, 155, 112348. [Google Scholar] [CrossRef]
- Wei, J.; Lei, Y.; Liu, L.; Yao, H. Water scarcity risk through trade of the Yellow River Basin in China. Ecol. Econ. 2023, 154, 110893. [Google Scholar] [CrossRef]
- Li, B.; Zhou, M.; Bai, Y. The relationships and trends of interregional virtual water trade based on an MRIO model. Water Supply 2021, 22, 2395–2406. [Google Scholar] [CrossRef]
- Deng, G.; Lu, F.; Wu, L.; Xu, C. Social network analysis of virtual water trade among major countries in the world. Sci. Total Environ. 2021, 753, 142043. [Google Scholar] [CrossRef] [PubMed]
- Deng, G.; Ma, Y.; Li, X. Regional water footprint evaluation and trend analysis of China—Based on interregional input–output model. J. Clean. Prod. 2016, 112, 4674–4682. [Google Scholar] [CrossRef]
- Chen, W.; Wu, S.; Lei, Y.; Li, S. China’s water footprint by province, and inter-provincial transfer of virtual water. Ecol. Econ. 2017, 74, 321–333. [Google Scholar] [CrossRef]
- Zhang, K.; Lu, H.; Tian, P.; Guan, Y.; Kang, Y.; He, L.; Fan, X. Analysis of the relationship between water and energy in China based on a multi-regional input-output method. J. Environ. Manag. 2022, 309, 114680. [Google Scholar] [CrossRef] [PubMed]
- Koopman, R.; Wang, Z.; Wei, S.J. Tracing value-added and double counting in gross exports. Am. Econ. Rev. 2014, 104, 459–494. [Google Scholar] [CrossRef]
- Dai, F.; Yang, J.; Guo, H.; Sun, H. Tracing CO2 emissions in China-US trade: A global value chain perspective. Sci. Total Environ. 2021, 775, 145701. [Google Scholar] [CrossRef]
- Meng, B.; Peters, G.P.; Wang, Z.; Li, M. Tracing CO2 emissions in global value chains. Energy Econ. 2018, 73, 24–42. [Google Scholar] [CrossRef]
- Wang, A.; Liu, Y.; Meng, B.; Lv, H. Tracing the CO2 emissions embodied in Chinese mainland’s exports with multinational enterprises: From source to sink. J. Clean. Prod. 2023, 414, 137430. [Google Scholar] [CrossRef]
- Zhu, K.; Guo, X.; Zhang, Z. Reevaluation of the carbon emissions embodied in global value chains based on an inter-country input-output model with multinational enterprises. Appl. Energy 2022, 307, 118220. [Google Scholar] [CrossRef]
- Deng, G.; Chen, H. Measurement of China’s interregional implied energy trade and analysis of its influencing factors under the perspective of value added trade. Resour. Sci. 2022, 44, 1036–1050. [Google Scholar]
- Li, M.; Gao, Y.; Meng, B.; Meng, J. Tracing embodied energy use through global value chains: Channel decomposition and analysis of influential factors. Ecol. Econ. 2023, 208, 107766. [Google Scholar] [CrossRef]
- Xu, X.; Wang, Q.; Ran, C.; Mu, M.J. Is burden responsibility more effective? A value-added method for tracing worldwide carbon emissions. Ecol. Econ. 2021, 181, 106889. [Google Scholar] [CrossRef]
- Wang, Z.; Wei, S.; Zhu, K. Gross trade accounting method: Officialtrade statistics and measurement of the global value chain. Soc. Sci. China 2015, 09, 109–128. [Google Scholar] [CrossRef]
- Wei, Z.; Huang, K.; Yu, Y.; Wang, Z. Tracing China’s virtual water trade in global value chain: Participation, characteristics, and inequality. J. Clean. Prod. 2024, 448, 141663. [Google Scholar] [CrossRef]
- Xia, Q.; Wu, X.; Luo, J. Implied energy in China’s trade of intermediate and final goods. J. Environ. Econ. 2020, 5, 133–151. [Google Scholar]


Disclaimer/Publisher’s Note: The statements, opinions and data contained in all publications are solely those of the individual author(s) and contributor(s) and not of MDPI and/or the editor(s). MDPI and/or the editor(s) disclaim responsibility for any injury to people or property resulting from any ideas, methods, instructions or products referred to in the content. |
© 2024 by the authors. Licensee MDPI, Basel, Switzerland. This article is an open access article distributed under the terms and conditions of the Creative Commons Attribution (CC BY) license (https://creativecommons.org/licenses/by/4.0/).