Abstract
Currently, water pollution caused by dyes is a serious problem since they are toxic and carcinogenic to living beings. To reduce the presence of these contaminants, natural adsorbents have been considered as they are easy to obtain, inexpensive, and have high removal efficiency. In this work, the adsorption process using natural brushite (nDCPD) was studied for the removal of phenol red (PR), achieving a removal rate of 99.15% and an adsorption capacity of 82.24 mg/g, and gentian violet (GV), achieving a removal rate of 97.03% and an adsorption capacity of 74.22 mg/g. Equilibrium adsorption occurs for both dyes in multiple layers on the surface. The adsorption process is spontaneous for both dyes. The kinetics of the adsorption process involve using a single active site on the surface for PR adsorption, while for GV, two active sites on the surface are required. Analysis via FTIR, EDS, and XRD revealed various mechanisms that intervene in the adsorption process of both dyes on the surface of nDCPD, such as electrostatic forces, functional groups, physisorption, and ion exchange.
1. Introduction
Due to the rapid growth of anthropogenic activities, water pollution has accelerated to worrying levels in recent years [1,2,3]. Discharges of pollutants from industries such as the paint, plastic, paper, rubber, leather, dyeing, pharmaceutical, medicine, chemical, and textile industries cause a decrease in water quality because the effluents contain heavy metals and dyes [4,5,6]. These substances can cause serious health problems, as well as severe environmental damage, causing bioaccumulation in living beings [7,8,9]. A significant portion of pollutants generated are dyes, with an estimated 20% of the world’s dye production being discharged into drainage systems, rivers, and lakes [10,11,12,13]. Pollution from these effluents can be highly visible, even at low concentrations [14,15,16,17]. The presence of these dyes in the water not only destroys the water’s aesthetic quality but also prevents the penetration of sunlight, affecting the existing food web in aquatic ecosystems [18,19,20]. Different types of dyes are used in various industries, including acid dyes, reactive dyes, basic dyes, azo dyes, direct dyes, and disperse dyes, most of which contain traces of metals and are soluble in water [21,22,23]. Dyes are broadly classified into cationic, anionic, and non-ionic categories. Anionic dyes have a net negative charge, which includes acidic, reactive, azo, and direct dyes, while cationic dyes have a positive charge and are basic [12,20,24]. Among the dyes present in these effluents are phenol red (PR) and gentian violet (GV) (Figure 1), which are anionic and cationic dyes, respectively. These dyes can cause several diseases upon ingestion or skin adsorption, such as severe damage to the gastrointestinal tract, carcinogenicity, permanent blindness, and respiratory and kidney failure [25,26,27].
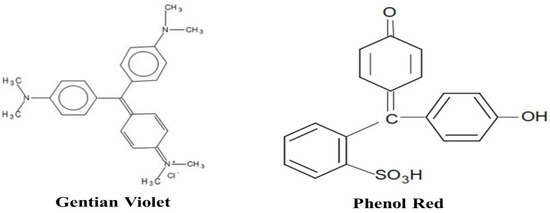
Figure 1.
Chemical structure of gentian violet (GV) and phenol red (PR) [28,29].
To preserve the environment, various separation methods have been developed and employed, including solvent extraction, ion exchange, coagulation–flocculation, filtration, and dialysis, among others, to remove these heavy metals in different concentration ranges [28,29,30,31,32,33]. Despite their high removal efficiency, these methods present significant challenges, such as high sludge generation, high energy consumption, and elevated operating and maintenance costs [34,35,36,37]. Adsorption emerges as a promising method for dye removal due to its key advantages: low cost, simple implementation, non-toxicity, low maintenance costs, minimal or no production of polluting sludge, and high efficiency in contaminant removal compared to other separation methods [37,38,39,40]. However, the use of commercial adsorbents like activated carbon and zeolites makes this method less feasible [39,40,41,42]. Therefore, other types of adsorbents with similar dye adsorption capacity, obtained from renewable sources with high availability and low cost, have been investigated [33,34,37]. Waste derived from the agricultural industry and non-commercial industrial processes generate large quantities of waste that are typically discarded without further use, posing an environmental issue since they are mainly disposed of on the ground [22,43].
Among these wastes is bovine bone, from which apatites are obtained. These are minerals formed from phosphate and calcium, including hydroxyapatite (HA) and brushite (nDCPD), which are abundant in nature and are capable of forming solid solutions, accepting anions and cations as substitutes, and thereby allowing for the retention and elimination of contaminants [44,45,46]. Brushite, a bioadsorbent, has been used to remove certain heavy metals and dyes, showing a performance comparable to other adsorbents [45,46,47]. Considering that nDCPD may have potential as an adsorbent of dyes present in effluents, it is necessary to analyze how it interacts with PR and GV during the removal process, describing the interaction mechanisms between the surface and the dye. For this purpose, a study was conducted on various parameters in the adsorption process, such as contact time, adsorbent mass, initial dye concentration, and temperature, to evaluate the behavior of nDCPD using equilibrium, kinetic, and thermodynamic studies, taking into account the characterization of the material before and after dye removal to understand the adsorption mechanism.
2. Materials and Methods
2.1. Reagents
The dyes used in this project are phenol red (PR; λmax = 435 nm) and gentian violet (GV; λmax = 590 nm) from Química Meyer® (Mexico City, Mexico). Deionized water was used for all experimental solutions [48,49].
2.2. Development of the Bioadsorbent
The nDCPD used in this project was obtained from bovine bone, which was washed with previously heated water and subsequently dried in a convection oven (Shel Lab CE-5F, Cornelius, OR, USA) at 80 °C for 24 h. It was then crushed and sieved to a particle size of 0.045 mm to obtain a powder. This power was treated with a 0.1 M HCl solution (Química Meyer®, Mexico City, Mexico) then washed and added to a 0.1 M NaOH solution [45,47].
2.3. Obtaining the PR and GV Adsorption Isotherms
For the adsorption isotherm experiments of each dye, 1 g of nDCPD was added to 50 mL of the dye solution at different concentrations. The solutions were placed in a shaking incubator (ZHWY-200D, Shanghai, China) at 200 rpm and maintained at temperatures of 25 °C, 35 °C, and 45 °C for a period of 24 h. The concentration of the PR and GV dyes was measured using a UV–visible spectrophotometer (Velab VE-5000, Mexico City, Mexico) to determine the amount of dye removed by the nDCPD adsorbent [47,48].
where C0 and Ce are the initial and final concentration in mg/L, V is the volume of solution in L, and m is the mass of the adsorbent in g. To determine the removal percentage, the following equation was used [46,47]:
The different isotherm models used to fit the experimental data obtained can be seen in the Table 1 [33,40,45,46].

Table 1.
Non-linear adsorption isotherm models [33,40,45,49].
To compare the efficiency of different equilibrium models, the determination coefficient (R2) and the standardized deviation were used as criteria [48]:
where N is the number of data, and qexp (mg/g) and qcal (mg/g) denote the experimental and calculated data using the models of the removed dyes. The separation factor, RL, was used to predict the affinity between the absorbed and absorbent, using the following equation [48,49,50]:
where 0 < RL< 1 for favorable, RL > 1 for unfavorable, RL = 1 for linear, and RL = 0 for irreversible adsorption process [48,49,50]. To determine the type of adsorption process, the free energy of adsorption, E (kJ/mol), was calculated using the following equation [20,48,49,50]:
2.4. Thermodynamic Analysis
To understand the nature of the adsorption process, the thermodynamic parameters—∆G (kJ/mol), ∆H (kJ/mol), and ∆S (kJ/mol K)—were determined, allowing for an understanding of the process and mechanism of adhesion of metal ions [45,51]:
where KL (L/mol) is the Langmuir constant, R (kJ/mol K) is the gas constant, and T (K) is the process temperature. Using the van’t Hoff equation, the other parameters can be determined using the following equation (Equation (7)):
2.5. Dye Removal Kinetics
For the removal kinetics of dyes, the mass of the adsorbent varied from 0 to 1 g in 50 mL of solution and was stirred for 9 h at a speed of 200 rpm at different temperatures (25, 35, and 45 °C). An aliquot of the aqueous solution was taken and subjected to centrifugation (Thomas ICZC8, Madrid, España) at 6000 rpm for 10 min. The concentration of each dye was measured using a spectrophotometer (Velab VE-5000, Mexico City, Mexico). To analyze the experimental data, the adsorption kinetic models were fitted as shown in the Table 2.
Table 2.
Adsorption kinetic models used in the analysis of the experimental data [45,48,50].
2.6. Brushite Characterization
Attenuated total reflectance Fourier-transform infrared spectroscopy (ATR-FTIR) was used to analyze the biosorbent before and after adsorption. The infrared spectrum was analyzed in a wavenumber range of 4000–400 cm−1 using a Thermo Scientific Nicolet iS10 analyzer (Waltham, MA, USA). A total of 32 scans were obtained with a resolution of 4 cm−1. In addition, X-ray diffraction (XRD) patterns were obtained using a diffractometer (Ultima IV Rigaku, Cedar Park, TX, USA), measuring from 4° to 80° in 2θ with a step size of 0.03°. The isoelectric point was determined using the mass titration method: a sample of the adsorbent in water with an initial mass of 0.05 g was stirred at 200 rpm for 24 h in 50 mL of water to determine its pH with a potentiometer (Science Med SM-25CW, Helsinki, Finland). An additional 0.05 g was added every 24 h until the pH remained unchanged [45]. Scanning electron microscopy (SEM) images and energy-dispersive X-ray spectroscopy (EDS-EDX) values were obtained using a JOEL spectrometer (6510 pus, Peabody, MA, USA).
3. Results and Discussion
3.1. Effect of Initial PR and GV Concentration on the Equilibrium Adsorption Process
In adsorption, parameters important for the elimination of dyes present in water must be considered to understand their influence on the overall process [48,52,53]. The removal of PR and GV at different concentrations and temperatures is shown in Figure 2. It can be observed that the adsorption process has a direct relationship with temperature. As the temperature increases, the removal percentage increases from 78.4%, 90.6%, and 95.5% at 25 °C, 35 °C, and 45 °C, respectively, for GV adsorption. In contrast, for PR, the removal decreases from 92%, 75.8%, and 69.6% as the temperature increases from 25 °C, 35 °C, and 45 °C, respectively. This implies that the adsorption capacity of GV in nDCPD increases by approximately 18% with the increasing temperature, while for PR, the adsorption capacity decreases by about 24% with the increasing temperature. This behavior in the adsorption process can be directly linked to the pretreatment performed, which can cause a change in the available sites on the surface of the bioadsorbent where both dyes are captured. This change can explain the reduced adsorption of PR compared to the adsorption capacity for GV [34,54]. Studies have shown an increase in the adsorption capacity of PR with an increase in the dye concentration when using onion peel [39], E. crassipe [48], and shrimp waste [54]. Similarly, for GV, the same behavior is obtained when using SCB-CaCO3 [31], charred lime peel [8], E. crassipe [22,48], date palm biochar [19], rice husk [40], fish scales [9], active charcoal [28], pineapple and lime leaves [23], and Planta stachys [10].
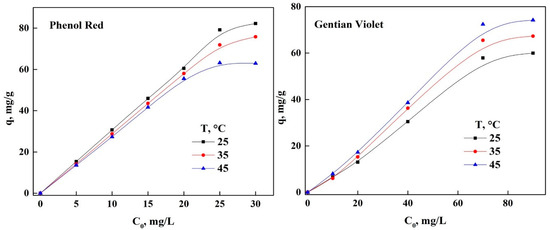
Figure 2.
Effect of initial concentration of phenol red (anionic dye) and gentian violet (cationic dye) in adsorption capacity.
This increase in the adsorption capacity may be due to the rise in collisions between dye molecules, which facilitates the adsorption process and results in a significant decrease in mass transfer between phases. Additionally, this has an effect on the removal percentage, which decreases directly with the increase in the initial concentration of both dyes [52,53,54,55]. This parameter is very important in the dye removal process, considering the other parameters, due to its relationship with mass transfer.
3.2. Adsorption of GV and PR in Equilibrium
The data obtained for the equilibrium adsorption curves at different temperatures for both dyes are shown in Figure 3 and Figure 4. It can be observed that the maximum adsorption capacity of PR at the different temperatures is 82.25 mg/g, 75.82 mg/g, and 69.63 mg/g at 25 °C, 35 °C, and 45 °C, respectively. This indicates that increasing the temperature results in a decrease in the adsorption capacity of 7.82% and 15.35% compared to the maximum adsorption of PR. In the case of GV adsorption, an opposite effect is observed with increasing temperature, showing an increase in the adsorption capacity of 59.99 mg/g, 67.32 mg/g, and 82.47 mg/g at 25 °C, 35 °C, and 45 °C, respectively. This represents an increase in the adsorption capacity of 12.22% and 27.25% relative to the maximum adsorption capacity obtained. These results indicate that the adsorption process on the surface of nDCPD differs based on the nature of each dye, as GV is a cationic dye with a pHsol = 3.5, while PR is an anionic dye with a pHsol of 8.35. This implies that the adsorption mechanism of the dyes onto the surface of nDCPD depends on electrostatic forces, given that the isoelectric point of the absorbent surface is at pHpzc = 6.3, so the surface of the adsorbent is negatively charged when pHsol > pHpzc or positively charged when pHsol < pHpzc [24,52,54,55].
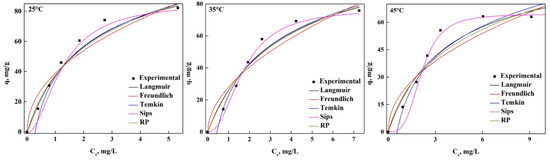
Figure 3.
Fitting of adsorption isotherm models for the removal of PR.
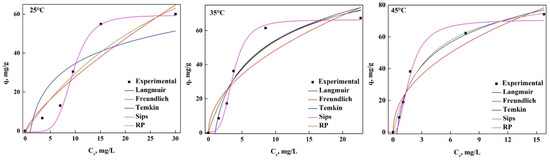
Figure 4.
Fitting of adsorption isotherm models for the removal of GV.
Table 3 presents the parameters obtained from each of the adjustments made to the experimental data of the proposed models, considering the normalized standard deviation (Δq%) and the determination coefficient (R2) to select the best fit. Based on these criteria, the adsorption of both dyes is attributed to the heterogeneous surface present (Sips), where the process occurs physically (ns > 1). This is confirmed by the Freundlich model, which indicates a value of n > 1, revealing that the process takes place on the surface of nDCPD [27,38,40]. The Langmuir model suggests favorable adsorption (0 < RL< 1) [32,37,54,55]. Additionally, the adsorption energy determined using the DR model (E < 8 kJ/mol) for both dyes confirms a physical adsorption process on a heterogeneous surface [16,29,41,49]. However, for PR, the energy increases with the increasing temperature, while for GV adsorption, this energy decreases with the rising temperature, indicating a difference in the nature of the adsorption process involving more than one dye removal mechanism [28,38,54,55].
Table 3.
Parameters of the adjustments of the different isotherm models for the dyes.
Considering the results reported in the literature, the Langmuir model provides the best fit for PR adsorption in onion peel (q = 71.64 mg/g) [39], graphene oxide (q = 657.89 mg/g) [21], and bentonite (q = 169.4 mg/g) [3]. For coconut shell removal (q = 10.5 mg/g) [2] and biochar (q = 29 mg/g) [26], the Freundlich model is assumed to be the best fit. In the case of GV, the Langmuir model fits best for graphene (q = 85 mg/g) [18], date palm (q = 226 mg/g) [19], rice husk (q = 90 mg/g) [36], active charcoal (q = 90.91 mg/g) [27], pineapple leaves (q = 9.77 mg/g) [23], and poplar seeds (q = 153.8 mg/g) [11]. The Freundlich model best represents adsorption with coffee husks (q = 5 mg/g) [25], chitosan extracted (q = 7.57) Freundlich [5], E. crassipes (q = 25 mg/g) [22], fish scales (q = 90.61 mg/g) [9], and shrimp waste (q = 61.74 mg/g) [54]. The Temkin model fits best for carbonized lime peel (q = 740.7 mg/g) [8].
In our study, both tints fit better with the Sips model, which is a combination of the Langmuir and Freundlich models [45,49], which indicates that the behavior in the adsorption isotherm is sufficient to understand what occurs during the adsorption process. Furthermore, nDCPD appears to be a good candidate for the removal of these dyes from industrial effluents as our results fall within the range of adsorption capacities reported in the literature.
3.3. Thermodynamic Analysis of the Adsorption Process of Both Dyes in nDCPD
To understand the nature of the adsorption process of dyes with nDCPD, the thermodynamic parameters shown in Table 4 were analyzed. For both dyes, the process is spontaneous (ΔG < 0). This observation aligns with what was observed in Figure 3, where the adsorption capacity increases with temperature, supported by the positive enthalpy values (ΔH > 0) in the case of GV. Conversely, for PR adsorption, the opposite occurs: the adsorption capacity decreases with increasing temperature, supported by the negative enthalpy values (ΔH < 0) [45,52,55]. Apparently, the forces present on the surface of the adsorbent participate significantly in the process along with the interaction in the solid–liquid interface [16,21,38]. There is also a decrease in the randomness of the solid–liquid interface for PR (ΔS < 0). In the case of GV adsorption on nDCPD, the adsorption process increases due to the increase in the randomness of the solid–liquid interface (ΔS > 0) [45,52,55]. Given the values of ΔH begin less than 8 kJ/mol, it can be inferred that the adsorption process takes place on the surface of nDCPD [16,21,38].
Table 4.
Thermodynamic parameters for PR and GV adsorption on nDCPD.
3.4. Effect of Bioadsorbent Concentration on the Adsorption Process of Both Dyes in nDCPD
For the practical application and high efficiency of dye removal, it is necessary to know the contact time required to carry out the adsorption process, which is a key parameter in establishing the kinetic mechanism in heterogeneous systems. This is observed in equilibrium due to the accumulation or saturation of the sites available to adsorb the dyes on the surface of nDCPD [36,55,56]. In Figure 5 and Figure 6, the effect of the adsorbent concentration (Cads) on the adsorption of PR and GV was observed by performing the analysis using a concentration range of 4 to 20 mg/L with a PR at 30 ppm and 70 ppm for GV.
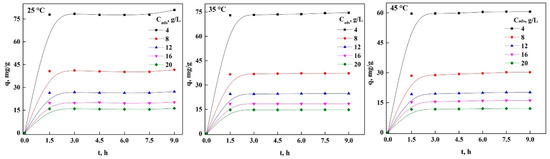
Figure 5.
Contact time in the PR adsorption process in nDCPD.
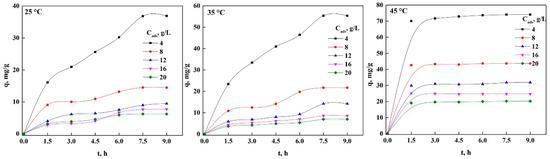
Figure 6.
Contact time in the GV adsorption process in nDCPD.
The figures show that by increasing the concentration of the adsorbent, the adsorption capacity of the dye decreases, regardless of the temperature. This may be due to the blocking of the active sites present on the surface. Additionally, there is a greater availability of the adsorption process area until equilibrium is reached, which was reached at approximately 2 h for all temperatures in the case of PR adsorption. For GV, the same equilibrium time is obtained at 25 °C and 35 °C, but at 45 °C, equilibrium is reached only after 7.5 h. This may be due to the fact that the sites on the surface of nDCPD no longer allow for the transfer of dyes from the solution to the solid [46,56,57]. This behavior has been reported for PR and GV in the literature for various adsorbents. This analysis allowed us to understand the limitations of mass transfer, so this parameter must be considered particularly important [27,43,49].
3.5. Adsorption Kinetics of PR and GV on nDCPD
To understand the dynamic adsorption process of the dyes with respect to time, the experimental data obtained were adapted to the kinetic models proposed above (Table 2), allowing us to understand the control mechanism for the removal of both dyes. To choose the most suitable model, the same criteria previously used in the adsorption isotherm models were used (R2 and ∆q%). Table 5 shows the parameters of PR adsorption on nDCPD, where it can be observed that the PSO model best represents the experimental data. This indicates that two active sites are needed to remove a dye molecule from the solution because the sites where adsorption takes place are widely available on the surface. There may be a dimensional growth of the sites due to the Avrami model, where nA > 1, indicating that these mechanisms of the adsorption process are due to the growth of the active sites in a one-dimensional and homogeneous manner [6,19,21,30]. The adsorption capacity at 25 °C, 35 °C, and 45 °C was 80.95 mg/g, 74.54 mg/g, and 60.6 mg/g, respectively, representing a decrease of 7.92% and 25% with increasing temperature, indicating that the operating condition with the higher adsorption capacity is at 25 °C.
Table 5.
Kinetic parameters of PR adsorption on nDCPD.
In the case of GV adsorption on nDCPD, the kinetic parameters are shown in Table 6, where it can be observed that the best fit is presented with the PFO model, which reveals that only one active site is needed for the adsorption of a GV molecule in solution. This may imply that a greater number of adsorption sites are available on the surface of nDCPD. It was also found that nA < 1 (Avrami model), which indicates that the dye adsorption mechanism tends to change throughout the process [8,9,10,55]. The adsorption capacity was 36.91 mg/g, 55.36 mg/g, and 74.08 mg/g at 25 °C, 35 °C, and 45 °C, respectively, which indicates that increasing the temperature from 25 °C to 45 °C increases the adsorption capacity from 33.33% to 50%, respectively. Although the ID and ED models are not the most suitable, they were taken into account to determine whether there are limitations due to mass transfer [28,43,53].
Table 6.
Kinetic parameters of GV adsorption on nDCPD.
For this bioadsorbent, the same adsorption mechanisms were found for dye removal with nDCPD. In the removal process, a surface site is required for each dye molecule, and there are no limitations due to internal factors or external mass transfer. With the model obtained in this work, this could be explained by the use of different pre-treatments and the nature of the dye, allowing for a greater interaction between the surface of the bioadsorbent and the solution because of the electrostatic forces created between the two; on the other hand, if the surface is negatively charged, this creates repulsion forces between the dye and the surface, as in our case, where the treatment was carried out on nDCPD [24,27,55,56].
It has been reported in the literature that the adsorption capacity of PR varies from 26.49 mg/g to 142.9 mg/g when using straw biocarbon, rice husk, graphene oxide, bentonite, onion husk, and E. crassipes [6,19,21,45]. In the case of GV adsorption, adsorbents such as lime peel, fish scales, Stachys plant, treated hydroxyapatite, palm tree, pineapple leaves, and shrimp waste have been used, resulting in an adsorption capacity ranging from 2.97 mg/g to 284.1 mg/g [8,13,19,22,54]. Moreover, the surface of nDCPD can be negatively or positively charged depending on the anionic and cationic nature of the dye, facilitating the removal process due to electrostatic attraction [45,46]. Additionally, based on the adjustments of the kinetic models, the removal of both dyes is not only influenced by these forces but also by other physical adsorption processes, ion exchange, or a combination of these [19,55]. This allows for an appreciable adsorption capacity of the dyes, making nDCPD a potential candidate for dye removal from solutions due to its high availability, versatility, cost-effectiveness, and easy access.
3.6. Mass Transfer Limitation Analysis
Within the adsorption process, it is important to study the limitations of mass transfer. A broader analysis was conducted on this phenomenon for the dye removal process. Figure 7 shows the case for PR, where three stages in the dye adsorption process can be observed. At the beginning of the PR removal, all the available sites on the nDCPD surface are free, allowing for instantaneous diffusion. After this stage, gradual adsorption of the dye occurs because the sites become saturated, which slows down the process until it reaches the equilibrium stage. At this point, there are limitations due to mass transfer in the adsorption process [27,45,53].
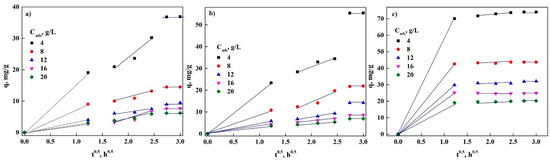
Figure 7.
Mass transfer analysis in PR adsorption: (a) 25 °C; (b) 35 °C; (c) 45 °C.
In performing the analysis of the influence of mass transfer in the GV adsorption process in nDCPD, Figure 8 shows that there are only two stages. The initial presence of the straight line suggests that the adsorption of the dye is accelerated in such a way that equilibrium is reached without the need to go through a slow adsorption, which indicates that mass transfer limitations are present in a large part of the GV removal process, which significantly influences the overall speed of the adsorption process [27,45,53].
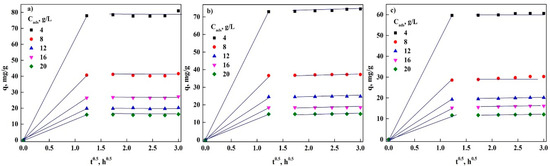
Figure 8.
Mass transfer analysis in GV adsorption: (a) 25 °C; (b) 35 °C; (c) 45 °C.
Table 7 shows the kinetic constants of external (kp1) and internal (kp2) diffusion; mainly, in the case of the GV adsorption process in nDCPD, it can be observed that there are no limitations due to internal diffusion because this step in the removal process is not present, from which it can be inferred that the limitations due to mass transfer are only due to external diffusion. For the adsorption of PR, having both kinetic constants of the mass transfer processes, the criterion kp1/kp2 > 1 is used, with which it was determined that the process that dominates the overall rate of mass transfer is external diffusion [27,43,45]. These results reveal that the adsorption of dyes is dominated by external diffusion, indicating that the dyes take time to reach the surface of the adsorbent from the core of the solution; therefore, more energy is needed for them to adsorb on the surface of nDCPD, which is directly related to the adsorption capacity [27,43,45].
Table 7.
Kinetic constants for diffusion processes in the adsorption of PR and GV.
3.7. Characterization of nDCPD in PR and GV Adsorption
The SEM image of nDCPD (Figure 9a) shows a well-defined monoclinic disk morphology and a rough surface where irregular features can be observed, which are characteristic of brushite [13,18,40,43,50]. In the micrographs of the adsorbent after the removal process, it should be noted that there is no significant change in the morphology of nDCPD (Figure 9b,c); thus, it can be inferred that the temperature and time in which the adsorption of the dyes takes place produces no effect [13,18,40,43,50].
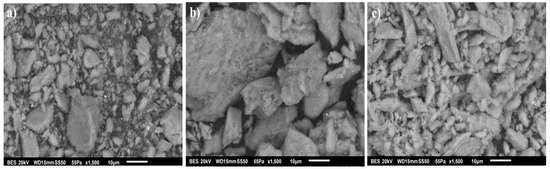
Figure 9.
Images obtained in SEM: (a) nDCPD; (b) adsorption of PR; (c) adsorption of GV.
The elemental analysis of the adsorption of both dyes was carried out via X-ray dispersion spectroscopy (EDS), and the results are shown in Table 8, where the C/O, Ca/Si, and Ca/P ratios of the adsorbent can be observed before and after the removal of the dyes. For nDCPD, the C/O ratio is 1.07, which decreases by 38.3% and 45.8% for PR and GV adsorption, respectively; while the Ca/Si ratio is 59.75 for nDCPD, which increases after PR and GV adsorption by 12.3% and ~16%, respectively. These results indicate that there will be a great adsorption capacity due to the participation of functional groups that contain C and O atoms. The slight increase in the presence of Ca and Si atoms in the adsorbent after the removal does not significantly affect the adsorption capacity of nDCPD.
Table 8.
Elemental analysis of nDCPD before and after adsorption of dyes.
This reveals to us that the anionic and cationic nature of the dyes, together with these functional groups, are responsible for promoting better removal, allowing us to suggest that there could be more than one adsorption mechanism involved, whether via the intervention of electrostatic forces or the participation of the functional groups present on the surface or ion exchange [45,50]. In the case of the Ca/P ratio in all materials, the value referring to brushite is maintained (Ca/P ≈ 1.45), which indicates that the adsorption of the dyes does not affect the crystalline structure of the nDCPD [13,18,40,43,46].
The diffractograms of nDCPD before and after the adsorption of the dyes are shown in Figure 9, containing the peaks at 26° (0 0 2), 28.7° (2 1 0), 32.2° (3 0 0), 34.1° (2 0 2), 40° (3 1 0), 46.7°(2 2 2), 48.3°, 49.7° (2 1 3), and 53.3° (0 0 4), which match the JCPDS (International Center for Diffraction Data Cards) database with respect to brushite [13,18,40,43,58]. The characteristic peaks at 26°, 32.2°, and 34.1 refer to the presence of phosphate groups with an amorphous or semi-crystalline structure for all samples, which confirms what was found in the EDS study, where the particular Ca/P ratio of brushite does not show any change [13,18,40,58].
The infrared spectrum of PR adsorption with nDCPD (Figure 10) shows a band at 3415 cm−1 and a shoulder to 3049 cm−1, which can be attributed to the stretching of the OH- groups of the water molecule and to the surface bonds of the Si-OH groups in brushite, respectively [13,18,40,53,56]. At 2928 cm−1, there is the band corresponding to the stretching of the PO-H bonds that occurs in the HPO groups [13,18,40,53,57,58]. The bands present at 1551 cm−1 and 1449 cm−1 are related to the CO32− groups [13,18,40,53,57,58]. The vibration at 1654 cm−1 is related to the physical bonding modes of water, while 1241 cm−1 is due to bending of the O-H plane and P-O-H [13,18,40,53,57,58]. The bands at 1064 cm−1 and 1032 cm−1 are attributed to the stretching of the P-O groups, while the band at 861 cm−1 is related to P-OH stretching in the HPO42− groups. The vibrations of the phosphate groups of nDCPD were observed at 598 cm−1 and 555 cm−1 [13,18,40,55,56,57,58]. The infrared spectrum of the adsorption of GV with nDCPD (Figure 11) shows similar bands with respect to those observed in the adsorption of PR, having a variation where the bands appear such that 3294 cm−1 and a shoulder at 3066 cm−1 are attributed to the stretching of the OH- groups of the water molecule and the surface bonds of the Si-OH groups in nDCPD, respectively [13,18,40,55,56,57,58]. At 2921 cm−1, we have the band corresponding to the stretching of the PO-H bonds that occurs in the HPO groups [13,18,40,55,56,57,58]. The band at 1637 cm−1 is related to the physical bonding mode of water, while at 1245 cm−1, it is due to the bending of the O-H and P-O-H plane [13,18,40,55,56,57,58]. The bands present at 1545 cm−1, 1451 cm−1, and 1409 cm−1 are related to CO32− groups [13,18,40,55,56,57,58]. The band at 1008 cm−1 is attributed to the stretching of the P-O groups. The band at 954 cm−1 is the band related to the asymmetric extension ν1 of the P-O vibrations of the PO43− group, while the band at 861 cm−1 is related to the P-OH stretching in the HPO42− groups [13,18,40,55,56,57,58]. The vibrations of the phosphate groups of nDCPD were observed at 685 cm−1 [13,18,40,55,56,57,58].
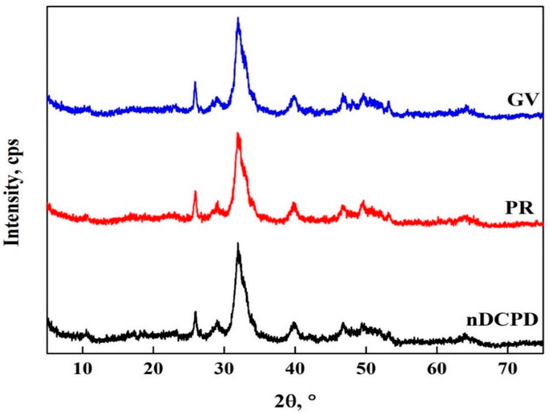
Figure 10.
X-ray diffractograms of nDCPD adsorption of PR and GV.
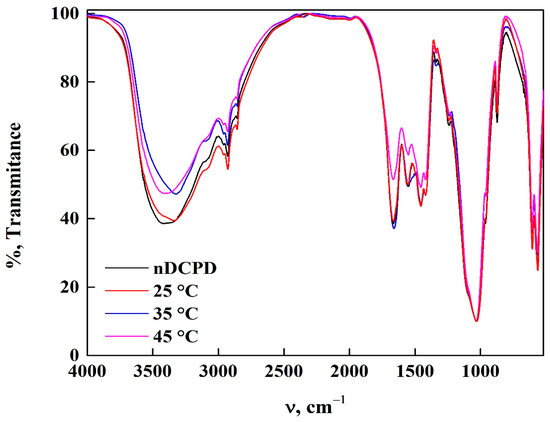
Figure 11.
ATR-FTIR spectra of nDCPD in adsorption of PR at temperatures different.
Within the spectra of Figure 11 and Figure 12, it was observed that several vibrations disappear or decrease their intensity compared to those of nDCPD. Among them are the vibrations assigned to the OH– groups and those related to the phosphate and silicate groups, which confirms that the adsorption mechanism of Pr and GV is carried out by the intervention of these functional groups present on the surface of the adsorbent, which demonstrates that by belonging to the family of nDCPD apatites, it can adsorb these dyes on its surface.
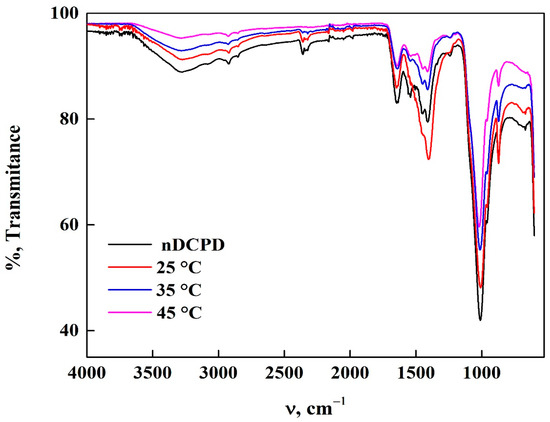
Figure 12.
ATR-FTIR spectra of nDCPD in adsorption of GV at temperatures different.
4. Conclusions
This study established that brushite obtained from bovine bone (nDCPD) is a potential candidate to be used as a bioadsorbent in the removal of phenol red and gentian violet from aqueous solutions. The adsorption of these dyes was carried out on a heterogeneous surface using more than one monolayer, removing around 92% of PR and 96% of GV from the solution. PR removal decreases significantly when the temperature it as its maximum adsorption capacity of 82.3 mg/g at 25 °C. In contrast, GV removal has an adsorption capacity of 82.5 mg/g at 45 °C, indicating that dye removal depends on the chemical structure of the dye and its interaction with the nDCPD surface, considering that both processes are spontaneous in nature. Similarly, the kinetic analysis of the PR removal process uses two sites for each dye molecule in the adsorbent to carry out the removal, taking into account that there is a growth of the sites present over the adsorption time (nA > 1), and in the case of GV removal, only a single site is required to carry out the removal of the dye from the solution, taking into account that there is not only the presence of electrostatic attraction to the nDCPD surface but also more than one adsorption process involved (nA < 1).
The characterization of nDCPD before and after adsorption allowed for the establishment of a complete overview of the dye removal process, considering the isoelectric point, demonstrating that there are electrostatic forces due to the nature of the dye (anionic and cationic) and a process of ion exchange which involves the functional groups present on the surface, such as phosphate groups, without significantly modifying the crystalline structure and microstructure of nDCPD, which means that it can be inferred that this material is a suitable candidate for the removal of anionic and cationic dyes present in aqueous solutions.
In this study, it was established that nDCPD is a potential candidate for the removal of PR and GV, achieving rates of approximately 92% and 96%, respectively, on the heterogeneous surface of the bioadsorbent. The removal of PR decreases with the increasing temperature, while the removal of GV increases with the rising temperature, indicating that dye removal depends on the chemical structure of the dye. In the kinetic process of PR removal, two sites are utilized, whereas for GV removal, only one site is required, suggesting the involvement of additional adsorption mechanisms. The characterization of nDCPD revealed the presence of electrostatic forces due to the nature of the dye and ionic exchange involving functional groups on the surface (phosphate groups), without significantly altering the crystalline structure and microstructure of nDCPD. This indicates that nDCPD is a suitable candidate for dye removal.
Author Contributions
Conceptualization, J.A.H. and A.M.-S.; methodology, M.S.-H., A.T.-L., A.M.-S. and J.A.H.; software, J.A.H. and M.S.-H.; validation, R.H.-S., O.J.S.-M. and A.N.A.A.; formal analysis, J.A.H.; investigation, A.M.-S., A.T.-L. and J.A.H.; resources, M.S.-H.; data curation, R.H.-S.; writing—original draft preparation, J.A.H.; writing—review and editing, J.A.H., R.H.-S. and A.T.-L.; visualization, O.J.S.-M.; supervision, M.S.-H. and A.M.-S.; project administration, R.H.-S.; funding acquisition, A.T.-L. All authors have read and agreed to the published version of the manuscript.
Funding
This research was funded by the Secretary for Research and Graduate Studies (project SIP20) of the Instituto Politécnico Nacional (IPN).
Data Availability Statement
Data available on request due to restrictions eg privacy or ethical.
Acknowledgments
The researchers want to thank UPIIG—IPN and aboratorio de Investigación y Caracterización de Minerales y Materiales (LICAMM UG).
Conflicts of Interest
The authors declare no conflicts of interest.
Sample Availability
Samples of the compounds are not available from the authors.
References
- Ning, W.; Jie, C.; Jianan, W.; Jiangtao, F.; Wei, Y. Removal of phenol red by polyaniline/TiO2 hydrate: Adsorption Kinect, isotherm, and mechanism studies. Powder Technol. 2019, 347, 93–102. [Google Scholar] [CrossRef]
- Chong, S.N.; Hadibarata, T. Adsorption of Phenol Red and Remazol Brilliant Blue R by Coconut Shells (Cocos nucifera) and Ambarella Peels (Spondias dulcis). Biointerface Res. Appl. Chem. 2021, 11, 8564–8576. [Google Scholar] [CrossRef]
- Zhou, Y.; Lu, J.; Zhou, Y.; Liu, Y. Recent advances for dyes removal using novel adsorbents: A review. Environ. Pollut. 2019, 252, 352–365. [Google Scholar] [CrossRef] [PubMed]
- Nayagam, J.O.P.; Prasanna, K. Utilization of shell-based agricultural waste adsorbents for removing dyes: A review. Chemosphere 2022, 291, 132737. [Google Scholar] [CrossRef]
- Ayach, J.; Duma, L.; Badran, A.; Hijazi, A.; Martinez, A.; Bechelany, M.; Baydoun, E.; Hamad, H. Enhancing Wastewater Depollution: Sustainable Biosorption Using Chemically Modified Chitosan Derivatives for Efficient Removal of Heavy Metals and Dyes. Materials 2024, 17, 2724. [Google Scholar] [CrossRef]
- Wang, H.; Xu, J.; Liu, X.; Sheng, L. Preparation of straw activated carbon and its application in wastewater treatment: A review. J. Clean. Prod. 2021, 283, 124671. [Google Scholar] [CrossRef]
- Mayet, A.M.; Hijji, M.; Saleh, E.A.M.; Reza, A.; Kadhim, S.I.; Abdullaev, S.S.; Alsalamy, A.; Hassan, Z.F.; Gomez, C.V.; Tene, T. The Role of Biocomposites and Nanocomposites in Eliminating Organic Contaminants from Effluents. Water 2023, 15, 3093. [Google Scholar] [CrossRef]
- Rani, S.; Chaudhary, S. Adsorption of methylene blue and crystal violet dye from waste water using Citrus limetta peel as an adsorbent. Mater. Today Proc. 2022, 60, 336–344. [Google Scholar] [CrossRef]
- Bukhari, A.; Javed, T.; Haider, M.N. Adsorptive exclusion of crystal violet dye from wastewater by using fish scales as an adsorbent. J. Dispers. Sci. Technol. 2022, 44, 2081–2092. [Google Scholar] [CrossRef]
- Mahmood, Z.A.; Farhan, A.M.; Kadhim, N.J.; Hade, M.S. Kinetic and Theoretical Study of Removal Gentian Violet from Aqueous Solution Using Stachy Plant. Baghdad Sci. J. 2023, 20, 1283–1296. [Google Scholar] [CrossRef]
- Asghari, E.; Saraji, M. Evaluating cottonwood seeds as a low-cost biosorbent for crystal violet removal from aqueous matrics. Int. J. Phytoremediation 2023, 25, 137–145. [Google Scholar] [CrossRef] [PubMed]
- Priyadharsini, P.; SundarRajan, P.; Pavithra, K.G.; Naveen, S.; SanjayKumar, S.; Gnanaprakash, D.; Arun, J.; Pugazhendhi, A. Nanohybrid photocatalysts in dye (Colorants) wastewater treatment: Recent trends in simultaneous dye degradation, hydrogen production, storage and transport feasibility. J. Clean. Prod. 2023, 426, 139180. [Google Scholar] [CrossRef]
- Ali, D.A.; Saad, F.A.; Elsawy, H.A. Kinetics and Isotherm Studies for Adsorption of Gentian Violet Dye from Aqueous Solutions Using Synthesized Hydroxyapatite. J. Environ. Public Health 2023, 2023, 7418770. [Google Scholar] [CrossRef]
- Phuong, N.T.; Nam, N.H.; Hong, C.T.; Dac, D.V.Q.; Thu, L.P.; Hai, D.T.; Osial, M.; Giersig, M.; Thanh, D.T.M. Apatite Ore-based Nanostructures: Novel and Eco-friendly Sorbent for Eicient Removal of Wastewater Containing Pb2+ and Fe3+. Water Air Soil Pollut. 2023, 234, 550. [Google Scholar] [CrossRef]
- Akram, M.; Nazir, H.; Salman, M.; Rehman, R.; Farooq, U.; Tahir, S. Kinetic and Isothermal Investigations of Cost-Effective Sorptive Elimination of Gentian Violet Dye from Water Using Haplophragma adenophyllum Biowaste. J. Chem. 2021, 2021, 5549536. [Google Scholar] [CrossRef]
- Athira, T.M.; Sumi, S. Agro-based Adsorbents for Dye Removal from Aqueous Solutions: A Review. Water Air Soil Pollut. 2024, 235, 120. [Google Scholar] [CrossRef]
- Filice, S.; Bongiorno, C.; Libertino, S.; Compagnini, C.; Gradon, L.; Iannazzo, D.; La Magna, A.; Scalese, S. Structural Characterization and Adsorption Properties of Dunino Raw Halloysite Mineral for Dye Removal from Water. Materials 2021, 14, 3676. [Google Scholar] [CrossRef] [PubMed]
- Pai, S.; Kini, M.S.; Selvaraj, R. A review on adsorptive removal of dyes from wastewater by hydroxyapatite nanocomposites. Environ. Sci. Pollut. Res. 2021, 28, 11835–11849. [Google Scholar] [CrossRef]
- Chahinez, H.-O.; Abdelkader, O.; Leila, Y.; Tran, H.N. One-stage preparation of palm petiole-derived biochar: Characterization and application for adsorption of crystal violet dye in water. Environ. Technol. Innov. 2020, 19, 100872. [Google Scholar] [CrossRef]
- Márquez, C.O.; García, V.J.; Guaypatin, J.R.; Fernández-Martínez, F.; Ríos, A.C. Cationic and Anionic Dye Adsorption on a Natural Clayey Composite. Appl. Sci. 2021, 11, 5127. [Google Scholar] [CrossRef]
- Badhai, P.; Kashyap, S.; Behera, S.H. Adsorption of phenol red onto GO-Fe3O4 hybrids in aqueous media. Environ. Nanotechnol. Monit. Manag. 2020, 13, 100282. [Google Scholar] [CrossRef]
- Patil, S.R.; Sutar, S.S.; Jadhav, J.P. Sorption of crystal violet from aqueous solution using live roots of Eichhornia crassipes: Kinetic, isotherm, phyto and cyto-genotoxicity studies. Environ. Technol. Innov. 2020, 18, 100648. [Google Scholar] [CrossRef]
- Kristanti, R.A.; Yuniarto, A.; Hadibarata, T. Adsorption of Basic Dyes Crystal Violet on Agricultural Biomass: Characterization, Isotherm and Kinetic Studies. Int. J. Integr. Eng. 2022, 14, 269–275. Available online: http://penerbit.uthm.edu.my/ojs/index.php/ijie (accessed on 3 February 2023). [CrossRef]
- Amalraj, R.; Ramsenthil, R.; Durai, G.; Jayakumar, R.; Palaniraj, R. Dyes Removal Using Novel Sorbents—A Review. J. Pharm. Res. Int. 2021, 33, 355–382. [Google Scholar] [CrossRef]
- Alguacil, F.J.; López, F.A. Organic Dyes versus Adsorption Processing. Molecules 2021, 26, 5440. [Google Scholar] [CrossRef]
- Wazir, M.B.; Daud, M.; Ali, F.; Al-Harthi, M.A. Dendrimer assisted dye-removal: A critical review of adsorption and catalytic degradation for wastewater treatment. J. Mol. Liq. 2020, 315, 113775. [Google Scholar] [CrossRef]
- Latif, S.; Alanazi, K.D.; Alshammari, B.H.; Al-Ahmed, A.; Alanazi, A.M. Utilization of river tamarind stem driven biochar for eicient removal of phenol dye from polluted water: Insights from adsorption studies. Biomass Convers. Biorefinery 2024, 14. [Google Scholar] [CrossRef]
- Abbas, M.; Harrache, Z.; Trari, M. Removal of gentian violet in aqueous solution by activated carbon equilibrium, kinetics, and thermodynamic study. Adsorpt. Sci. Technol. 2019, 37, 566–589. [Google Scholar] [CrossRef]
- Sboui, N.; Agougui, H.; Jabli, M.; Boughzala, K. Synthesis, physico-chemical, and structural properties of silicate apatites: Effect of synthetic methods on apatite structure and dye removal. Inorg. Chem. Commun. 2022, 142, 109628. [Google Scholar] [CrossRef]
- Linh, N.L.M.; Lieu, P.K.; Duong, T.; Hung, N.V.; Duc, H.V.; Hoa, L.T.; Thu, N.T.A.; Khieu, D.Q. Phenol Red Adsorption from Aqueous Solution on the Modified Bentonite. J. Chem. 2020, 2020, 1504805. [Google Scholar] [CrossRef]
- Wang, R.-F.; Deng, L.-G.; Li, K.; Fan, X.-J.; Li, W.; Lu, H.-Q. Fabrication and characterization of sugarcane bagasse–calcium carbonate composite for the efficient removal of crystal violet dye from wastewater. Ceram. Int. 2020, 46, 27484–27492. [Google Scholar] [CrossRef]
- Bożęcka, A.; Orlof-Naturalna, M.; Kopeć, M. Methods of Dyes Removal from Aqueous Environment. J. Ecol. Eng. 2021, 22, 111–118. [Google Scholar] [CrossRef]
- Wakkel, M.; Khiari, B.; Zagrouba, F. Textile wastewater treatment by agro-industrial waste: Equilibrium modelling, thermodynamics and mass transfer mechanisms of cationic dyes adsorption onto low-cost lignocellulosic adsorbent. J. Taiwan Inst. Chem. Eng. 2019, 96, 439–452. [Google Scholar] [CrossRef]
- Rojas, J.; Suarez, D.; Torres-Palma, R.A.; Moreno, A.; Silva-Agredo, J. Kinetics, Isotherms and Thermodynamic Modeling of Liquid Phase Adsorption of Crystal Violet Dye onto Shrimp-Waste in Its Raw, Pyrolyzed Material and Activated Charcoals. Appl. Sci. 2019, 9, 5337. [Google Scholar] [CrossRef]
- Haripriyan, U.; Arun, J.; Gopinath, K.P.; Mythili, R.; Kim, W.; Govarthanan, M. A mini-review on innovative strategies for simultaneous microbial bioremediation of toxic heavy metals and dyes from wastewater. Arch. Microbiol. 2023, 205, 29–35. [Google Scholar] [CrossRef]
- Pandey, D.; Daverey, A.; Dutta, K.; Arunachalam, K. Dye removal from simulated and real textile effluent using laccase immobilized on pine needle biochar. J. Water Process Eng. 2023, 53, 103710. [Google Scholar] [CrossRef]
- Liu, Q.; Liu, Y.; Zhang, Z.; Wang, X.; Shen, J. Adsorption of cationic dyes from aqueous solution using hydrophilic silica aerogel via ambient pressure drying. Chin. J. Chem. Eng. 2020, 28, 2467–2473. [Google Scholar] [CrossRef]
- Homagai, P.L.; Poudel, R.; Poudel, S.; Bhattarai, A. Adsorption and removal of crystal violet dye from aqueous solution by modified rice husk. Heliyon 2022, 8, e09261. [Google Scholar] [CrossRef]
- Mousavi, S.M.; Meraji, S.H.; Sanati, A.M.; Ramavandi, B. Phenol red dye removal from wastewater using TiO2-FSM-16 and Ni-FSM-16 photocatalysts. Heliyon 2023, 9, e14488. [Google Scholar] [CrossRef]
- Nanthamathee, C.; Dechatiwongse, P. Kinetic and thermodynamic studies of neutral dye removal from water using zirconium metal-organic framework analogues. Mater. Chem. Phys. 2021, 258, 123924. [Google Scholar] [CrossRef]
- Mansouri, F.E.; Farissi, H.E.; Zerrouk, M.H.; Cacciola, F.; Bakkali, C.; Brigui, J.; Lovillo, M.P.; Esteves da Silva, J.C.G. Dye Removal from Colored Textile Wastewater Using Seeds and Biochar of Barley (Hordeum vulgare L.). Appl. Sci. 2021, 11, 5125. [Google Scholar] [CrossRef]
- Pérez, S.; Giraldo, S.; Forgionny, A.; Floréz, E.; Acelas, N. Eco-friendly reuse of agricultural wastes to produce biocomposites with high potential in water treatment and fertilizers. Biomass Convers. Biorefinery 2022, 14, 8537–8547. [Google Scholar] [CrossRef]
- Yassine, I.; Joudi, M.; Hafdi, H.; Hayimi, B.; Moudlar, J.; Bensemlai, M.; Nasrellah, H.; Abderrahim, M.; Bakasse, M. Synthesis of Brushite from Phophogypsum Industrial Waste. Biointerface Res. Appl. Chem. 2022, 12, 6580–6588. [Google Scholar] [CrossRef]
- Rojas-Montoya, I.D.; Fosado-Esquivel, P.; Henao-Holguín, L.V.; Esperanza-Villegas, A.E.; Bernad-Bernad, M.; Gracia-Mora, J. Adsorption/desorption studies of norfloxacin on brushite nanoparticles from reverse microemulsions. Adsorption 2020, 26, 825–834. [Google Scholar] [CrossRef]
- Hernández Maldonado, J.A.; Torres García, F.A.; Salazar Hernández, M.M.; Hernández Soto, R. Removal of chromium from contaminated liquid effluents using natural brushite obtained from bovine bone. Desalin. Water Treat. 2017, 95, 262–273. [Google Scholar] [CrossRef]
- Gallo, M.; Tadier, S.; Meille, S.; Gremillard, L.; Chevalier, J. The in vitro evolution of resorbable brushite cements: A physico-chemical, micro-structural and mechanical study. Acta Biomater. 2017, 53, 515–525. [Google Scholar] [CrossRef]
- López-Ahumada, E.; Salazar-Hernández, M.; Talavera-López, A.; Solis-Marcial, O.J.; Hernández-Soto, R.; Ruelas-Leyva, J.P.; Hernández, J.A. Removal of Anionic and Cationic Dyes Present in Solution Using Biomass of Eichhornia crassipes as Bioadsorbent. Molecules 2022, 27, 6442. [Google Scholar] [CrossRef]
- Kyzas, G.Z.; Bikiaris, D.N.; Mitropoulos, A.C. Chitosan adsorbents for dye removal: A review. Polym. Int. 2017, 66, 1800–1811. [Google Scholar] [CrossRef]
- Nirmala, N.; Shriniti, V.; Aasresha, K.; Arun, J.; Gopinath, K.P.; Dawn, S.S.; Sheeladevi, A.; Priyadharsini, P.; Birindhadevi, K.; Chi, N.T.L.; et al. Removal of toxic metals from wastewater environment by graphene-base composites: A review on isotherm and kinetic models, recent trends, challenges and future directions. Sci. Total Environ. 2022, 840, 156564. [Google Scholar] [CrossRef]
- Wang, X.S.; Zhou, Y.; Jiang, Y.; Sun, C. The removal of basic dyes from aqueous solutions using agricultural by-products. J. Hazard. Mater. 2008, 157, 374–385. [Google Scholar] [CrossRef]
- Prasad, R.; Sharma, D.; Yadav, K.D.; Ibrahim, H. Eichhornia crassipes as biosorbent for industrial wastewater treatment: Equilibrium and kinetic studies. Can. J. Chem. Eng. 2021, 100, 439–450. [Google Scholar] [CrossRef]
- Alebachew, N.; Yadav, O.P.; Lokesh. Removal of Phenol Red Dye from Contaminated Water Using Barley (Hordeum vulgare L.) Husk-Derived Activated Carbon. Sci. Int. 2021, 5, 7–16. [Google Scholar] [CrossRef]
- Georgin, J.; Franco, D.S.P.; Drumm, F.C.; Grassi, P.; Netto, M.S.; Allasia, D.; Dotto, G.L. Paddle cactus (Tacinga palmadora) as potential low-cost adsorbent to treat textile effluents containing crystal violet. Chem. Eng. Commun. 2020, 207, 1368–1379. [Google Scholar] [CrossRef]
- Cheruiyot, G.K.; Wanyonyi, W.C.; Kiplimo, J.J.; Maina, E.N. Adsorption of toxic crystal violet dye using coffee husks: Equilibrium, kinetics and thermodynamics study. Sci. Afr. 2019, 5, e00116. [Google Scholar] [CrossRef]
- Liu, Q.; Li, Y.; Chen, H.; Lu, J.; Yu, G.; Möslang, M.; Zhou, Y. Superior adsorption capacity of functionalised straw adsorbent for dyes and heavymetal ions. J. Hazard. Mater. 2020, 382, 121040. [Google Scholar] [CrossRef]
- Fan, H.; Ma, Y.; Wan, J.; Wang, Y. Removal of gentian violet and rhodamine B using banyan aerial roots after modification and mechanism studies of differential adsorption behaviors. Environ. Sci. Pollut. Res. 2020, 27, 9152–9266. [Google Scholar] [CrossRef]
- Mancilla-Sanchez, E.; Gómez-Gutiérrez, C.M.; Vargas, E.; Guerra-Rivas, G.; Soto-Robles, C.A.; Vilchis-Nestor, A.R.; Luque, P.A. Obtaining hydroxyapatite from the exoskeleton and spines of the purple sea urchin Strongylocentrotus purpuratus. Int. J. Appl. Ceram. Technol. 2018, 16, 438–443. [Google Scholar] [CrossRef]
- Erol, M.; Özyuguran, A.; Çelebican, Ö. Synthesis, Characterization, and In Vitro Bioactivity of Sol-Gel-Derived Zn, Mg, and Zn-Mg Co-Doped Bioactive Glasses. Chem. Eng. Technol. 2010, 33, 1066–1074. [Google Scholar] [CrossRef]


Disclaimer/Publisher’s Note: The statements, opinions and data contained in all publications are solely those of the individual author(s) and contributor(s) and not of MDPI and/or the editor(s). MDPI and/or the editor(s) disclaim responsibility for any injury to people or property resulting from any ideas, methods, instructions or products referred to in the content. |
© 2024 by the authors. Licensee MDPI, Basel, Switzerland. This article is an open access article distributed under the terms and conditions of the Creative Commons Attribution (CC BY) license (https://creativecommons.org/licenses/by/4.0/).