Article

Evaluation of Straw Mulch as an Erosion Control Practice for Varying Soil Types on a 4:1 Slope

Department of Civil and Environmental Engineering, Auburn University, Auburn, AL 36849, USA
*
Author to whom correspondence should be addressed.
Water 2024, 16(19), 2819; https://doi.org/10.3390/w16192819
Submission received: 17 July 2024 / Revised: 19 September 2024 / Accepted: 29 September 2024 / Published: 4 October 2024

Abstract

:
Construction sites rely on erosion control practices to protect bare slopes and prevent soil loss. The effectiveness of certain erosion controls is often under-evaluated if they are not a part of a product evaluation program. Furthermore, erosion controls in general are not fully understood regarding how their performance can be affected by site specific variables, such as soil variations. This study used large-scale rainfall simulators to evaluate how a commonly used erosion control on construction sites, broadcasted straw mulch, performs on three common soil types in Alabama. The study at the Auburn University, Stormwater Research Facility (AU-SRF) used the industry standard testing method and three different soil types: sand, loam, and clay in accordance with ASTM D6459-19, the standard test method for testing rolled erosion control products’ (RECPs) performance in protecting hillslopes from rainfall-induced erosion. As required by ASTM D6459-19, the rainfall simulators simulated a storm of varying 20 min increments of 2 in./h (5.08 cm/h), 4 in./h (10.16 cm/h), and 6 in./h (15.24 cm/h). A total of nine bare soil tests on the 4:1 test plots was performed with an average total soil loss of 1977 lb (897 kg), 236.2 lb (107 kg), and 114.2 lb (51.8 kg) for sand, loam, and clay, respectively. The average erodibility K-factor for each soil type is calculated to be 0.37 (sand), 0.043 (loam), and 0.013 (clay). Nine straw tests were performed on the 4:1 plots, with an average total soil loss of 44.31 lb (20.1 kg), 6.74 lb (3.1 kg), and 17.13 lb (7.8 kg) for sand, loam, and clay, respectively. Straw testing indicated substantial soil loss reduction with average cover management C-factor values under the revised universal soil loss equation (RUSLE) method of 0.021, 0.047, and 0.193 for sand, loam, and clay applications, respectively. This variation in C-factor across the three soil types indicates that the single C-factor, often reported by product manufacturers, is not adequate to imply performance.

1. Introduction

Sediment laden runoff from construction land disturbing activities can cause substantial environmental risk to surrounding water bodies and organisms. Two thirds of all pollutants entering U.S. waterways is sediment [1]. It is estimated that in the United States, 6 billion tons (5.44 metric tons) of soil erode and can cause up to USD 27.5 billion (adjusted for inflation) in damages annually [2]. Telles et al. [3] found, based upon data from 1933 to 2010, the annual cost of resources related to erosion for the European Union to be as high as USD 45.5 billion and for the United States as high as USD 44 billion. However, Panagos et al. [4] estimated the annual cost for the European Union to be between USD 5.6 and 9 billion annually. Regardless of the variation between estimates, it is clear that soil erosion mitigation is a substantial financial burden on modern society.
Given the high volume of rainfall in the southeast United States and with steep natural topography such as the Appalachian Mountains and manmade topography such as highway embankments, it is important to fully understand the effectiveness of erosion control products on construction slopes. These products and practices can substantially reduce sediment migration into the waterways downstream of construction projects.
The U.S. Environmental Protection Agency (USEPA) requires all public and private entities that disturb 1 acre (0.4 ha) or more to attain National Pollutant Discharge Elimination System (NPDES) permit coverage from the designated permitting agency. As part of this coverage, sites are required to use best management practices (BMPs) that provide stormwater, erosion, and sediment control to the maximum extent practicable to minimize construction stormwater-related pollution [5].
Understanding which erosion control practices work best is typically based upon industry-supplied (often manufacturer) performance data that is gathered from research studies or third-party testing. Typical erosion controls found on construction sites are loose mulch materials, such as straw or hay, hydraulically applied mulches (hydromulch), or blanket covers manufactured out of both natural and synthetic material options, called erosion control blankets. Third-party testing follows industry standards often adopted by state [6] or federal agencies. Research studies may also be standardized or based on allowable field conditions [7]. Li [6] found during standardized testing for the Texas Department of Transportation (TxDOT) that straw could provide equal to or exceeding performance as an erosion control; however, this test was performed based upon the TxDOT standard testing method but is not considered an industry standard outside of that region. This variation in testing methodology makes it difficult to evaluate the performance of straw mulch compared to other erosion control options.

1.1. Standardized Testing of Erosion Controls

To fully realize the maximum extent practicable for erosion controls, the current standard practice for the erosion control industry is to test products such as erosion control blankets, in accordance with ASTM D6459-19 [8]. This method is recognized by the American Association of State and Transportation Officials (AASHTO) as the method required for testing erosion control products for slope protection from rainfall-induced erosion. This test method determines applicable K-factors for the soil types of the test slopes and C-factors for the products to reduce erosion, as compared to bare soil slopes. These factors are inputs used in designing erosion controls using the revised universal soil loss equation (RUSLE).
Tyner et al. [9] and Manning et al. [10] recognized the importance of standardized testing, such as ASTM D6459, to allow for comparison within the industry of practices and products tested at other labs. Tiner et al. performed an extensive review of erosion control practices and found it difficult to make meaningful comparisons between studies due to the substantial variability of testing methods used. They stipulated during their discussion of the literature review that the scientific and testing community need to set a standard method for evaluating erosion control product efficacy so as to make comparative analysis between the testing of products as well as the products themselves easier.

1.2. Research Importance

Rainfall-induced erosion is the primary catalyst of sediment laden runoff on construction sites. A variety of erosion control practices (ECPs) are implemented to reduce the effects of splash, sheet, and rill erosion. These can include non-proprietary practices, such as straw, or manufactured products, such as RECPs and turf reinforcement mats (TRMs). ECPs serve to reduce stormwater runoff volume and velocity, absorb raindrop impact, and provide cover and anchoring for vegetation to become established. When specifying allowable products for projects, designers often rely on published C-factors provided by the manufacturers’ published product data. This value is typically provided through third-party testing and is a single value that is intended to describe its ability to reduce soil loss. With straw being a common mulching material used on construction sites, providing the industry with comparable C-factor developed in the same manner to that of the industry standard used for erosion control products is important.
Researchers at the Auburn University, Stormwater Research Facility (AU-SRF) used rainfall simulation to evaluate straw using ASTM D6459-19 to determine performance on clay, sand, and loam slopes at 4:1 slope (4:1 represents 4 horizontal units to 1 vertical unit or 4H:1V). Straw was chosen as a practice that has some limited data regarding C-factors developed using ASTM D6459-19. Furthermore, straw mulch is one of the most common temporary erosion control practices used in the construction industry.
Typically, testing has focused on rainfall simulator testing on a single soil type. The RUSLE equation provides the expectation that the K-factor will normalize the expected soil loss to whatever soil type is onsite, so that ECPs should have a universal C-factor. However, as Clopper et al. [11] showed, this may not be the case, as they determined that each soil type tested had differing resultant C-factors for the erosion controls they analyzed. This variance in C-factors warrants further investigation, as it could lead to potentially changing how the industry reports and uses the C-factors for erosion and sediment control design and planning on construction sites.
This study seeks to improve the understanding of what straw’s C-factor would be using the same methods that determine proprietary erosion control products, such as ECBs, and evaluate if performance and resulting metrics vary between soil types.

2. Materials and Methods

Rainfall simulators provide a method to test erosion control practices and bare soil on a slope under designated target rainfall intensities. Li et al. [12] demonstrated that large-scale testing provides similar test data to that of field-scale testing with the benefit of efficiency and better controlled variables to increase reliability. A rainfall simulator apparatus mimics the process of rainfall-induced erosion, typically through a set of sprinklers and a designated test plot. The simulation can be performed on a small, intermediate, and large scale. Tyner et al. [9] found that large-scale and bench-scale testing of rainfall-induced erosion was not comparable to bench-scale testing underrepresenting typical rainfall-induced erosion patterns, specifically that of rill erosion. Calibration is needed to ensure that the testing apparatus used achieves consistent results between tests and achieves a natural raindrop size distribution. In this study, large-scale simulation is used, in accordance with ASTM D6459-19, which is the standard test method for large-scale rainfall simulation. A summary of the testing facility, calibration, and testing at AU-SRF are provided. Further information regarding the AU-SRF can be found in Schussler et al. [13].

2.1. ASTM D6459-19

The purpose of this study was to test broadcasted straw mulch as an erosion control practice on the 4:1 slopes under varying soil characteristics. It was essential that this study used ASTM D6459 testing protocol to ensure the past and future comparison of other products and practices tested. The soil used in rainfall testing is the most important component. All tests rely on measuring soil erosion as a means for determining erosion control efficacy; however, soils vary greatly and may in turn hinder comparative evaluation of erosion controls tested. ASTM D6459 provides the framework on how the tests should be setup, including a range of soil characteristics that must be met in order to satisfy the standard. The final results of this testing method will produce cover management factors for products based on the soil erodibility determined through the control tests on the plots. These cover management factors, or C-factors, and soil erodibility factors, or K-factors, are requirements of the RUSLE equation. RUSLE, shown in Equation (1), is an empirical equation born out of observational data related to soil sheet and rill erosion practices used in agricultural settings; however, this has been adopted by many different industries, including predicted soil loss on construction sites.
A = R × K × L S × C × P
where
A = annual soil loss per acre (tons/acre/year, [tons/ha/year])
R = rainfall erosivity factor (((hundreds of ft)(tonf)(in.))/acre/year, [(hundreds of ha MJ mm)/ha/year])
K = soil erodibility factor (((ton)(acre)(h))/((hundreds of ac-ft)(tonf)(in.)), [(tons ha h)·(ha MJ mm)−1])
LS = length of slope steepness factor (dimensionless)
C = cover management factor (dimensionless)
P = support practice factor (dimensionless)
Since straw is not considered a manufactured product, there is limited information available for its performance as an erosion control using the ASTM D6459 testing method. Furthermore, most testing of erosion control products that is performed using ASTM D6459 tests erosion control practices (ECPs) on 3:1 slopes. Clopper et al. [11] report testing on 3:1 slopes to determine C-factors for varying soil types. The authors performed product testing and compared these products’ performance to blown straw on the same slopes with soil types of loam, sand, and clay. This testing predates ASTM D6459, but the methods used were the precursor for the development of this standardized method, and therefore, the testing method of these authors can be reasonably equated to ASTM D6459. The study presented here was the only test found using ASTM D6459 test methods that tested straw on various soil types.
ASTM D6459 essentially uses the comparison of a bare slope test to that of the same slope testing with a cover management, such as mulch, erosion control blankets, or vegetation of some kind. These two cover conditions are to be evaluated using similar rainfall characteristics and slope preparation conditions. Since the slopes are rebuilt between each test, the slope length and steepness factor would remain constant between the compared tests. The slope characteristics (i.e., slope length and slope steepness) must be considered, and as Tiner et al. [9] pointed out, there are some minimum requirements that must be met to make these effective. With regards to slope length, if the slope is not of sufficient length, rill erosion may not be possible. The potential for rill erosion to occur is a necessity for comparative use of the RUSLE equation. Renard et al. [14] provides an overall assessment of RUSLE and its factors and notes among other things that the S-factor, which accounts for slope steepness, has a greater effect on soil erosion than the L-factor, which accounts for slope length. Therefore, it is important that the slope is of sufficient length, and that the slope steepness is sufficiently analyzed in testing. It should be noted, again, that typical ASTM D6459 tests are performed on 3:1 slopes. Renard et al. [15] also points out that the C-factor is the most important factor to account for in RUSLE, as it is the easiest factor to manage to reduce soil erosion. While some variability in rainfall depth and intensity is expected between tests, this variability is accounted for in the rainfall erosivity factor or R-factor of RUSLE, which allows for a direct comparison if the factors for this variable are well known. Therefore, with all other factors in RUSLE accounted for, the soil and cover factor can be determined by measuring the mass of soil lost during the tests. If multiple rainfall intensities are performed, as required by ASTM D6459, then the soil loss during each intensity must be known.
The K-factor is determined in the bare soil condition, as will be discussed in subsequent sections of this article, and the cover management or C-factor is determined essentially by comparing the amount of lost soil in the bare slope condition to that of the slope with the erosion control installed on it. Therefore, it is assumed within the erosion and sediment control industry that a C-factor developed for a product or practice would be constant regardless of soil type, precipitation, or slope characteristics, since each of these factors are accounted for as inputs into the development of a C-factor development for a specific product or practice.
All testing and data collection were performed, in accordance with ASTM D6459-19. This testing method is a full-scale performance assessment of the amount of soil lost on a slope in a storm with varying intensity. The test method outlines the methodology for equipment calibration, plot preparation, product documentation, product installation, rainfall events and intensities, test performance, runoff and sediment collection, data analysis, and reporting. In accordance with ASTM D6459-19, the rainfall simulators simulated a storm of 20 min increments of 2 in./h (5.08 cm/h), 4 in./h (10.16 cm/h), and 6 in./h (15.24 cm/h). This regime allowed researchers to evaluate the straw using the same evaluation criteria that are standard in the erosion and sediment control industry for product testing, as recognized by AASHTO and other relevant entities. The total sediment lost during the test was collected and recorded for each rainfall intensity interval to allow for the determination of each slope’s K-factor and the straw’s associated C-factor.
This test method provides guidance on the construction, calibration, testing, and results collection. A typical ASTM large-scale rainfall simulator consists of an 8 ft (2.44 m) × 40 ft (12.19 m) test plot on a 4:1 slope surrounded by a set of elevated sprinkler trees. The system must produce target rainfall intensities of 2 in./h (5.08 cm/h), 4 in./h (10.16 cm/h), and 6 in./h (15.24 cm/h). Runoff is collected through a funnel and flashing system and the dry weight of sediment is determined through moisture content samples.
In addition to providing guidance on rainfall simulator configuration, the standard specifies that loam, sand, or clay soils can be used for testing. The soils used for this study were sourced to represent soils that are common in Alabama. Because of the soil diversity within the state, instead of selecting a single soil type to test, loam (sourced on site in Opelika, AL), sand (sourced from Skipper Trucking Abbeville, AL), and clay (sourced from an ALDOT site in Montgomery, AL) were all sourced to represent different parts of the state (as well as other parts of the country) and also fall in line with the requirements needed to meet ASTM D64549. The gradation and plasticity index requirements for the soils used in this study are shown in Table 1. The loam, sand, and clay soils tested at AU-SRF meet the ASTM requirements, and the analysis and selection of test soils were performed and detailed, as discussed by Manning [16].

2.2. Test Facility at AU-SRF

The AU-SRF has six test plots that are 4:1 slope. These plots are paired by twos with the same soil type. Therefore, there is a loam pair, sand pair, and clay pair that can be used for testing. Each plot is 8 ft (2.44 m) by 40 ft (12.19 m) and contains a runoff collection funnel and catch basin. The sprinkler system consists of ten 14 ft (4.27 m) tall sprinkler trees (pipe sourced from Lowe’s in Opelika, AL and sprinkler heads sourced from Nelson Irrigation in Walla Walla, WA) that are connected to a water supply pond. Water is distributed to the ten sprinkler trees via a water supply line and manifold.
Figure 1a shows an example of a test plot. The rainfall simulator sprinkler system can be easily moved to the desired test plot to evaluate products in a variety of conditions. The water supply manifold is used to distribute water from the PVC water main (materials sourced from Lowe’s in Opelika, AL) into the ten sprinkler trees (Figure 1b).

2.3. Calibration of ASTM D6459-19 Rainfall Simulator

The calibration of the rainfall simulator apparatus was performed using the rainfall gauge and flour pan drop size distribution methods. The following sections detail the results of the two calibration methods and the calculation of the theoretical R-factor used for the calculation of bare soil K-factor (soil erodibility) and C-factor (cover management factor). Novel calibration methods, such as the runoff and photography method, were further explored and detailed in a previous study at AU-SRF [17].

2.3.1. Rainfall Intensity Calibration

The rainfall intensity calibration was performed on the new rainfall simulator using 20 rain gauges. Per ASTM D5459-19, the rainfall gauge intensities exceeded the Christiansen uniformity coefficient value of 80%. Equation (2) was used to calculate the coefficient value.
C u = 100 1.00 d ÷ n X ¯  
where
Cu= Christiansen uniformity coefficient
d = X i X ¯ i
n = number of observations (20 in. this case)
X = average depth caught (in.)
X ¯ i = depth caught in each rain gauge (in.)
Table 2 provides a summary of the results of the intensity calibration of the new rainfall simulator. The Christiansen uniformity coefficient is provided for each intensity.
The intensity calibration method satisfied the ASTM requirements for a uniformity of 80%.

2.3.2. Drop Size Calibration

In addition to verifying the rainfall intensities produced by the simulator, drop size calibration was performed using the flour pan method, in accordance with ASTM D6459-19. A total of three flour pans were used for each rainfall intensity, and the pellets were dried, sieved, and weighed according to pellet diameter. Table 3 provides the average mass distribution for each target intensity. The RUSLE R-factor was determined from the mass distribution and was determined to be 148.5. The resulting R-factor was used in all C-factor and K-factor calculations.

2.4. ASTM D6459-19 Test Procedure at AU-SRF

Rainfall simulator testing took place across multiple test plots consisting of varying soil types. To ensure consistent results among bare soil and ECP testing, the following procedures were followed, in strict accordance with ASTM D6459-19. The following sections detail the methodology used for plot preparation, test procedure, and results collection.

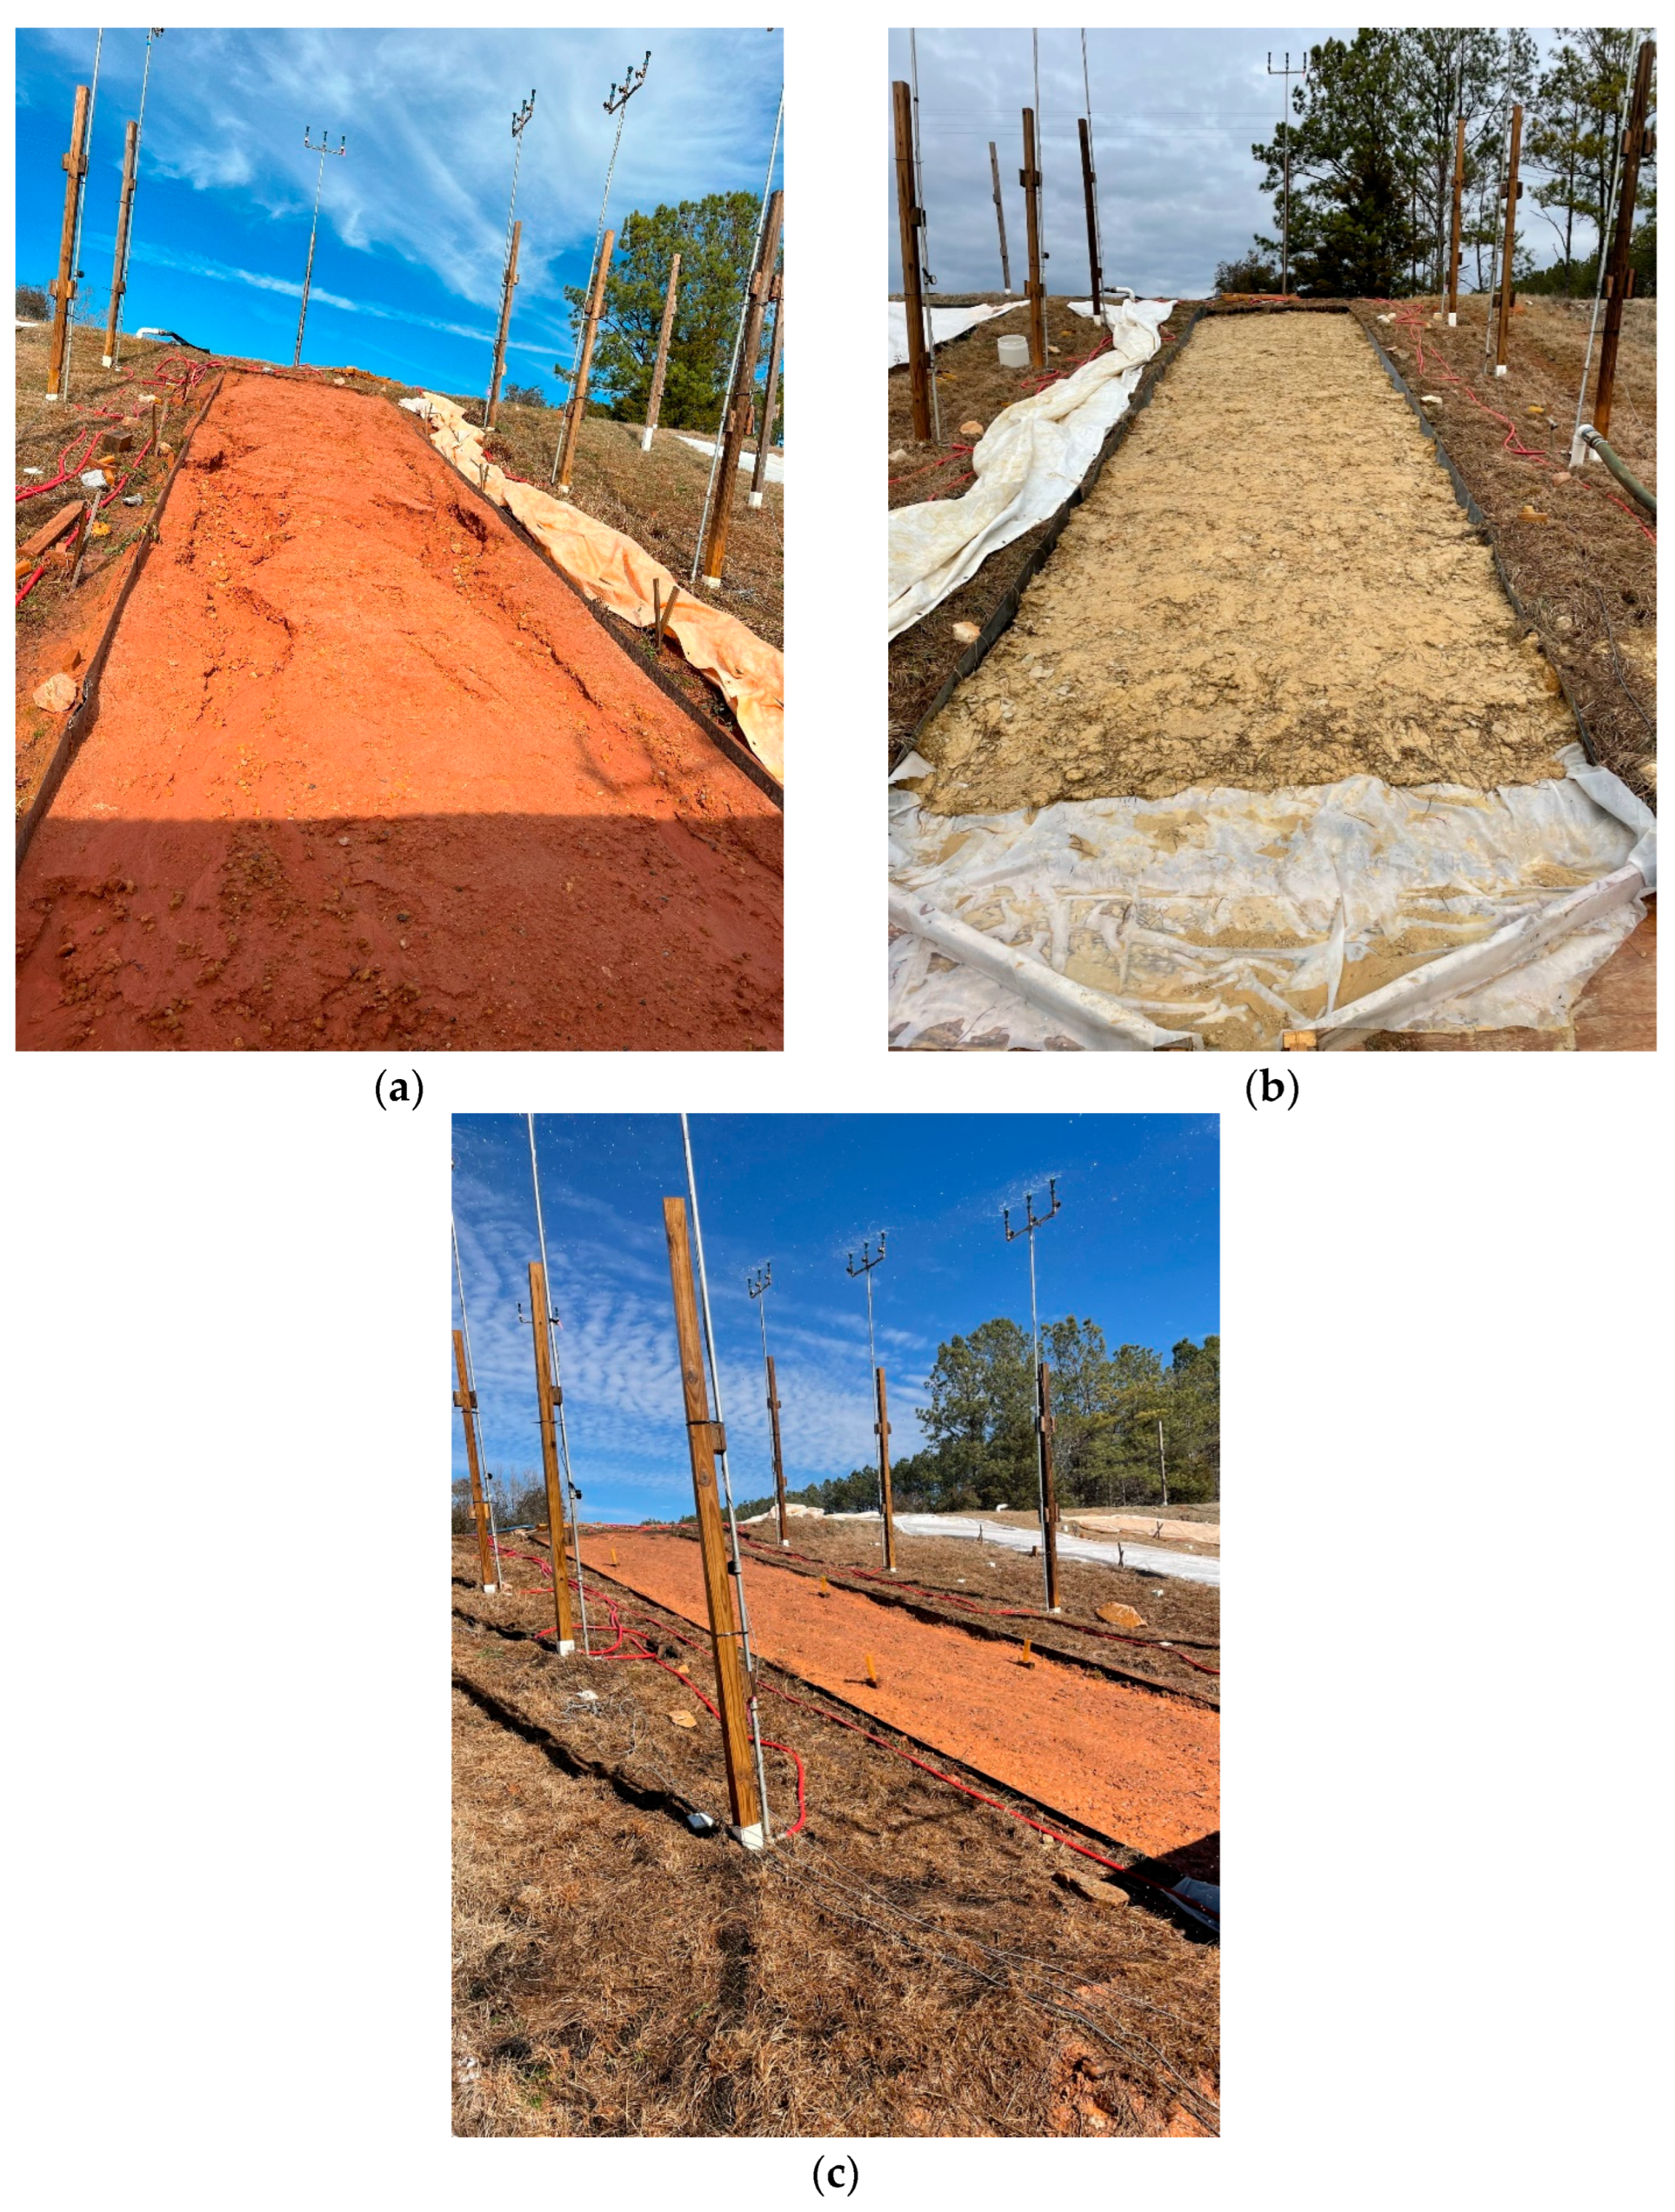
2.4.1. Plot Preparation and Practice Installation

Test plot preparation consists of tilling, raking, compacting, and applying the desired test product. Prior to compaction, the plot must be tilled a minimum of six inches (16.24 cm). At the AU-SRF, this was performed using digging forks. Once the soil was loosened to the required depth, the plot surface was raked for an even distribution of soil. The plot was then compacted using a mechanical slide compactor. A proctor compaction test [18] was then performed to verify that the plot had been compacted within the required range of 87–93% of maximum compaction. A grid was used to randomly select three drive cylinder locations on the plot. The compaction values for each cylinder were averaged together to determine the compaction value for the plot. All rainfall simulator testing followed the same plot preparation procedures using the same equipment to maintain consistency between tests. Once the soil had been prepared, the products were installed, in accordance with the ALDOT specifications and drawings.

2.4.2. Test Procedure

Each rainfall simulator test consisted of three 20 min test intervals of 2 in./h (5.08 cm/h), 4 in./h (10.16 cm/h), and 6 in./h (15.24 cm/h). Prior to testing, a total of six rain gauges were placed on the plot to record the experimental rainfall intensities for each test interval. Photographs were taken before testing to document the pre-test condition of the plot. During each interval, runoff was collected through the funnel and into the catch basin. The runoff was simultaneously pumped into a series of aluminum troughs that had each been designated for a certain intensity. Each trough contained the runoff and sediment captured for a certain intensity. The runoff rate was recorded every two minutes using a 100 mL cylinder and total suspended solids (TSS), and turbidity samples were collected every three minutes using numbered containers. After each interval, the rain gauge depths were recorded, and photographs were taken of the plot to document the plot’s condition. Each bare soil control test and erosion control test was tested in triplicate to determine the average soil loss. Further detail of this methodology can be found in Manning (2021) and Ethridge (2023).

2.4.3. Sediment Collection and Quantification

After testing, sediment was allowed to settle in the troughs for a minimum of 24 h. The supernatant water was pumped from the troughs, and soil was removed and separated into buckets based on moisture content. The buckets were weighed to determine the wet weight of the sediment, and moisture content samples were recorded to calculate the dry weight. The dry weight of sediment was used in the calculation of the K-factor and C-factor. A separate collection trough was used for the runoff from each intensity.

3. Results and Discussion

The following details the results of the bare soil and erosion control tests for each soil type. Bare soil tests were performed on the plots to determine the K-factor (soil erodibility) of each soil type. Straw was installed at a rate of 2 tons/acre (4483 kg/ha) to determine the C-factor on each soil type. Each bare soil and straw installation was performed three times for a total of eighteen tests. The following sections provide details on soil loss for each rainfall intensity, recorded test rainfall, calculated K-factor, and calculated C-factor. A discussion is also provided on the effect of soil type on straw performance.

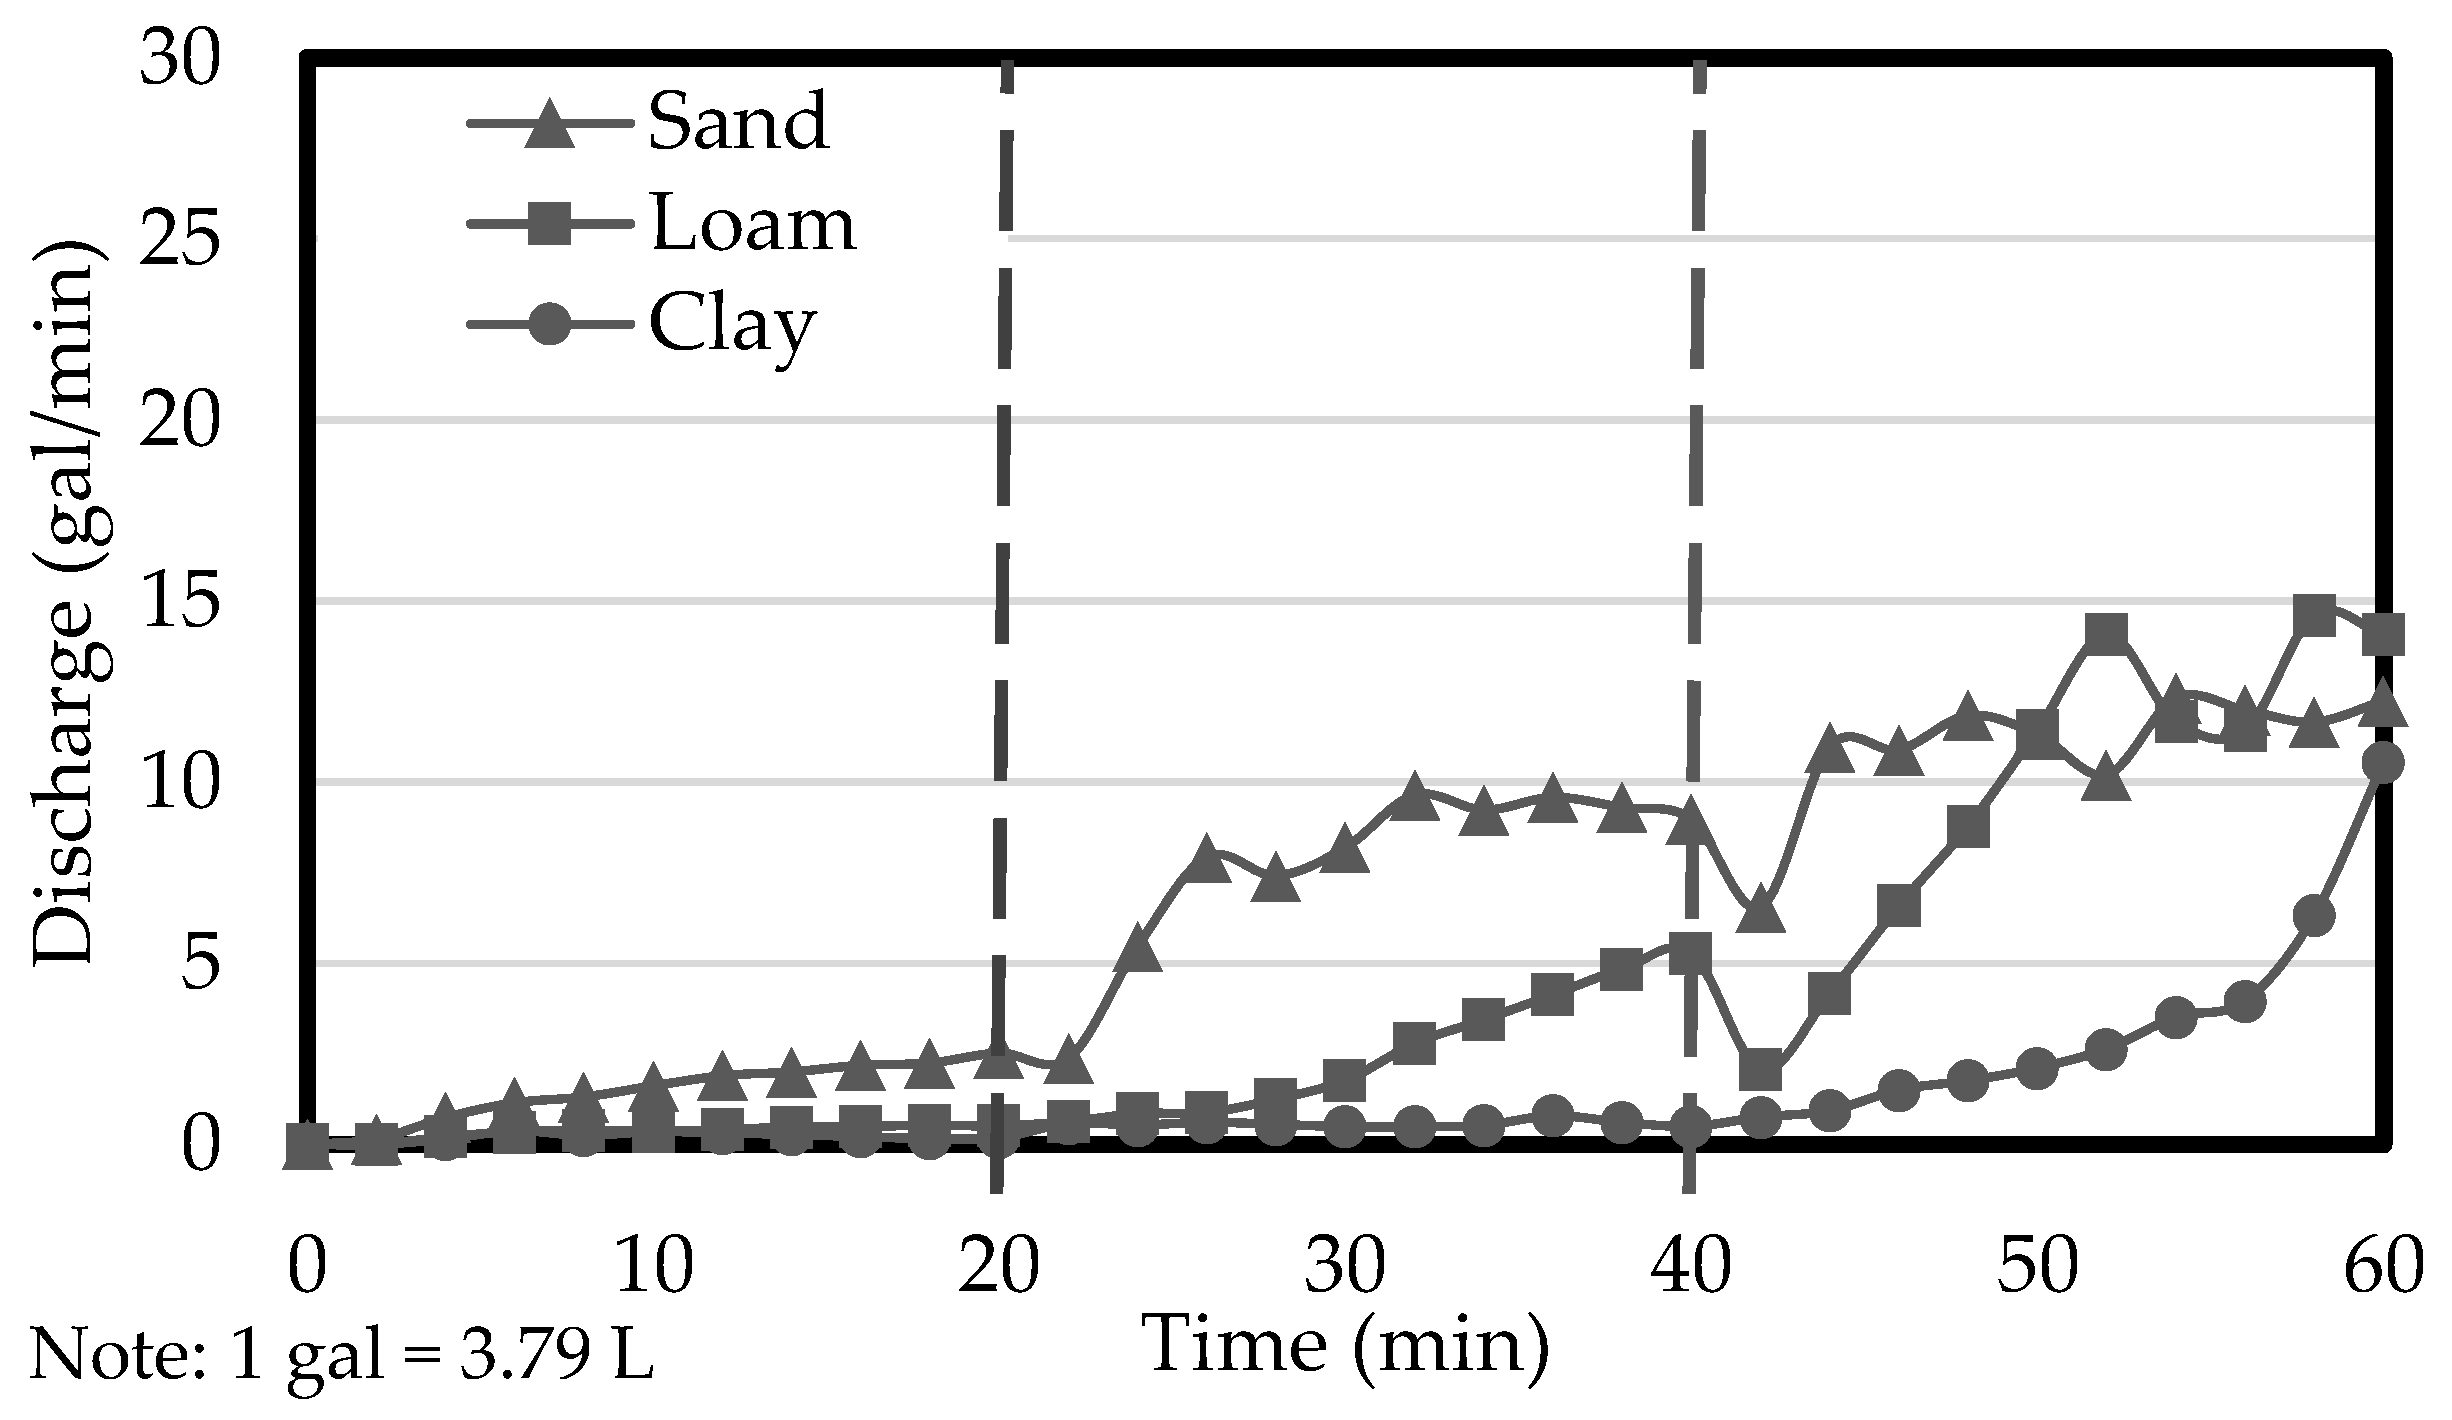
3.1. Bare Soil Test Results

For bare soil control testing, no erosion controls are applied to the slope, and therefore, the C-factor and P-factor are equal to 1. The LS-factor is based on the length and grade of the slope, which is constant between all tests. For a 4:1 slope, the LS-factor is 2.23. The soil loss, or A, in the RUSLE equation is measured from the soil loss from the slopes for each rainfall intensity and measured rain depth. This measure of soil loss is plotted against the measured R-factors for each intensity. This process for determining the R-factor is also thoroughly discussed in [16,17]. The R-factor input into the equation is the theoretical R-factor of 148.51 for the AU-SRF rainfall simulators. The A, or total soil loss, is developed from the theoretical R-factor and the trendline of the measured A for each intensity and the corresponding measured R. With all factors except for the K-factor known, the RUSLE equation is easily rearranged to solve for the K-factor. The results obtained from the bare soil testing provided evidence that the soil loss rates of the sand, clay, and loam soils is consistent with the current understanding of erosion rates with varying soil types. It was observed that sand was the most erodible soil, followed by loam and clay, respectively. The following tables provide a summary of the average results for each soil type, along with the average calculated K-factor.
Table 4 displays the average results of bare soil testing on the sand, loam, and clay plots. Figure 2 shows examples of these plots posttest. The sand soil proved to be the most erodible of the soil types tested. With a calculated average K-factor of 0.37, sand had a substantially higher erosion rate than the loam and clay soils. The loam soil erodibility fell between the sand and clay erodibility. The calculated average K-factor of 0.043 was substantially less than the sand soil. The clay soil was the least erodible of the three soil types tested. The calculated average K-factor of 0.013 was substantially less than the sand or loam soils.
The bare soil testing provided the research team with information on the inherent soil erodibility and K-factors that could be used for calculating the erosion control practice C-factors. The total average soil loss for sand, silt, and clay were 1977.9 lb (897.2 kg), 236.2 lb (107.1 kg), and 114.2 lb (51.8 kg), respectively. The K-factors, as reported by Clopper et al. (2001) for their study, were 0.257, 0.150, and 0.061 for sand, loam, and clay, respectively. Though the soils used are different, resulting in differing K-factors from this study, it is apparent that the soil erodibility follows a similar trend; whereas, clay is by far the least erodible and sand the most with loam falling in between. As K-factors move towards zero, the erosivity of the soil also decreases towards non-erosive. Just as the soils have differing erosivity properties, they also vary, though not as substantially, in runoff properties. Figure 3 provides the average runoff for each soil type during the bare soil testing. Recall that the first 20 min of runoff is 2 in./h (5.08 cm/h), the next 20 min is 4 in./h (10.16 cm/h), and the final 20 min is 6 in./h (15.24 cm/h).
The sand and loam soils produced similar amounts of discharge during the first two rainfall intensities, with the clay soil producing the lowest. However, in the 6 in./h (15.24 cm/h) intensity event, the sand soil produced the greatest average runoff rate of 24.2 gal/min (91.5 L/min); whereas, the loam and clay soils produced average runoff rates of 19.0 gal/min (71.8 L/min) and 13.6 gal/min (51.5 L/min), respectively.

3.2. Straw Test Results

The results obtained from the straw testing provided evidence that straw application can substantially reduce soil loss in comparison to the bare soil control tests. A soil specific C-factor was determined for the sand, loam, and clay soils. With the K-factor for each soil determined through the bare soil control testing previously discussed, when adding a cover management, such as straw mulch, the C-factor in the equation is no longer considered 1 and must be determined by measuring R and A for these erosion control tests and rearranging the RUSLE equation to now solve for the C-factor. It was determined that straw performance was dependent on the soil it was applied to. The following tables provide a summary of the average results for each soil type, along with the average calculated C-factor.
Table 5 displays the average results of straw mulch testing on each soil plot. Figure 4 shows examples of the state of the plots posttest. It was found that straw was effective in terms of C-factor in reducing erosion rates, with a calculated average C-factor of 0.021. It was found that straw performed second to sand in terms of C-factor, with a calculated average C-factor of 0.047. It was found that straw performed the poorest as an erosion control on the clay soil in terms of C-factor, with a calculated average C-factor of 0.193.
It should be noted that though the clay soil had the worst C-factor, the average total soil loss based on the tests was 44.3 lb (20.1 kg), 6.7 lb (3.1 kg), and 17.1 lb (7.8 kg) for sand, loam, and clay, respectively.
It should be noted that Clopper et al. [11] found contradictory results to this study. The straw mulch C-factors calculated for [11] were 0.003, 0.81, and 1.0 for sand, loam, and clay, respectively, which were much higher C-factors for loam and clay compared to this study. It should also be noted again that Clopper et al. performed their tests on 3:1 sloped plots. It is interesting that the clay soil performed many orders of magnitude worse compared to the sand soil for their study; whereas, in this study, there was 60% less clay loss by mass compared to the sand soil during the straw mulch tests. Clopper et al. actually reported mass sluffing occurring during the clay tests, and that there was more soil loss during the straw mulch tests than the bare soil, which would seem contradictory. For their study, the clay soil eroded at a rate of 135 times greater than the sand soil. They hypothesize that this was due to the irregularity in which straw was blown on to their plots and the dislodgement of the straw in some areas, concentrating the flow into what may be considered bordering gully erosion. The mass sluffing was only reported to have occurred in one test; however, they did not provide what the soil loss was for the other tests and whether they would have had a C-factor greater than 1.0 as well.
Tyner et al. [9] reported average soil loss ratios (SLR) for many different erosion controls. The SLR should be considered marginally different from RUSLE’s C-factor but similar enough in nature. RUSLE attempts to normalize variables by providing a means for measuring the effect these variables have on soil loss; whereas, the SLR is simply the ratio of soil loss during an erosion control test versus a bare soil plot test. However, Tyner et al. [9] reported from their extensive literature review that straw, blown or broadcast, has an average SLR of 0.18. This study, using the data displayed in Tables 4–9, found SLRs of 0.02, 0.03, and 0.15 for sand, loam, and clay, respectively. These values are less than the average found by Tyner et al. [9] for the sand and loam soils, but relatively similar for the clay soil. Whereas, based on data provided by Clopper et al. [11], their study’s SLR was 0.00, 0.55, and 2.30 for sand, silt, and clay, respectively.
Not only did the straw affect erosion performance, but it also had a profound effect on runoff rates compared to the bare soil control testing. Figure 5 provides the average runoff rate for each soil type.
All three soil types had somewhat similar runoff patterns during the 2 in./h (5.08 cm/h) event, with the sand soil (1.6 gal/min [6.0 L/min]) showing a slight divergence from the loam and clay soils, which had average runoff rates of 0.37 gal/min (1.4 L/min) and 0.31 gal/min (1.2 L/min), respectively. Once the 4 in./h (10.16 cm/h) event began, the sand soil’s runoff rate jumped quickly, and the loam soil began to rise steadily; whereas, the clay soil remained marginally unchanged from the first rainfall intensity. During the 6 in./h (15.24 cm/h) intensity, the loam soil eventually reached a similar average runoff rate to that of the sand soil, with the clay soil steadily increasing to the point of similar runoff rates to the sand and loam soils at the end of the test. During the final intensity, the sand soil produced the greatest average runoff rate of 11.0 gal/min (41.6 L/min); whereas, the loam and clay soils produced average runoff rates of 9.9 gal/min (37.5 L/min) and 3.5 gal/min (13.3 L/min), respectively.
Though this study followed the ASTM D6459 standardized method for evaluating straw mulch as an erosion control for rainfall-induced erosion, there are several considerations that should be addressed. RUSLE is an adoption of an observational study that created the equation to predict annual soil loss from an area based upon the site and climactic conditions for that specific area. Though there has been some consideration given to seasonal erosivity related to storm patterns, there is not a direct correlation between sediment loss and storm events in RUSLE. There is only the measure of erosivity created by the rainfall intensity, along with drop size and drop velocity. Whereas rainfall-induced erosion is also a component of the runoff created by the rainfall, runoff is not directly considered in the RUSLE equation. Factors such as K- and LS-factors will have an effect on runoff, but the extent is unknown from the base data collected. Though this study did collect runoff and, therefore, discharge rates over time, these data had no bearing on determining the K- and C-factors. Also, consider that the ASTM D6459 test produces a storm event of 4 in./h. This would equate to just under a 500-year storm event in Opelika, AL, where the AU-SRF facility is located. The intent of the ASTM standards’ intensities is to provide a substantial amount of erosivity to the plots in a short amount of time. The ramifications of this are unknown and potentially biases the data away from real-life results. The balance of standardization and applicability must be accounted for, at which it may be argued that ASTM D6459 does not meet the applicability threshold, whatever that may be. Future studies may look at direct comparison on results that provide more applicably simulated rainfall events against the results of ASTM D6459. The results of this may warrant changes in the standard testing method or development of other standard methods that better represent the climactic conditions these products or practices will more likely be exposed to.

4. Conclusions

The RUSLE equation attempts to normalize the effects of rainfall erosivity, soil type, and slope characteristics so that a single uniform cover management factor, or C-factor, can be determined for different soil cover scenarios. However, based on this study, the C-factor was evidently soil specific when managing all other variables, as specified by ASTM D6459. The results of straw mulch testing did provided evidence that straw can provide a cost-effective solution to minimizing sediment loss on construction sites for sand, clay, or loam soils. The different soils also produced different discharge rates that likely directly affect the erosion rates of the plots. Though the ASTM method tends to focus on rainfall erosivity as the means for analysis, the variability of the runoff and erosivity from it should not be overlooked.
It is apparent from both this study and [11] that broadcasted or blown straw can be an effective erosion control, though it may be variable for different soil types. It was interesting to see that although this study and Clopper et al.’s study had similar K-factors, the resulting C-factors under similar conditions were very different. It is not clear whether the slope or soil differences played a larger role in these results, but these are concerns that should be evaluated further. It is the intent of the authors of this study to continue performing standardized tests following ASTM D6459, but also to evaluate these practices on 3:1 slopes as well as on slopes that have been dressed with topsoil, as is typically recommended or required by permitting agencies. However, this current study has shown that straw mulch is an effective erosion control for protecting bare earthen surfaces from rainfall-induced erosion and should be considered at least for areas that are sloped 4:1 or less. Further analysis will help determine if at steeper slopes, the same erosion control efficacy holds true or if results align more closely to other studies previously discussed.
Practitioners should be wary when applying manufacturer-supplied C-factors when trying to determine predicted soil loss on construction sites. This statement is not placing onus on the manufacturers, rather the limited results the standard method provides. As shown through this study, when holding all other variables constant, the resultant cover management factor can be substantially different simply based upon the soil types the erosion controls are attempting to manage. Though RUSLE is a good tool to use when predicting soil loss, the application and usefulness of the estimates developed by the equation should align the validity of the inputs put into it.

Author Contributions

The authors confirm that the contributions to this paper were as follows: study conception and design: M.P., W.N.D., X.F. and J.R.C.; data collection: J.R.C. and W.N.D.; analysis and interpretation of results: J.R.C., M.P., W.N.D. and X.F., draft manuscript preparation: J.R.C., W.N.D., M.P. and X.F. All authors have read and agreed to the published version of the manuscript.

Funding

This research was funded by the Alabama Department of Transportation grant 931-016.

Data Availability Statement

Data, including photos and videos from testing and other testing data, are available upon request from the authors.

Conflicts of Interest

The authors declare no conflicts of interest.

References

  1. Allen, S. Evaluation and Standardization of Rolled Erosion Control Products. Geotext. Geomembr. 1996, 1, 207–221. [Google Scholar] [CrossRef]
  2. Ziegler, A.; Sutherland, R. Influence of Rolled Erosion Control Systems on Temporal Rainsplash Response—A Laboratory Rainfall Simulation Experiment. Land Degrad. Dev. 1996, 8, 139–157. [Google Scholar] [CrossRef]
  3. Telles, T.; Guimarães, M.; Dechen, S. The costs of soil erosion. Rev. Bras. Cienc. Solo 2011, 35, 287–298. [Google Scholar] [CrossRef]
  4. Panagos, P.; Matthews, F.; Patault, E.; De Michele, C.; Quaranta, E.; Bezak, N.; Borrelli, P. Understanding the cost of soil erosion: An assessment of the sediment removal costs from the reservoirs of the European Union. J. Clean. Prod. 2024, 434, 140–183. [Google Scholar] [CrossRef]
  5. Sutherland, R. Rolled Erosion Control Systems for Hillslope Surface Protection: A Critical Review, Synthesis, and Analysis of Available Data. Land Degrad. Dev. 1998, 1, 465–486. [Google Scholar] [CrossRef]
  6. Li, M. Evaluating erosion control performance of crimped straw mulch in comparison with RECPs on simulated highway roadsides. Int. J. Geotech. Eng. 2014, 8, 307–314. [Google Scholar] [CrossRef]
  7. Lee, G.; McLaughlin, R.; Whitely, K.; Brown, V. Evaluation of seven mulch treatments for erosion control and vegetation establishment on steep slopes. J. Soil Water Conserv. 2018, 73, 434–442. [Google Scholar] [CrossRef]
  8. ASTM D6459; Standard Test Method for Determination of Rolled Erosion Control Product (RECP) Performance in Protecting Earthen Channels from Stormwater-Induced Erosion. ASTM: West Conshohocken, PA, USA, 2019; pp. 1–6.
  9. Tyner, J.; Yoder, D.; Chomicki, B.; Tyagi, A. A review of construction site best management practices for erosion control. Trans. ASABE 2011, 54, 441–450. [Google Scholar] [CrossRef]
  10. Manning, C.; Faulkner, B.; Donald, W.; Perez, M. Comparison of Erosion Control Products Using an ASTM D6459 Rainfall Simulator: Insights and Suggestions. J. Irrig. Drain. Eng. 2023, 149, 04023017. [Google Scholar] [CrossRef]
  11. Clopper, P.; Vielleux, M.; Johnson, A. Quantifying the performance of hillslope erosion control best management practices. In Bridging the Gap: Meeting the World’s Water and Environmental Resources Challenges, Proceedings of the World Water and Environmental Resources Congress 2001, Orlando, FL, USA, 20–24 May 2001; American Society of Civil Engineers: Reston, VA, USA, 2001; pp. 1–10. [Google Scholar]
  12. Li, M.H.; McFalls, J.; Yi, Y.J. Comparing Erosion Control Products’ Performance Results from Field and Large-Scale Laboratory Testing. Indian Geotech. J. 2013, 43, 382–387. [Google Scholar] [CrossRef]
  13. Schussler, J.; Perez, M.; Donald, W.; Whitman, J.; Zech, W.; Fang, X.; Fagan, B. Decade of Research in Review at the Auburn University Stormwater Research Facility. Transp. Res. Rec. 2022, 2676, 590–604. [Google Scholar] [CrossRef]
  14. Renard, K.; Foster, G.; Weesies, G.; Porter, J. RUSLE Revised Universal Soil Loss Equation. J. Soil Water Conserv. 1991, 46, 30–33. [Google Scholar]
  15. Renard, K. Predicting Soil Erosion by Water: A Guide to Conservation Planning with the Revised Universal Soil Loss Equation (RUSLE); US Department of Agriculture, Agricultural Research Service: Washington, DC, USA, 1997. [Google Scholar]
  16. Manning, C. Rainfall Simulator Construction and Evaluation of Erosion Control Practices. Master’s Thesis, Auburn University, Auburn, AL, USA, 2021. [Google Scholar]
  17. Etheridge, J. Construction and Calibration of Large-Scale Rainfall Simulators. Master’s Thesis, Auburn University, Auburn, AL, USA, 2023. [Google Scholar]
  18. ASTM D698; Standard Index Test Method for Laboratory Compaction Characteristics of Soil Using Standard Effort (12,400 ft-lbf/ft3 (600 kN-m/m3)). ASTM: West Conshohocken, PA, USA, 2012; pp. 1–13.
Figure 1. AU-SRF rainfall simulator apparatus: (a) rainfall trees orientation, (b) water supply manifold.
Water 16 02819 g001
Figure 2. Bare soil control posttest (a) sand soil, (b) clay soil, and (c) loam soil.
Water 16 02819 g002
Figure 3. Average runoff rate of each soil type plot during bare soil control testing.
Water 16 02819 g003
Figure 4. Straw mulch posttests results (a) sand soil, (b) clay soil, and (c) loam soil.
Water 16 02819 g004
Figure 5. Average runoff rate of each soil type plot during straw mulch testing.
Water 16 02819 g005
Table 1. Soil grain sizes and plasticity indexes required by ASTM D6459.
Particle Size (mm)SandLoamClay
D10025 > D100 > 3.010 > D100 > 0.33.0 > D100 > 0.02
D854.0 > D85 > 0.80.8 > D85 > 0.080.08 > D85 > 0.003
D500.9 > D50 > 0.20.15 > D50 > 0.0150.015 > D50 > 0.0008
D150.3 > D15 > 0.010.03 > D15 > 0.001D15 < 0.002
Plasticity IndexN/A (non-plastic)2 < PI <810 < PI
Table 2. Intensity calibration for AU-SRF rainfall simulator [17].
Target Intensity, in./h (cm/h)2.0 (5.08)4.0 (10.16)6.0 (15.24)
ASTM D6459-19 20-Rainfall Gauge Test
in./h (cm/h)
2.1 (5.33)4.2 (10.67)6.3 (16.00)
Christiansen Uniformity (%)82.24%83.35%81.1%
ASTM D6459-19 Method Percent Error from Target Intensity (%)7.0%4.5%4.7%
Table 3. Average mass distributions by target intensity of AU-SRF rainfall simulator [17].
Bin Size (mm)2.0 in./h
(5.08 cm/h)
4.0 in./h
(10.16 cm/h)
6.0 in./h
(15.24 cm/h)
2.38 to 4.760.00%1.92%4.52%
2 to 2.3838.39%35.70%27.95%
1.68 to 212.22%13.32%31.77%
1.19 to 1.6821.50%21.45%16.09%
0.841 to 1.1919.27%18.19%11.98%
0.595 to 0.8418.63%9.42%7.69%
Table 4. Results of bare soil 4:1 plot tests to develop K-factors.
Soil TypeParameterValues
Target Intensity, in./h246
(cm./h)(5.08)(10.16)(15.24)
SandExperimental Avg. Intensity, in./h 2.454.185.67
(cm./h)(6.22)(10.62)(14.4)
Avg. Dry Weight of Soil Loss., lb 325.95284.581367.33
(kg)(147.85)(129.08)(620.21)
K-Factor Avg. (Sand)0.37
LoamExperimental Avg. Intensity, in./h 2.323.976
(cm./h)(5.98)(10.08)(15.24)
Avg. Dry Weight of Soil Loss., lb16.1874.69145.3
(kg)(7.34)(33.88)(65.91)
K-Factor Avg. (Loam)0.043
ClayExperimental Avg. Intensity, in./h 2.484.426.95
(cm./h)(6.3)(11.23)(17.65)
Avg. Dry Weight of Soil Loss., lb5.0621.9787.17
(kg)(7.34)(33.88)(65.91)
K-Factor Avg. (Clay)0.013
Table 5. Results of straw 4:1 plot tests to determine C-factors.
Soil TypeParameterValues
Target Intensity, in./h246
(cm./h)(5.08)(10.16)(15.24)
SandExperimental Avg. Intensity, in./h 2.344.186.33
(cm./h)(5.94)(10.62)(16.08)
Avg. Dry Weight of Soil Loss., lb3.4512.1928.67
(kg)(7.61)(26.87)(63.21)
C-Factor Avg. 0.021
LoamExperimental Avg. Intensity, in./h 2.283.905.38
(cm./h)(5.79)(9.91)(13.67)
Avg. Dry Weight of Soil Loss., lb0.911.863.97
(kg)(0.41)(0.84)(1.80)
C-Factor Avg. 0.047
ClayExperimental Avg. Intensity, in./h 2.454.686.75
(cm./h)(6.22)(11.89)(17.15)
Avg. Dry Weight of Soil Loss., lb1.642.7912.7
(kg)(0.74)(1.27)(5.76)
C-Factor Avg. 0.193
Disclaimer/Publisher’s Note: The statements, opinions and data contained in all publications are solely those of the individual author(s) and contributor(s) and not of MDPI and/or the editor(s). MDPI and/or the editor(s) disclaim responsibility for any injury to people or property resulting from any ideas, methods, instructions or products referred to in the content.

