Article

Evaluation of Groundwater Resources in the Middle and Lower Reaches of Songhua River Based on SWAT Model

1
School of Hydraulic and Electric Power, Heilongjiang University, Harbin 150080, China
2
Institute of Groundwater Cold Region, Heilongjiang University, Harbin 150080, China
3
International Joint Laboratory of Hydrology and Hydraulic Engineering in Cold Regions of Heilongjiang Province, Harbin 150080, China
*
Author to whom correspondence should be addressed.
Water 2024, 16(19), 2839; https://doi.org/10.3390/w16192839
Submission received: 6 September 2024 / Revised: 28 September 2024 / Accepted: 3 October 2024 / Published: 6 October 2024

Abstract

:
The SWAT model primarily investigates sources of water pollution and conducts ecological assessments of surface water in contemporary hydrology and water resources research. To date, there have been limited accomplishments in the study of groundwater resources in China. The MODFLOW model currently primarily simulates groundwater levels and the migration of water quality, depending on the hydrological surface water data in the relevant area. This study aims to investigate the groundwater distribution characteristics of the middle and lower reaches of the Songhua River, a significant agricultural and grain production region in China. The research focuses on the middle and lower reaches of the Songhua River basin in Northeast China and employed the SWAT distributed hydrological model to simulate runoff. The monthly recorded runoff at Tongjiang Station in Jiamusi City was utilized to calibrate the model parameters. Consequently, the MODFLOW model was introduced to compare and assess the simulation outcomes of the SWAT model, ultimately ascertaining the distribution characteristics of shallow groundwater, groundwater recharge, recoverable volume, and groundwater levels in the Songhua River Basin. The findings indicate that: (1) The SWAT model demonstrates efficacy in the study region, achieving R2 and NS values of 0.81 and 0.76, respectively, thereby fulfilling the fundamental criteria for scientific research. The MODFLOW model exhibits strong performance in the study region, achieving a periodic R2 of 0.98 and a verification R2 of 0.97, with the discrepancy between simulated and actual groundwater levels confined to 0.6 m, thereby satisfying the criteria for scientific research. (2) In 2011, 2014, and 2016, the groundwater recharge in the middle and lower sections of the Songhua River was 24.33 × 10⁸ m3, 30.79 × 10⁸ m3, and 32.25 × 10⁸ m3, respectively, aligning closely with the SWAT simulation results, while the average annual groundwater level depth was 8.17 m. (3) In the research area, groundwater recharging occurs primarily by atmospheric precipitation, while drainage predominantly transpires via groundwater as base flow, constituting 81.46%. Secondly, the recharge of shallow groundwater to deep aquifers is around 7.14%, with a minimal share attributed to vadose zone loss, constituting merely 2.1%. (4) From 2010 to 2016, the average groundwater runoff modulus of the middle and lower reaches of the Songhua River basin was 1.005 L/(s·km²), with a total recharge of 216.58 × 10⁸ m3 and a total recoverable amount of 105.11 × 10⁸ m3. The mean yearly supply was 25.11 × 10⁸ m3. The total groundwater recharge was 26.54 × 10⁸ m3 in the driest year (2011) and 33.25 × 10⁸ m3 in the year of most ample water (2016).

1. Introduction

The Songhua River Basin possesses abundant groundwater resources, supplying fresh water for agricultural crop development in Heilongjiang Province [1]. Specifically, in the middle and lower reaches of the Songhua River basin (Jiamusi Tongyi River basin, the principal stream of the Songhua River), the groundwater resource recharge for the entire agricultural area of Heilongjiang Province constitutes 50.1% [2] of the total natural supply for the Sanjiang Plain. Nonetheless, swift economic advancement over the past three decades has led to over-cultivation of paddy fields and imprudent management of water resources [3], resulting in significant environmental and ecological issues, including the depletion of groundwater levels and land subsidence, which have emerged as critical impediments to the sustainable development of the economy and society. Comprehending the condition and regulatory framework of regional groundwater resources is essential for their judicious development [4]. Consequently, it is imperative to enhance the assessment of groundwater resources in the middle and lower sections of the Songhua River Basin and to diversify the methodologies for water resource evaluation [5,6,7].
The SWAT model (Soil and Water Assessment Tool) is a distributed hydrological model developed for the United States Department of Agriculture, renowned globally for its robust physical simulation capabilities. This model effectively simulates the hydrological cycle of a basin based on environmental parameters, including basin climate, soil, and land use in the research region [8]. The SWAT model currently emphasizes the assessment of water pollution sources and surface water ecology in hydrological research [9]. Otherwise, there have been limited scientific advancements in the assessment of groundwater resources. Recently, domestic scholars Chen Peiyuan [10] and Zhao Liangjie [11] conducted a preliminary investigation. Chen Peiyuan employed the SWAT model to analyze groundwater distribution features and assess water resources in the Jinghe River Basin. The ultimate runoff rate R2 and NS attained values of 0.83 and 0.7, respectively, and the computed groundwater resources aligned with the Groundwater Resources Assessment Report published by the local government. The SWAT model was deemed appropriate for simulating shallow groundwater resources and satisfied the fundamental criteria for scientific investigation. Zhao Liangjie initially classified hydrological characteristics using the rainfall guarantee rate, based on runoff simulations conducted using the SWAT model. The groundwater runoff modulus parameter inversion and rainfall infiltration coefficient approach were employed to validate the runoff modulus. In conclusion, utilizing the runoff modulus approach to address groundwater storage simulated by the SWAT model is both possible and effective for calculating groundwater resources. Furthermore, Li Yuanjie et al. [12] developed a MODFLOW model for Linhe District of Bayanzhur City, Inner Mongolia, and assessed water resources utilizing the water balance approach and numerical simulation technique [13]. Zhu Henghua [14] et al. employed MODFLOW to assess the groundwater model of Licheng District in Jinan City, utilizing the PEST module to calibrate the permeability coefficient. The model assessed the potential increase in shallow groundwater, provided that the groundwater level does not decrease further. Zhang Hongwei et al. [14] developed a groundwater flow model for Linqing City, Shandong Province, and examined the variations in groundwater levels under various rainfall scenarios. The findings indicated that the peak groundwater level during rainy years was 3 m more than in dry years. Foreign scientists Nguyen Ngoc [15]and colleagues utilized Visual Modflow to develop a groundwater flow model for Dak Lak. The research findings indicated that the reliability of the MODFLOW model’s computed outputs is significantly high, even with limited drilling data. The impacts of recharge and evaporation on groundwater resources and water balance were examined under several climate change scenarios (RCP4.5 and RCP8.5). BUSHIRA K M [16] et al. employed the MODFLOW module in ModelMuse to construct an underground flow model for the Colorado basin in Mexico and calibrated both the steady-state surface and subterranean flow models. Xiaolong Li et al. [17] developed a groundwater flow model for the Manas River basin in China and evaluated the groundwater levels of 43 representative observation wells. The simulation outcome was favorable. During standard operation of the pumping wells, the groundwater level declined at a rate of 0.15 m/d.
Consequently, based on the aforementioned research context and prior experience, this paper focuses on the middle and lower reaches of the Songhua River, a national key agricultural production base, as the subject of study. It analyzes the groundwater recharge outcomes derived from the SWAT and MODFLOW models, validates the feasibility of the results, and subsequently delineates the groundwater levels in the study area. For thorough assessment, this paper employs the groundwater runoff modulus method to calculate various results simulated by the SWAT model, ultimately determining groundwater recharge in the study area and identifying groundwater distribution characteristics in the middle and lower reaches of the Songhua River. This research is highly important for the management of regional water resources and the rehabilitation of regional groundwater levels.

2. Overview of the Study Area

The middle and lower reaches of the Songhua River watershed encompass the segment of the river extending from Jiamusi to Tongjiang, measuring a total length of 267 km. This section traverses the Sanjiang Plain, characterized by alluvial plains on either side, flat topography, abundant vegetation, and relatively unobstructed rivers and banks. The waterways intersect extensively, with riverbanks ranging from 5 to 10 km in width, and numerous shoals present within the river. The location is situated in the northern temperate monsoon climate zone, characterized by prolonged cold winters and warm, wet summers. The annual average temperature ranges from −3 to 5 °C, with a maximum of 40 °C and a minimum of −50 °C. The basin experiences yearly average precipitation of approximately 500 mm, with an average annual runoff of 762 × 108 m3, and exhibits a distinct interannual fluctuation characterized by alternating periods of abundance and stagnation [18,19]. The primary river basin is characterized by valley terrace landforms alongside the Songnen Plain, Sanjiang Plain, and additional plain landforms. The soil types primarily consist of basic black soil, calcareous alluvial soil, saturated thin layer soil, soft shallow soil, organic soil, anthropogenic accumulation soil, simple active luvisol, and saturated conical soil [20]. This region encompasses a large area with significant variations in hydrogeological conditions, groundwater depth, distribution, and water quality. The groundwater aquifers mostly consist of loose rock pore water, clastic rock pore fracture water, and bedrock fracture water. Loose rocks constitute the most extensive pore water distribution area and reserves, with the aquifer lithology comprising Quaternary sand, sand gravel, and gravel. The aquifer thickness varies from 10 to 300 m, the groundwater level is typically less than 10 m deep, the water yield is substantial, and the inflow rate of an individual well generally runs from 500 to 3000 cubic meters per day. The predominant chemical composition of the groundwater is either calcium bicarbonate- or sodium calcium-type, with salinity generally below 1 g/L [21]. The second type is pore fissure water found in clastic rock, located beneath the Quaternary aquifer formations in the plains of China (visible in certain regions) and within the meso-Cenozoic depression (fault) basins in mountainous locations such as Mudanjiang, Qitaihe, Shuangyashan, and Jixi. The aquifer consists of Neogene, Paleogene, Cretaceous, and Jurassic sand, sand conglomerate, and coal measures. The lithology, thickness, and burial depth of the aquifers exhibit significant variability, the water abundance is highly inconsistent, and the groundwater possesses a particular pressure. The structural complex contains a greater abundance of water. Bedrock fissure water is predominantly found in extensive bedrock mountainous regions and lava plateau areas. Water-bearing fissures can be categorized into structural fissure water, weathering fissure water, and basalt cavity fissure water, based on their formation and functional properties, with the latter being found in the southeastern region of the middle and lower reaches of the Songhua River. The distribution and degree of water richness in bedrock fissure water are influenced by lithology, topography, hydrology, and meteorological conditions, resulting in considerable variability in their water-rich characteristics, thus rendering them generally unsuitable for large-scale centralized water delivery. The groundwater in the research area is characterized by low salinity and is classified as bicarbonate-type freshwater [22]. The hydrological cycle of the bedrock fissures in the eastern mountainous region is robust, primarily replenished by air precipitation. Following a brief runoff, a portion is replenished by subterranean runoff during transit. The overview of the study area is shown in Figure 1.
Figure 1. A comprehensive diagram of the study region. (a) represents the subwatershed zoning map created using the SWAT model (ArcSWAT2012). (b) displays a geographic elevation map of the study region. (c,d) illustrate the distribution of soil types and land use, respectively, in the study area. The details of (c) can be found in Table 1, while the details of (d) can be found in Table 5).
Water 16 02839 g001
Table 1. Comparison table of soil types and abbreviations of land use types in the study area.
Name AbbreviationDescriptionName AbbreviationDescription
ATcAnthropogenic accumulationHSsOrganic soil
CMeSaturated protosolLVhSimple high activity luvisols
FLcCalcareous alluvial soilPHhSimple black soil
GLmMollic gleysolWATERWater body

3. Data and Methods

3.1. Data Sources

3.1.1. Digital Elevation Model (DEM)

Research indicates that when utilizing SWAT for runoff simulation, the elevation map chosen as the operational data source should have a spatial resolution ranging from 20 to 150 m [23]. This study utilized digital elevation model (DEM) data with a spatial resolution of 30 m, obtained from the NASA Earth Science data website, to extract pertinent parameters of the watershed.

3.1.2. Soil Type Data

The soil database included the spatial distribution and physical characteristics of various soils within the research area. This report states that the resolution of the 2010 soil data at 1:100,000 was 1000 km2. To ensure the model operates efficiently and to streamline the development of the soil database, numerous soil types were reclassified based on their physical parameters, adhering to the principle of maximizing the proportion of soils with identical physical properties. The classification yielded eight distinct soil categories. Table 2 displays the precise proportion of each predominant soil type within the eight categorized soil classifications.
This study details the derivation of soil data parameters for the SWAT (SWAT2012)model using SPAW [24] (Soil Profile Water Transfer,SPAW software version: 6.02.75) software, where the carbon content in the soil layer must be converted into organic mass before being fed into the SPAW software for analysis. The database includes the quantities of soil gravel, clay loam, and clay. To enable the computation of USLE-K parameters within the model, the substitution formula suggested by Williams was utilized [25]. The precise numbers for soil layer 1 and soil layer 2 from the final calculations are shown in Table 3, while the corresponding explanations of the soil physical coefficients referenced in Table 3 are detailed in Table 4.

3.1.3. Land Use Type Data

The land use data were derived from the 2022 global land cover dataset with a 30-m resolution, published by the Academy of Aerospace Information Innovation, part of the Chinese Academy of Sciences. The land use types in the research region were divided into six categories: cultivated land, forest land, grassland, water bodies, a combination of urban and rural areas, industrial and mining land and residential land, and fallow land. Table 5 displays the relevant categories of model inputs.

3.1.4. Meteorological Data and Runoff Data

The meteorological database component of the SWAT model consists of two phases: the initial phase involves inputting the recorded meteorological data into the SWAT model’s original file; the subsequent phase entails constructing a weather generator based on the research area’s parameters and objectives. The primary meteorological data utilized are daily records of precipitation, temperature, relative humidity, sun radiation, and wind velocity. The meteorological data included in this work were CMADSV1.1 data obtained from the National Tibetan Plateau Scientific Data Center [26]. The duration spans from 2008 to 2016, effectively aligning with the temporal parameters of the model’s operation. This database is among the most extensively utilized meteorological datasets for the SWAT model. This database satisfies the accuracy criteria for the model’s final output outcomes after extensive utilization by numerous scholars [27]. This article utilized DEM data from the middle and lower portions of the Songhua River basin, selecting precipitation, temperature, relative humidity, solar radiation, and wind speed from 60 meteorological stations in the study area as experimental meteorological data. Monthly runoff data from the Tongjiang Hydrological Station, situated at the basin’s complete exit, were picked for the period from 2008 to 2016. Table 6 presents the data sources utilized for constructing the SWAT model.

3.2. Research Methods

3.2.1. SWAT Model

The hydrological process of the SWAT model comprises two components: the surface simulation stage and the subsurface simulation stage [28]. The surface simulation phase comprises two stages: runoff production and slope confluence, which regulate the influx of water and solute from each sub-basin to the principal river. The water surface simulation phase involves the confluence of rivers and reservoirs, modeling the transport dynamics of water and solutes to the basin’s total output. The water balance equation utilized to simulate the hydrological cycle is presented in Equation (1).
S W t = S W 0 + i = 1 t R d a y , i Q s w f , i E a , j W s e e p , i Q g w , i
where S W t is the soil water content at the end of the period, mm; S W 0 is the soil water content at the beginning of the period, mm; t is the calculation period; R d a y , i is the rainfall on day i , mm; S s u r f , i is the surface runoff on day i , mm; E a , i is the evaporation amount on day i , mm; W s e e p , i is the permeability on day i , mm; Q g w is the underground runoff on day i , mm.
SWAT models are capable of simulating surface water, soil water, and groundwater dynamics. The basin can be further divided into several natural sub-basins according to its actual topography, thereby mitigating the influence of spatio-temporal variations in natural factors on simulation outcomes, and additionally delineating relevant hydrological units within each sub-basin for collaborative simulation of changing features [29]. Figure 2 illustrates the schematic diagram of its principle.

3.2.2. Shallow Aquifer Reservoir Variable Calculation Method

Based on the calculation principle of groundwater balance [30], the calculation formula for shallow aquifer reservoir variables is as follows:
Δ S g w = P E R C G W Q R E V A P D A R C
where Δ S g w is the shallow aquifer reservoir variable (mm); P E R C is the leakage water in the vadose zone (mm); R E V A P is the water quantity retained in the aquifer vadose zone (mm); D A R C is the seepage volume of the deep aquifer (mm); G W Q is the contribution of underground runoff to the main river course (mm).
The groundwater runoff modulus method [31] is used to calculate the natural supply of the basin, and the specific formula is as follows:
Q = M × F × t × 10 7
where Q is the natural supply amount (104 m3); M is the groundwater runoff modulus (L/(s·km2)); F is the catchment area (km2); t is time (s). The groundwater runoff modulus is M calculated as follows:
M y e a r = W y e a r F × t × 1000
where W y e a r is the average underground runoff in the time step (m3); F is the catchment area (km2); t is time (s).

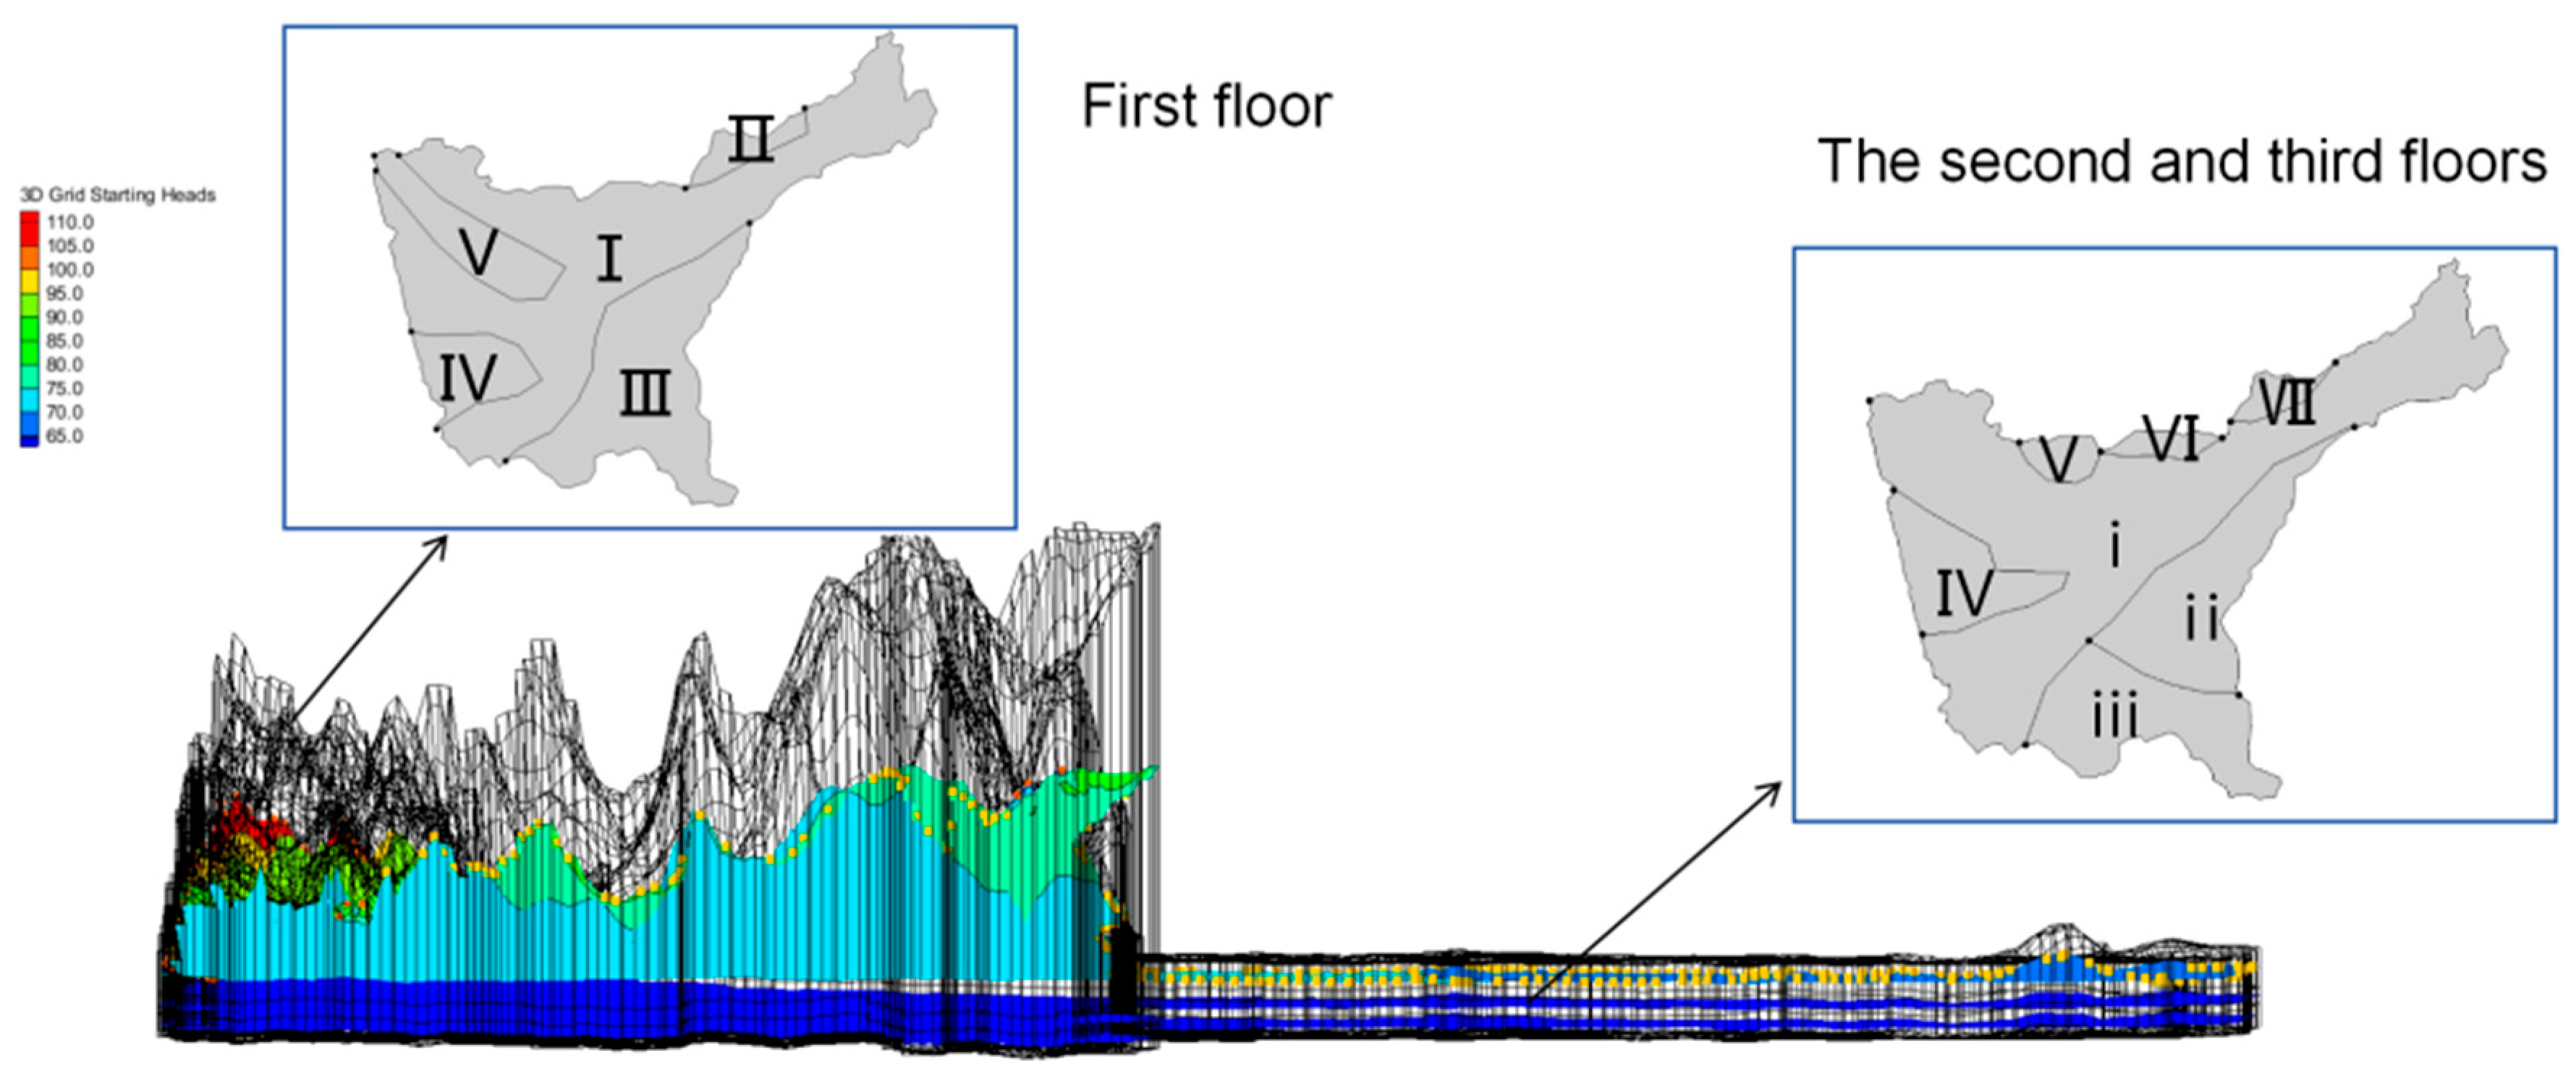
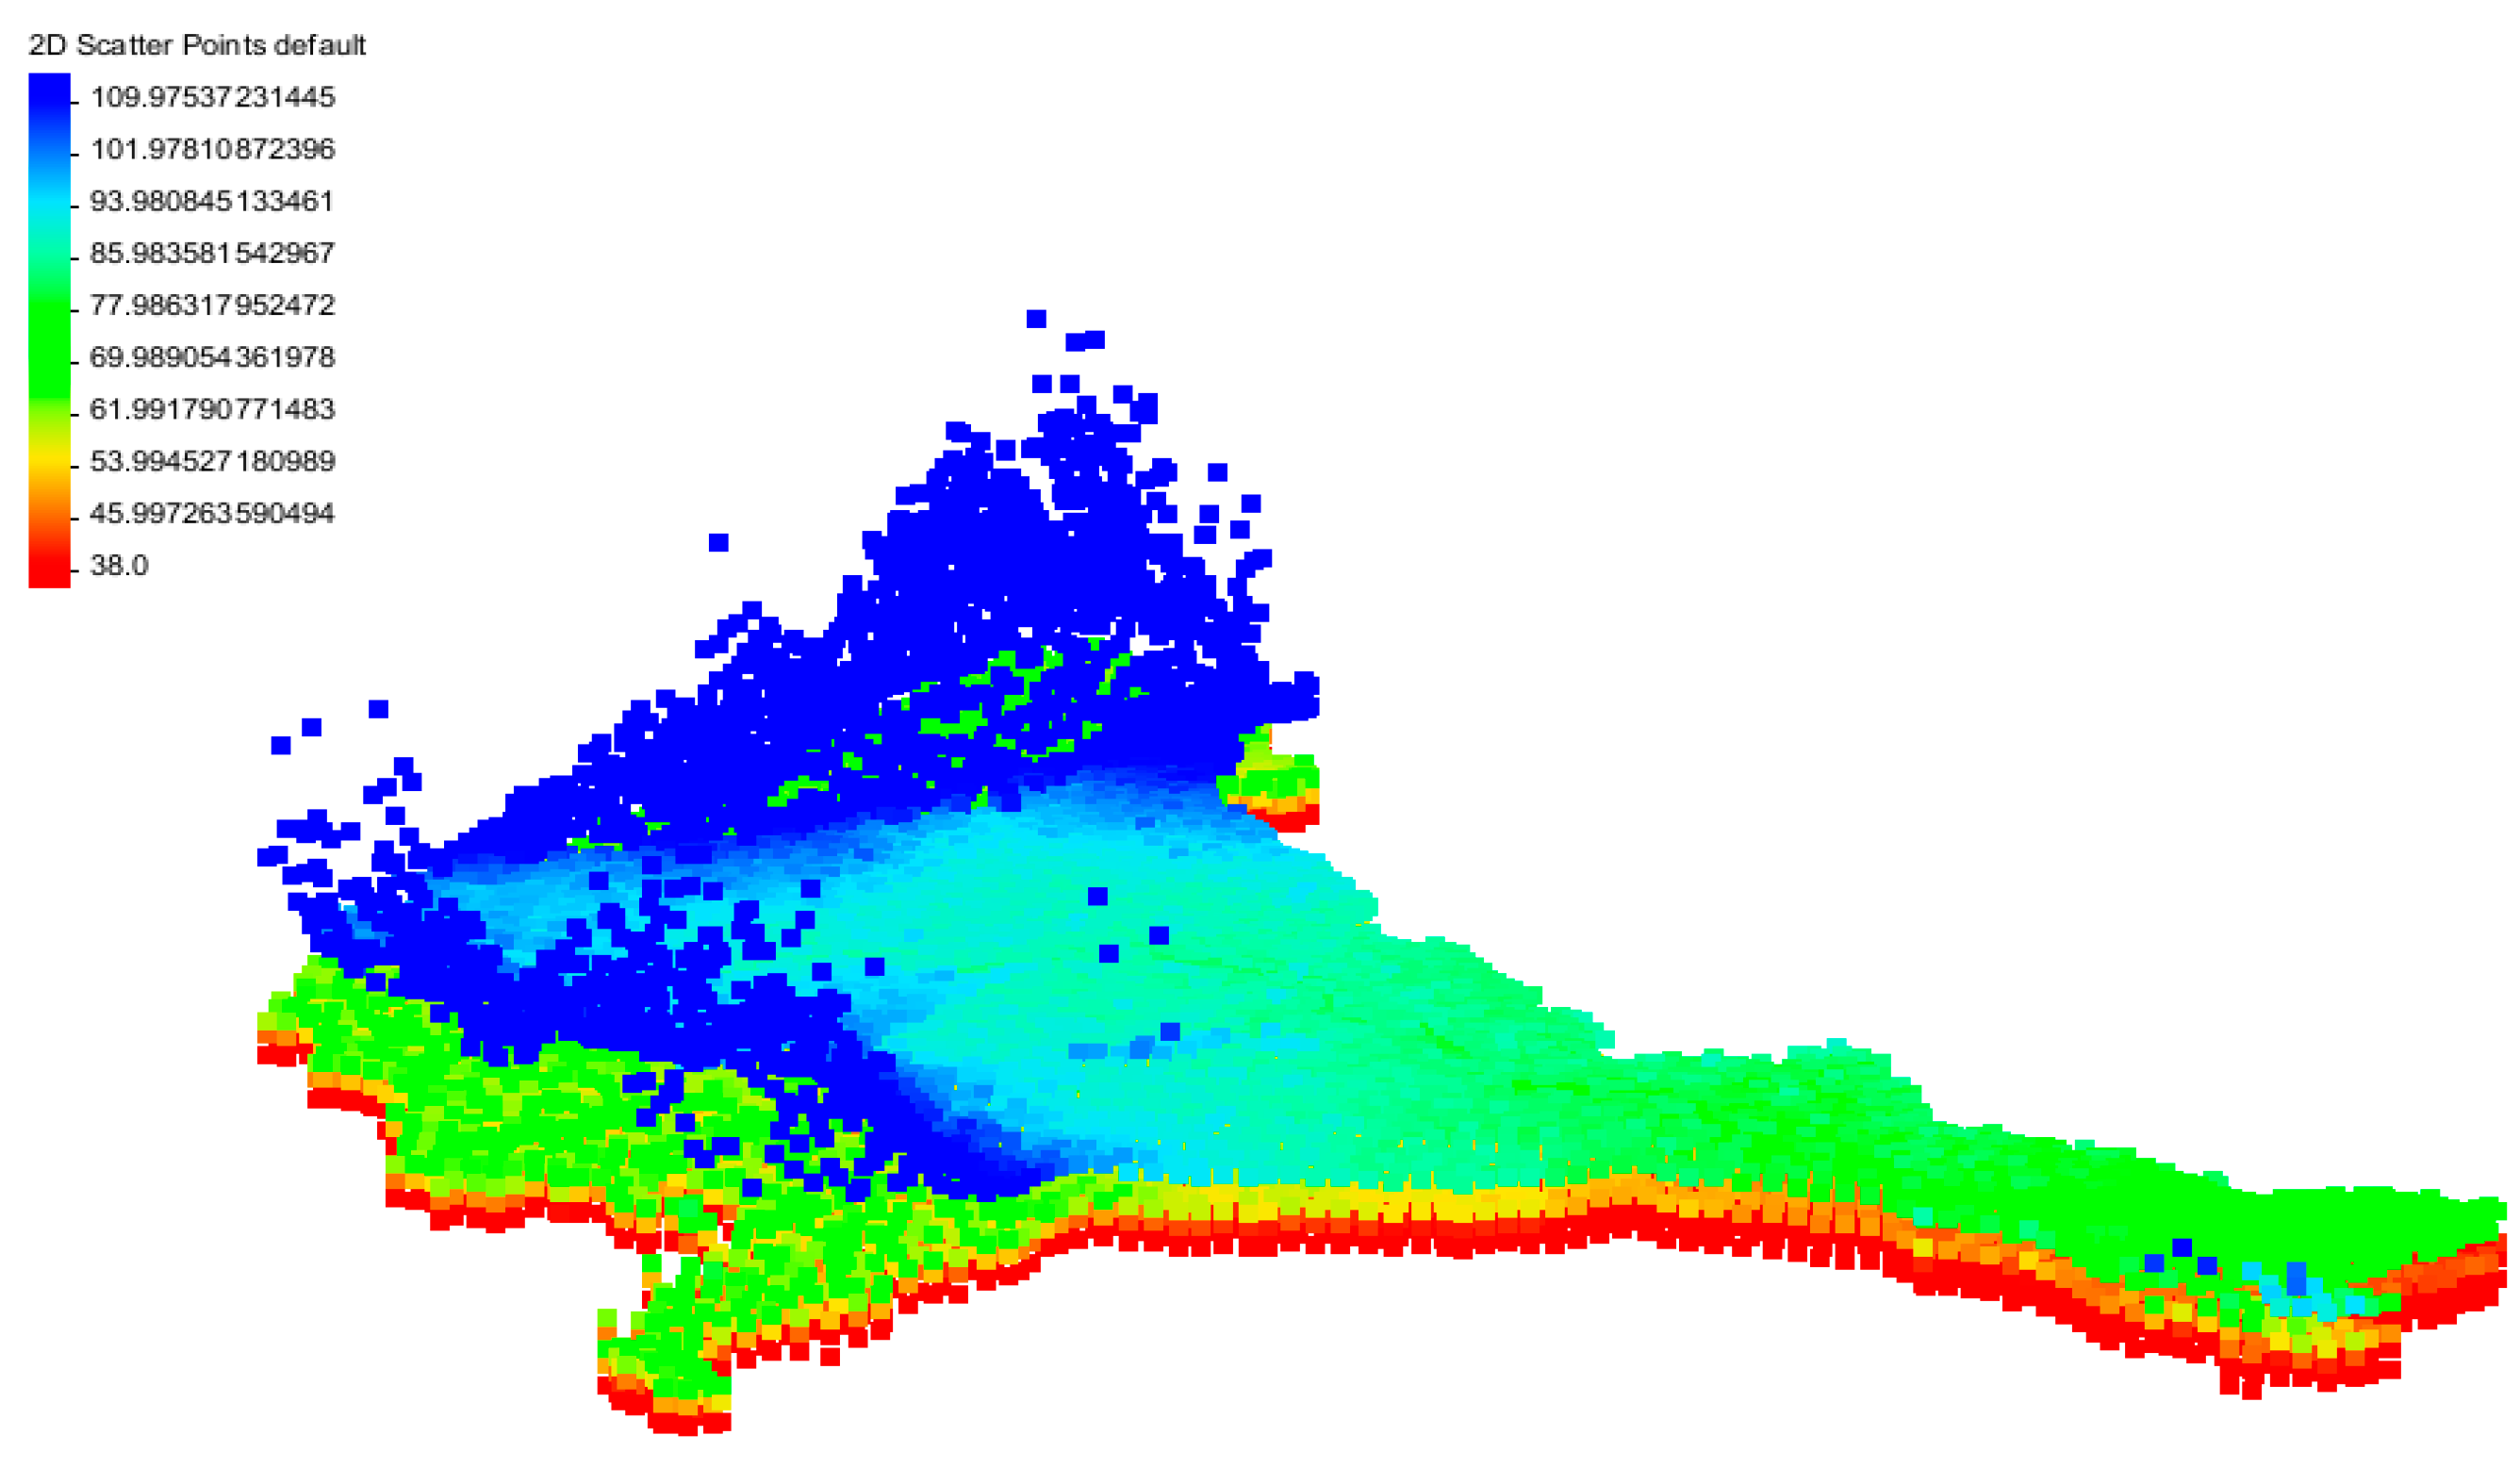
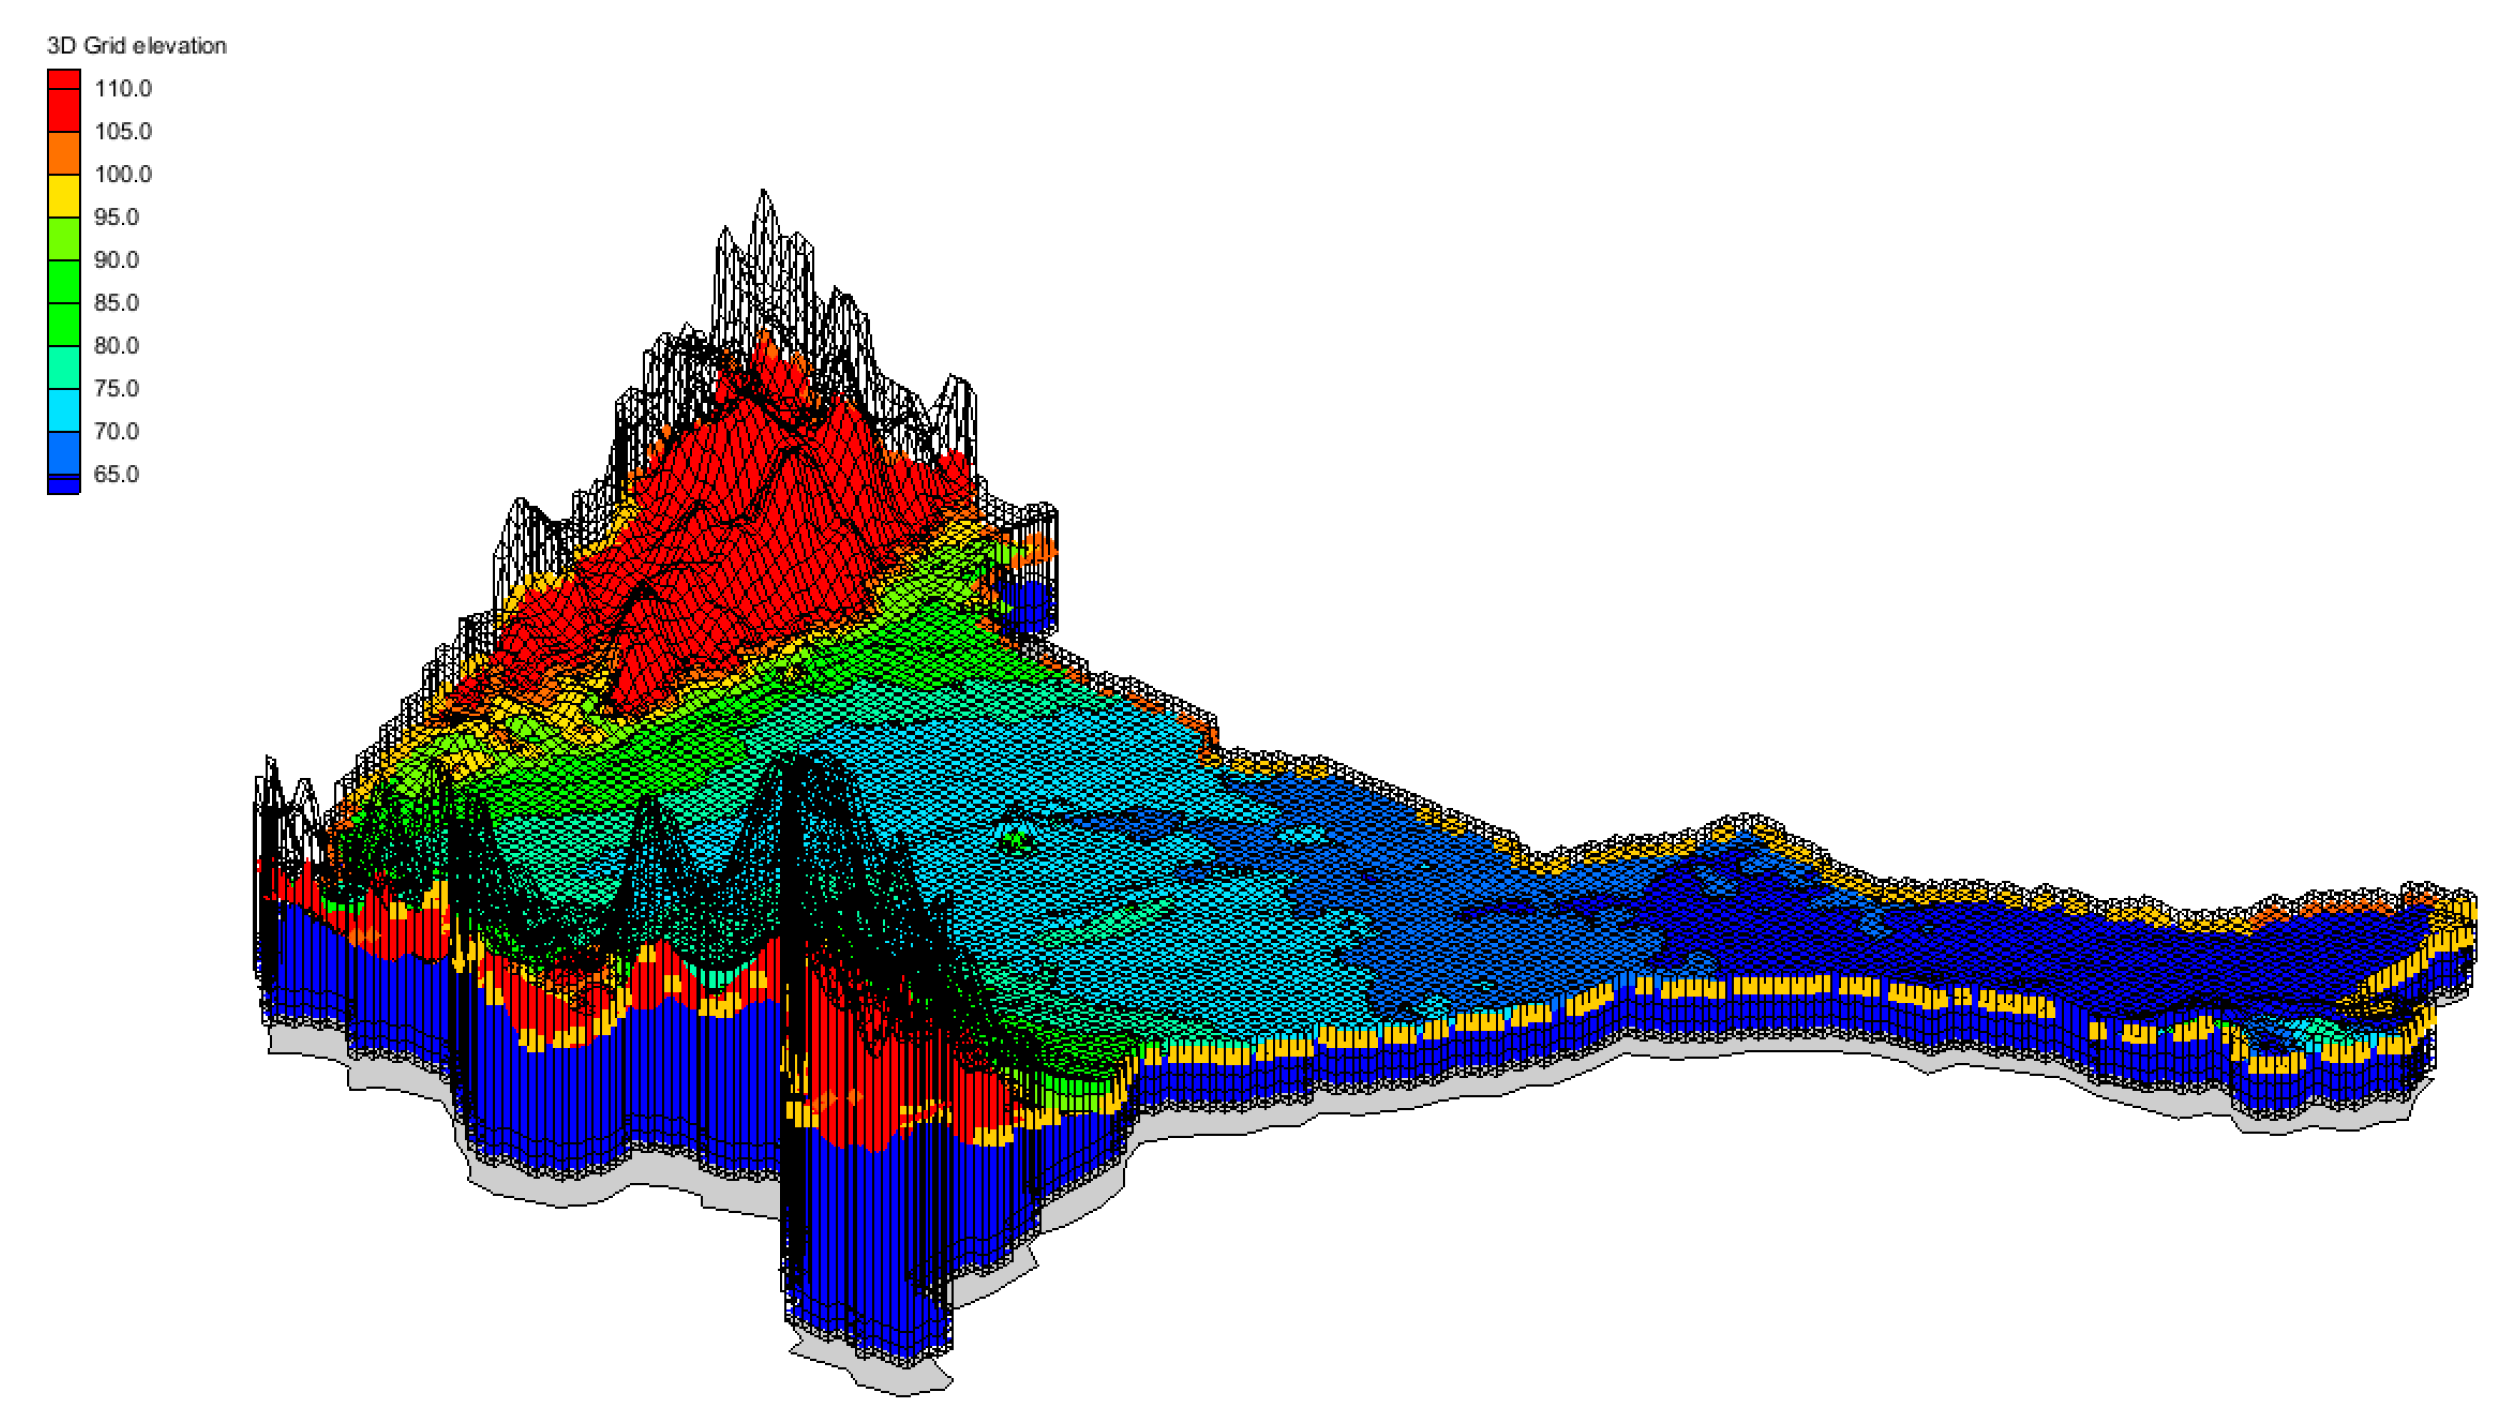
3.2.3. Construction of MODFLOW Model

The fundamental principle of groundwater numerical simulation dates back to 1856, introduced by the French engineer Darcy through Darcy’s law. As groundwater numerical simulation theory and computer software advance, groundwater numerical simulation software continues to evolve and mature. Currently, its primary simulation techniques encompass the finite difference method, finite element approach, and others. These methods were extensively employed in groundwater numerical simulation during the 1960s. The predominant simulation software encompasses Visual MODFLOW, FEFLOW, and GMS, among others, although certain simulation programs are incorporated into open-source compilation platforms as toolkits, exemplified by the FloPy toolkit in Python (Python 3.12.3). The ongoing advancement and enhancement of this program render the numerical simulation of groundwater more precise and dependable. This work utilized the MODFLOW module inside GMS software (GMS10.8), characterized by its user-friendly interface and effective 3D visualization, to develop a groundwater model for the middle and lower portions of the Songhua River basin. This paper used the MODFLOW NWT(Version number of the GMSMODFLOW model used: V2.1.1) program within the module to realize the groundwater numerical model.
MODFLOW NWT is a Modflow-2005 adaptation of Newton’s formula created by the United States Geological Survey to more effectively manage unconfined aquifers.
The basic governing equation of MODLFOW is:
x Κ x x h y + y K y y h y + z K z z h z W = S s h t
where K x , K y , K z , are the permeability coefficients (m/d) along the x, y and z axes ;   h is the water head (m) ;   W is the groundwater source sink item (m/d), including precipitation infiltration recharge, irrigation return water, diving evaporation, mechanical well exploitation, water exchange between aquifer and river, and water exchange between diving and confined water, up to the unit volume flow through medium and isotropic soil in a non-equilibrium state; S s is the specific water storage coefficient of the porous medium; t is time (d).
(1)
Aquifer generalization
The groundwater simulation range option aligns with the SWAT model. The shallow aquifers in the studied area consist predominantly of Quaternary Holocene sand and gravel, with a thickness ranging from 100 to 200 m in most regions. The riverbed and floodplain of the Songhua River’s main stream and its tributaries are predominantly constituted of Holocene (Q4) deposits, specifically a thin layer of yellow clay and sub-clay, together with sand and gravel in the lower section of the basin. The terrace of the interriver zone in the basin primarily consists of Upper Pleistocene (Q3) yellow-brown sand and gravel, with discontinuous sub-clay overlaying it. The flat region corresponds to the Middle Pleistocene (Q2), characterized by gray-brown, gray-black silty sand, sand, and sand gravel, with the lower section interspersed with sub-clay and silty sub-clay. The basin’s base consists of Lower Pleistocene (Q1) deposits, characterized by yellow-green and gray-green medium sand, fine sand, silty sand, and sand gravel. Consequently, the characteristics of the research region were delineated based on the aforementioned fundamental lithology, as illustrated in Figure 3, with the specific values presented in Table 7. The model’s roof elevation was derived from the interpolation of 30 m precision DEM elevation data, while the upper floor was determined using the aquifer thickness indicated by borehole and pumping well data, supplemented by the approximate aquifer thickness documented in the hydrogeological data for the study area. Figure 4 illustrates a schematic representation of the elevation points at the top and bottom inside the study region.
(2)
Generalization of boundary conditions
The northwestern and southern edges of the research area have a significant hydraulic connection with the basin, and the mountains in these regions receive lateral recharge, thereby categorizing them as lateral inflow boundaries. The northern section of the study area represents the convergence of the Heilongjiang basin and the Songhua River basin, which aligns approximately parallel to the isowater line, and thus was categorized as the lateral inflow boundary. Conversely, the eastern boundary was classified as the zero flow boundary due to the minimal vertical flow observed. The western boundary of the study area features numerous outflowing tributaries, including the Wutong River and Anbang River, hence it was classified as a continuous head boundary.
(3)
The model’s space-time dispersion
Grid division: This study utilized the watershed area derived from the SWAT model as the operational boundary for the MODFLOW model, encompassing an effective calculation area of 10,788.1 km2. The study area was segmented into a 1000 m × 1000 m square grid, comprising 168 rows, 198 columns, and 3 layers, encompassing a total of 99,792 effective grids. Figure 5 shows the grid differentiation of the study area in the model.
(4)
Determination of initial conditions
This simulation utilized the iso-water level in the middle and lower sections of the Songhua River basin on 31 January 2008 as the model’s initial water level (refer to the picture below). The simulation period was designated from January 2008 to December 2018, with each month serving as the stress period. Figure 6 below shows the initial flow field input for model operation.

4. Results and Analysis

4.1. Subwatershed Division and HRU Unit Based on SWAT Model

The partitioning of subwatersheds is a crucial component in surface runoff simulation in the SWAT model. Based on the imported DEM topographic map and the actual river system vector map, the optimal threshold value for accumulated water area (21,588.43 Ha) was utilized in this context, and the total outflow at the Tongjiang Hydrological Station in Tongjiang City, automatically generated by the SWAT model, was selected. A total of 32 sub-basins were delineated. Each Hydrologic Response Unit (HRU) possesses a distinct land use, soil type, and slope classification, constituting the smallest fundamental surface unit. The quantity of HRUs is dictated by the number of subbasins, land use, soil type, topographic slope, and reclassification threshold. This research established a minimum area ratio of land use, soil type, and slope categorization at 10%, resulting in a division into 112 Hydrologic Response Units (HRU).

4.2. Calibration and Verification of SWAT Model Parameters

The SWAT model has numerous parameters, and since the middle and lower portions of the Songhua River basin are situated in a cold temperate zone, parameters exhibiting a high correlation sensitivity coefficient were chosen for model adjustment. Twenty-two parameters were selected, and their sensitivity was assessed using SWAT-CUP(Version of SWAT-CUP software used: 5.2.1.1) software. This study employed a global sensitivity analysis. The t-test and p-value significance test were employed to assess the sensitivity of the parameters. Following the establishment of the parameters and the selection of their initial range, 500 iterative computations were executed utilizing the SU-F2 sampling technique integrated into the model [32]. The determination coefficient (R2) and Nash efficiency coefficient (NS) were employed to assess the model’s adequacy. The ideal parameters are presented in Table 8.
Upon reinserting the amended parameters into the model, the worksheet was revised and the validation executed once more. The findings of runoff rate determination and verification are presented in Figure 7.
The evaluation criteria employed in this experiment were the determination coefficient (R2) and Nash efficiency coefficient (NSE), which are widely utilized in research. A higher secondary coefficient indicates a stronger correlation between the simulated value and the measured value, resulting in a more favorable outcome. The dependability distribution is often presented as in the Table 9 below [33] under normal conditions.
The experimental results show that the runoff simulation for Tongjiang hydrological station is ideal with R2 > 0.8, NSE > 0.75.

4.3. Calibration and Validation of Parameters Utilizing the MODFLOW Model

This paper utilized measured well data from January 2008 to December 2012 to evaluate the parameters, whereas data from January 2012 to December 2016 were employed to validate the parameters. The hydrogeological parameters after calibration are shown in Table 10 below.
Figure 8 illustrates a schematic representation of all observed well simulations during the training and verification intervals. The graphic illustrates that the model’s outcomes during the training and verification periods align closely with the measured findings. This publication selected a total of 11 observation wells in the study region. Figure 9 illustrates a comparative diagram of simulated and observed water levels for a single well during the training and verification phases. The disparity between the actual water level and the simulated water level is within 0.6 m, satisfying the fundamental criteria for scientific research and providing a more accurate representation of the conditions in the study area.

4.4. Evaluation of Groundwater Resources Based on SWAT Model

The water storage statistics for shallow aquifers at the end of each year as simulated by the model were correlated with the 32 sub-basins in the aforementioned division (refer to Figure 10 and Figure 11). The long-term changes in shallow aquifer water storage align closely with the findings presented in the 2021 Songhua River Basin Health Assessment Report by the Heilongjiang Institute of Water Resources Science, indicating strong model applicability. The substantial rise in shallow aquifer water storage in sub-basins 1, 2, 3, 4, and 5 corresponds with the regional precipitation distribution trend from 2008 to 2016, as illustrated in Figure 12 (the sub-basin serial numbers are indicated on the survey map of the study area). Overall, the allocation of water storage in shallow aquifers within the basin exhibits significant variability. The primary trend is centered on the Jiamusi area, with a gradual decline towards the northeast and southeast. The net discharge trend of groundwater in the simulated results aligns closely with actual conditions, generally accumulating in the southeast and northwest directions while decreasing from the center to the periphery. Sub-basins 1, 2, 3, 5, and 7 constitute the shallow aquifers within the primary flow region of the Songhua River, with water resources predominantly derived from surface water.
The groundwater balance was employed to ascertain groundwater reserves in the middle and lower portions of the Songhua River basin from 2010 to 2016 (refer to Table 11). The average storage variable is 838 million m3/year, indicating that the studied region is predominantly in a healthy extraction condition. In 2016, the simulated runoff reached its peak, with a storage variable of 872 million m3/year. It is in a state of positive equilibrium. The primary groundwater discharge occurs as base flow to replenish the river, constituting 81.46%. The second, around 7.14%, primarily represents the infiltration recharge from the shallow aquifer to the deep aquifer. The smallest percentage of discharge is the loss of water flow via the vadose zone, constituting 2.1%.
Owing to the intricate geology of the middle and lower sections of the Songhua River and the varying hydrogeological conditions across the molecular basins, a characteristic hydrological year was chosen for the assessment of water resources based on the delineation of these basins. The monthly recorded runoff data from the Tongjiang Hydrology Station, which represents the total discharge of the middle and lower reaches of the Songhua River, spanning from 2008 to 2016 were utilized. Empirical frequency analysis [34] was employed to determine the driest year, 2011 (p = 75%), within the simulation period, yielding an annual runoff of 662 million m3. In 2014, with a probability of 50%, the annual runoff amounted to 981 million cubic meters. In 2016, with a precipitation rate of 25%, the annual runoff amounted to 1.216 billion cubic meters. The recoverable quantity of groundwater is assessed in average years.
This research used the groundwater runoff modulus approach to calculate the natural recharge of the groundwater system within the watershed. Initially, the model computed the output of each sub-basin for a typical year, then converted the average runoff of each sub-basin into the groundwater runoff modulus, followed by calculating the natural recharge for each sub-basin. Furthermore, to determine the exploitable groundwater volume inside the basin at the study area’s size, the exploitable coefficient approach was employed to estimate the groundwater availability in representative years for each sub-basin.
To enhance the accuracy of the estimation results, the average extraction coefficient (ρ = 0.45) for several hydrogeological zones in Jiamusi City was utilized for computation, with the findings presented in Table 12.

4.5. Prediction of Groundwater Recharge Based on MODFLOW Model

This work employed the MODFLOW model to simulate groundwater recharge, and the validity of the research findings was substantiated through comparison with the simulation results of the SWAT model. This work delineated the research area into a water equilibrium zone characterized by an annual equilibrium period. Figure 13 below shows trends in groundwater recharge from 2008 to 2016. The annual groundwater recharge is as follows: 24.06 × 10⁸ m3, 24.33 × 10⁸ m3, 21.80 × 10⁸ m3, 24.33 × 10⁸ m3, 22.04 × 10⁸ m3, 30.11 × 10⁸ m3, 30.79 × 10⁸ m3, 25.15 × 10⁸ m3, and 32.25 × 10⁸ m3, respectively. The simulation outcomes resemble those of the SWAT model.
Figure 14 illustrates the distinctive trend of yearly mean groundwater level changes predicted by the MODFLOW model. The figure illustrates that the groundwater level distribution trend diminishes progressively from the northwest to the east and from the south to the north, with the water level fluctuations aligning closely with the groundwater storage variations simulated by the SWAT model. The mean depth of the groundwater level over several years is 8.15 m.

5. Discussion

5.1. Relevance and Constraints of the Model in Groundwater Resource Assessment Research and Potential for Future Developments

This paper compares the groundwater storage and recharge results simulated by the SWAT model with those published in the “Songhua River Basin Health Report 2021” and the results simulated by the MODFLOW model. The SWAT model was deemed appropriate for simulating groundwater resources. The primary factors influencing the formation and evolution of groundwater resources include precipitation, evaporation, infiltration, runoff, freeze–thaw cycles, soil water movement, and groundwater recharge, among others [35]. The SWAT model operates based on the aforementioned fundamental physical processes to simulate functionality. While a singular SWAT model can only mitigate errors in the freeze–thaw cycle through parameter adjustments, its influence is comparatively minor within the broader hydrologic cycle physical process group, and these errors can be rectified using appropriate parameters. Furthermore, the SWAT model necessitates extensive input of meteorological, terrain, soil, land use, and other data, which may have previously been challenging to acquire. However, advancements in remote sensing technology and geographic information systems have facilitated data collection, rendering the application of the SWAT model in groundwater resource evaluation increasingly viable [36].
The SWAT model [37] has been extensively developed over more than 20 years since 1990 and is relatively mature. It is a semi-distributed model, making it easier to comprehend and utilize compared to fully distributed models. Additionally, it offers faster computation than conceptual models, effectively representing the physical mechanisms of the water cycle with improved accuracy. Secondly, the model thoroughly accounts for the material cycle, simulates various types of material migration, and effectively utilizes land use and other remote sensing data to compile extensive foundational databases, including information on crops, pesticides, and fertilizers [38]. Nonetheless, in comparison to other hydrological models, its capacity to elucidate the water cycle mechanism is inadequate. The research area discussed in this paper is situated in northeast China, characterized by pronounced seasonal climate variations and distinct climatic, topographical, and soil attributes compared to other regions [39]. Cold regions exhibit prolonged winters, low temperatures, varied precipitation types, and intricate soil freezing and melting processes. The development and application of the SWAT model may not fully account for the characteristics of cold regions. This study is situated in the cold temperate zone of the North Temperate Zone (Songhua River basin), where freeze–thaw conditions are moderate, resulting in relatively consistent simulation outcomes; however, it is also located in a cold permafrost region. In regions such as Russia and Alaska, ensuring model accuracy is challenging.
This paper integrated the SWAT model with the MODFLOW model to perform dual-model auxiliary verification in order to address the aforementioned issues [40,41]. Despite the enhanced reliability of the results, the watershed simulated by the SWAT model was inappropriately employed as the boundary condition for MODFLOW, resulting in considerable errors and numerous instabilities. The watershed boundary was utilized as a no-flow water boundary, resulting in significant discrepancies with the actual conditions. A LU-SWAT-MODFLOW model should be developed in the future to calibrate and validate the model using multi-source data to mitigate the impact of temperature.
Land use change significantly affects hydrology and non-point source pollution simulation. In the processes of flow, sediment, and non-point source pollution simulation, it is essential to dynamically update land use data to recalibrate the threshold, thereby enhancing the model’s simulation accuracy in the context of land use change. Consequently, dynamic land use input must be incorporated into the model [42].
The Songnen Plain and Sanjiang Plain in northeast China represent the regions with the highest agricultural grain yield in the country [43]. The topography in this area is intricate, featuring diverse land use and soil classifications. The existing SWAT model exhibits inadequate processing capabilities for high-precision and multi-transformation terrain data, leading to significant inaccuracies in simulated groundwater recharge, discharge, and shallow groundwater storage [44]. It should be enhanced according to the planting configuration. Accurate planting structure data, derived from the integration of high-resolution drone imagery, remote sensing images, and ground-measured data, serve as the input land use data for the SWAT model. This approach aims to enhance the simulation of the migration and transformation processes of agricultural non-point source pollution, thereby improving the accuracy of watershed runoff simulations.

5.2. Analysis of Groundwater Recharge and Distribution Characteristics

Analysis of the simulation results indicates that precipitation is the primary source of groundwater recharge in the middle and lower reaches of the Songhua River. The predominant component of drainage is groundwater recharge as base flow, while the least significant is loss in the regression vadose zone. The primary mechanism of water loss is absorption by plant roots from the superficial water layer. The Songhua River basin experiences a temperate continental climate characterized by significant annual temperature variation. The disparity between evapotranspiration and precipitation is excessive. Forecasts indicate that the potential evapotranspiration of the Songhua River basin will rise in the 21st century. Although the region is primarily replenished by atmospheric precipitation, the supply is inadequate. The primary reason is the extended duration of the cold season, during which the river freezes, leading to significant groundwater recharge into the river [45].
The groundwater storage in the study area exhibited a gradual increase over 10 to 16 years, based on its distribution characteristics. The primary distribution trend centers on the Jiamusi area, with a gradual decline towards the northeast and southeast directions. Seventy-five percent of the land in the northeast and southeast quadrants of the study area is allocated for agricultural cultivation, resulting in substantial water extraction for irrigation purposes. Furthermore, the southeast direction is distanced from the primary river trunk, resulting in a comparatively limited water supply. The simulation results indicate a significant alteration in the southeastern region of the basin. In recent years, the optimization of paddy field planting systems has effectively allocated water demand and alleviated the strain on groundwater extraction, leading to a substantial increase in the water reserves of the phreatic aquifers in this region [46]. Besides the annual rise in precipitation, the gradual augmentation of water reserves is attributable to Fujin City’s optimization of its flood control and diversion irrigation management system for the three adjacent reservoirs since 2014, thereby diminishing the groundwater demand for agricultural irrigation [47].

6. Conclusions

  • The application of the SWAT and MODFLOW models for assessing groundwater resources yielded favorable simulation results in this region. The runoff simulation at the Tongjiang Hydrological Station, located at the basin’s total water outlet, was exemplary. R2 exceeded 0.8, NSE surpassed 0.75, and the R2 values for simulation and verification of groundwater levels were 0.98 and 0.97, respectively. The discrepancy between the simulated value and the actual value was less than 0.6 m.
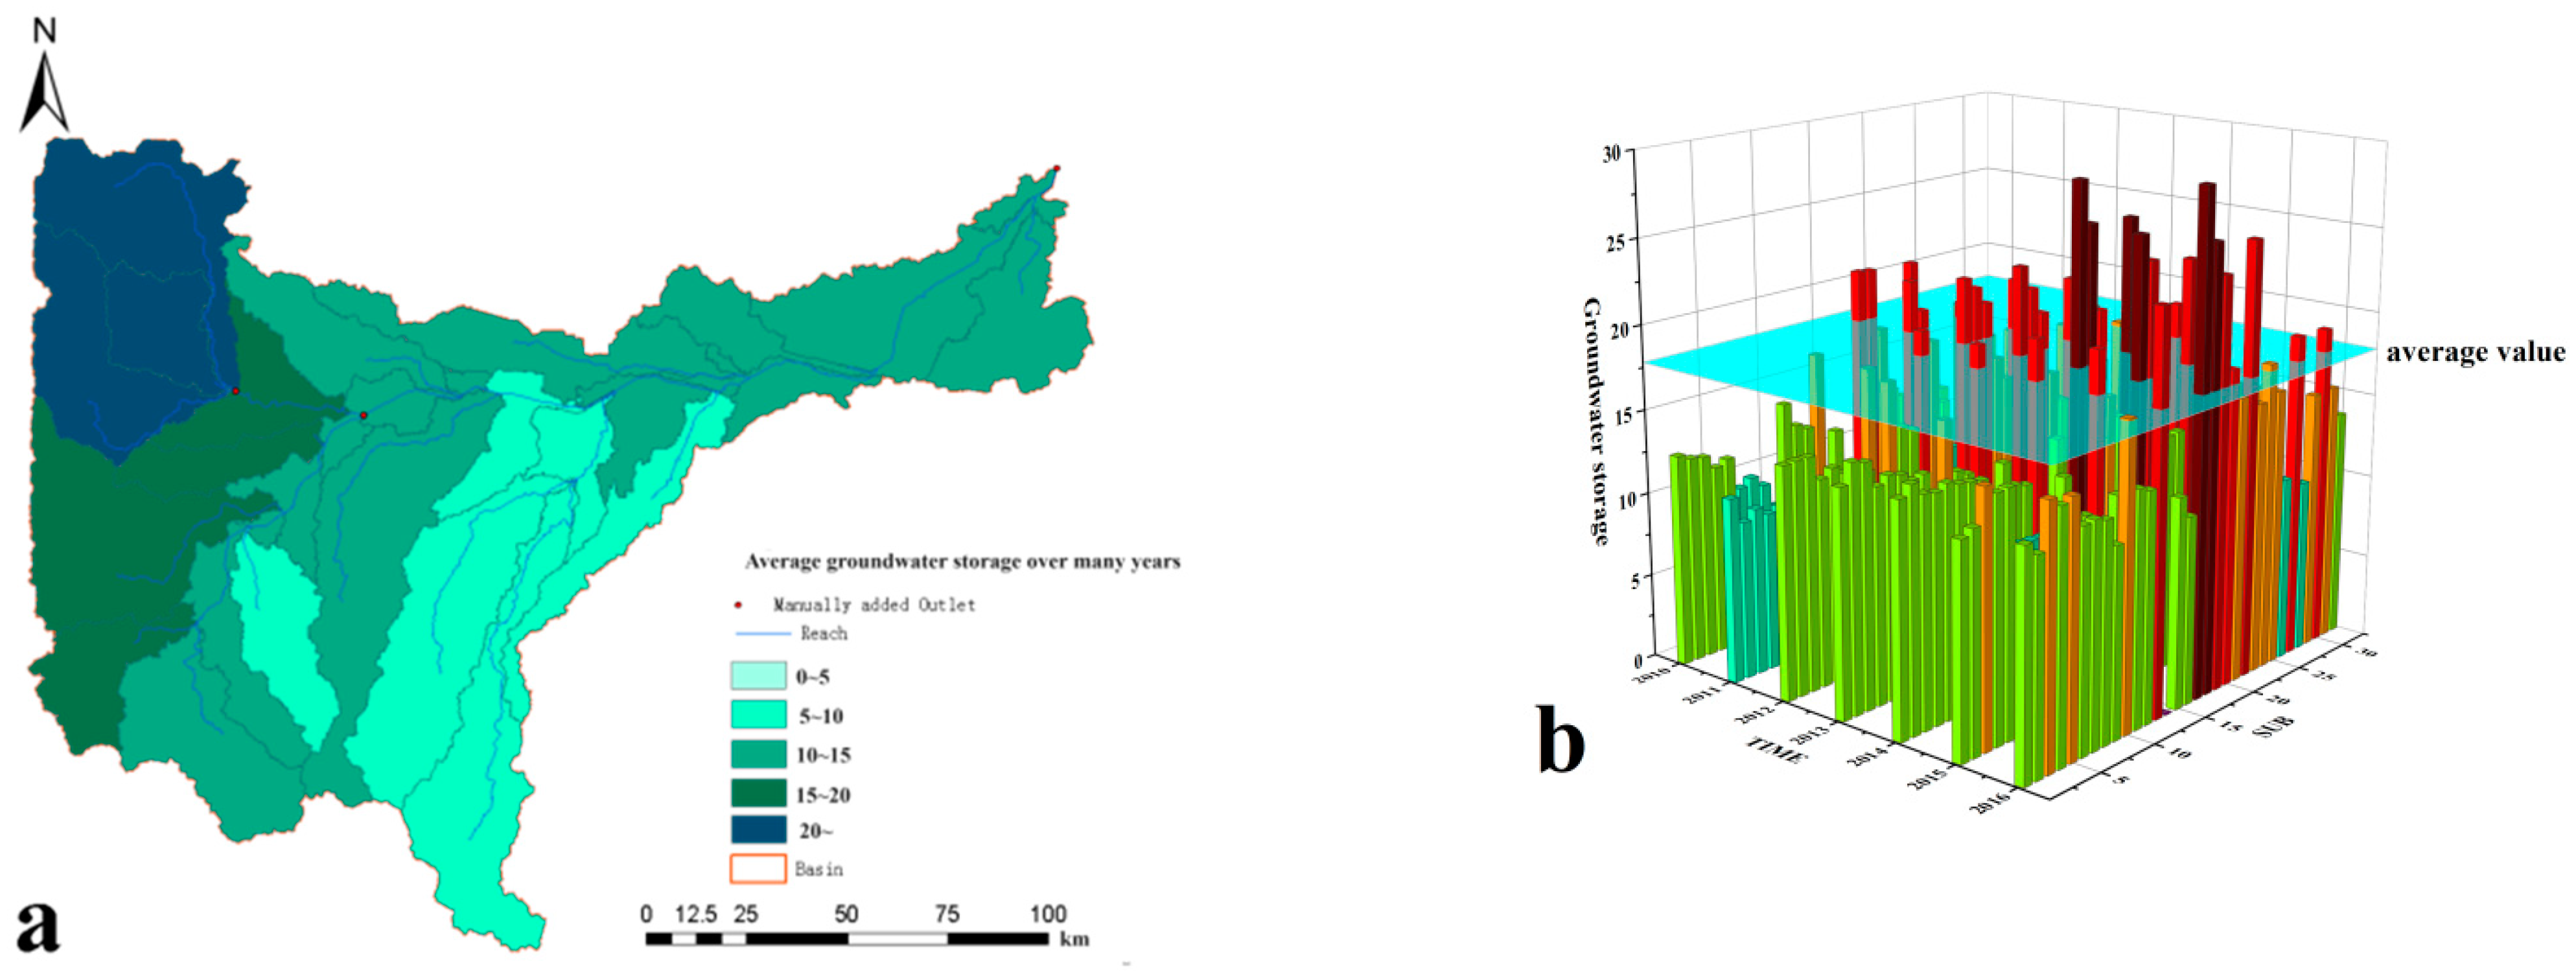
  • The study area is predominantly characterized by a robust extraction sector. In 2016, the simulated runoff reached its peak, with a storage variable of 872 million m3/a. It is in a state of positive equilibrium. The primary source of groundwater in the discharge item, represented as base flow recharge from the river, constituted 81.46%. The second factor accounts for approximately 7.14%, primarily attributed to the replenishment of deep aquifers, while the least significant factor, the loss to the vadose zone, constitutes merely 2.1%.
  • From 2010 to 2016, the average groundwater runoff modulus in the middle and lower reaches of the Songhua River basin was 1.005 L/(s·km²), with a total recharge of 216.58 × 10⁸ m3 and a total recoverable amount of 105.11 × 10⁸ m3. The mean annual recharge was 25.11 × 10⁸ m3, while the total groundwater recharge was 26.54 × 10⁸ m3, 33.11 × 10⁸ m3, and 33.25 × 10⁸ m3 in the super dry year (2011), normal year (2014), and high water year (2016), respectively, with the groundwater recharge in the high water year being 1.25 times greater.
  • The MODFLOW model was employed to simulate groundwater recharge in the middle and lower reaches of the Songhua River for the years 2011, 2014, and 2016. The discrepancies in results compared to the SWAT model were 2.22 × 10⁸ m3, 2.32 × 10⁸ m3, and 1.0 × 10⁸ m3, respectively, with a minimal relative error base. The SWAT model effectively simulates groundwater resource assessment in cold regions.

Author Contributions

Conceptualization, X.Y.; Methodology, X.Y.; Software, X.Y.; Validation, X.Y.; Formal analysis, X.Y.; Data curation, C.L. and X.M.; Writing—original draft, X.Y.; Writing—review & editing, C.D. and G.L. All authors have read and agreed to the published version of the manuscript.

Funding

This research was funded by: (1) [Research and analysis of Sino-Russian glacial flow measurement technology in Heilongjiang (Amur River) and suggestions on survey schemes]. (2) [Yunnan Key Laboratory of International Rivers and Transboundary Eco-Security] grant number [2022KF03] and the APC was funded by [2022KF03].

Data Availability Statement

The original contributions presented in the study are included in the article, further inquiries can be directed to the corresponding author.

Conflicts of Interest

The author hereby declares no conflict of interest.

References

  1. Guo, L.; Zheng, G.G.; Li, R.Y.; Fu, C.Y.; Chen, J.; Meng, Y.C.; Pan, Y.; Hu, P. An integrated approach for quantifying trace metal sources in surface soils of a typical farmland in the three rivers plain, China. Environ. Pollut. 2023, 337, 136077. [Google Scholar]
  2. You, L.; Wang, S.; Tao, Y.; Liu, Y. Appropriate Method to Estimate Farmland Drainage Coefficient in the Wanyan River Surface Waterlogged Area in Suibin County of the Sanjiang Plain, China. Appl. Sci. 2023, 13, 2769. [Google Scholar] [CrossRef]
  3. Liu, H.; Zhao, H.; Feng, X.; Han, Y. Tradeoff and synergy of farmland ecosystem services in Heilongjiang Province. J. China Agric. 2023, 28, 160–171. (In Chinese) [Google Scholar]
  4. Chen, Y.; Yang, Q.; Luo, Y.; Shen, Y.; Pan, X.; Li, L.; Li, Z. Water resources in arid region of Northwest China. Arid. Land Geogr. 2012, 35, 1–9. (In Chinese) [Google Scholar]
  5. Hu, C.; Lu, C.; Wu, B. Practice and thinking on the Development of water-saving agriculture in Songhua River Basin in the new era. In Chinese Hydraulic Society. In Proceedings of the 2023 Chinese Water Conservancy Academic Conference (Volume 3), Zhengzhou, Henan, China, 4 November 2023; Yellow River Water Conservancy Press: Zhengzhou, China, 2023; Volume 5. [Google Scholar]
  6. Ye, X.; Cui, R.; Wang, L.; Du, X. The influence of riverbank filtration on regional water resources: A case study in the Second Songhua River catchment, China. Water Supply 2020, 20, 1425–1438. [Google Scholar] [CrossRef]
  7. Liu, S.; Zhou, Z.; Liu, J.; Li, J.; Xie, M.; Jiang, Y.; Wang, H. Based on the songhua river basin water resources evolution regularity of permafrost hydrology simulation. J. South-North Water Divers. Water Conserv. Sci. Technol. 2023, 21, 127–136, (Both in English and Chinese). [Google Scholar]
  8. Li, J. Optimization Design of SWAT Model and Its Application in Chayu River Basin. Master’s Thesis, Lanzhou University, Lanzhou, China, 2024. [Google Scholar]
  9. Liu, H.Y. Research and application progress of SWAT model. Subtrop. Soil Water Conserv. 2019, 31, 34–37. (In Chinese) [Google Scholar]
  10. Chen, P.; Li, J.; Yu, Q.; Guo, J.; Mang, J. Groundwater distribution characteristics and water resources evaluation in Jinghe River Basin based on SWAT model. J. Irrig. Drain. 2021, 40, 102–109+126. [Google Scholar]
  11. Zhao, L.; Wang, Y.; Zhou, Y. Groundwater resources evaluation in the Pearl River Basin based on SWAT model. Earth Sci. 2024, 49, 1876–1890. [Google Scholar]
  12. Li, Y.-J.; Jiang, X.-H.; Chen, J.; Yang, Z.; Wang, G.; Ding, H. Prediction of groundwater flow field in riverside area of Bayannur City based on GMS. South--North Water Divers. Hydraul. Sci. Technol. 2016, 14, 36–41+83. [Google Scholar]
  13. Zhu, H.; Zhang, X.; Wang, W.; Jiang, C.; Liu, Z.; Liu, B. Numerical simulation and prediction of groundwater in Licheng District of Jinan City. Groundwater 2021, 43, 52–54+70. (In Chinese) [Google Scholar]
  14. Zhang, H.; Zhang, S.; Zhang, Y.; Liu, K.; Pan, W.; Xu, J.; Bian, Z.; Yang, S.; Pan, Y.; Xu, Z. Nitrogen control of shallow groundwater based on Visual MODFLOW software. J. Jinan Univ. (Nat. Sci. Ed.) 2022, 36, 56–64. [Google Scholar]
  15. An, N.N.; Nhut, H.S.; Phuong, T.A.; Huy, V.Q.; Hanh, N.C.; Thao, G.T.P.; Trinh, P.T.; Hoa, P.V.; Bình, N.A. Groundwater simulation in Dak Lak province based on MODFLOW model and climate change scenarios. Front. Eng. Built Environ. 2022, 2, 55–67. [Google Scholar] [CrossRef]
  16. Bushira, K.M.; Hernandez, J.R.; Sheng, Z. Surface and groundwater flow modeling for calibrating steady state using MODFLOW in Colorado River Delta, Baja California, Mexico. Model. Earth Syst. Environ. 2017, 3, 815–824. [Google Scholar] [CrossRef]
  17. Li, X.; He, X.; Yang, G.; Zhao, L.; Chen, S.; Wang, C.; Chen, J.; Yang, M. Study of groundwater using visual MODFLOW in the Manas River Basin, China. Water Policy 2016, 18, 1139–1154. [Google Scholar] [CrossRef]
  18. Jia, X. Songhua river basin in recent 40 years of meteorological drought evolution characteristics. J. Northeast. Water Conserv. Water Electr. 2024, 42, 42–45+71. [Google Scholar]
  19. Liu, Z.-T.; Hao, Z.-C.; Xu, H.-Q.; Ju, Q.; Wu, G.-Y.; Xing, R.-F. Climate modeling and prediction in Songhua River Basin based on model integration. J. Hydroelectr. Power 2019, 46, 14–18. [Google Scholar]
  20. Ye, X.-Y.; Wu, Y.-M.; Du, X.-Q.; Li, W.-L. Comprehensive identification method of dynamic genetic types of subsurface water: A case study of Songhua River Basin, Sanjiang Plain. Prog. Water Sci. 2022, 33, 68–78. [Google Scholar]
  21. Zhao, S. Based on the Suitable Water Level of Sanjiang Plain Groundwater Exploitation Groundwater Regulation Scheme Research. Master’s Thesis, Jilin University, Jilin, China, 2023. [Google Scholar] [CrossRef]
  22. Wu, Z.; Wu, Y.; Yu, Y.; Zhang, G.-X.; Sun, Y.-N.; Fu, Q.-N. Groundwater environment change and its controlling factors in Songhua River Basin, Sanjiang Plain. J. Hydropower Energy 2024, 42, 38–42. [Google Scholar]
  23. Ridwansyah, I.; Yulianti, M.; Apip; Onodera, S.I.; Shimizu, Y.; Wibowo, H.; Fakhrudin, M. The impact of land use and climate change on surface runoff and groundwater in Cimanuk watershed. Indones. Limnol. 2020, 21, 487–498. [Google Scholar] [CrossRef]
  24. Xu, A.; Mu, Z. G four river basin upstream of the SWAT model database construction. J. Yangtze River Technol. Econ. 2021, 5, 114–116. [Google Scholar] [CrossRef]
  25. Zhu, Y. Study on Water Resource Vulnerability in Songhua River Basin under Changing Environment; Jilin University: Jilin, China, 2024. [Google Scholar]
  26. Chen, K.; Wang, L.; Liu, Y.; Liu, J.-X. Applicability evaluation of CMADS dataset in Hulan River Basin. J. Irrig. Drain. 2019, 43, 60–68. [Google Scholar]
  27. Gu, X.; Yang, G.; He, X.; Zhao, L.; Li, X.; Li, P.; Liu, B.; Gao, Y.; Xue, L.; Long, A. Simulation of hydrological processes in Manas River Basin based on CMADS and SWAT model. J. Water Resour. Water Eng. 2021, 32, 116–123. [Google Scholar]
  28. Dai, J.; Cui, Y. Swat-based distributed hydrological model of irrigation district—I. Principle and method of model construction. J. Hydraul. Eng. 2009, 40, 145–152. [Google Scholar]
  29. Zhao, X.; Yan, X. Study on the Change Trend of Soil Water Storage in Heilongjiang Province in the Past 20 Years. Geogr. Sci. 2006, 5, 5569–5573. [Google Scholar]
  30. Wang, Z.; Liu, C.; Huang, Y. Research on the principle, structure and application of SWAT model. Prog. Geogr. 2003, 1, 79–86. [Google Scholar]
  31. Cui, J. Application of water balance method in groundwater resource assessment. Groundwater 2022, 44, 51–52+91. (In Chinese) [Google Scholar]
  32. Saurette, D.D.; Biswas, A.; Heck, J.R.; Gillespie, A.W.; Berg, A.A. Determining minimum sample size for the conditioned Latin hypercube sampling algorithm. Pedosphere 2024, 34, 530–539. [Google Scholar] [CrossRef]
  33. Bao, Y.; Chen, J.; Shao, S. Comparison on thermal and hydraulic performances of transverse mini-channel based on a novel comprehensive evaluation factor. Appl. Therm. Eng. 2024, 253, 123795. [Google Scholar] [CrossRef]
  34. Hou, M.; Dong, A.Z.; Ying, H.Y.; Wang, Z.-H. Influence of parameter change of empirical frequency formula on hydrological frequency analysis. J. Zhejiang Univ. Water Resour. Hydropower 2023, 35, 24–30. [Google Scholar]
  35. Wu, L.; Lu, T.; Guo, J.; Lu, Y.; Li, H. High fluoride groundwater distribution and formation mechanism of jilantai desert basin. J. Irrig. Drain. Lancet 2024, 9, 113–120. [Google Scholar]
  36. Liu, Y.; Wu, T.; Wang, S.; Ju, M.-D. Study on the efficiency of coastal vegetation belt in reducing non-point source pollution by coupled remote sensing and SWAT model. Nat. Resour. Remote Sens. 2024, 1–10. Available online: http://kns.cnki.net/kcms/detail/10.1759.P.20230531.1032.019.html (accessed on 5 August 2024).
  37. Zhao, H. Simulation and Prediction of Snowmelt Runoff in Northeast Cold Region Based on Improved SWAT. Master’s Thesis, Jilin University, Jilin, China, 2023. [Google Scholar]
  38. Lai, G.; Wu, D.; Zhong, Y.; Zeng, F.-H.; Chen, J.; Zhang, W.-L. Development and Application of SWAT Model. J. Hohai Univ. (Nat. Sci. Ed.) 2012, 40, 243–251. [Google Scholar]
  39. Xin, Y.; Zhang, W.; Zou, L.; Zhou, T.-J.; Zhao, Y. High-resolution regional model prediction of precipitation erosivity affected by climate change in Northeast China. Chin. J. Atmos. Sci. 2019, 48, 480–496. [Google Scholar]
  40. Yifru, B.A.; Lee, S.; Lim, K.J. Calibration and uncertainty analysis of integrated SWAT-MODFLOW model based on iterative ensemble smoother method for watershed scale river-aquifer interactions assessment. Earth Sci. Inform. 2023, 16, 3545–3561. [Google Scholar] [CrossRef]
  41. Deng, Z.; Ma, Q.; Zhang, J.; Feng, Q.; Niu, Z.; Zhu, G.; Jin, X.; Chen, M.; Chen, H. A New Socio-Hydrology System Based on System Dynamics and a SWAT-MODFLOW Coupling Model for Solving Water Resource Management in Nanchang City, China. Sustainability 2023, 15, 16079. [Google Scholar] [CrossRef]
  42. Li, L.F.; Chen, J.Y.; Chen, L.; Chen, S.-B.; Xu, Y.-Z.; Zhi, X.-S.; Shen, Z.-Y.; Yang, D.-W. Improvement of SWAT model reservoir module and simulation of nitrogen and phosphorus flux in watershed. Chin. J. Environ. Sci. 2023, 43, 427–439. (In Chinese) [Google Scholar]
  43. Cui, H.; Wu, T.; Liu, J.; Liu, W.-P.; Li, Z.-H.; Cheng, X.-X.; Liu, W.-P. Effect of succession process on groundwater in marsh wetland and farmland in Sanjiang Plain. Hydrogeol. Eng. Geol. 2023, 50, 51–58. [Google Scholar]
  44. Zhang, D.; Zhang, W.; Zhu, L.; Zhu, Q.-A. Research on improvement and application of the hydrophysical model of distributed SWAT basin. Sci. Geogr. Sin. 2005, 4, 52–58. [Google Scholar]
  45. Jia, C.C.; Guo, L.; Cui, S.; Fu, Q.; Liu, D. Temporal and spatial evolution of NPP and its response mechanism to extreme climate in Songhua River Basin. South--North Water Divers. Water Sci. Technol. 2019, 22, 131–147. (In Chinese) [Google Scholar]
  46. Chu, G.; Chen, S.; Xu, C.M.; Liu, Y.-H.; Wang, D.-Y.; Zhang, X.-F. Evolution and prospect of paddy planting system in China. Chin. Rice 2021, 27, 63–65+70. (In Chinese) [Google Scholar]
  47. Yu, Y. Study on the impact of engineering water resources utilization on aquatic ecology in Jinxi Irrigation area, Fujin City, Heilongjiang Province. Sci. Technol. Innov. 2020, 13, 118–119. [Google Scholar]
Figure 2. Schematic diagram of SWAT model.
Water 16 02839 g002
Figure 3. Study area parameter partition map. (The Roman numerals in the figure are the partition number of the permeability coefficient).
Water 16 02839 g003
Figure 4. Schematic diagram of top and bottom elevation points in the study area.
Water 16 02839 g004
Figure 5. Discrete graphic of model space.
Water 16 02839 g005
Figure 6. Preliminary water level chart.
Water 16 02839 g006
Figure 7. Determination and verification of the runoff rate of the model (the longitudinal coordinate indicates the runoff unit: m3).
Water 16 02839 g007
Figure 8. Evaluation of all recorded well simulation outcomes during the calibration and validation phases.
Water 16 02839 g008
Figure 9. Comparison of simulated and actual water levels in a single well throughout calibration and validation intervals.(The serial number in the picture represents the observation well number assigned to each observation well in order to facilitate the experiment.)
Water 16 02839 g009
Figure 10. Annual mean water storage of phreatic beds in the sub-basin from 2010 to 2016 (unit: ×108 m3).
Water 16 02839 g010
Figure 11. Variation map of water storage in a shallow aquifer in a sub-watershed. (a) shows the geographical distribution characteristics of the average annual water storage in the shallow aquifer, while (b) illustrates a schematic diagram of the changes in average annual water storage in the shallow aquifer. Unit: 108 m3).
Water 16 02839 g011
Figure 12. Distribution trend of precipitation in the middle and lower reaches of Songhua River from 2008 to 2016 (Unit: mm).
Water 16 02839 g012
Figure 13. Trend chart depicting groundwater recharge from 2008 to 2016.
Water 16 02839 g013
Figure 14. Diagram of the characteristic annual mean water table.
Water 16 02839 g014
Table 2. Proportion of main soil types %.
FLCPHhGLMHSsATcLVhCMe
2.2826.446.091.022.0113.170.38
Table 3. Soil coefficient and level calculated by SPAW.
CoefficientSOL_BD1SOL_AWC1SOL_K1SOL_CBN1SOL_BD2SOL_AWC2SOL_K2SOL_CBN2Hierarchy
Soil Type
FLc1.530.149.320.61.480.1412.650.4L-L
LPe1.550.19.361.130000L
PHh1.370.1414.241.951.520.138.220.67L-L
GLm1.410.1413.581.651.50.135.20.69L-CL
HSs1.140.1313.6539.41.180.1422.4338.46CL-SaCL
ATc0.980.1844.521.121.490.148.940.82SIL-L
LVh1.520.139.330.741.520.134.110.36L-CL
CMe1.490.1310.2711.550.125.700.37L-L
WATER1.72026000000-
Table 4. Related descriptions of soil coefficients involved in the calculation of SPAW.
CoefficientDescriptionCoefficientDescription
SOL_BDweight of dried soil, comprising soil particles and intergranular pores, per unit volume. It stands for the moist bulk density of soil (SOILdensity).CLAYClay content, %wt, refers to soil particles < 0.002 mm in diameter.
SOL_AWCIndicates the effective water content of soil layer, in mm/mm.SILTSILT1 refers to the loam content of the soil (%wt), that is, the percentage by weight of soil particles between 0.002 and 0.05 mm in diameter.
SOL_CBNOrganic carbon content (%wt) of the soil layer.SANDSand content, %wt, refers to particles with diameters between 0.05 and 2.0 mm.
SOL_KSaturated water conductivity/saturated hydraulic conductivity, mm/hr.ROCKGravel content, %wt, refers to particles with a diameter greater than 2 mm.
SOL_ZMSRepresents the maximum root depth of the soil profile, mm.USLE_KErodibility factor
Table 5. SWAT code of land use.
Reclassification CodingNameSWAT Coding
1Cultivated landAGRL
2Forest landFRST
3GrasslandRNGB
4Water bodiesWATR
5Urban and rural, industrial and mining, and residential landURML
6Fallow landWETL
Table 6. Basic geographic data required for the middle and lower reaches of Songhua River basin model.
Data TypeData Source
Digital Elevation Model (DEM)NASA Earth Science data website (https://nasadaacs.eos.nasa.gov/) (accessed on 15 July 2024)
Soil type and attribute listHWSD data downloaded from the National Tibetan Plateau Scientific Data Center (World Soil Database) (accessed on 15 July 2024)
Land type use dataInstitute of Aerospace Information Innovation, Chinese Academy of Sciences
Meteorological dataCMADS (V1.1) downloaded from the National Tibetan Plateau Scientific Data Center (accessed on 18 July 2024)
Runoff dataTongjiang city hydrology station
Table 7. Schematic diagram of top and bottom elevation points in the study area.
Partition NumberInitial Range of Permeability Coefficient (m/d)Initial Value Range of Water Supply Degree
20~250.1~0.2
15~200.15~0.20
15~200.10~0.15
1~50~0.1
15~200.1~0.2
20.0~25.00.001~0.002
10.0~15.00.01~0.02
15.0~20.00.01~0.02
10.0~15.00.001~0.002
20.0~25.00.01~0.02
18.0~20.00.001~0.002
15.0~20.00.001~0.002
Table 8. Sensitivity analysis table of parameters.
EncodingParameter NameParameter MeaningOptimal Parameter (Basin No. 1)
1r__CN2.mgtSCS runoff curve value0.80
2v__GW_DELAY.gwGroundwater delay time (h)793.90
3v__GWQMN.gwLevel threshold of shallow aquifers when groundwater enters the main channel (mm)2.17
4v__REVAPMN.gwShallow groundwater evaporation depth threshold (mm)954.40
5v__SOL_AWC().solSurface water availability (mm)−0.52
6v__CH_K2.rteEffective permeability coefficient (mm/h)795.29
7v__RCHRG_DP.gwPermeability coefficient of deep aquifer0.67
8r__SOL_K().solSoil saturated water conductivity (mm/h)1.104
9r__SOL_ALB().solMoist soil albedo0.29
10v__ALPHA_BNK.rteBase flow regression constant0.31
11v__SLSUBBSN.hruAverage slope length (m)1.91
12r__HRU_SLP.hruAverage slope (m/m)2.25
13v__CANMX.hruMaximum canopy water storage (mm)227.5
14v__SFTMP.bsnAverage air temperature on snowfall days (°C)10.9
15v__SMTMP.bsnAverage temperature on snowfall days (°C)13.7
16v__SMFMX.bsnSnowmelt factor34.7
17v__TIMP.bsnTemperature lag coefficient of snow cover2.93
18v__SNOCOVMX.bsnSnow depth threshold/cm992.29
19v__TLAPS.subTemperature lapse rate (°C/km)4.51
20v__ESCO.hruSoil evaporation compensation coefficient1.41
21v__EPCO.hruPlant absorption compensation coefficient0.89
22v__ALPHA_BF.gwBase flow alpha factor (1/day)1.29
Table 9. R2 and NSE confidence comparison table.
Model ReliabilityR2NSE
Equivalent to gold0.80 < R2 ≤ 1.000.75 < NSE ≤ 1.00
Excellent0.70 < R2 ≤ 0.800.65 < NSE ≤ 0.75
Typical0.50 < R2 ≤ 0.700.50 < NSE ≤ 0.65
Not satisfactoryR2 ≤ 0.50NSE ≤ 0.50
Table 10. Conclusive values of hydrogeological parameters.
Partition NumberValue of the Permeability Coefficient (m/d)Initial Value of Water Supply
220.18
160.13
160.12
20~0.1
170.15
23.00.0014
13.00.009
150.009
140.008
230.0014
17.00.0011
17.00.0011
Table 11. Groundwater storage variable units in the middle and lower reaches of Songhua River basin, in 108 m3.
YearSupply TermExcretion TermSubtotal∆Sgw
PERCREVAPGWQDARCHG
201025.92.016.108.636.93+6.93
201113.12.5117.39.0515.76−15.76
201228.11.4817.440.938.258.25
201323.770.120.61.081.991.99
201426.650.1122221.163.383.38
201518.1022.081.155.13−5.13
201632.010.0622.061.178.728.72
Mean value23.940.6017.183.3150.168.38
Discharge percentage/% 2.881.4615.69
Table 12. Subsurface runoff modulus and recharge in sub-basins of the study area.
SubcatchmentDry Year (2011)Normal Water Year (2014)Wet Year (2016)
Runoff Modulus (l·s−1·km2)Supply (104 m3·a−1)Recoverable Amount
(104 m3·a−1)
Runoff Modulus (l·s−1·km2)Supply (104 m3·a−1)Recoverable Amount
(104 m3·a−1)
Runoff Modulus (l·s−1·km2)Supply (104 m3·a−1)Recoverable Amount
(104 m3·a−1)
10.44838.89377.500.544091.701841.270.513968.501785.83
20.435441.232448.550.687283.903277.760.626427.052892.17
30.417825.903521.660.609888.504449.830.6410,191.804586.31
41.095532.002489.400.986996.003148.201.027864.503539.03
50.885938.802672.460.887543.973394.790.948346.503755.93
60.24784.61353.070.471164.85524.180.401070.60481.77
71.7527,620.4412,429.202.1337,619.4116,928.731.8934,748.3015,636.74
81.449113.074100.881.6511,380.225121.101.7712,513.805631.21
91.7210,855.504884.981.9312,809.495764.271.9012,440.405598.18
101.8826,439.6911,897.861.6819,364.288713.931.7120,369.709166.37
110.151653.00743.850.151118.82503.470.191129.20508.14
120.384341.001953.450.261650.06742.530.261697.80764.01
131.6125,585.3011,513.391.6021,921.379864.621.6323,753.4010,689.03
140.000.000.000.000.000.000.000.000.00
150.555388.502424.830.659579.004310.550.669931.704469.27
160.121682.10756.950.313143.901414.760.282222.771000.25
171.88114,631.0051,583.951.98144,797.7065,158.972.01152,842.0868,778.94
181.4520,271.009121.951.5826,564.7011,954.121.4925,445.3011,450.39
190.19125.0056.250.23153.1668.920.25166.1474.76
200.21600.80270.360.484344.301954.940.504390.521975.73
210.551417.20637.740.631811.23815.050.661942.50874.13
221.4477,046.7834,671.051.7192,524.6141,636.071.8194,238.0042,407.10
230.343621.001629.450.414637.702086.971.554976.372239.37
240.551725.00776.250.742150.50967.730.742127.50957.38
251.2733,780.0015,201.001.4942,752.4019,238.581.5145,773.5020,598.08
260.377780.003501.000.6111,707.485268.370.6812,226.175501.78
271.7132,163.6014,473.621.8636,586.0016,463.701.7732,806.8014,763.06
280.6818,201.008190.451.2127,736.0012,481.201.1426,522.5511,935.15
290.7315,840.007128.001.1521,519.369683.711.1018,530.568338.75
300.589028.004062.600.7113,296.805983.560.6812,000.305400.14
311.6938,314.0017,241.301.9651,930.9023,368.911.8544,141.2619,863.57
321.8817,256.007765.202.1324,190.6010,885.772.3230,336.8413,651.58
total530,840.41238,878.18662,258.91298,016.51665,142.41299,314.08
Disclaimer/Publisher’s Note: The statements, opinions and data contained in all publications are solely those of the individual author(s) and contributor(s) and not of MDPI and/or the editor(s). MDPI and/or the editor(s) disclaim responsibility for any injury to people or property resulting from any ideas, methods, instructions or products referred to in the content.

