Abstract
Worldwide, the increase in impervious surfaces due to urbanization has led to significant water cycle issues such as groundwater depletion, urban heat islands, and flooding. To address these challenges, Low-Impact Development (LID) techniques are increasingly being applied in stormwater management. This study focuses on Ulsan, designated as a water cycle model city in South Korea, with a particular emphasis on the highly urbanized Okgyo drainage watershed. Using the Stormwater Management Model (SWMM) version 5.1, long-term runoff simulations were conducted to evaluate the effects of LID implementation on water cycle change rates and recovery rates. The model incorporates detailed hydrological and hydraulic parameters, including inflow, runoff, infiltration, and evapotranspiration for six subcatchments within the watershed. The SWMM was calibrated and validated using 30 years of historical rainfall data (1987–2016) from the Ulsan weather station. Calibration and validation processes used the NRCS-CN (Curve Number) method to ensure accuracy in simulating runoff patterns and water balance. The study specifically evaluated the effectiveness of two LID techniques: bioretention and permeable pavements. Three scenarios were modeled: bioretention applied to 5% of the area, permeable pavements applied to 5% of the area, and a combined application of both techniques. The results showed that the combined scenario provided the best outcome, with a 7.80% reduction in surface runoff and a 14.56% improvement in water cycle health. The LID application scenario confirmed the potential to achieve the water cycle management target of handling 25.5 mm of rainfall. These findings demonstrate that the introduction of LID techniques in public spaces can significantly enhance water management. This research provides insights into effective water cycle management methods tailored to specific urban land uses, laying a foundation for future urban planning and sustainable development.
1. Introduction
The rapid urbanization experienced across global cities has significantly increased impervious surfaces, disrupting natural water cycles [1,2,3,4]. These cycles involve the movement and storage of water through atmospheric, surface, and subterranean phases, which are crucial for sustaining global water resources and supporting diverse ecosystems [5]. However, urban development has hindered the natural infiltration of rainwater, leading to increased surface runoff and subsequent urban water cycle issues [6].
Key challenges include groundwater depletion, urban heat island effects, and flooding, all of which necessitate improvements in urban water management systems [7,8,9,10,11]. Addressing these challenges requires the development of environmentally friendly and sustainable water cycle systems that enhance rainwater infiltration and groundwater replenishment while reducing stormwater runoff [12].
In the late 1990s, the United States saw significant research efforts aimed at addressing urban stormwater issues, with the Best Management Practices (BMPs) that were introduced by the U.S. Environmental Protection Agency (EPA) in 1994 laying the groundwork for modern approaches [13]. This initiative led to the adoption of Low-Impact Development (LID) concepts, which have significantly transformed urban drainage systems, making them more environmentally sustainable. Experimental studies in Prince George’s County, Maryland, in 1998 demonstrated the environmental benefits of LID techniques over traditional gray infrastructure, which relies heavily on concrete and asphalt to manage water runoff [14,15]. Unlike these traditional systems, LID techniques support the natural water cycle and reduce ecological impacts [16]. Since the 2010s, LID techniques have expanded beyond the United States to Europe, Asia, and Australia. In 2012, the European Union (EU) introduced a sustainable urban water management strategy that included LID techniques, encouraging member countries to integrate environmentally friendly rainwater management systems into urban planning [17]. This trend has led to the development of customized LID techniques suitable for the diverse climates and terrains of Asia and Australia [18].
The Stormwater Management Model (SWMM), developed by the EPA in 1971, has become a critical tool in urban water management, simulating stormwater runoff, pollutant transport, and control strategies [19]. Research using SWMM has validated the effectiveness of BMP and LID methods in reducing runoff and removing contaminants [20]. In 2001, Washington State introduced a Stormwater Management Manual that officially incorporated LID techniques into urban planning, offering specific guidelines for minimizing runoff through integrated LID applications [21]. This marked a significant shift in water cycle management paradigms [22]. A 2007 national study by the National Research Council (NRC) validated the effectiveness of LID techniques across the U.S., highlighting their role in improving water quality and preventing flooding [23]. The European Union, in 2012, and other regions worldwide subsequently adopted similar sustainable urban water management strategies, incorporating LID techniques tailored to local climates and topographies [17,18]. Recent studies in densely urbanized areas like Shanghai have shown that applying LID techniques using SWMM can reduce urban runoff by up to 40%, significantly mitigating flood risks [24,25,26,27,28]. These findings underscore the growing importance of advanced water management practices in the context of climate change and rapid urbanization [29].
In South Korea, the adoption of LID techniques began in the late 2010s with the initiation of pilot projects in cities like Gwangju. These projects, aimed at addressing urban water quality deterioration and flood issues, have expanded to become a part of the broader urban water management strategies [30,31,32,33]. Moreover, in 2018, Busan released study results showing the successful control of runoff and improvement in water cycle systems in flood-prone areas using SWMM [34].
South Korea has continued to expand the application of LID techniques, particularly through region-specific approaches that consider local climate and geographical conditions. These strategies have helped mitigate flood damage and enhance groundwater recharge, thereby establishing healthier water cycle systems. A healthy water cycle system refers to a process where rainwater naturally infiltrates the ground before entering rivers, replenishing groundwater, and being purified by soil and vegetation before returning to the environment [35]. Particularly, Ulsan has actively adopted LID techniques, selecting priority areas for water cycle management within the Okgyo drainage watershed for focused research.
This study differs from previous ones by conducting long-term simulations using SWMM in the highly urbanized Okgyo drainage watershed to analyze the impact of LID technique implementation on runoff reduction and water cycle health. Unlike previous studies that focused on short-term impacts, this research presents a strategy for long-term change and customized water management. The study comprehensively analyzes the water cycle health and improvement measures to enhance the water management system in the region.
2. Materials and Methods
2.1. Study Area Overview
The Okgyo drainage watershed, a priority management area, is located in the southeastern part of Ulsan, South Korea, at 129°19′29″ E longitude and 35°33′12″ N latitude (Figure 1). The watershed covers an area of 0.924 km2, of which 0.859 km2 is urbanized. The average elevation of the basin is 10.87 m, with an average slope of 7.47%. The Okgyo drainage watershed is one of the most urbanized basins in Ulsan, including a major pumping station within the city center.
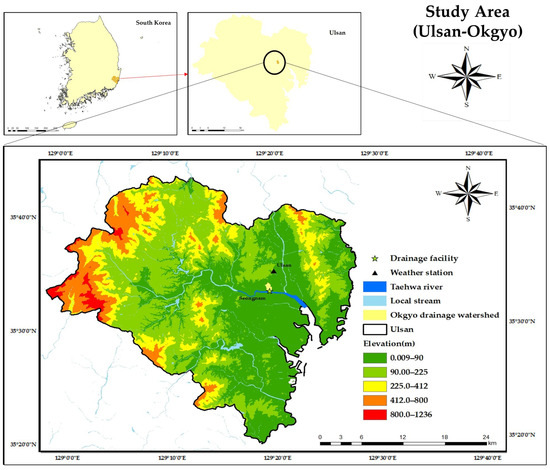
Figure 1.
Location and watershed map of the Okgyo drainage watershed in Ulsan, South Korea.
2.2. SWMM (Stormwater Management Model) 5.1
SWMM is a highly advanced hydrological simulation framework that is adept at capturing and analyzing the dynamics of runoff in urban environments. Utilizing a nonlinear reservoir method, SWMM effectively models runoff by integrating changes associated with urban land use, ensuring that predictions reflect real-world scenarios. This model employs dynamic wave routing for flow routing such that detailed simulations of stormwater movement through urban sewer systems are made possible, enhancing flood management and infrastructure planning. SWMM also integrates LID techniques, promoting sustainable urban drainage systems like permeable pavements and rain gardens. These are implemented through its standardized LID components, aiming to mimic natural hydrological processes and diminish runoff. Furthermore, SWMM’s interface is designed for ease of use, allowing planners and engineers to readily configure simulations and interpret results. The inclusion of features like 2D integration and floodplain map creation extends its utility to comprehensive urban water management and detailed flood risk assessments. SWMM 5.1, an enhancement of the original model, introduces modules that analyze the hydrological impact of LID facilities. It features a multi-layer structure including surface, pavement, soil, storage, and underdrain layers, which is designed to assess the storage and infiltration characteristics of LID facilities based on water balance analysis. The SWMM-LID module allows the consistent application of LID facilities across different subcatchments, reflecting varied land cover characteristics. This module facilitates a quantitative analysis of water storage and circulation within these layers, ensuring that water balance is maintained throughout the simulations. Key LID components modeled include bioretention cells, porous pavements, infiltration trenches, rain barrels, and vegetative swales, enhancing the model’s capability to simulate complex urban water interactions and support sustainable urban development strategies.
In this study, the stormwater network of the Okgyo drainage basin was modeled using SWMM 5.1 to analyze the rainfall–runoff relationship and evaluate the effects of LID techniques. The basin was divided into six subcatchments, and the modeled stormwater network includes a total of 71 nodes and 72 pipes. The geometric configuration of the nodes and pipes was based on topographical maps, GIS data, and design drawings. The elevation of the nodes ranges from 0.3 m to 27.3 m, and the maximum depth ranges from 0.5 m to 4.2 m. The pipes have a trapezoidal cross-section, with depths ranging from 500 mm to 2500 mm, bottom widths from 400 mm to 2700 mm, and slopes from 0.0027 to 0.5667. This design reflects the topographical characteristics and hydraulic requirements of the area. The network was designed based on a 30-year return period.
2.3. Input Data
2.3.1. Weather Data
Rainfall data for the study were sourced from the Ulsan weather station, which is located approximately 12 km northeast of the Okgyo drainage watershed, the primary focus of this study. The weather station, situated at latitude 35.5825 and longitude 129.33472 in Jung-gu, Ulsan, South Korea, stands at an elevation of 82 m with a gauge height of 1.3 m. This proximity allows for an accurate reflection of the climatic conditions affecting the watershed. The location of the weather station is also indicated in Figure 1 to provide a visual correlation between the weather data collection point and the study area. The Ulsan weather station began observations in 1931, and the rainfall data used in this study cover a total of 30 years from 1987 to 2016. The 30-year rainfall data for the Ulsan station are presented in Figure 2.
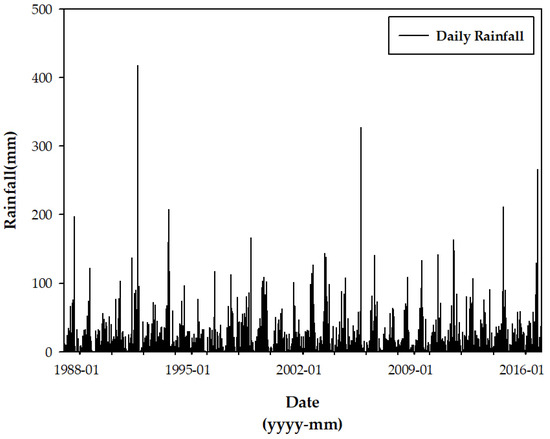
Figure 2.
The 30-year rainfall data recorded at Ulsan weather station (1987–2016, daily rainfall).
2.3.2. Geospatial Topographic Data
The Okgyo drainage watershed is near the Ulsan weather station, located in Jung-gu, Ulsan, and is a typical urbanized area adjacent to the Taehwa River, with an impervious surface ratio of 92.96%. The land use in this densely populated area primarily consists of residential and commercial zones, where stormwater runoff from roads and parking lots is drained through pipes to the Seongnam pumping station. However, there is a recorded instance of flooding due to Typhoon Chaba in 2016. For the topographical analysis of the Okgyo drainage watershed, GIS was employed to process the Digital Elevation Model (DEM) provided by the National Geographic Information Institute, which features a resolution of 5 × 5 m to assess slope variations within the watershed. For calculating the water cycle change rate, land use data were derived from the Environmental Spatial Information Service, utilizing the highly detailed 2013 land use data with a 1 × 1 m resolution across 41 categories. See Figure 3.
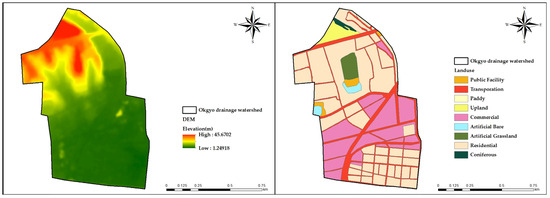
Figure 3.
DEM and land use map of the Okgyo drainage watershed.
Furthermore, the soil data required for determining the Curve Number (CN) values for runoff modeling were obtained from the 2011 soil survey data provided by Soil Toram.
2.4. Water Cycle Status Evaluation Index
The components that represent the natural water cycle system in a city include rainfall, infiltration, evapotranspiration, and surface runoff. To quantitatively evaluate the water cycle status, the Ministry of Environment introduced the concept of the water cycle recovery rate and devised a method to calculate the water cycle recovery rate based on the calculation of the water cycle change rate. The formulas are shown in Equations (1) and (2).
- Eb (): evapotranspiration in a pre-development natural state;
- Ec): evapotranspiration in a post-development urban state;
- Ib): infiltration in a pre-development natural state;
- Ic): infiltration in a post-development urban state;
- Rb): runoff in a pre-development natural state;
- Rc): runoff in a post-development urban state.
In the calculation of the water cycle change rate, the concepts of baseline water balance and current water balance are introduced. The baseline water balance refers to the values of evapotranspiration, infiltration, and runoff under natural conditions before development, considering a reasonable proportion of impervious surfaces (25% impervious surface area) [36] that maintain urban functions without deteriorating the water environment. U.S EPA has indicated that once impervious surfaces reach 25%, they begin to significantly affect urban drainage systems. Similarly, the U.S. Geological Survey (USGS) has shown that an increase in impervious areas due to urbanization is a primary cause of floods and water management problems. Therefore, maintaining a 25% impervious surface area is crucial for preserving urban functionality without degrading the water environment. The current water balance refers to the water balance values under the current urbanized conditions after development.
2.5. Low-Impact Development
The component technologies of LID techniques used in urban development and urban regeneration can be broadly categorized into planning technologies, hydraulic technologies, retention technologies, infiltration technologies, and treatment technologies. Retention and detention technologies aim to improve water cycle health by retaining or detaining stormwater runoff, allowing for sedimentation and biological reactions. Filtration and infiltration technologies promote water cycle health by filtering or infiltrating stormwater runoff through soil layers or filter media, utilizing the filtration and adsorption mechanisms of soil and media [6,19]. Treatment technologies involve facilities that combine environmental engineering treatment methods with hydraulic mechanisms, including flow control, filtration, vortex, screen, coagulation/settling, and biological treatment systems. Design technologies are non-structural elements that should be considered in the planning stage of LID techniques, including minimizing directly connected impervious areas (DCIAs), minimizing direct sewer connections for stormwater runoff, and incorporating esthetically pleasing landscaping [10,12,18]. The summary of LID technologies is shown in Figure 4.
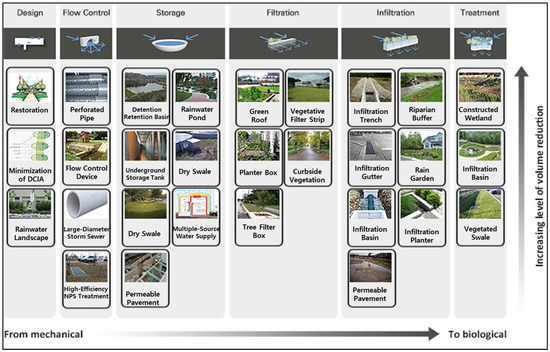
Figure 4.
Low-Impact Development practice.
2.6. NRCS-CN Methods
This method, developed by the Natural Resources Conservation Service (NRCS), is used to predict direct runoff after a rainfall event. It takes into account factors such as soil type, land use, and cover conditions to estimate runoff. The Curve Number (CN) is a key parameter in this method; it provides an index that represents the potential for runoff from rain events, incorporating soil and land cover characteristics into a single numerical value. Higher CN values indicate greater potential for runoff, while lower values suggest better infiltration. The equations related to the calculation of direct runoff using this method are shown in Equations (3)–(5). S represents potential runoff (mm), denotes initial abstraction, Q is direct runoff, and P is rainfall. If the rainfall amount is less than the initial abstraction, then Q equals 0.
The runoff calculated using this method can be used to calibrate and validate the SWMM.
3. Results
3.1. Model Development, Calibration, and Validation
Based on the sewer system records and field surveys of the Okgyo drainage watershed, the stormwater flow patterns within the watershed were analyzed, and the watershed was divided into six subcatchments. This division was performed to estimate the effects of LID components for each subcatchment and to determine their optimal placement within the target area. The stormwater flow pattern of the Okgyo drainage watershed is shown in Figure 5, and the characteristics of each subcatchment, calculated using the flow pattern and topographical data, are presented in Table 1. Figure 6 illustrates the current state of the Okgyo drainage basin.
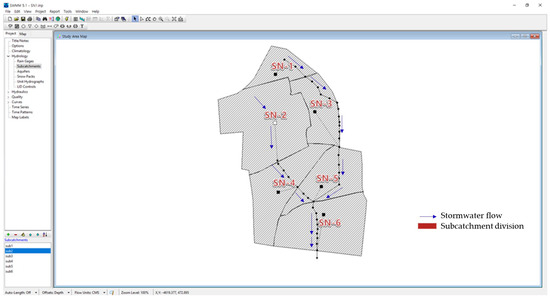
Figure 5.
Stormwater flow direction and subcatchment division map in SWMM.

Table 1.
Characteristics of subcatchments in the Okgyo drainage watershed.
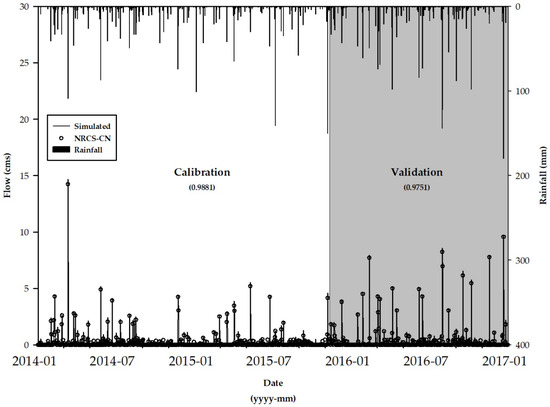
Figure 6.
Calibration and validation results for the Okgyo drainage watershed.
The model calibration and validation were quantitatively evaluated using the coefficient of determination (R2), based on the runoff values simulated by SWMM and those calculated using the NRCS-CN method. Calibration was performed for the years 2014–2015, and validation was conducted for 2016, with the results shown in Figure 6. For each subcatchment, the calculated CN values and impervious area ratios were treated as independent variables, and the calibration was performed by adjusting the variables N-Imperv, N-Perv, Dstore-Imperv, and Dstore-Perv. The calibration and validation results yielded R2 values of 0.9881 and 0.9751, respectively. R2 ranges between 0 and 1, with values closer to 1 indicating better representation of actual conditions. Therefore, the calibration results for this model indicate very good performance. The parameter values are determined as shown in Table 2.

Table 2.
Model calibration and validation results and parameter values.
3.2. Watershed Water Cycle Status Evaluation
Using the SWMM model for the Okgyo drainage watershed, a long-term runoff simulation was conducted over a 30-year period from 1987 to 2016. The analysis results for total inflow, runoff, infiltration, and evapotranspiration for each drainage subcatchment are presented in Table 3.

Table 3.
SWMM results for the Okgyo drainage watershed (1987–2016).
Based on the calculated values, the baseline water balance and current water balance for the Okgyo drainage watershed were analyzed, and the water cycle change rate and water cycle recovery rate were calculated as shown in Table 4. As urbanization has progressed in the Okgyo drainage watershed, the runoff coefficient and impervious area ratio have increased. The water balance assessment results indicate that the proportion of runoff is high, ranging from 90.80% to 98.29%, while the proportion of infiltration ranges from 0.00% to 7.93%, and evapotranspiration accounts for 1.27% to 2.43%. The water cycle change rate shows a variation of 8.76% to 42.01% compared to the baseline, while the water cycle recovery rate is evaluated at 57.99% to 91.24%.

Table 4.
Water balance, water cycle change rate, and water cycle recovery rate results for the Okgyo drainage watershed.
3.3. Watershed LID Application Methods
3.3.1. Water Cycle Target Setting
The principle for setting water cycle management targets is to maintain pre-development peak flood volumes and average runoff volumes within the land use units, even after development. These targets should be set in conjunction with the management goals of rivers, sewer systems, and other related facilities and can be determined according to the research approach. In both domestic and international research cases, water cycle targets are generally categorized into three main approaches: rainfall depth (mm), unit infiltration rate (mm/h), and recurrence frequency of design storms (years) [21]. Among these, the most commonly used approach is to determine the design capacity of LID facilities by linking rainfall depth (mm) with the catchment area, which is then applied in practice. The criteria and application examples for water cycle management targets in various countries for the introduction of LID techniques are shown in Table 5.

Table 5.
Water cycle management target criteria by country.
This study established water cycle management targets that can be tailored to the specific characteristics of each country, initially demonstrating the approach by focusing on the 85th percentile of rainfall events as applicable in South Korea. By reordering the past 30 years (1987–2016) of rainfall data from the Ulsan weather station, the 85th percentile rainfall was determined. As a result, the rainfall was calculated to be 25.5 mm, which was set as the water cycle management target for the Okgyo drainage watershed. To achieve the water cycle management target of reducing 25.5 mm of rainfall, it is necessary not only to prevent runoff for rainfall below the 85th percentile but also to reduce runoff for rainfall exceeding 25.5 mm. For this purpose, the total runoff reduction target was analyzed by evaluating 30 years of rainfall data. The analysis established the water cycle management target at 67.88%, with the cumulative rainfall recorded at 26,197.7 mm and the total runoff reduction target calculated to be 24,219,754 m3.
3.3.2. Results of LID Application Scenarios and Water Cycle Improvement
The land use types in the Okgyo drainage watershed were reclassified for LID application, as shown in Table 6.

Table 6.
Land use area by subcatchment in the Okgyo drainage watershed.
The Okgyo drainage watershed has a high proportion of impervious surfaces throughout the watershed, with subcatchments SN-4, SN-5, and SN-6 in the downstream areas being assessed as having 100% imperviousness. These areas are primarily occupied by commercial and residential facilities, and the backstreets of commercial and residential land are used as parking spaces for residents, making the application of LID facilities somewhat challenging. Therefore, the installation of LID in public areas should be prioritized. Scenarios were developed by considering the installation of stormwater retention tanks on major roads, intersections, public facility land, and educational facility land, as outlined in Table 7. For all scenarios, public facilities, roads, and educational facilities were consistently designated as application sites. Scenario 1 involved the implementation of 5% vegetative swales, Scenario 2 implemented 5% permeable pavements, and Scenario 3 combined both 5% vegetative swales and 5% permeable pavements for analysis.

Table 7.
LID scenario development by land use type.
The analysis results of the LID application scenarios using the SWMM model are presented in Table 8 and Figure 7.

Table 8.
Analysis results of LID application scenarios for the Okgyo drainage watershed.
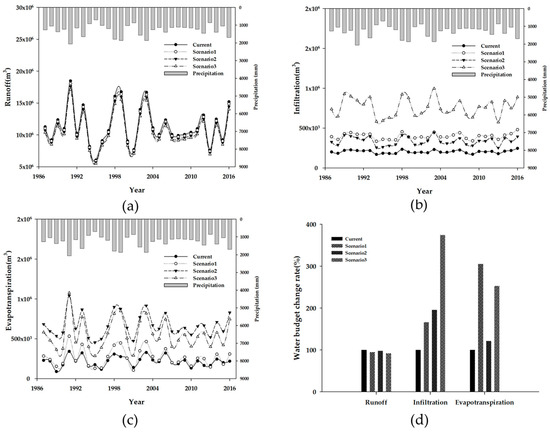
Figure 7.
SWMM runoff analysis results for the Okgyo drainage watershed. (a) Runoff for each scenario, (b) infiltration for each scenario, (c) evapotranspiration for each scenario, and (d) water budget change rate for each scenario.
As a result of simulating long-term runoff for each scenario, Scenario 3 was reduced the most compared to the current status standard, followed by Scenario 2, 1, and so on.
The amount of penetration increased the most in Scenario 3 compared to the current status standard and increased in the order of 1st and 2nd. In terms of evapotranspiration, Scenario 3 increased the most compared to the current status standard, followed by the second and first. For each scenario, the outflow was reduced by 2.11–7.80%, and the water cycle condition was improved by increasing the amount of penetration and evapotranspiration, and for Scenario 3, the outflow reduction amount was 26,824,780 m3, which was evaluated to satisfy the outflow reduction target of 24,219,754 m3. Based on the analysis results of scenario 3, the baseline water balance, current water balance, and LID-applied water balance for the Okgyo drainage basin were evaluated. It was confirmed that the overall water cycle change rate for the basin decreased from the current 26.27% to 11.71%, indicating a recovery to the baseline water cycle state. The water cycle recovery rate improved from the current 73.73% to 88.29%, showing a recovery of 14.56 percentage points. The results for the current water balance, LID-applied water balance, water cycle change rate, and water cycle recovery rate for each drainage subcatchment are summarized in Table 9.

Table 9.
Water balance results after LID application.
4. Discussion
In this study, the implementation of LID techniques within the Okgyo drainage watershed in Ulsan was evaluated using the SWMM. The research focused on the impacts of bioretention areas and permeable pavements on runoff reduction and the enhancement of the water cycle’s health. Supporting evidence from [5,37] was further corroborated, illustrating the superior ability of LID techniques to emulate natural hydrological cycles and minimize ecological damage compared to traditional infrastructure.
The use of LID techniques has shown consistent benefits for managing urban water resources and mitigating flood risks. This study extends these findings by clarifying the effectiveness of LID applications in enhancing the water cycle, aligning with similar successful implementations in diverse urban settings across Europe, Asia, and Australia post the EU’s 2012 sustainable water management directive. Our comparative analysis provides valuable insights into adapting LID strategies to the unique climatic and geographical nuances of urban environments.
This research also delves deeper than the methodology used by [38] by integrating various LID components into the SWMM to provide a detailed method for minimizing runoff. These efforts enrich the existing methodologies and bolster the practical application of LID in urban drainage systems.
Moreover, this research contributes to the discourse on sustainable urban water management in the context of climate change and rapid urbanization, as outlined by [39]. Utilizing both the SWMM and the NRCS-CN methods, our findings advocate for a holistic approach to urban water management that incorporates LID techniques effectively, underscoring their crucial role in fostering sustainable urban environmental practices.
5. Conclusions
The analysis of LID techniques within Ulsan’s highly urbanized Okgyo drainage watershed, conducted through extensive SWMM simulations, demonstrates a marked improvement in the urban water cycle, particularly in reducing runoff and enhancing the water cycle recovery rate.
- (1)
- Reduction in runoff and improvement in water cycle health: Implementing bioretention and permeable pavements resulted in up to a 7.80% reduction in surface runoff and a 14.56% increase in the water cycle recovery rate. These results emphasize the transformative potential of LID techniques in modifying urban hydrological responses and advancing sustainable urban water management.
- (2)
- Achievement of water management targets: The effectiveness of LID techniques in public and critical water management areas has been validated, meeting predefined targets. Specifically, these techniques adeptly managed rainfall up to the 85th percentile, mitigating impacts from 25.5 mm events and enhancing flood resilience.
- (3)
- Foundation for future urban water management strategies: This study lays a foundational framework for integrating innovative water management practices with traditional methods, providing actionable insights for designing urban water systems that align with both ecological sustainability and urban resilience objectives. The adaptability of LID techniques demonstrated here serves as a model for other cities facing similar environmental and urban challenges.
- (4)
- Recommendations for policy and practice: The adoption of policy measures that promote the inclusion of LID strategies in both new and existing urban plans is recommended. Such strategies should be prioritized by urban planners and policymakers to ensure that water management efforts holistically benefit urban ecological systems and contribute to sustainable urban development.
Overall, this research highlights the effectiveness of LID techniques in bolstering the resilience of urban water systems against the dual challenges of increased urbanization and climate variability. Ongoing adaptation and research into these practices are essential for evolving our global understanding and implementation of sustainable water management strategies.
Author Contributions
Conceptualization, S.K. and J.K.; methodology, J.K.; software, J.K.; validation, J.K. and J.P.; formal analysis, J.K.; investigation, J.K.; resources, S.K.; data curation, J.K.; writing—original draft preparation, J.K.; writing—review and editing, S.C.; visualization, J.K.; supervision, S.C.; project administration, J.K. and J.P.; funding acquisition, S.K. All authors have read and agreed to the published version of the manuscript.
Funding
This work was supported by the National Research Foundation of Korea (NRF) grant funded by the Korean government (MSIT) (No. RS-2023-00259994). This work was supported by the Brain Korea 21 FOUR Project in the Education & Research Center for Infrastructure of Smart Ocean City (i-SOC Center).
Institutional Review Board Statement
Not applicable.
Informed Consent Statement
Informed consent was obtained from all subjects involved in the study.
Data Availability Statement
The data presented in this study are available in the current manuscript, and raw data are available on request from the corresponding author.
Conflicts of Interest
The authors declare no conflicts of interest.
References
- Kim, K.H.; Park, Y.S. The effects of urbanization on water quality in streams: A case study of the Han River Basin. Korean J. Water Resour. 1995, 28, 57–68. [Google Scholar]
- Choi, J.H.; Kim, D.H. A study on urbanization effects on rainfall-runoff characteristics in urban areas. J. Korean Soc. Civ. Eng. 2004, 24, 215–222. [Google Scholar]
- Hwang, J.H.; Lee, S.Y. The impact of urbanization on water cycle changes in the Seoul metropolitan area. Environ. Eng. Res. 2017, 22, 243–250. [Google Scholar]
- Park, S.J.; Lee, C.K. The influence of urbanization on water cycle in urban areas: A case study of Seoul. Environ. Monit. Assess. 2019, 191, 238. [Google Scholar]
- Eslamian, S. Urban Water Reuse Handbook; Taylor & Francis, CRC Group: Boca Raton, FL, USA, 2016; p. 1141. [Google Scholar]
- Ahiablame, L.M.; Engel, B.A.; Chaubey, I. Effectiveness of low impact development practices: Literature review and suggestions for future research. Water Air Soil Pollut. 2012, 223, 4253–4273. [Google Scholar] [CrossRef]
- Hatt, B.E.; Fletcher, T.D.; Deletic, A. The influence of urbanization on the hydrology of urban water systems. Water Sci. Technol. 2004, 49, 95–102. [Google Scholar] [CrossRef]
- Burch, S.; Dyer, J. Urbanization and its impact on groundwater: The case of the city of Los Angeles. Groundwater 2010, 48, 508–518. [Google Scholar]
- Park, H.J.; Shin, S.J. Analysis of groundwater depletion in urban areas: Case study of Seoul. J. Water Clim. Chang. 2015, 6, 67–76. [Google Scholar]
- Ministry of Environment. Study on the Selection and Development of Water Circulation Leading Cities through the Introduction of Low Impact Development Techniques; Ministry of Environment: Gwachen, Republic of Korea, 2017.
- Kim, J.H.; Lee, K.M. Flood risk assessment and management in urban areas. J. Korean Soc. Hazard Mitig. 2018, 18, 37–45. [Google Scholar] [CrossRef]
- Ministry of Environment. Low Impact Development (LID) Design Guidelines; Ministry of Environment: Gwachen, Republic of Korea, 2016.
- U.S. EPA. Urban Stormwater Management in the United States; U.S. Environmental Protection Agency: Washington, DC, USA, 1994.
- Palla, A.; Gnecco, I.; Lanza, L.G. LID practices in urban areas: A review of the opportunities and constraints. Water 2018, 10, 542. [Google Scholar] [CrossRef]
- Chao, H.L.; Mow, S.C.; Yao, L.T. Low impact development: An innovative alternative approach to stormwater management. J. Mar. Sci. Technol. 2000, 8, 41–49. [Google Scholar] [CrossRef]
- Fletcher, T.D.; Shuster, W.; Hunt, W.F.; Ashley, R.; Butler, D.; Arthur, S.; Wright, G. SUDS, LID, BMPs, and more—The evolution and application of terminology surrounding urban drainage. Urban Water J. 2015, 12, 525–542. [Google Scholar] [CrossRef]
- University of Arkansas Community Design Center. Low Impact Development: A Design Manual for Urban Areas; University of Arkansas Press: Fayetteville, AR, USA, 2010. [Google Scholar]
- Korea Land and Housing Corporation. Study on Stormwater Management for Urban Areas; LH Corporation: Jinju-si, Republic of Korea, 2018. [Google Scholar]
- Dietz, M.E. Low impact development practices: A review of current research and recommendations for future directions. Water Air Soil Pollut. 2007, 186, 351–363. [Google Scholar] [CrossRef]
- Baek, S.S.; Choi, D.H.; Jung, J.W.; Lee, H.J.; Lee, H.; Yoon, K.S.; Cho, K.W. Optimizing low impact development (LID) for stormwater runoff treatment in urban areas, Korea: Experimental and modeling approach. Water Res. 2015, 86, 122–131. [Google Scholar] [CrossRef] [PubMed]
- United States Environmental Protection Agency (USEPA). Sustainable Practices for Protecting and Restoring Urban Waterways; U.S. Environmental Protection Agency: Washington, DC, USA, 2009.
- Schueler, T.R. The importance of imperviousness. Watershed Prot. Tech. 1994, 1, 100–111. [Google Scholar]
- National Association of City Transportation Officials. Urban Street Stormwater Guide. Available online: https://nacto.org/publication/urban-street-stormwater-guide/ (accessed on 1 October 2024).
- Seoul Metropolitan Government. Rainwater Harvesting Guideline; Seoul Metropolitan Government: Seoul, Republic of Korea, 2009.
- Zhang, K.; Wang, H.; Zeng, W. Effects of LID practices on stormwater management: A review of literature. Water 2017, 9, 433. [Google Scholar] [CrossRef]
- Yang, J.; Wang, S. Application of stormwater management model (SWMM) to assess the effectiveness of low impact development in urban areas. Sustain. Cities Soc. 2017, 34, 377–386. [Google Scholar] [CrossRef]
- Chen, X.; Zhang, L. Evaluation of low impact development strategies for urban stormwater management: A case study in Shanghai. Water 2018, 10, 1589. [Google Scholar] [CrossRef]
- Zhao, Y.; Liu, S. Impacts of low impact development on urban flood mitigation: Evidence from Shanghai. J. Hydrol. 2020, 582, 124514. [Google Scholar]
- Brown, R.A.; Hunt, W.F. Impacts of media depth on effluent water quality and hydrologic performance of undersized bioretention cells. J. Irrig. Drain. Eng. 2010, 136, 928–936. [Google Scholar] [CrossRef]
- Jung, H.J.; Kim, J.H. Integrated urban water management for sustainable cities: Addressing water quality and flood risks. J. Water Resour. Plan. Manag. 2016, 142, 04016057. [Google Scholar] [CrossRef]
- Choi, H.J.; Lee, K.S. Assessment of urban water quality improvement strategies in response to flood risks. Water Sci. Technol. 2017, 76, 1503–1512. [Google Scholar] [CrossRef]
- Ministry of Land, Infrastructure and Transport. Comprehensive Manual of Korean Low Impact Development Technology: Green City Infrastructure; Ministry of Land, Infrastructure and Transport: Seoul, Republic of Korea, 2018.
- Lee, S.H.; Park, J.Y. Evaluating the effectiveness of urban water management strategies for flood mitigation and water quality improvement. Environ. Sci. Pollut. Res. 2019, 26, 11985–11998. [Google Scholar]
- Woods-Ballard, B.; Kellagher, R.; Martin, P.; Jefferies, C.; Bray, R.; Shaffer, P. The SuDS Manual; CIRIA C697: London, UK, 2007. [Google Scholar]
- Backstrom, M. Sediment transport in grass swales during simulated runoff events. Water Res. 2002, 36, 4420–4426. [Google Scholar]
- Goonetilleke, A.; Thomas, E.; Ginn, S.; Gilmore, A. Understanding the role of urbanization on water quality: A review of urban water management strategies. Water Res. 2005, 39, 1–16. [Google Scholar] [CrossRef]
- Coffman, L.S. Low-Impact Development Design: A New Paradigm for Stormwater Management Mimicking Nature’s Flow Patterns; Prince George’s County, Maryland Department of Environmental Resources: Upper Marlboro, MD, USA, 1998.
- Washington State Department of Ecology. Stormwater Management Manual for Western Washington; Washington State Department of Ecology: Olympia, WA, USA, 2001.
- Kang, H.J.; Lee, S.M.; Kim, J.M.; Park, Y.J. Climate change and urbanization: Challenges for water management in dense urban areas. Environ. Eng. Res. 2023, 28, 125–135. [Google Scholar]
Disclaimer/Publisher’s Note: The statements, opinions and data contained in all publications are solely those of the individual author(s) and contributor(s) and not of MDPI and/or the editor(s). MDPI and/or the editor(s) disclaim responsibility for any injury to people or property resulting from any ideas, methods, instructions or products referred to in the content. |
© 2024 by the authors. Licensee MDPI, Basel, Switzerland. This article is an open access article distributed under the terms and conditions of the Creative Commons Attribution (CC BY) license (https://creativecommons.org/licenses/by/4.0/).