
SEAWAT Scenarios Evaluating Links between the Southern Gabès (TN) Confined Aquifer and the Mediterranean Sea


 , ,
, , 

Abstract
1. Introduction
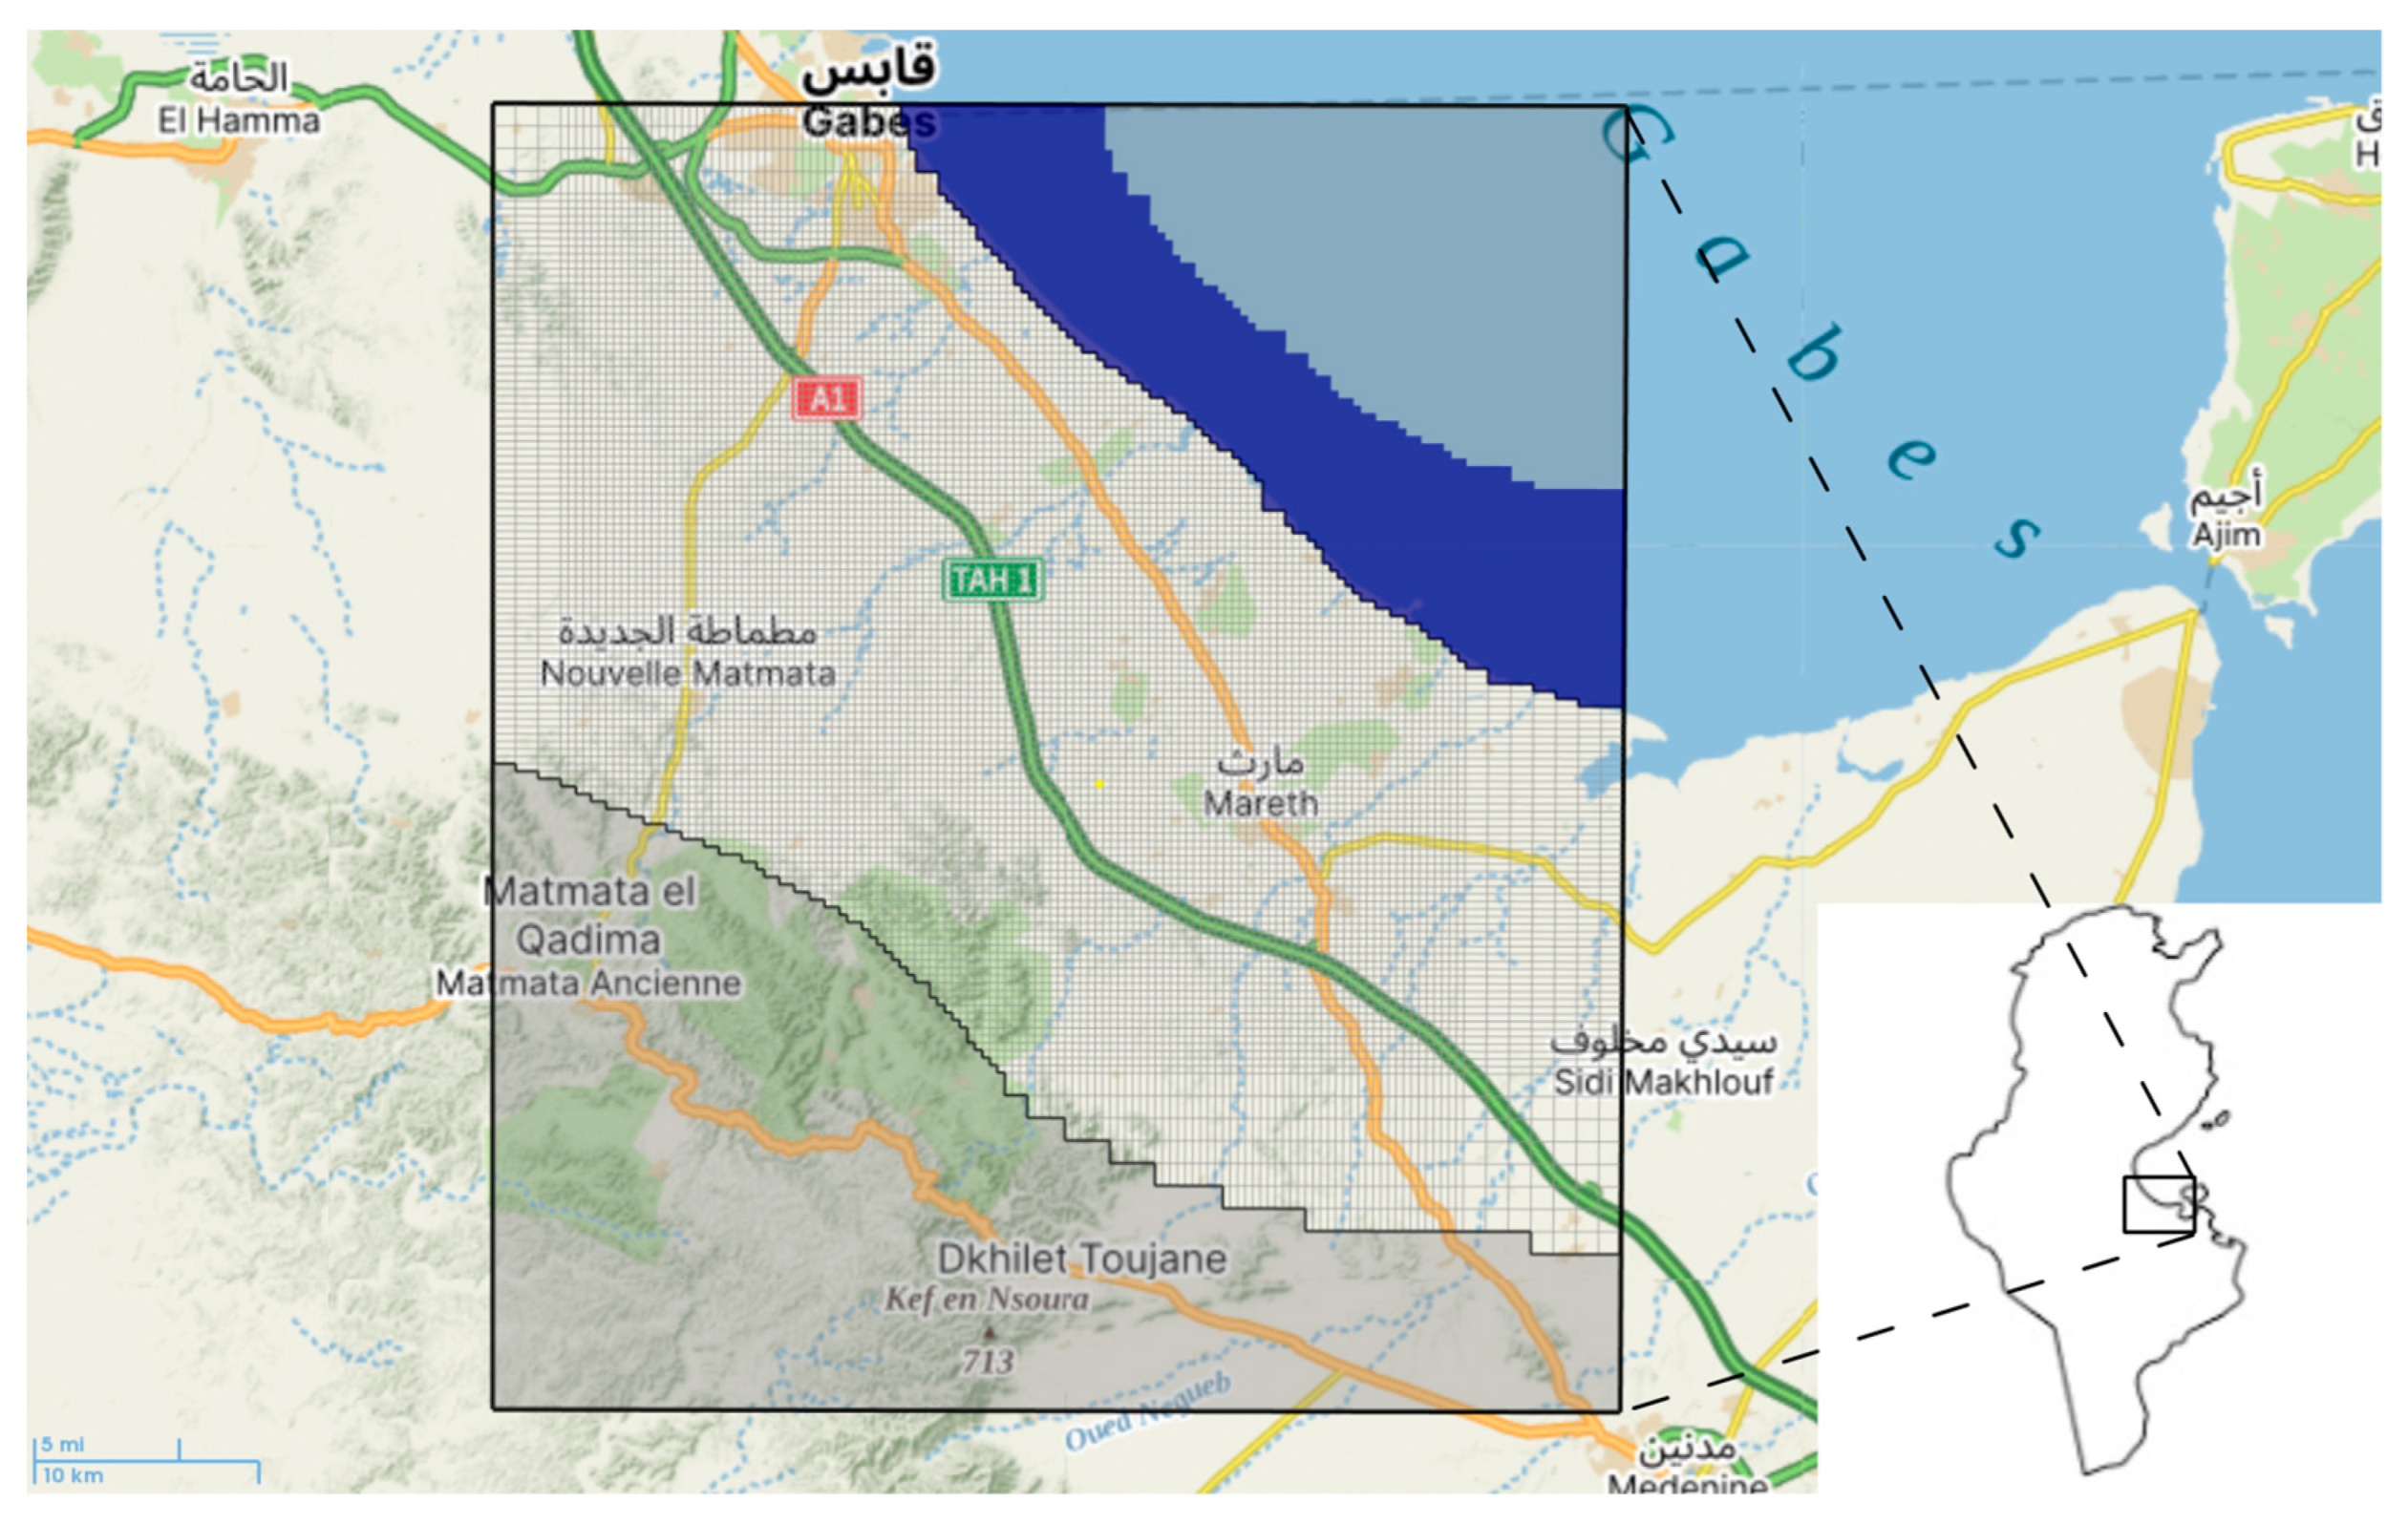
2. Study Area
2.1. Geographical and Climatic Overview
2.2. Geological and Hydrological Characteristics
2.3. Hydrochemical Context
3. Materials and Methods
3.1. Data Integration
3.2. Groundwater Flow Model Development
3.3. Salinity Transfer Modeling
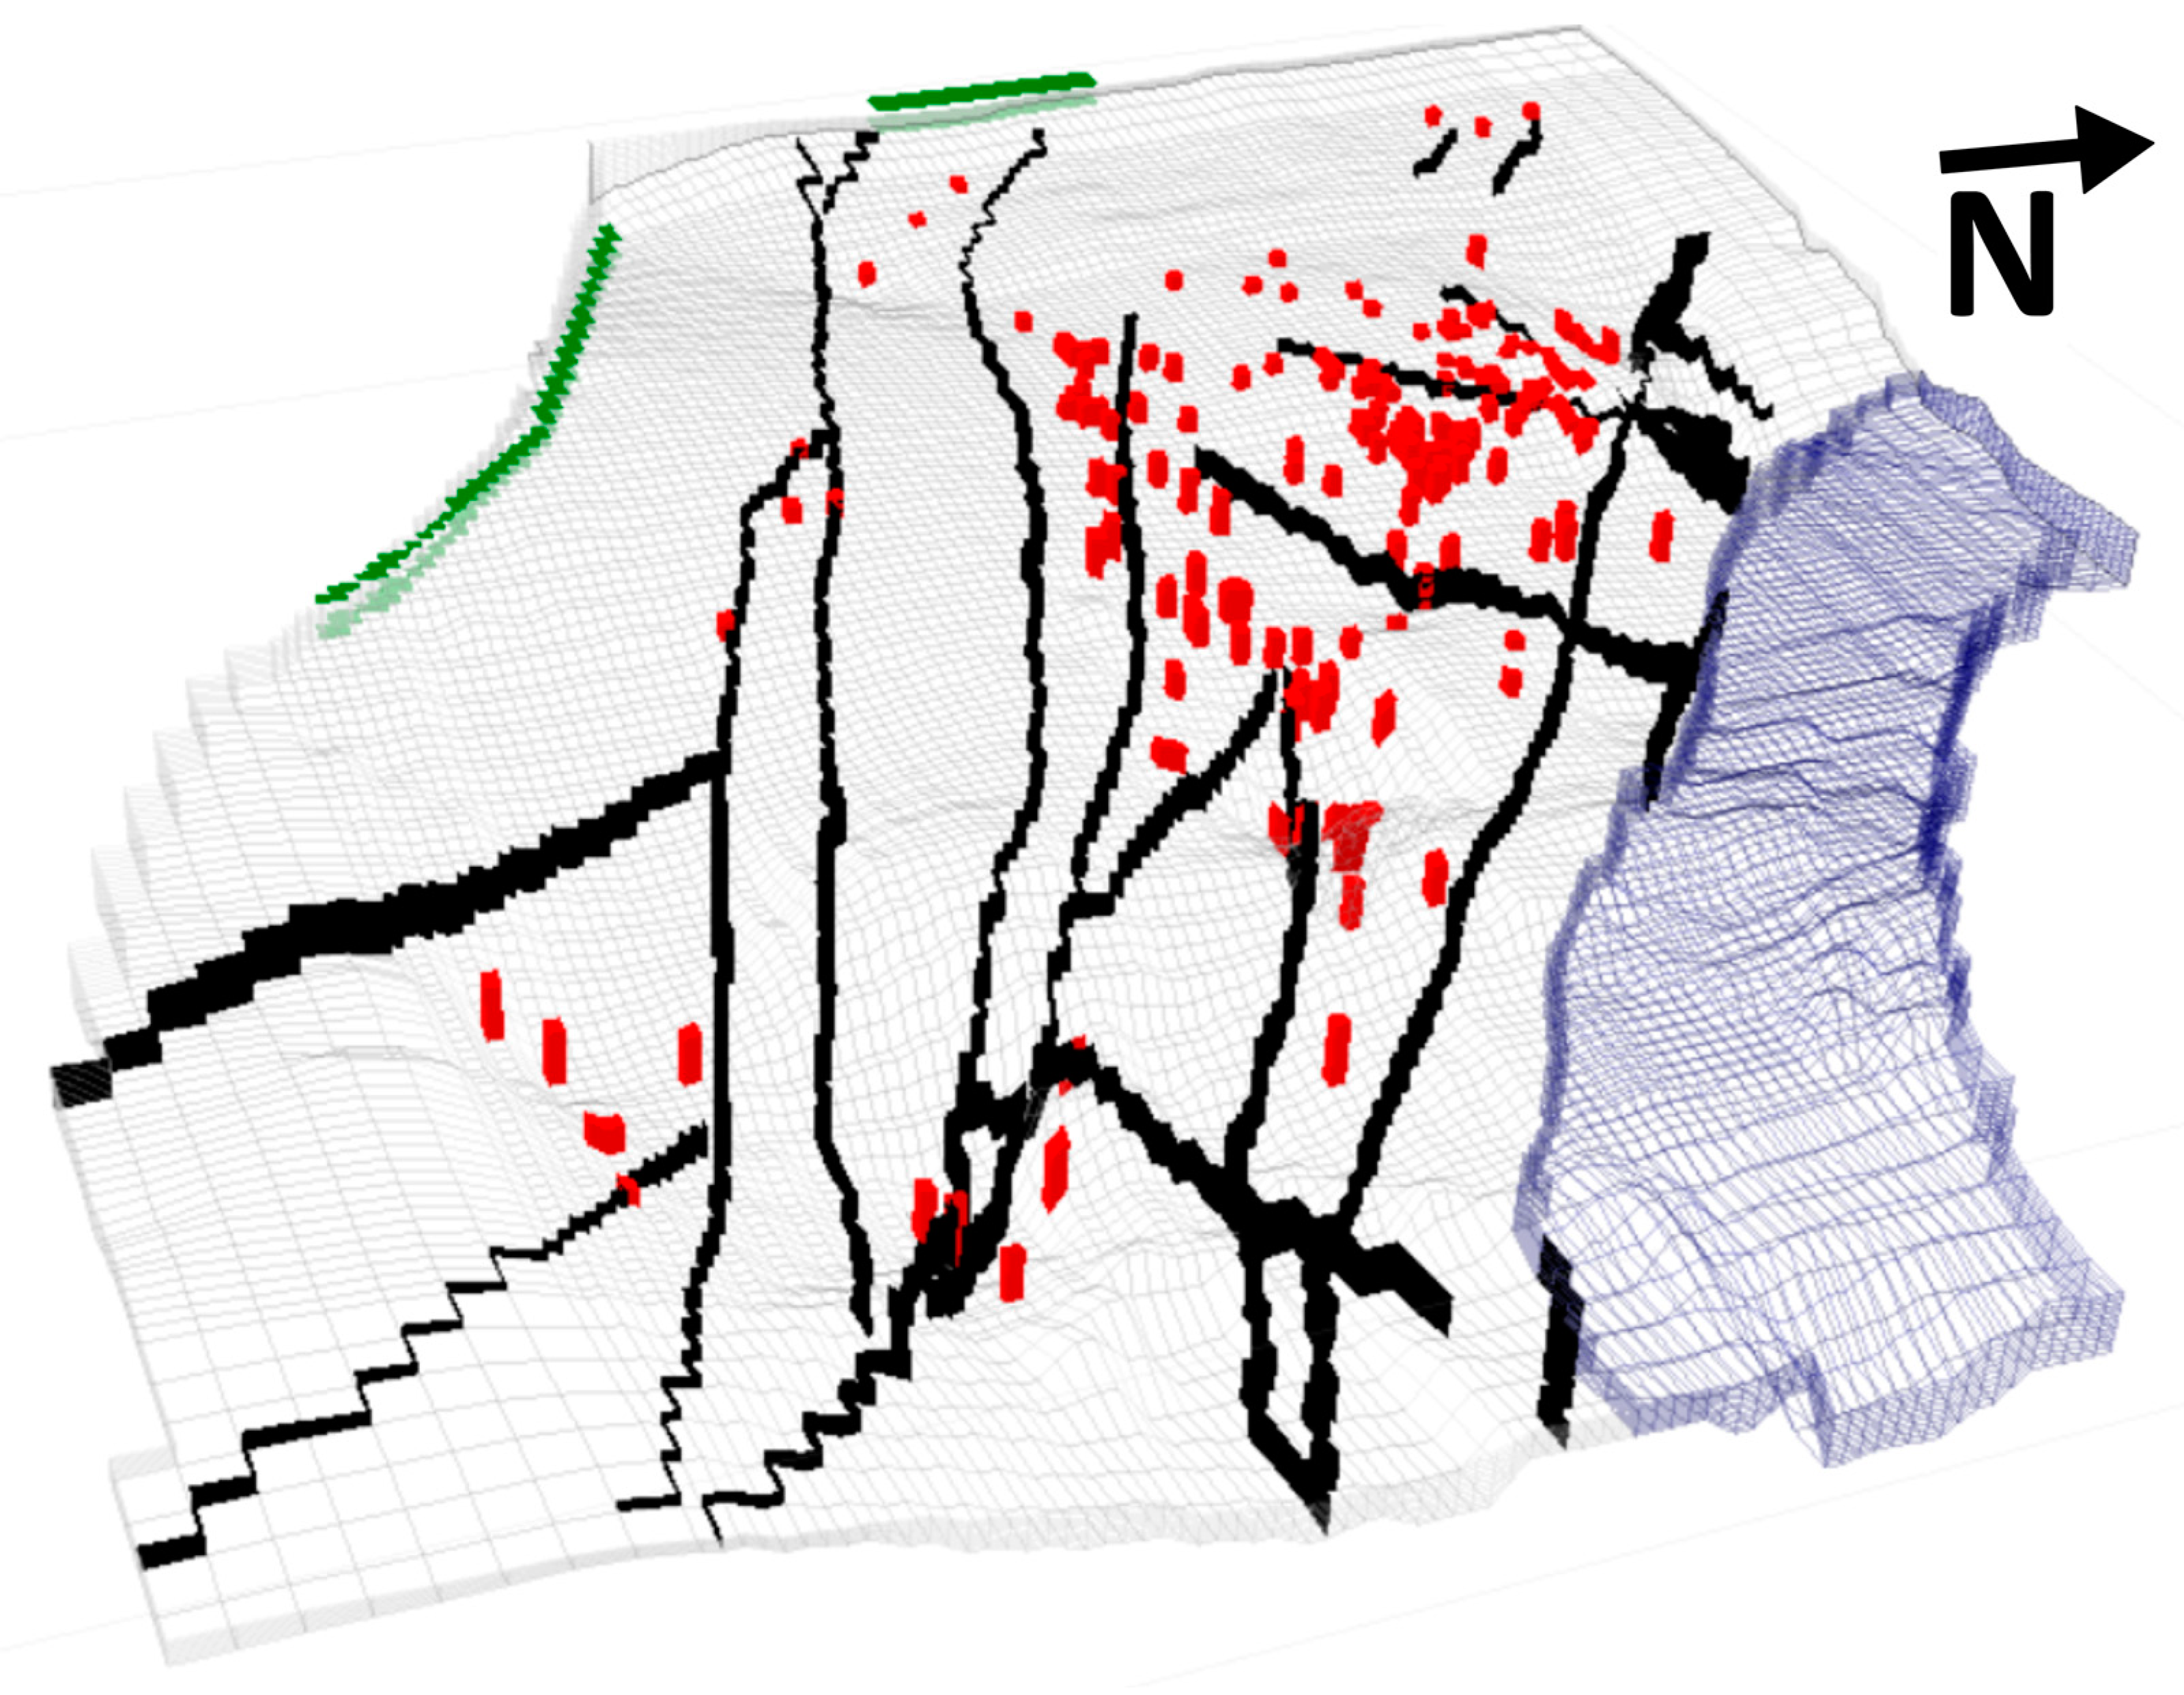
3.4. Grid Design Conditions
4. Results
5. Discussion
6. Conclusions
Author Contributions
Funding
Data Availability Statement
Conflicts of Interest
References
- Villholth, K.G. Groundwater Trends, Challenges and Solutions—From Global to Local; Grundfos Groundwater Days Aarhus Waterworks: Aarhus, Denmark, 2016; pp. 8–12. [Google Scholar]
- Van der Gun, J. Groundwater and Global Change: Trends, Opportunities and Challenges; UN World Water Assessment Program, WWDR: Perugia, Italy, 2012; 38p. [Google Scholar]
- Foster, S.; Tyson, G.; Konikow, L.; Custodio, E.; Villholth, K.G.; van der Gun, J.; Klingbeil, R. Food Security and Groundwater; Strategic Overview Series; International Association of Hydrogeologists: Vetralla, Italy, 2015; 6p. [Google Scholar]
- Klassen, J.; Allen, D.M. Assessing the Risk of Saltwater Intrusion in Coastal Aquifers. J. Hydrol. 2017, 551, 730–745. [Google Scholar] [CrossRef]
- Bear, J.; Cheng, H.D. Seawater Intrusion. In Modeling Groundwater Flow and Contaminant Transport; Theory and Applications of Transport in Porous Media; Springer: Dordrecht, The Netherlands, 2010; Volume 23. [Google Scholar] [CrossRef]
- Cantelon, J.A.; Guimond, J.A.; Robinson, C.E.; Michael, H.A.; Kurylyk, B.L. Vertical Saltwater Intrusion in Coastal Aquifers Driven by Episodic Flooding: A Review. Water Resour. Res. 2022, 58, e2022WR032614. [Google Scholar] [CrossRef]
- Colombani, N.; Osti, A.; Volta, G.; Mastrocicco, M. Impact of Climate Change on Salinization of Coastal Water Resources. Water Resour. Manag. 2016, 30, 2483–2496. [Google Scholar] [CrossRef]
- Hamed, Y.; Hadji, R.; Redhaounia, B.; Zighmi, K.; Bâali, F.; El Gayar, A. Climate Impact on Surface and Groundwater in North Africa: A Global Synthesis of Findings and Recommendations. Euro-Mediterr. J. Environ. Integr. 2018, 3, 25. [Google Scholar] [CrossRef]
- Prusty, P.; Farooq, S.H. Seawater Intrusion in the Coastal Aquifers of India—A Review. HydroResearch 2020, 3, 61–74. [Google Scholar] [CrossRef]
- Costall, A.R.; Harris, B.D.; Teo, B.; Schaa, R.; Wagner, F.M.; Pigois, J.P. Groundwater Throughflow and Seawater Intrusion in High Quality Coastal Aquifers. Sci. Rep. 2020, 10, 9866. [Google Scholar] [CrossRef]
- Wederni, K.; Alaya, M.; Missaoui, R.; Hamed, Y. Assessment of Groundwater Hydrogeochemical Characteristics and Salinization Intrusion in Coastal Arid Area (South Gabes, South-East Tunisia). J. Afr. Earth Sci. 2023, 200, 104875. [Google Scholar] [CrossRef]
- Hajji, S.; Allouche, N.; Bouri, S.; Aljuaid, A.M.; Hachicha, W. Assessment of Seawater Intrusion in Coastal Aquifers Using Multivariate Statistical Analyses and Hydrochemical Facies Evolution-Based Model. Int. J. Environ. Res. Public Health 2022, 19, 155. [Google Scholar] [CrossRef]
- Boughariou, E.; Allouche, N.; Ben Brahim, F.; Nasri, G.; Bouri, S. Delineation of groundwater potentials of Sfax region, Tunisia, using fuzzy analytical hierarchy process, frequency ratio, and weights of evidence models. Environ. Dev. Sustain. 2021, 23, 14749–14774. [Google Scholar] [CrossRef]
- Haj-Amor, Z.; Hashemi, H.; Bouri, S. The consequences of saline irrigation treatments on soil physicochemical characteristics. Euro-Mediterr. J. Environ. Integr. 2018, 3, 22. [Google Scholar] [CrossRef]
- Chang, C.-M.; Yeh, H.-D. Spectral Approach to Seawater Intrusion in Heterogeneous Coastal Aquifers. Hydrol. Earth Syst. Sci. 2010, 14, 719–727. [Google Scholar] [CrossRef]
- Mastrocicco, M.; Gervasio, M.P.; Busico, G.; Colombani, N. Natural and Anthropogenic Factors Driving Groundwater Resources Salinization for Agriculture Use in the Campania Plains (Southern Italy). Sci. Total Environ. 2021, 758, 144033. [Google Scholar] [CrossRef] [PubMed]
- Seibert, S.L.; Greskowiak, J.; Oude Essink, G.H.; Massmann, G. Understanding Climate Change and Anthropogenic Impacts on the Salinization of Low-Lying Coastal Groundwater Systems. Earth’s Future 2024, 12, e2024EF004737. [Google Scholar] [CrossRef]
- Panthi, J.; Pradhanang, S.M.; Nolte, A.; Boving, T.B. Saltwater Intrusion Into Coastal Aquifers In The Contiguous United States—A Systematic Review Of Investigation Approaches And Monitoring Networks. Sci. Total Environ. 2022, 836, 155641. [Google Scholar] [CrossRef]
- Ncibi, K.; Hadji, R.; Hamdi, M.; Mokadem, N.; Abbes, M.; Khelifi, F.; Zighmi, K.; Hamed, Y. Application of the Analytic Hierarchy Process to Weight the Criteria Used to Determine the Water Quality Index of Groundwater in the Northeastern Basin of the Sidi Bouzid Region, Central Tunisia. Euro-Mediterr. J. Environ. Integr. 2020, 5, 19. [Google Scholar] [CrossRef]
- Wang, C.; Fogg, G.E.; Pauloo, R.A. Groundwater Basin Openness and Sustainability. Water Resour. Res. 2024, 60, e2023WR035446. [Google Scholar] [CrossRef]
- Wang, Z.; Li, F.; Xia, Y.; Chen, H.; Wang, K.; Fu, S.; Wang, G. Spatial Distribution Of Groundwater Quality in the Coastal Plain and Its Relationship with Land Use and Seawater Intrusion. Environ. Earth Sci. 2021, 80, 465. [Google Scholar] [CrossRef]
- Zhao, J.; Lin, J.; Wu, J.; Wu, J. Impact of Climate Change on Multi-Objective Management of Seawater Intrusion in Coastal Karst Aquifers in Zhoushuizi District of Dalian City, China. Hydrogeol. J. 2021, 29, 2329–2346. [Google Scholar] [CrossRef]
- Nemer, Z.; Khaldaoui, F.; Benaissa, Z.; Belaroui, A.; Tebbouche, M.Y.; Ydri, A. Hydrogeophysical Investigation of Aquifer Parameters and Seawater Intrusion: A Case Study from Eastern Mitidja Plain, Algeria. Geomech. Geophys. Geo-Energy Geo-Resour. 2023, 9, 60. [Google Scholar] [CrossRef]
- Bear, J.; Cheng, A.H.D.; Sorek, S.; Ouazar, D.; Herrera, I. (Eds.) Seawater Intrusion in Coastal Aquifers: Concepts, Methods and Practices; Springer Science & Business Media: Dordrecht, The Netherland, 1999; 91p. [Google Scholar]
- Haj-Amor, Z.; Bouri, S. Subsurface Drainage System Performance, Soil Salinization Risk, and Shallow Groundwater Dynamic under Irrigation Practice in an Arid Land. Arab. J. Sci. Eng. 2019, 44, 467–477. [Google Scholar] [CrossRef]
- Bear, J.; Cheng, A.H.D. Modelling Groundwater Flow and Contaminant Transport; Springer: Dordrecht, The Netherland, 2010; pp. 89–103. [Google Scholar] [CrossRef]
- Mehri, A.; Sogut, A.R. Hydrochemical and statistical study of the groundwater salinization in the region of Gabes in Tunisia. Arab. J. Geosci. 2020, 13, 1128. [Google Scholar] [CrossRef]
- Atoui, M.; Agoubi, B. Assessment of groundwater vulnerability and pollution risk using AVI, SPI, and RGPI indexes: Applied to southern Gabes aquifer system, Tunisia. Environ. Sci. Pollut. Res. 2022, 29, 50881–50894. [Google Scholar] [CrossRef] [PubMed]
- Béjaoui, B.; Ismail, S.B.; Othmani, A.; Hamida, O.B.A.B.H.; Chevalier, C.; Feki-Sahnoun, W.; Harzallah, A.; Hamida, N.B.H.; Bouaziz, R.; Dahech, S.; et al. Synthesis review of the Gulf of Gabes (eastern Mediterranean Sea, Tunisia): Morphological, climatic, physical oceanographic, biogeochemical and fisheries features. Estuar. Coast. Shelf Sci. 2019, 219, 395–408. [Google Scholar] [CrossRef]
- Bouaziz, S. Study of Brittle Tectonics in the Saharan Platform and Atlas (Southern Tunisia): Evolution of Stress Paleo-Fields and Implications Geodynamics. Ph.D. Thesis, State University Tunis II, Tunis, Tunisia, 1995; p. 486. [Google Scholar]
- Rouatbi, R. Contribution to the Hydrogeological Study of the Buried Karst of Gabes-South. 3rd Cycle Thesis, BIRH, Tunis. Ph.D. Thesis, University of Montpellier, Montpellier, France, 1967; 235p. [Google Scholar]
- Abdelkarim, B.; Telahigue, F.; Agoubi, B. Assessing and Delineation of Groundwater Recharge Areas in Coastal Arid Area Southern Tunisia. Groundw. Sustain. Dev. 2022, 18, 100760. [Google Scholar] [CrossRef]
- Vernoux, J.F.; Jarraya Horriche, F.; Ghoudi, R. Numerical Groundwater Flow Modeling for Managing the Gabes Jeffara Aquifer System (Tunisia) in Relation with Oasis Ecosystems. Hydrogeol. J. 2020, 28, 1077–1090. [Google Scholar] [CrossRef]
- Ben Brahim, F.; Msaddki, H.; Bouri, S. Groundwater Quality Index Mapping for Irrigation Purposes in the “El Hezma-El Hmila” (Medenine, Tunisia). CLEAN Soil Air Water 2022, 50, 2100203. [Google Scholar] [CrossRef]
- Hajji, S.; Yahyaoui, N.; Bousnina, S.; Ben Brahim, F.; Allouche, A.; Faiedh, H.; Bouri, S.; Hachicha, W.; Aljuaid, A.M. Using a Mamdani Fuzzy Inference System Model (MFISM) for Ranking Groundwater Quality in Agri-Environmental Context: Case of the Hammamet-Nabeul Shallow Aquifer (Tunisia). Water 2021, 13, 2507. [Google Scholar] [CrossRef]
- Langevin, C.D.; Thorne, D.T.; Dausman, A.M.; Sukop, M.C.; Guo, W. SEAWAT Version 4: A Computer Program for Simulation of Multi-Species Solute and Heat Transport; Techniques and Methods Book 6; U.S. Geological Survey: Reston, VA, USA, 2008; Chapter A22; p. 39.
- Chiang, E. User Guide for Processing Modflow Version 11: A Graphical User Interface for MODFLOW, GSFLOW, MODPATH, MT3D, PEST, SEAWAT, and ZoneBudget. Simcore Software. 2022. 334p. Available online: https://www.simcore.com/wp/processing-modflow-11/ (accessed on 10 September 2024).
- Doherty, J. PEST-Model-Independent Parameter Estimation, Version 12. Watermark Computing: Corinda, Australia, 2010. Available online: http://www.pesthomepage.org/ (accessed on 1 November 2023).
- Cinkus, G.; Mazzilli, N.; Jourde, H.; Wunsch, A.; Liesch, T.; Ravbar, N.; Chen, Z.; Goldscheider, N. When Best Is the Enemy of Good–Critical Evaluation of Performance Criteria in Hydrological Models. Hydrol. Earth Syst. Sci. 2023, 27, 2397–2411. [Google Scholar] [CrossRef]
- EMODnet Bathymetry Consortium. EMODnet Digital Bathymetry (DTM 2022). EMODnet Bathymetry Consortium, 2022. Available online: https://doi.org/10.12770/ff3aff8a-cff1-44a3-a2c8-1910bf109f85 (accessed on 21 August 2024).
- Bachtouli, S.; Abidi, M.; Comte, J.C.; Zairi, M. Potential for fresh submarine groundwater occurrence in an arid Mediterranean region: The case of Gulf of Gabes, Tunisia. Hydrogeol. J. 2024, 32, 359–378. [Google Scholar] [CrossRef]
- Schiavo, M.; Colombani, N.; Mastrocicco, M. Modeling stochastic saline groundwater occurrence in coastal aquifers. Wat. Res. 2023, 235, 119885. [Google Scholar] [CrossRef]


| Indicator | Value |
|---|---|
| Index of agreement (I) | 0.948 |
| Mean error (ME) | −0.582 m |
| Mean absolute error (MAE) | 4.418 m |
| R-squared correlation (R2) | 0.813 |
| Nash–Sutcliffe model efficiency coefficient (NSE) | 0.827 |
| Deep Aquifer Flow Balance | Flow in m3/s | Flow out m3/s |
|---|---|---|
| From the Matmata Mountain Range (GHB) | 1.692 | 0.0 |
| From the Mediterranean Sea (CHB) | 1.623 | 0.043 |
| Wells | 0.0 | 3.271 |
| Total | 3.315 | 3.315 |
| IN-OUT | 5.96 × 10⁻⁶ | |
| Percent error | 0.0 | |
Disclaimer/Publisher’s Note: The statements, opinions and data contained in all publications are solely those of the individual author(s) and contributor(s) and not of MDPI and/or the editor(s). MDPI and/or the editor(s) disclaim responsibility for any injury to people or property resulting from any ideas, methods, instructions or products referred to in the content. |
© 2024 by the authors. Licensee MDPI, Basel, Switzerland. This article is an open access article distributed under the terms and conditions of the Creative Commons Attribution (CC BY) license (https://creativecommons.org/licenses/by/4.0/).
Share and Cite
Wederni, K.; Schiavo, M.; Haddaji, B.; Hamed, Y.; Bouri, S.; Colombani, N. SEAWAT Scenarios Evaluating Links between the Southern Gabès (TN) Confined Aquifer and the Mediterranean Sea. Water 2024, 16, 2865. https://doi.org/10.3390/w16192865
Wederni K, Schiavo M, Haddaji B, Hamed Y, Bouri S, Colombani N. SEAWAT Scenarios Evaluating Links between the Southern Gabès (TN) Confined Aquifer and the Mediterranean Sea. Water. 2024; 16(19):2865. https://doi.org/10.3390/w16192865
Chicago/Turabian StyleWederni, Khyria, Massimiliano Schiavo, Boulbaba Haddaji, Younes Hamed, Salem Bouri, and Nicolò Colombani. 2024. "SEAWAT Scenarios Evaluating Links between the Southern Gabès (TN) Confined Aquifer and the Mediterranean Sea" Water 16, no. 19: 2865. https://doi.org/10.3390/w16192865
APA StyleWederni, K., Schiavo, M., Haddaji, B., Hamed, Y., Bouri, S., & Colombani, N. (2024). SEAWAT Scenarios Evaluating Links between the Southern Gabès (TN) Confined Aquifer and the Mediterranean Sea. Water, 16(19), 2865. https://doi.org/10.3390/w16192865