


Spatial–Temporal Variations in Water Use Efficiency and Its Influencing Factors in the Li River Basin, China

Abstract
:1. Introduction
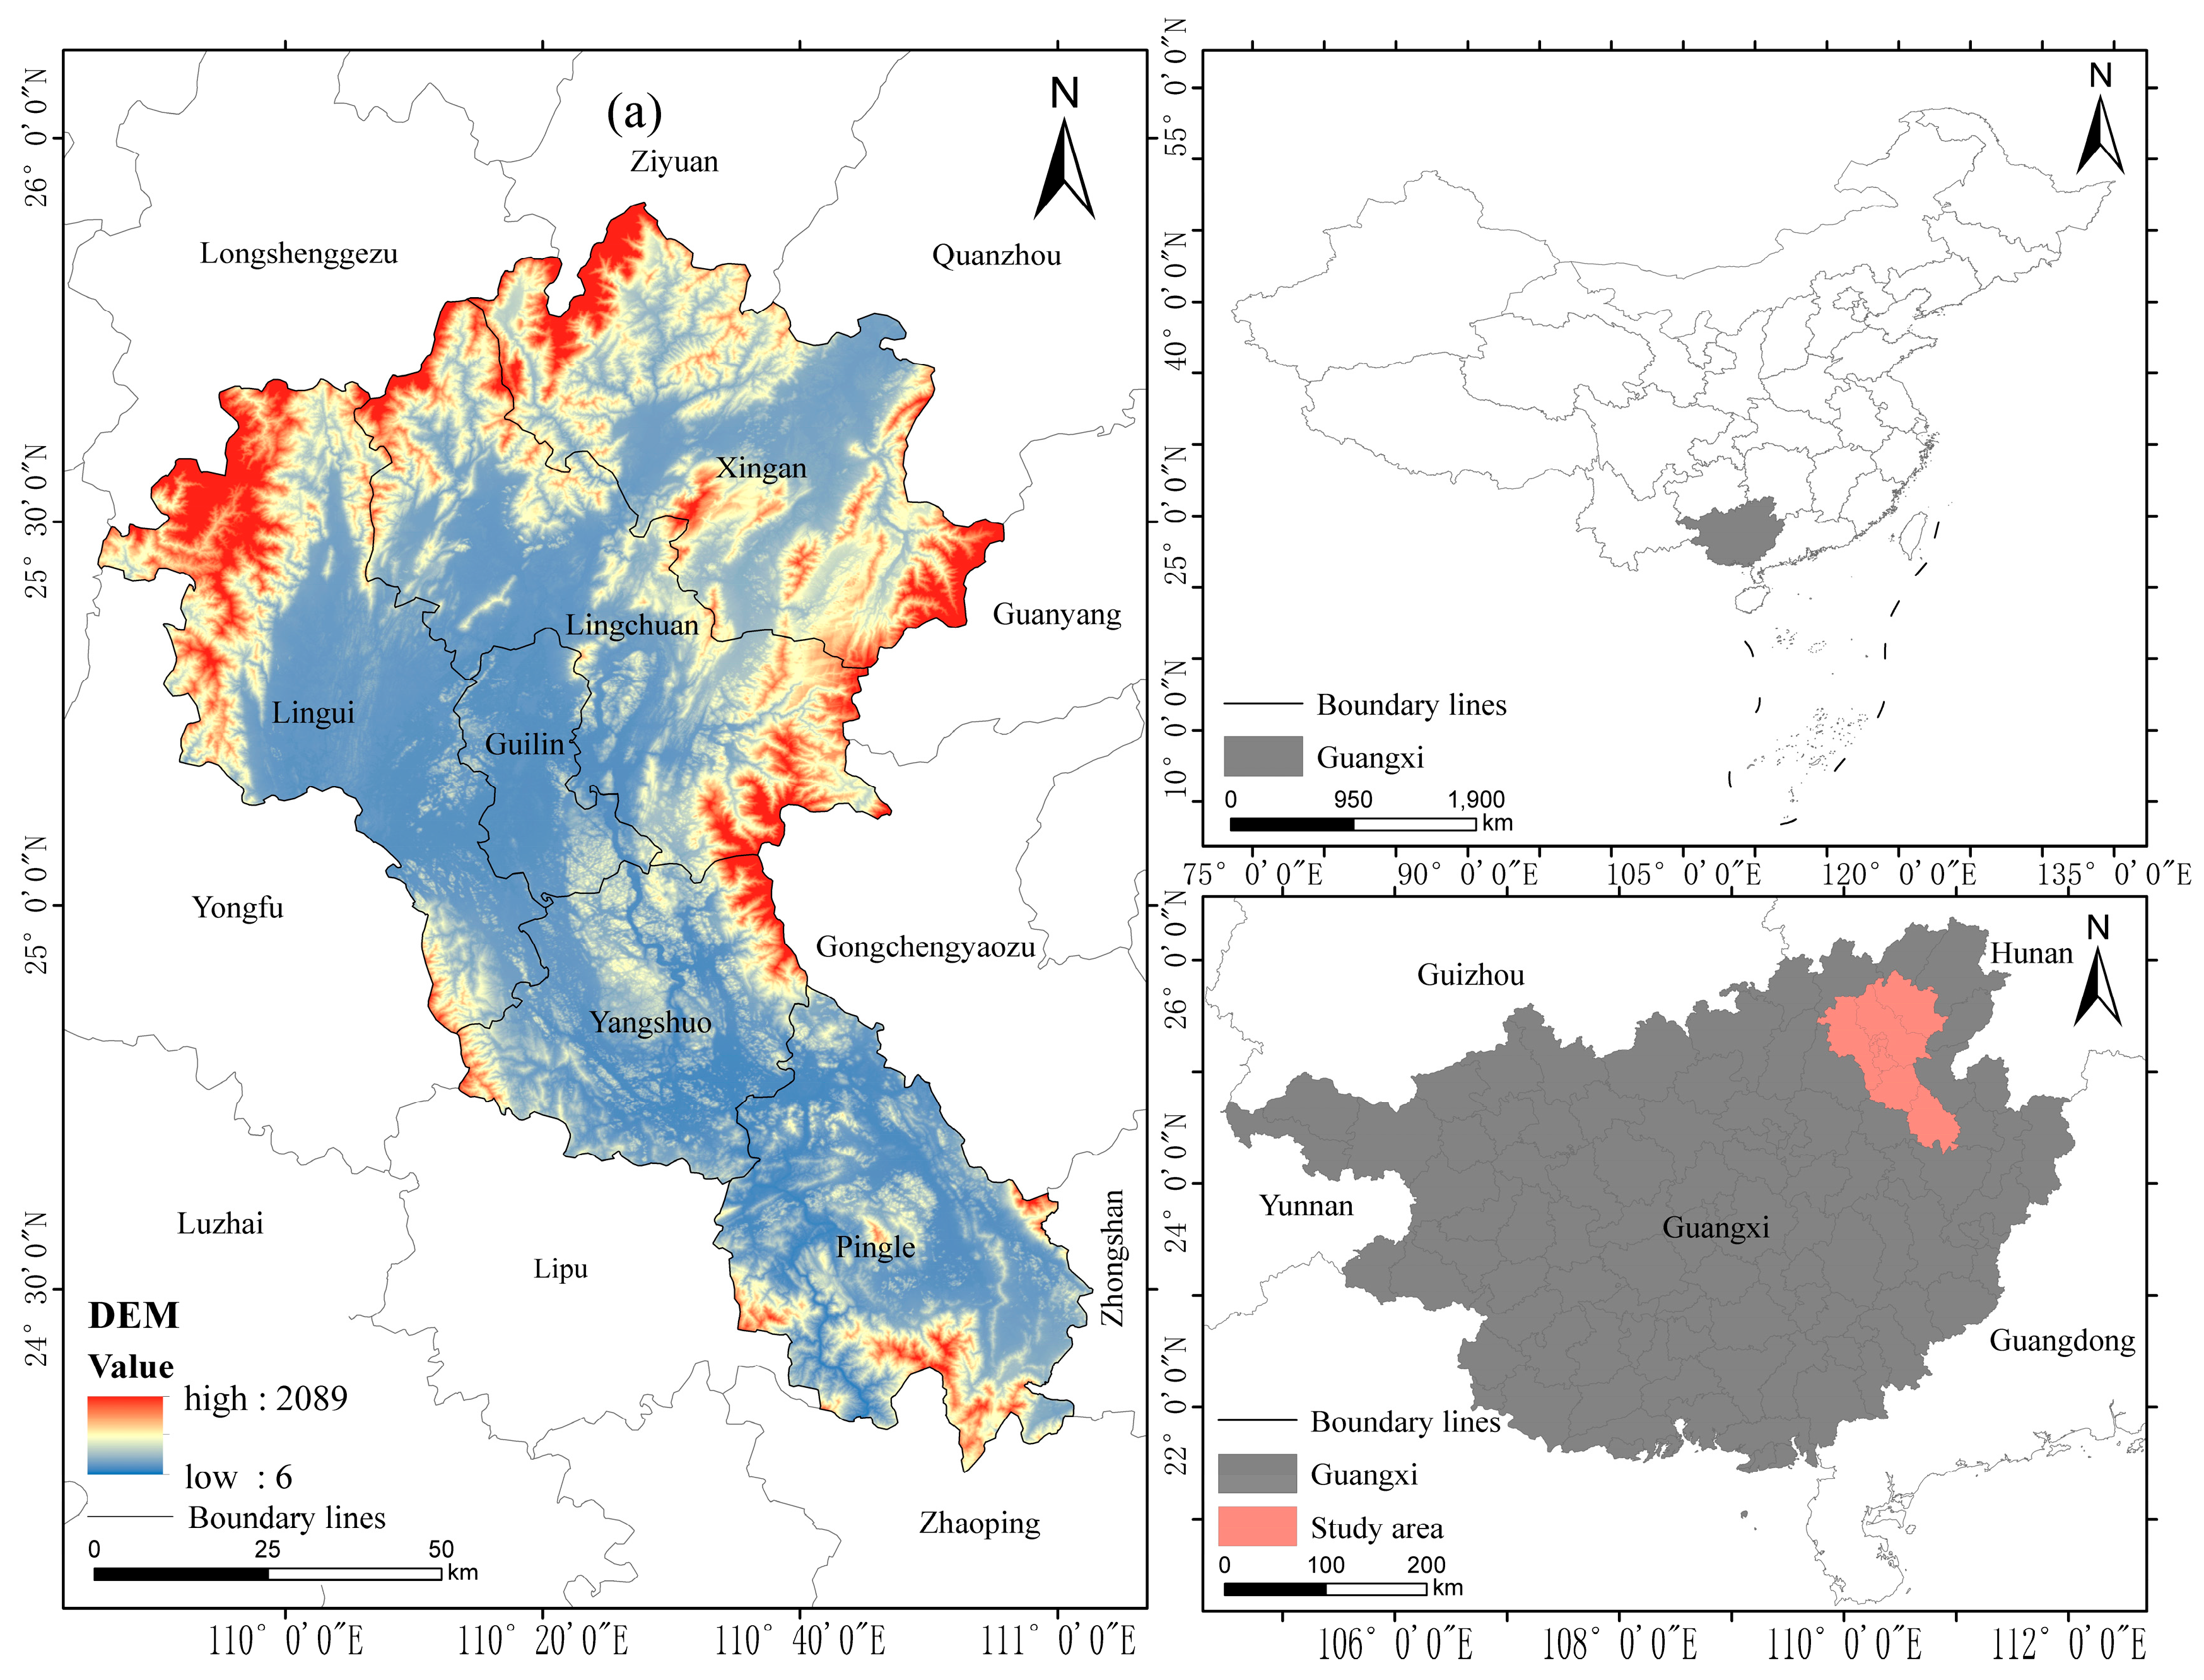
2. Study Area
3. Data Sources and Research Methodology
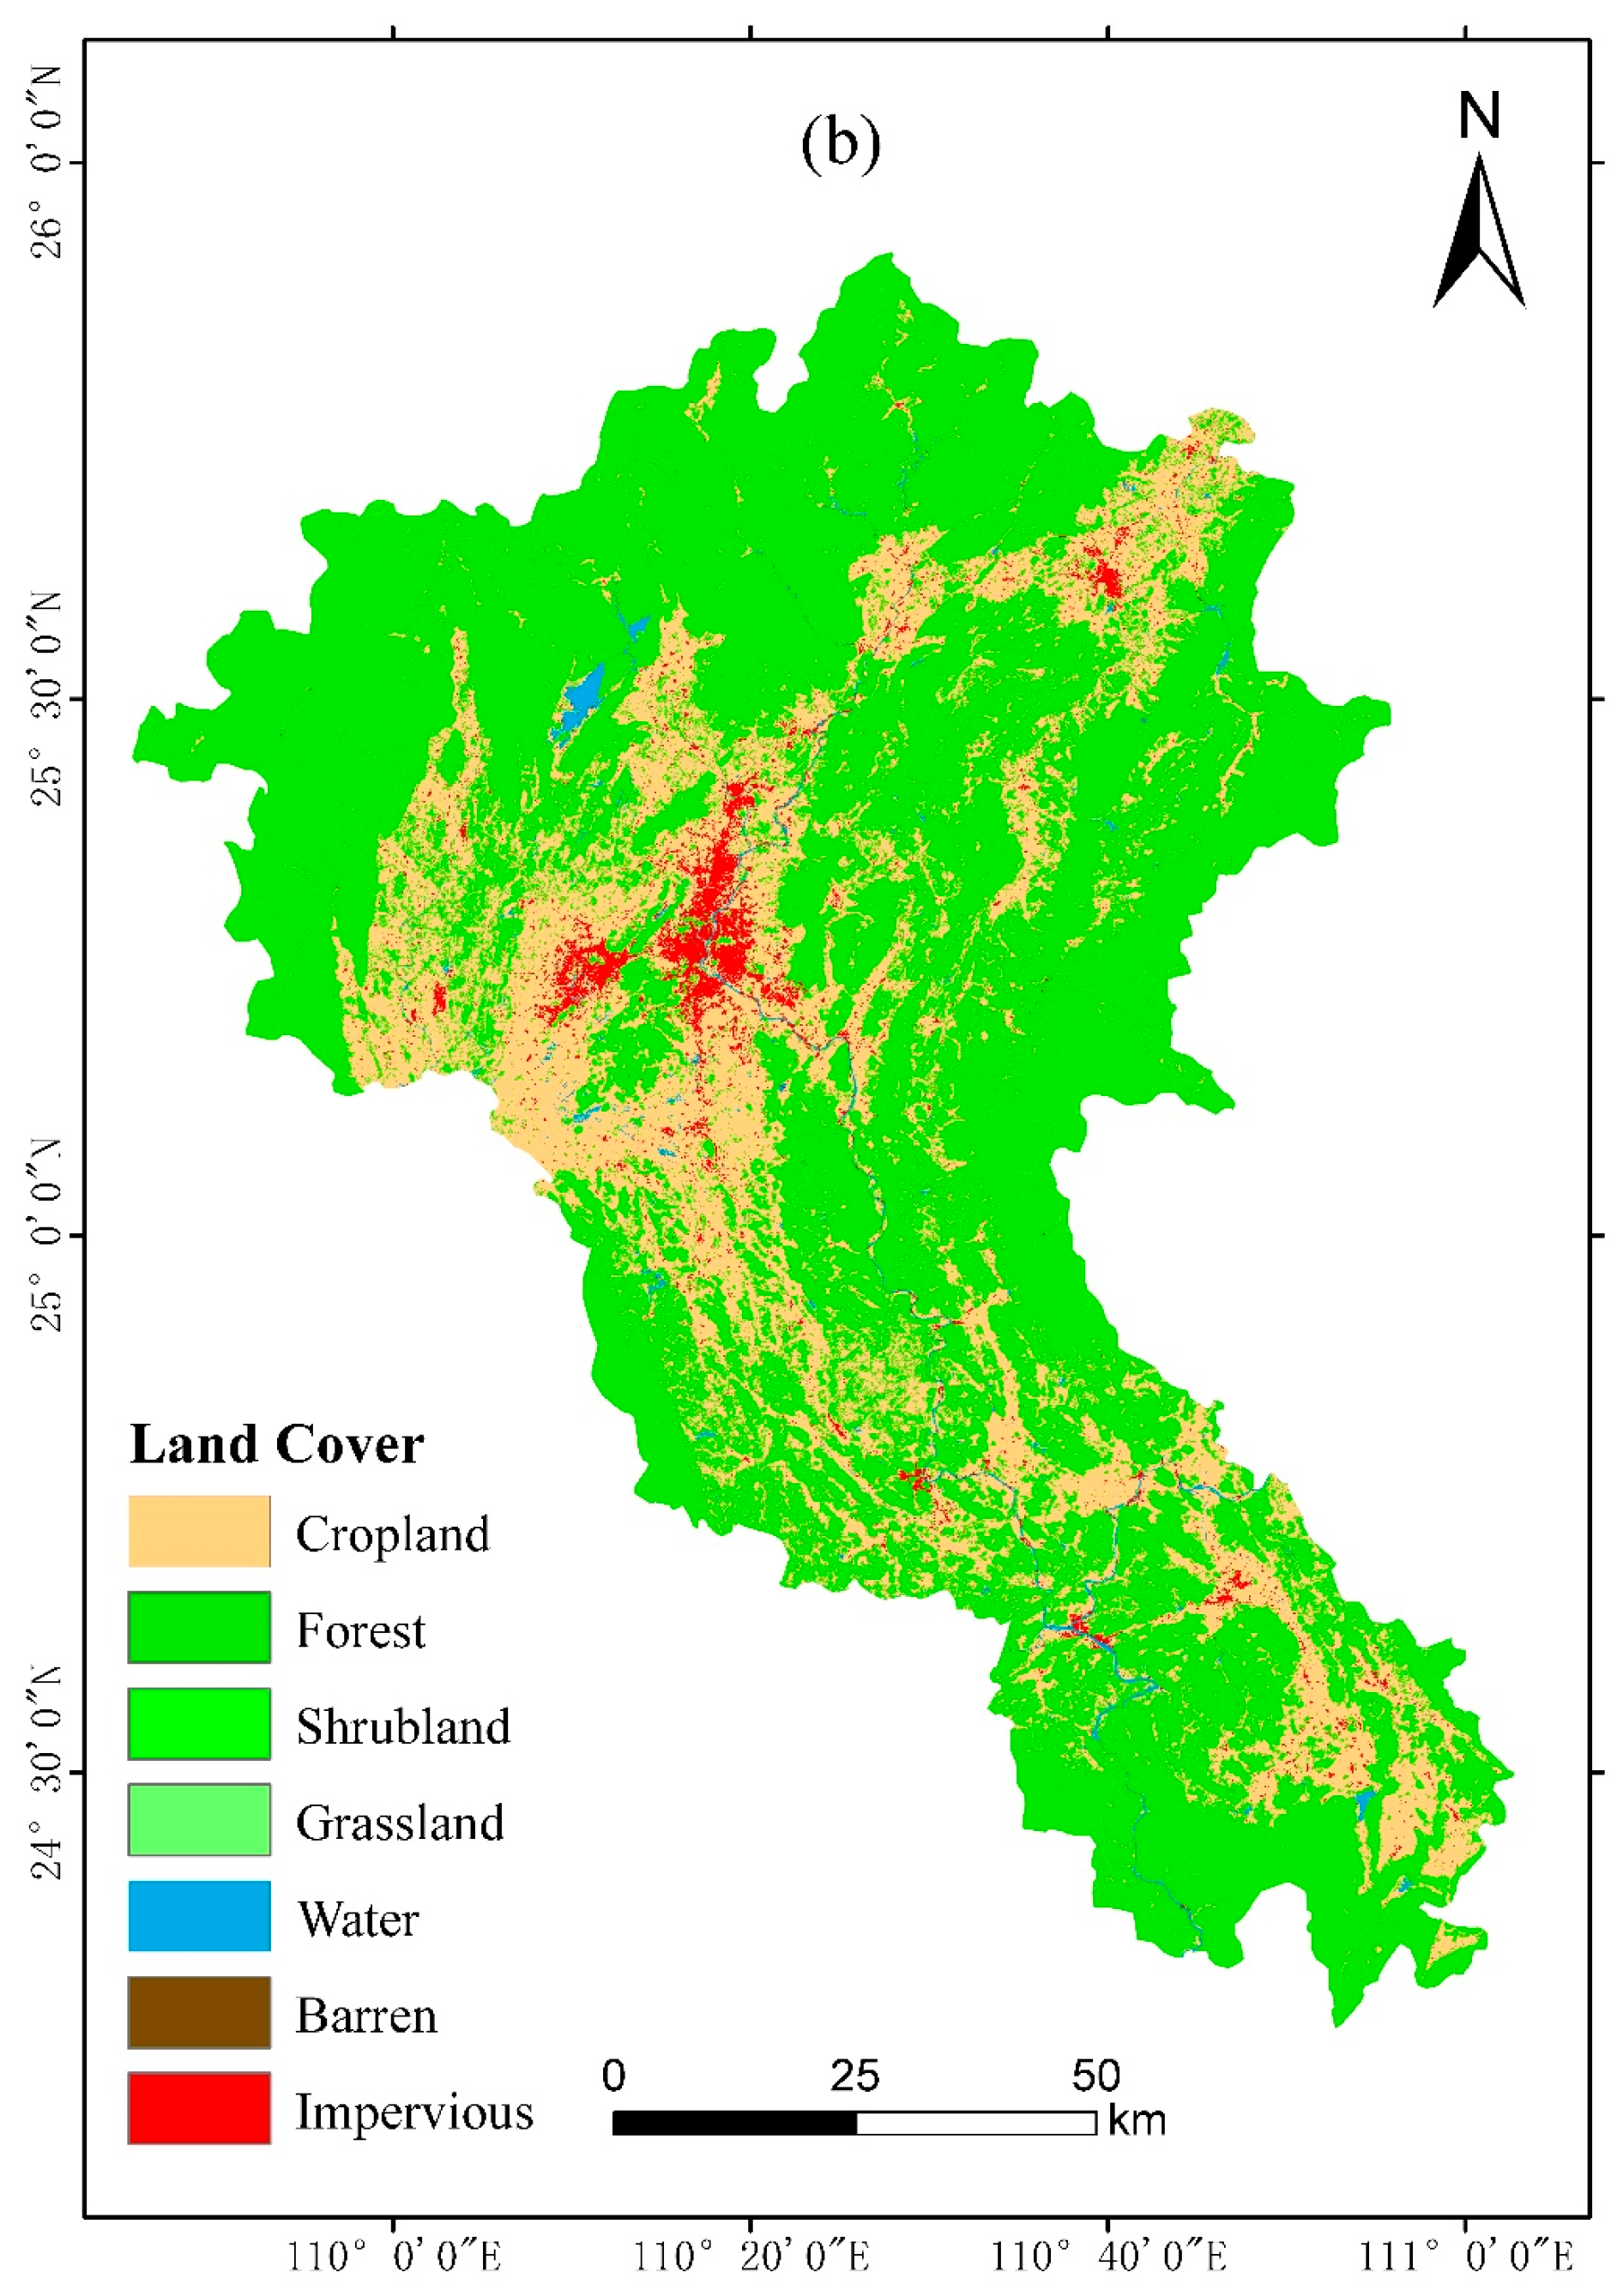
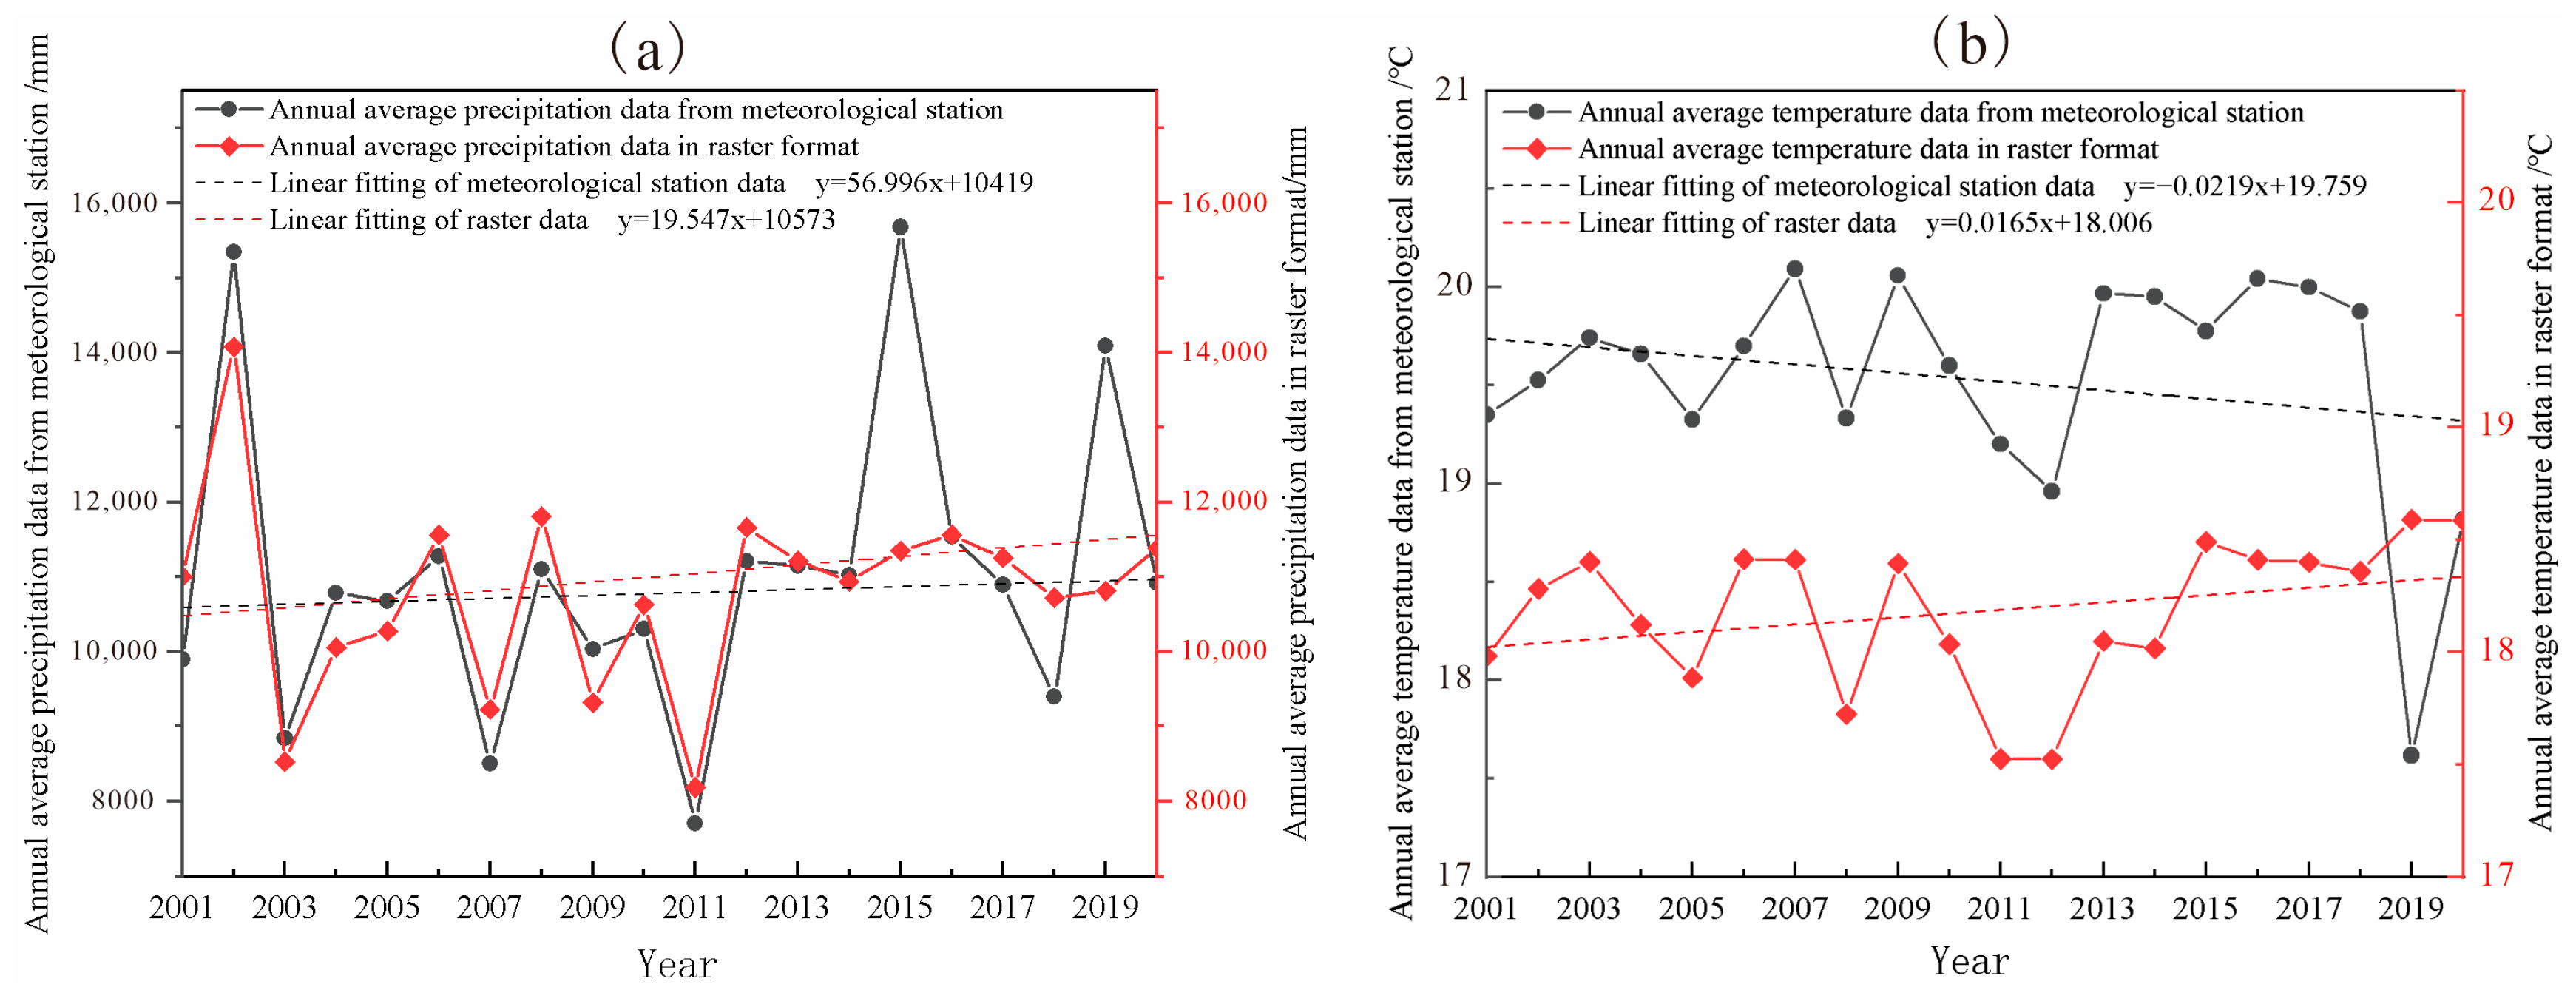
3.1. Data Sources and Processing
3.2. Research Methodology
3.2.1. WUE
3.2.2. Trend Analysis
3.2.3. Significance Test
3.2.4. Correlation Analysis
4. Results and Analysis
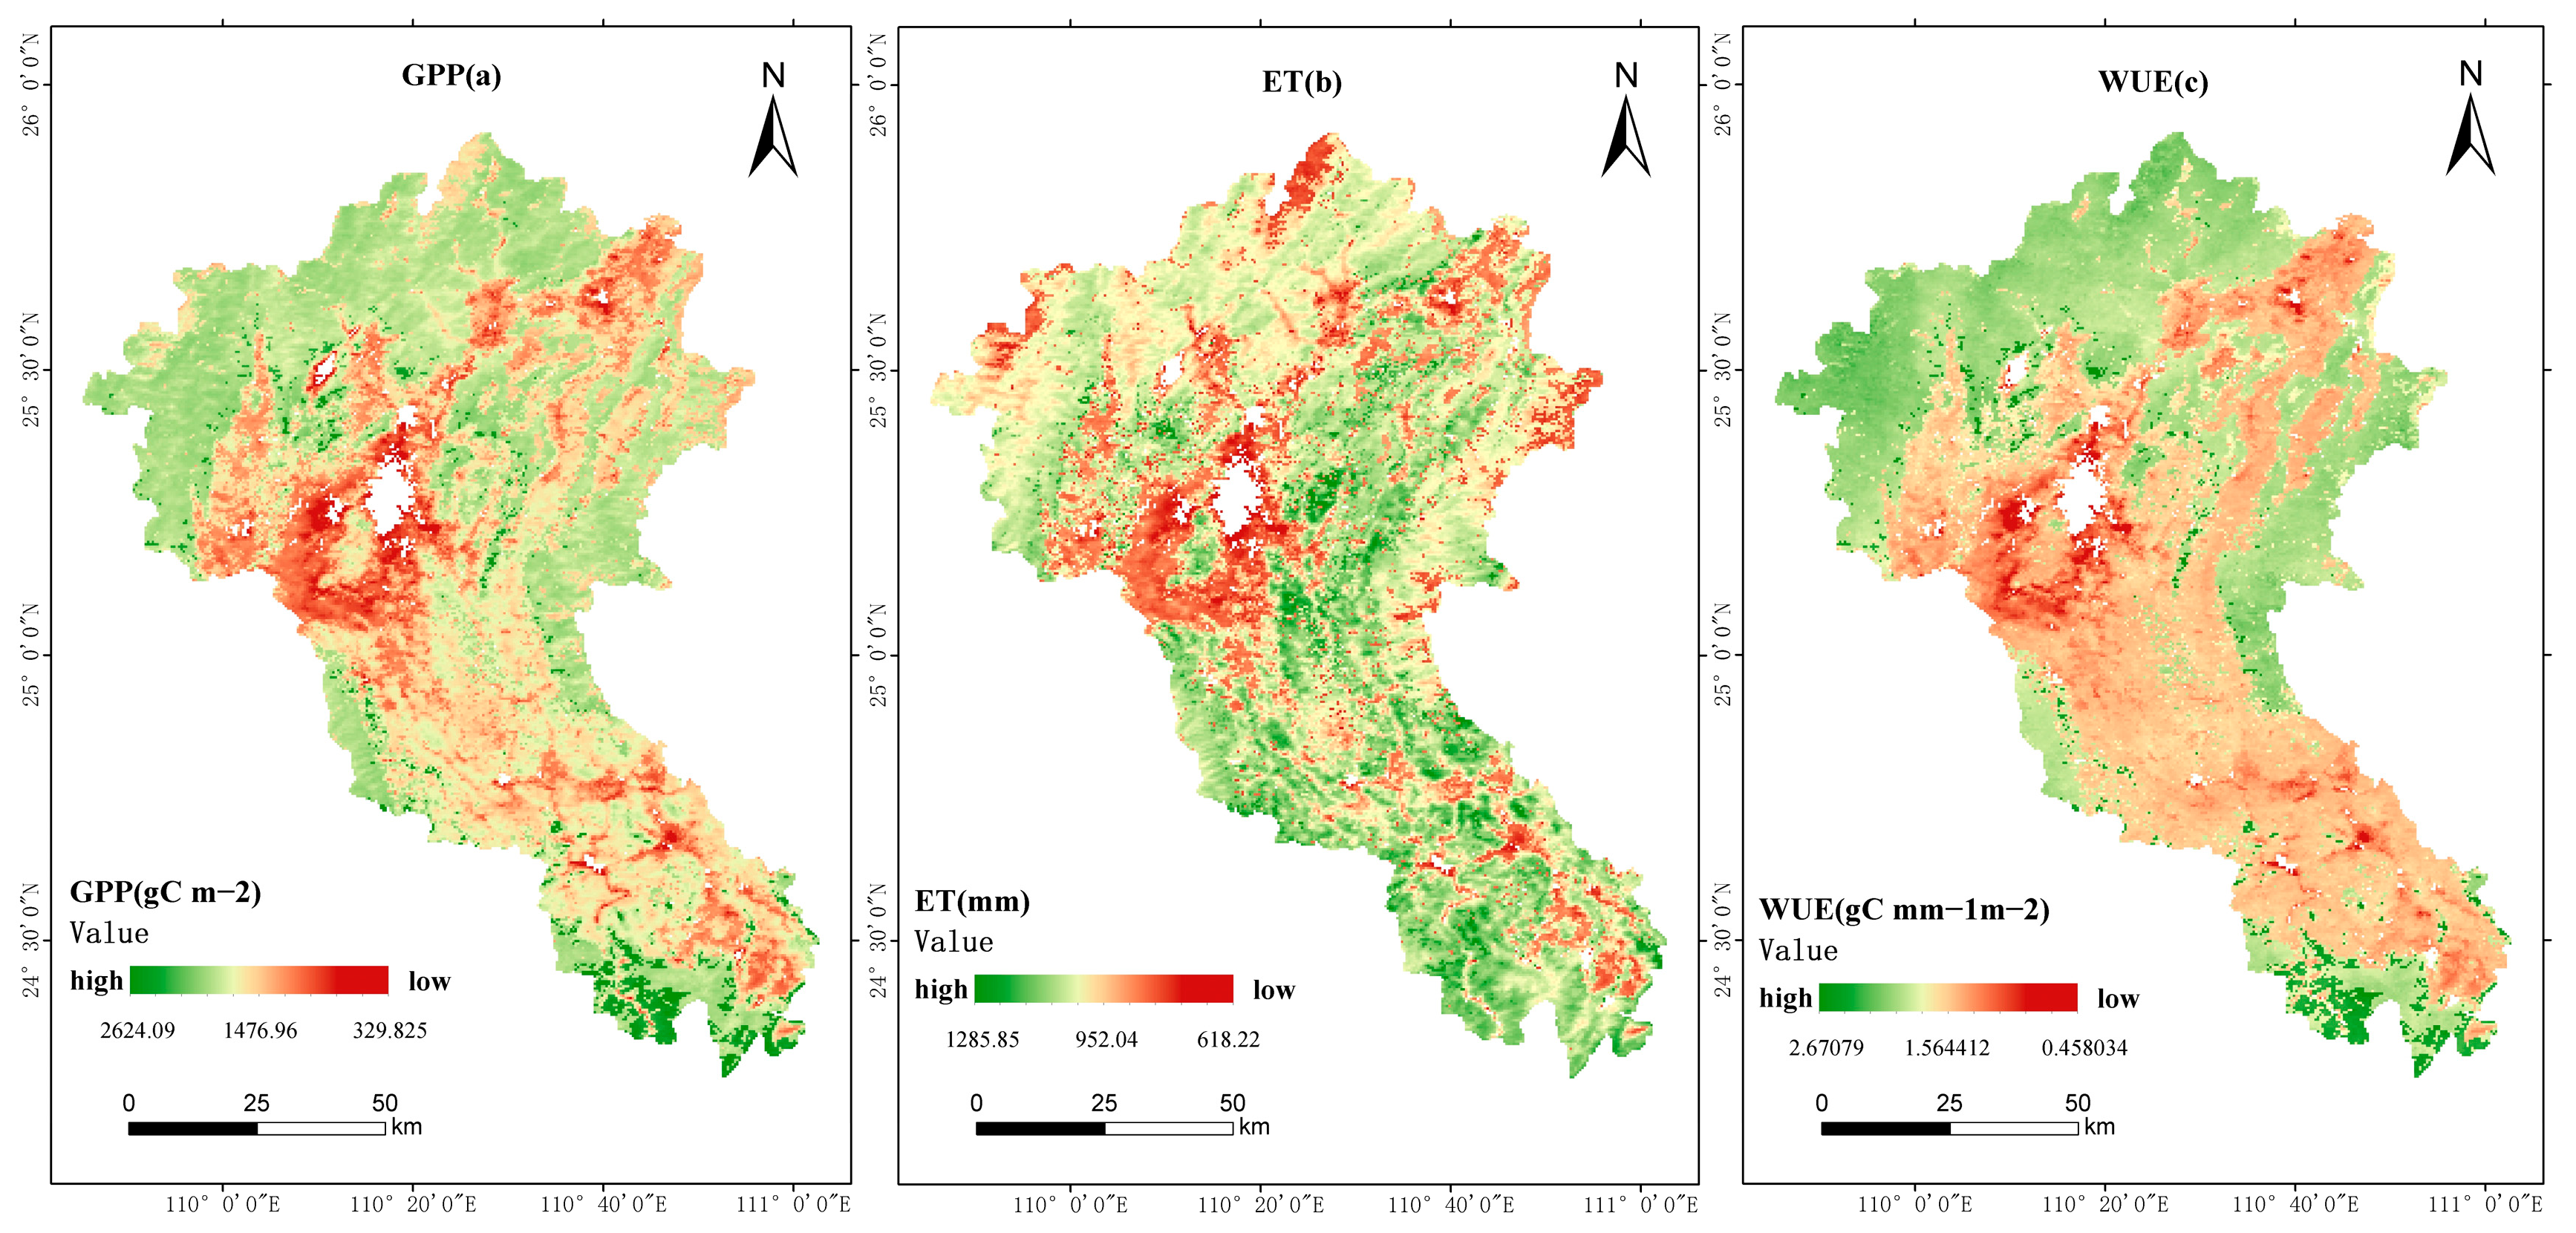
4.1. Characteristics of Spatial Distribution of GPP, ET, and WUE
4.2. Temporal and Spatial Trend Variations of WUE and Various Factors
4.3. Analysis of the Impact of Various Factors on WUE
4.3.1. Primary Influencing Factor Analysis
4.3.2. Partial Correlation Analysis of Climate Factors
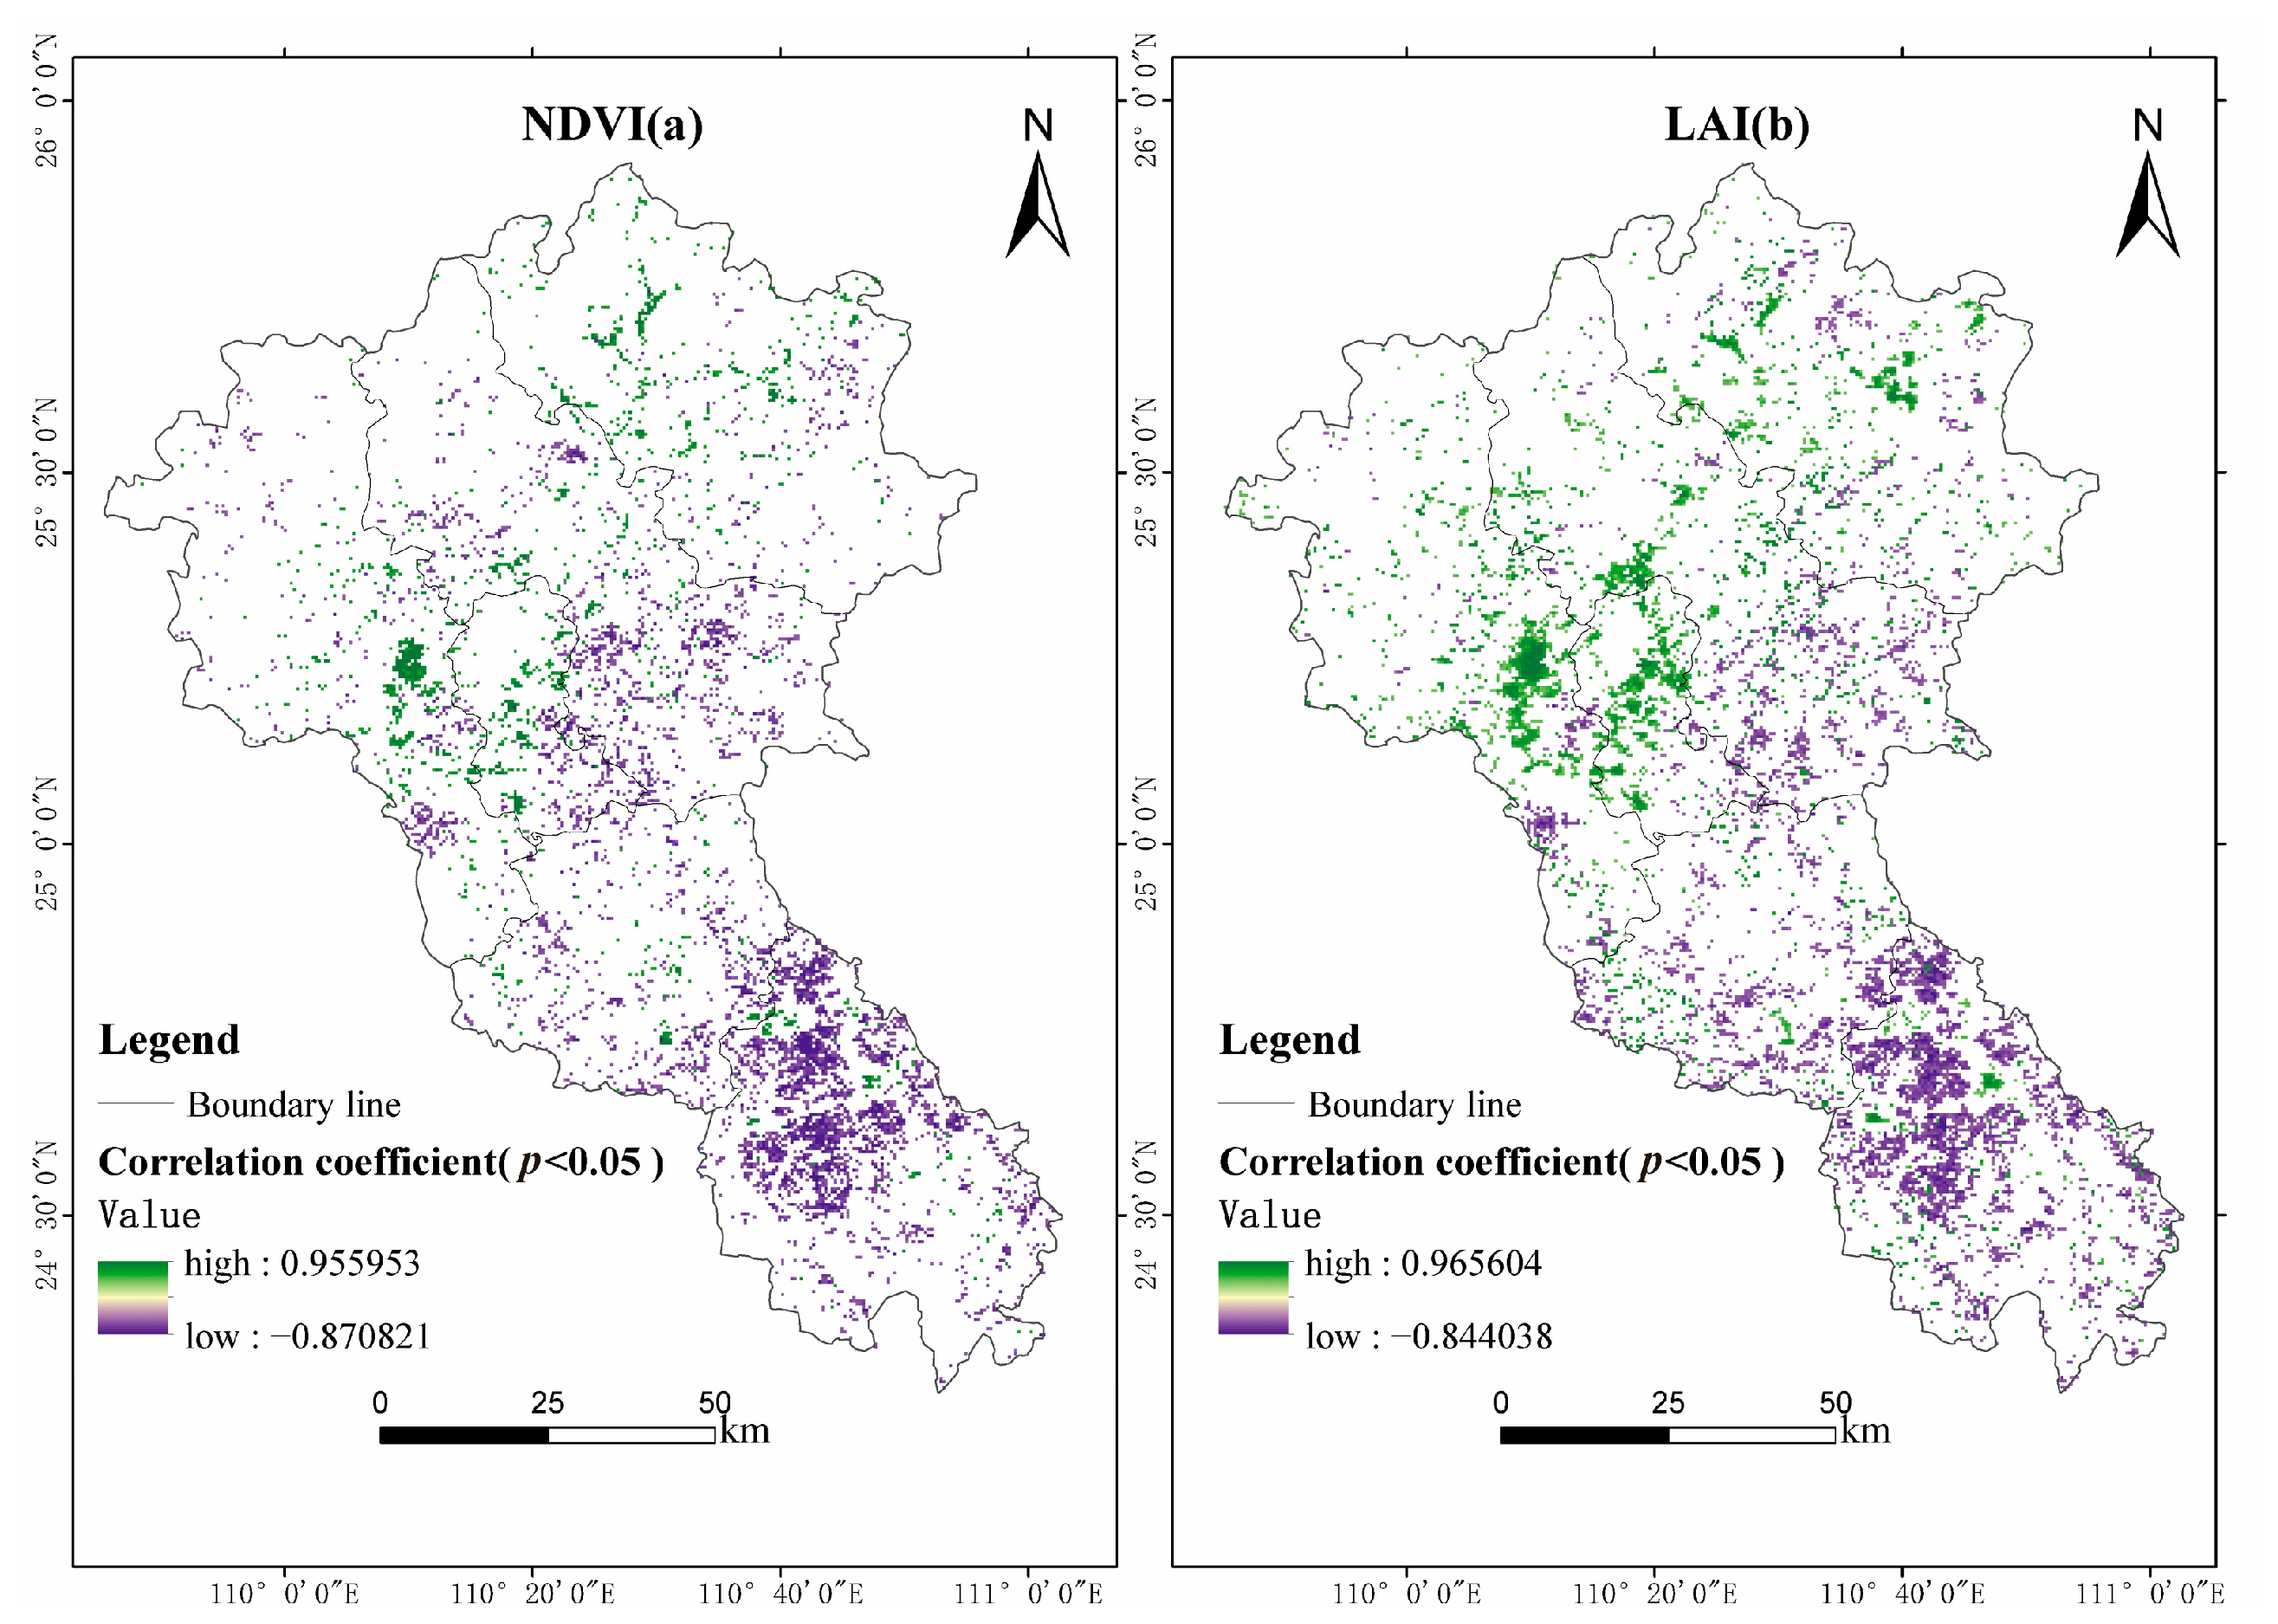
4.3.3. Vegetation Index Correlation Analysis
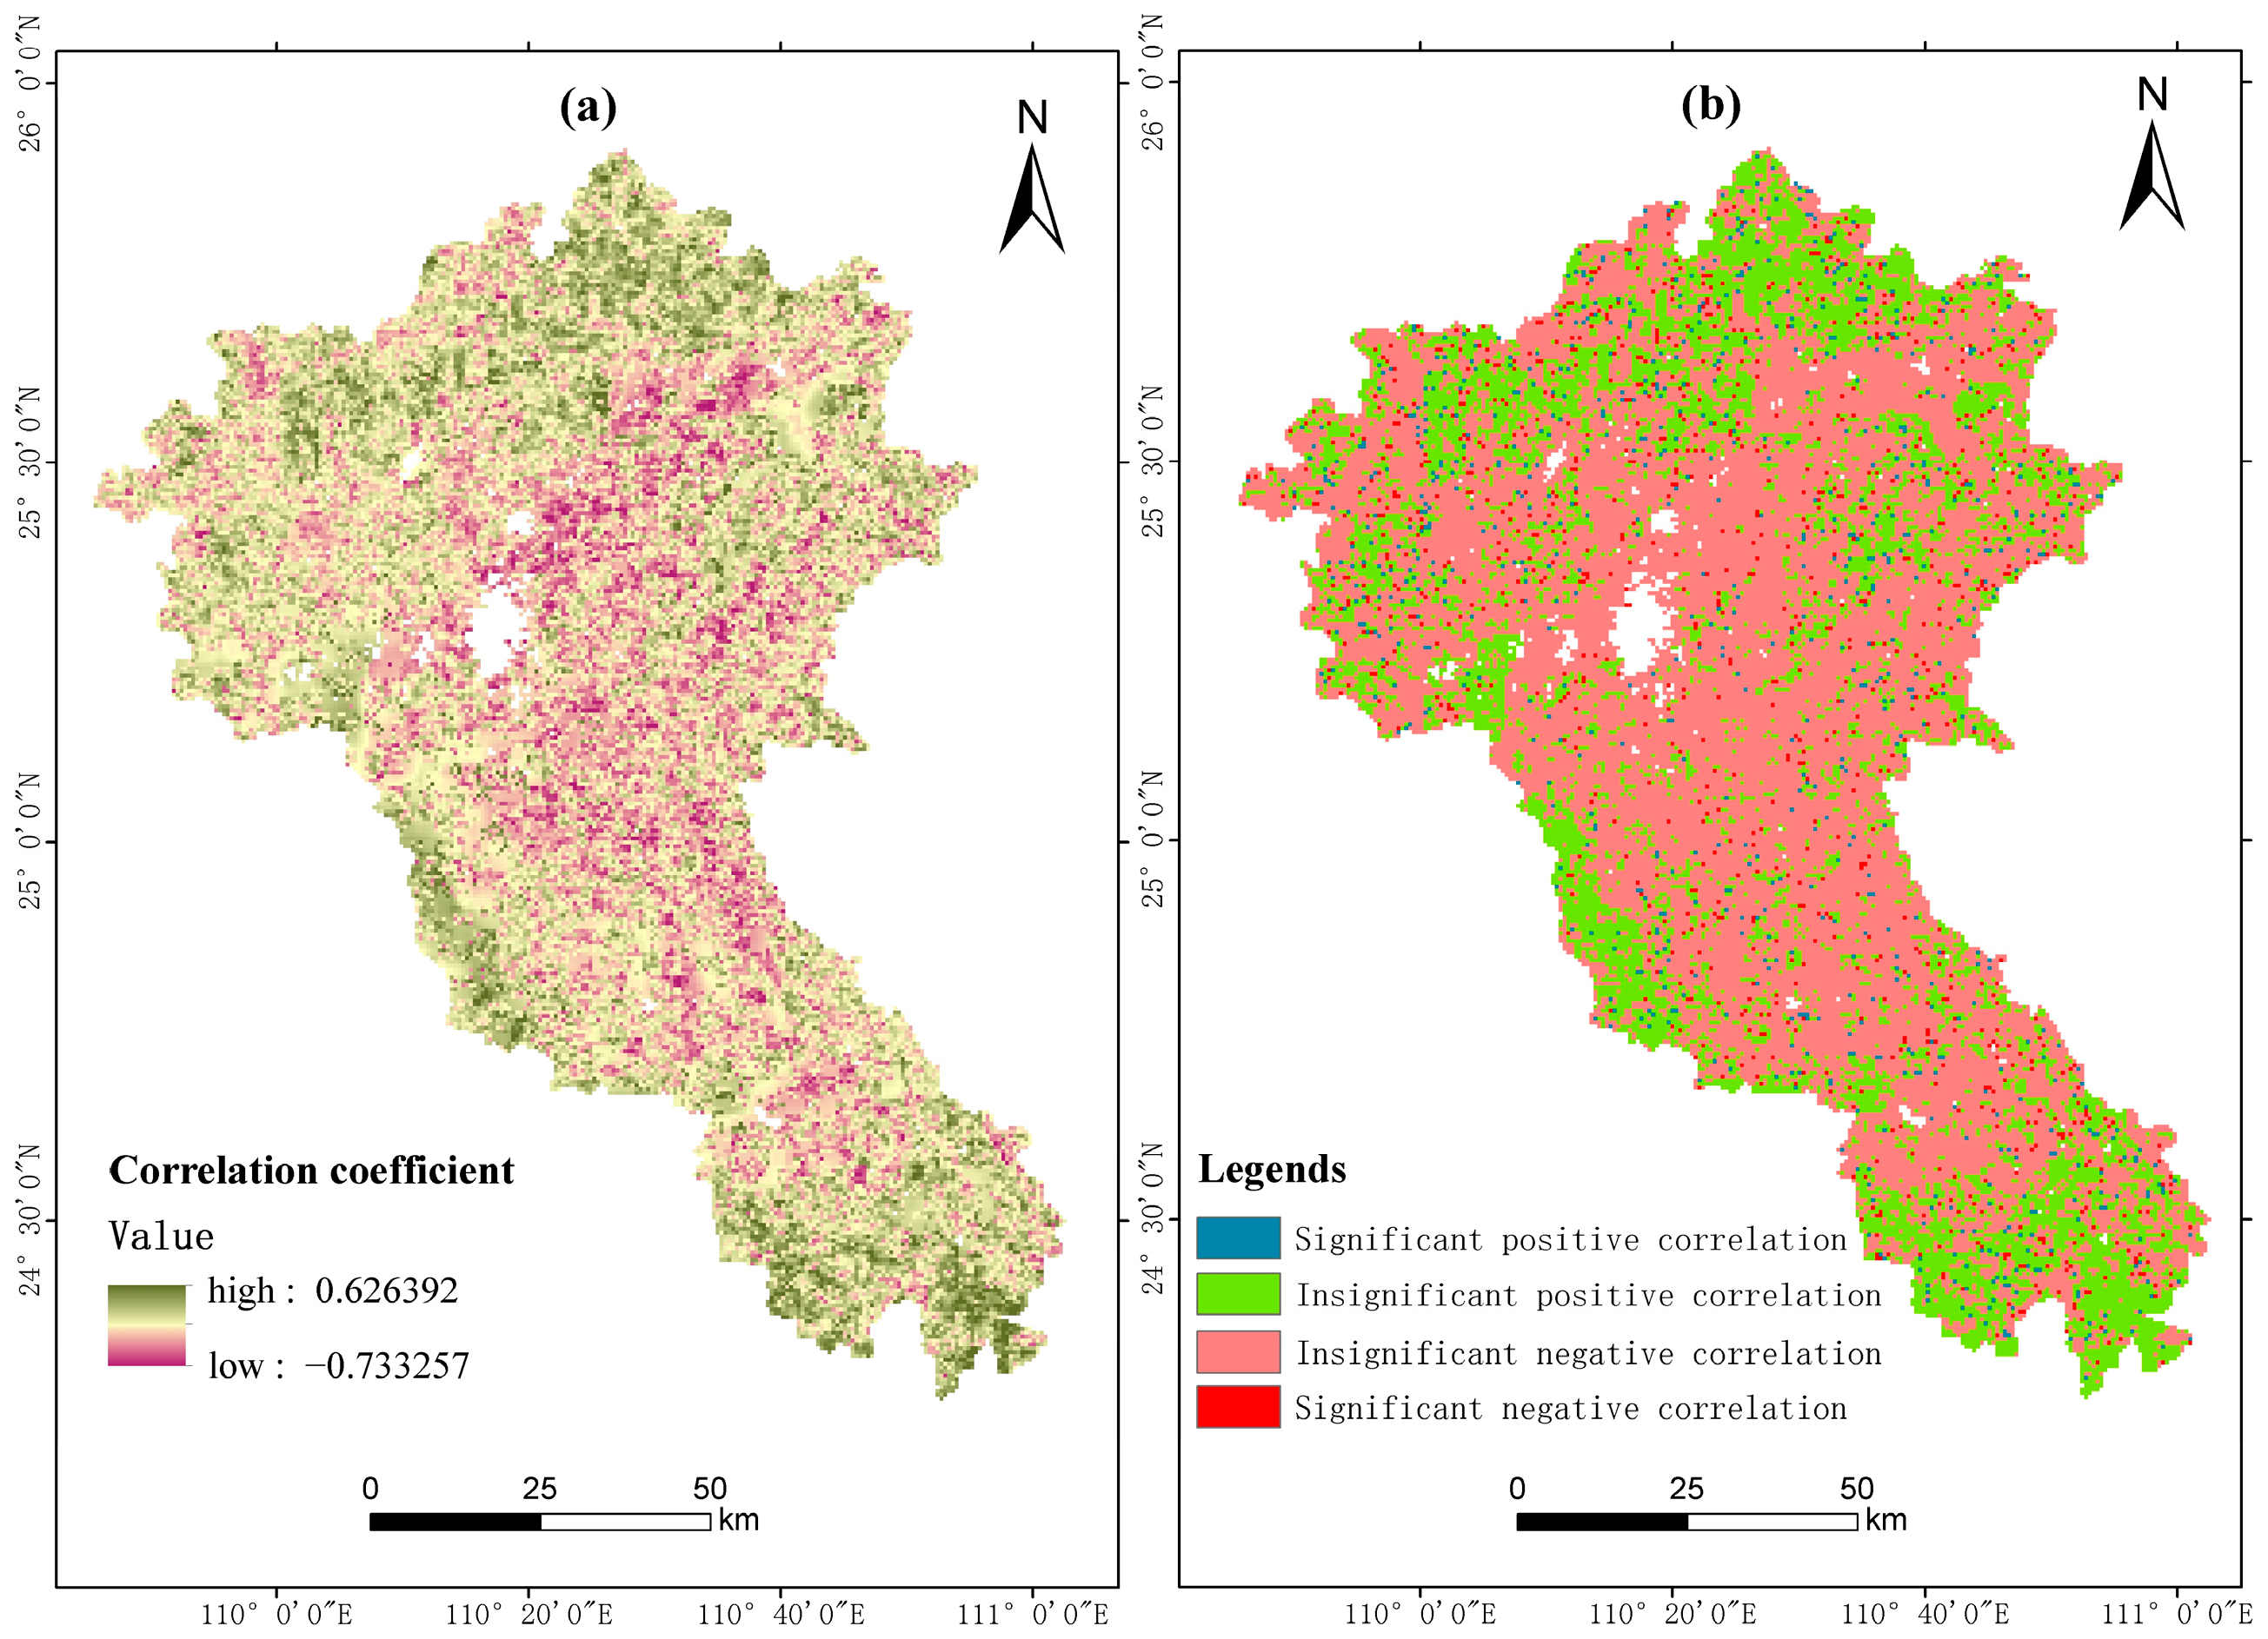
4.3.4. Vapor Pressure Deficit Correlation Analysis
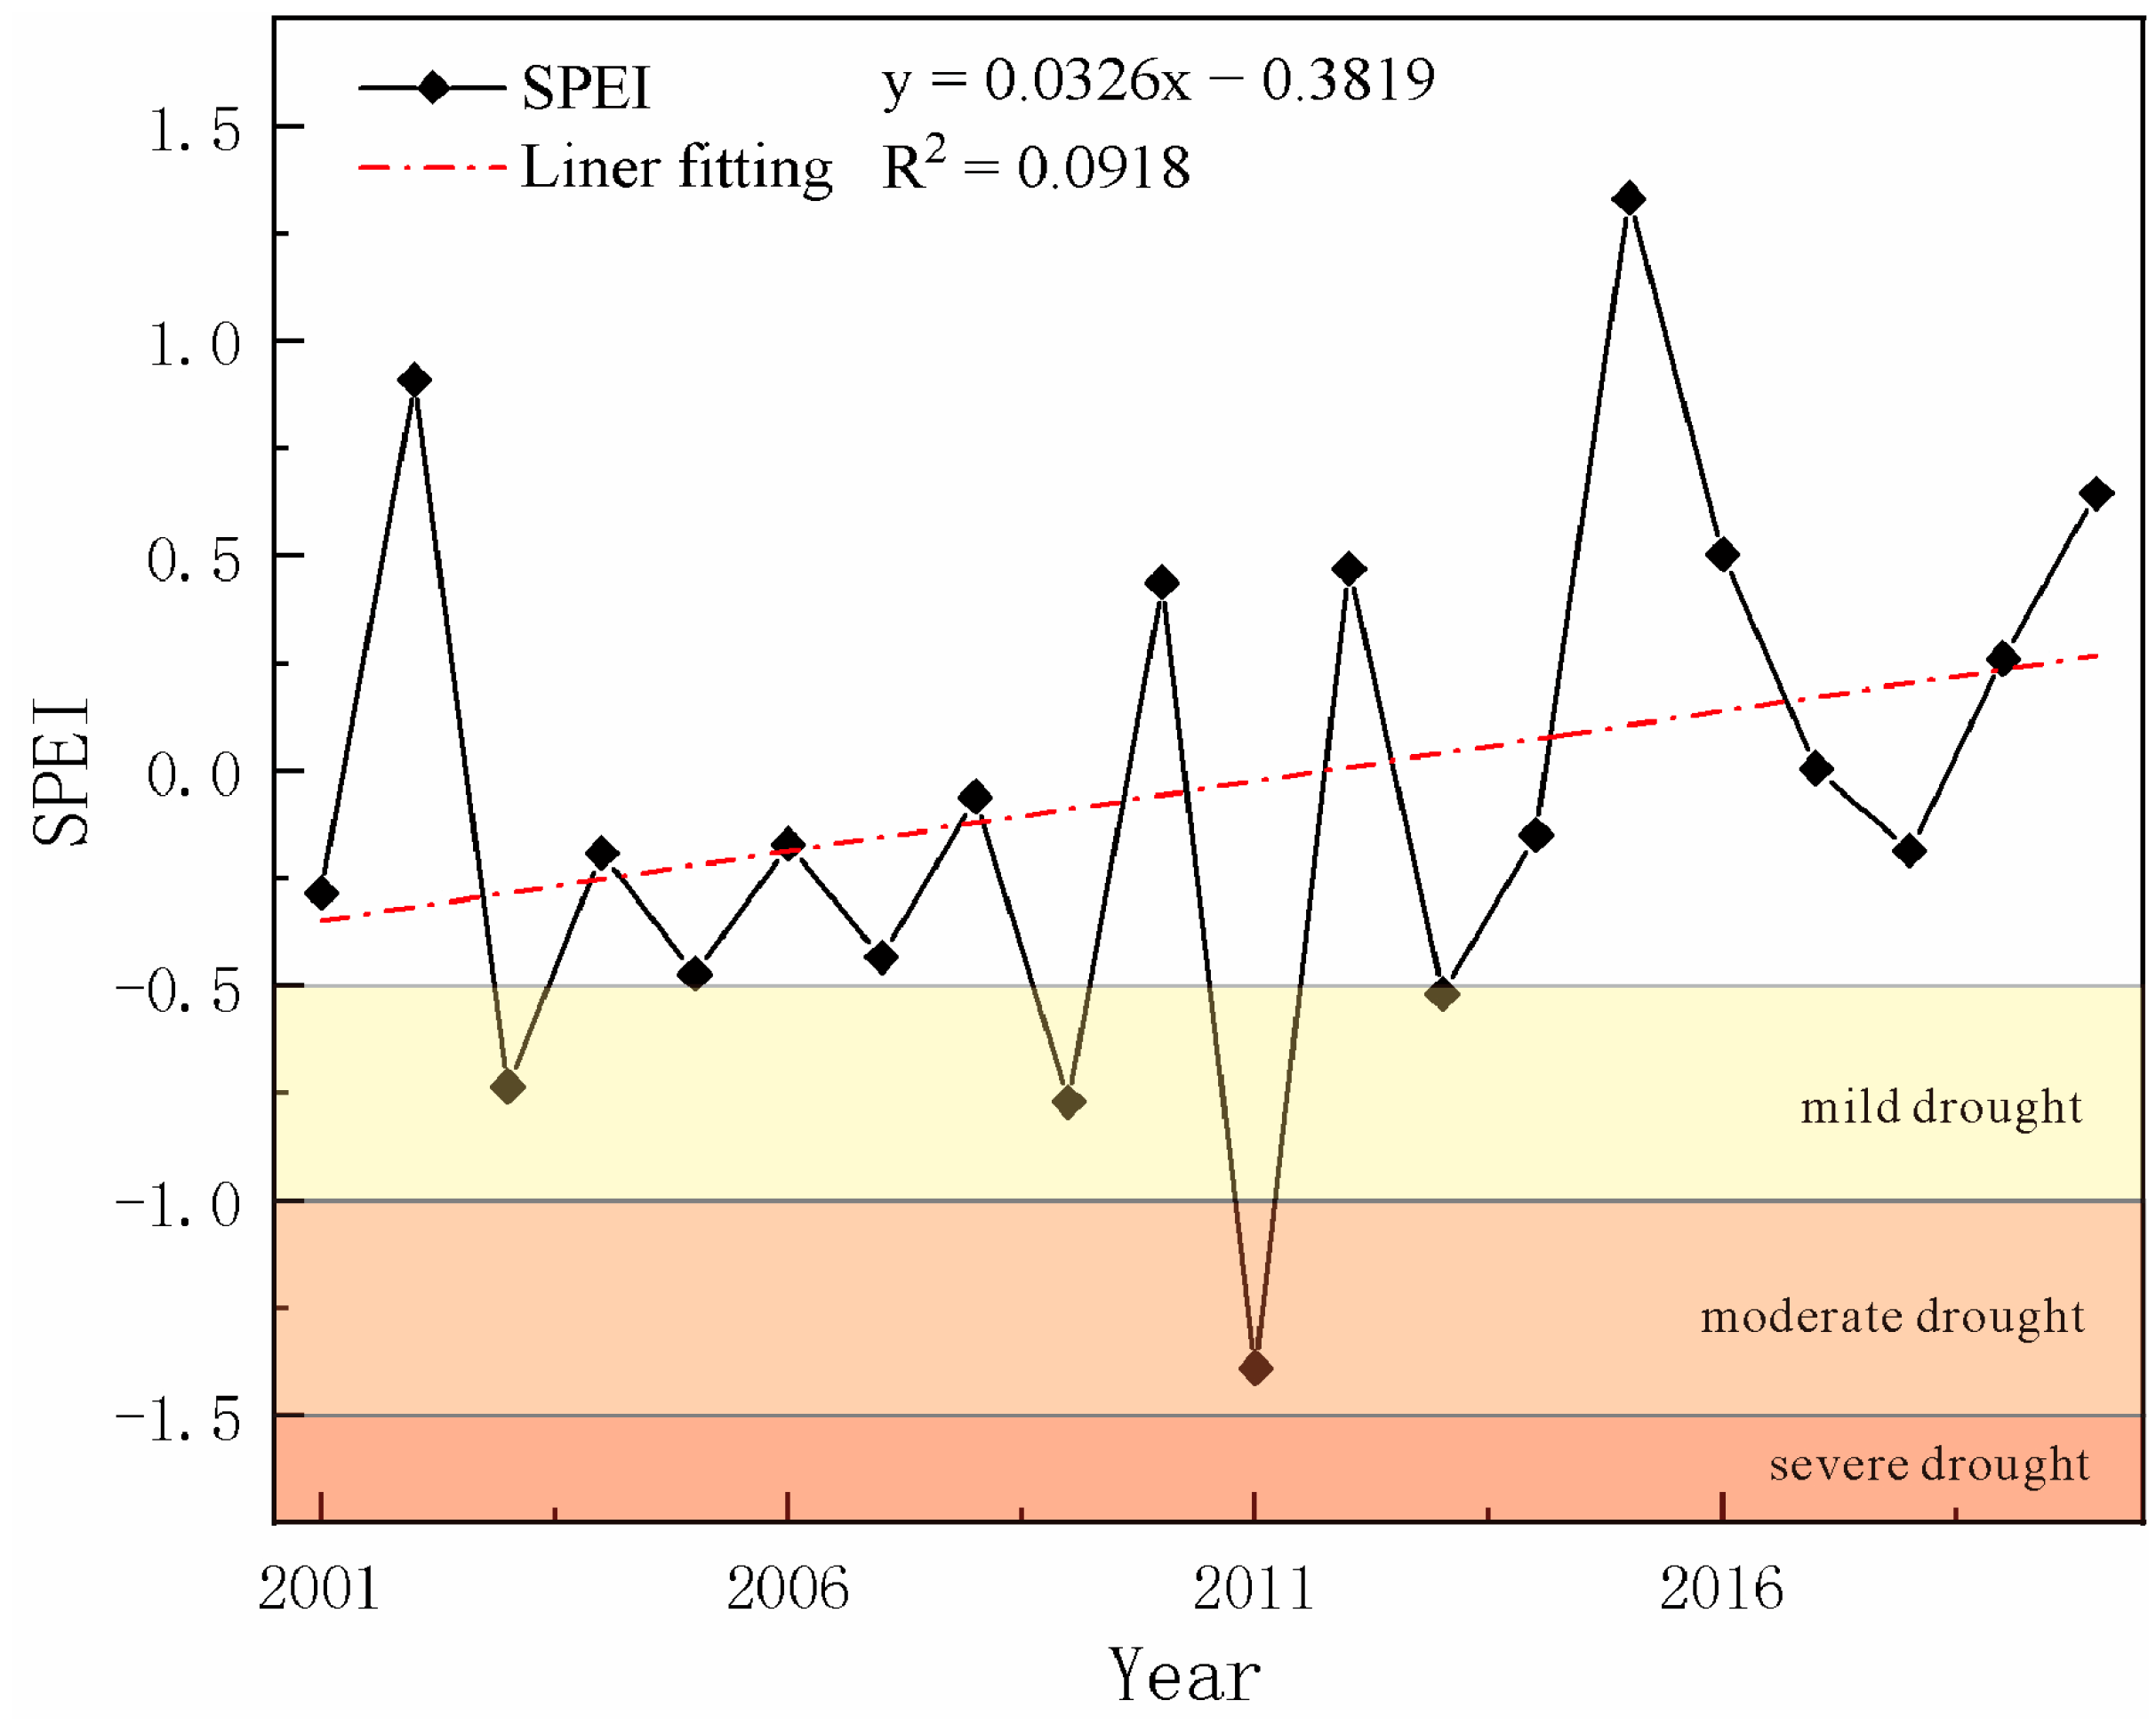
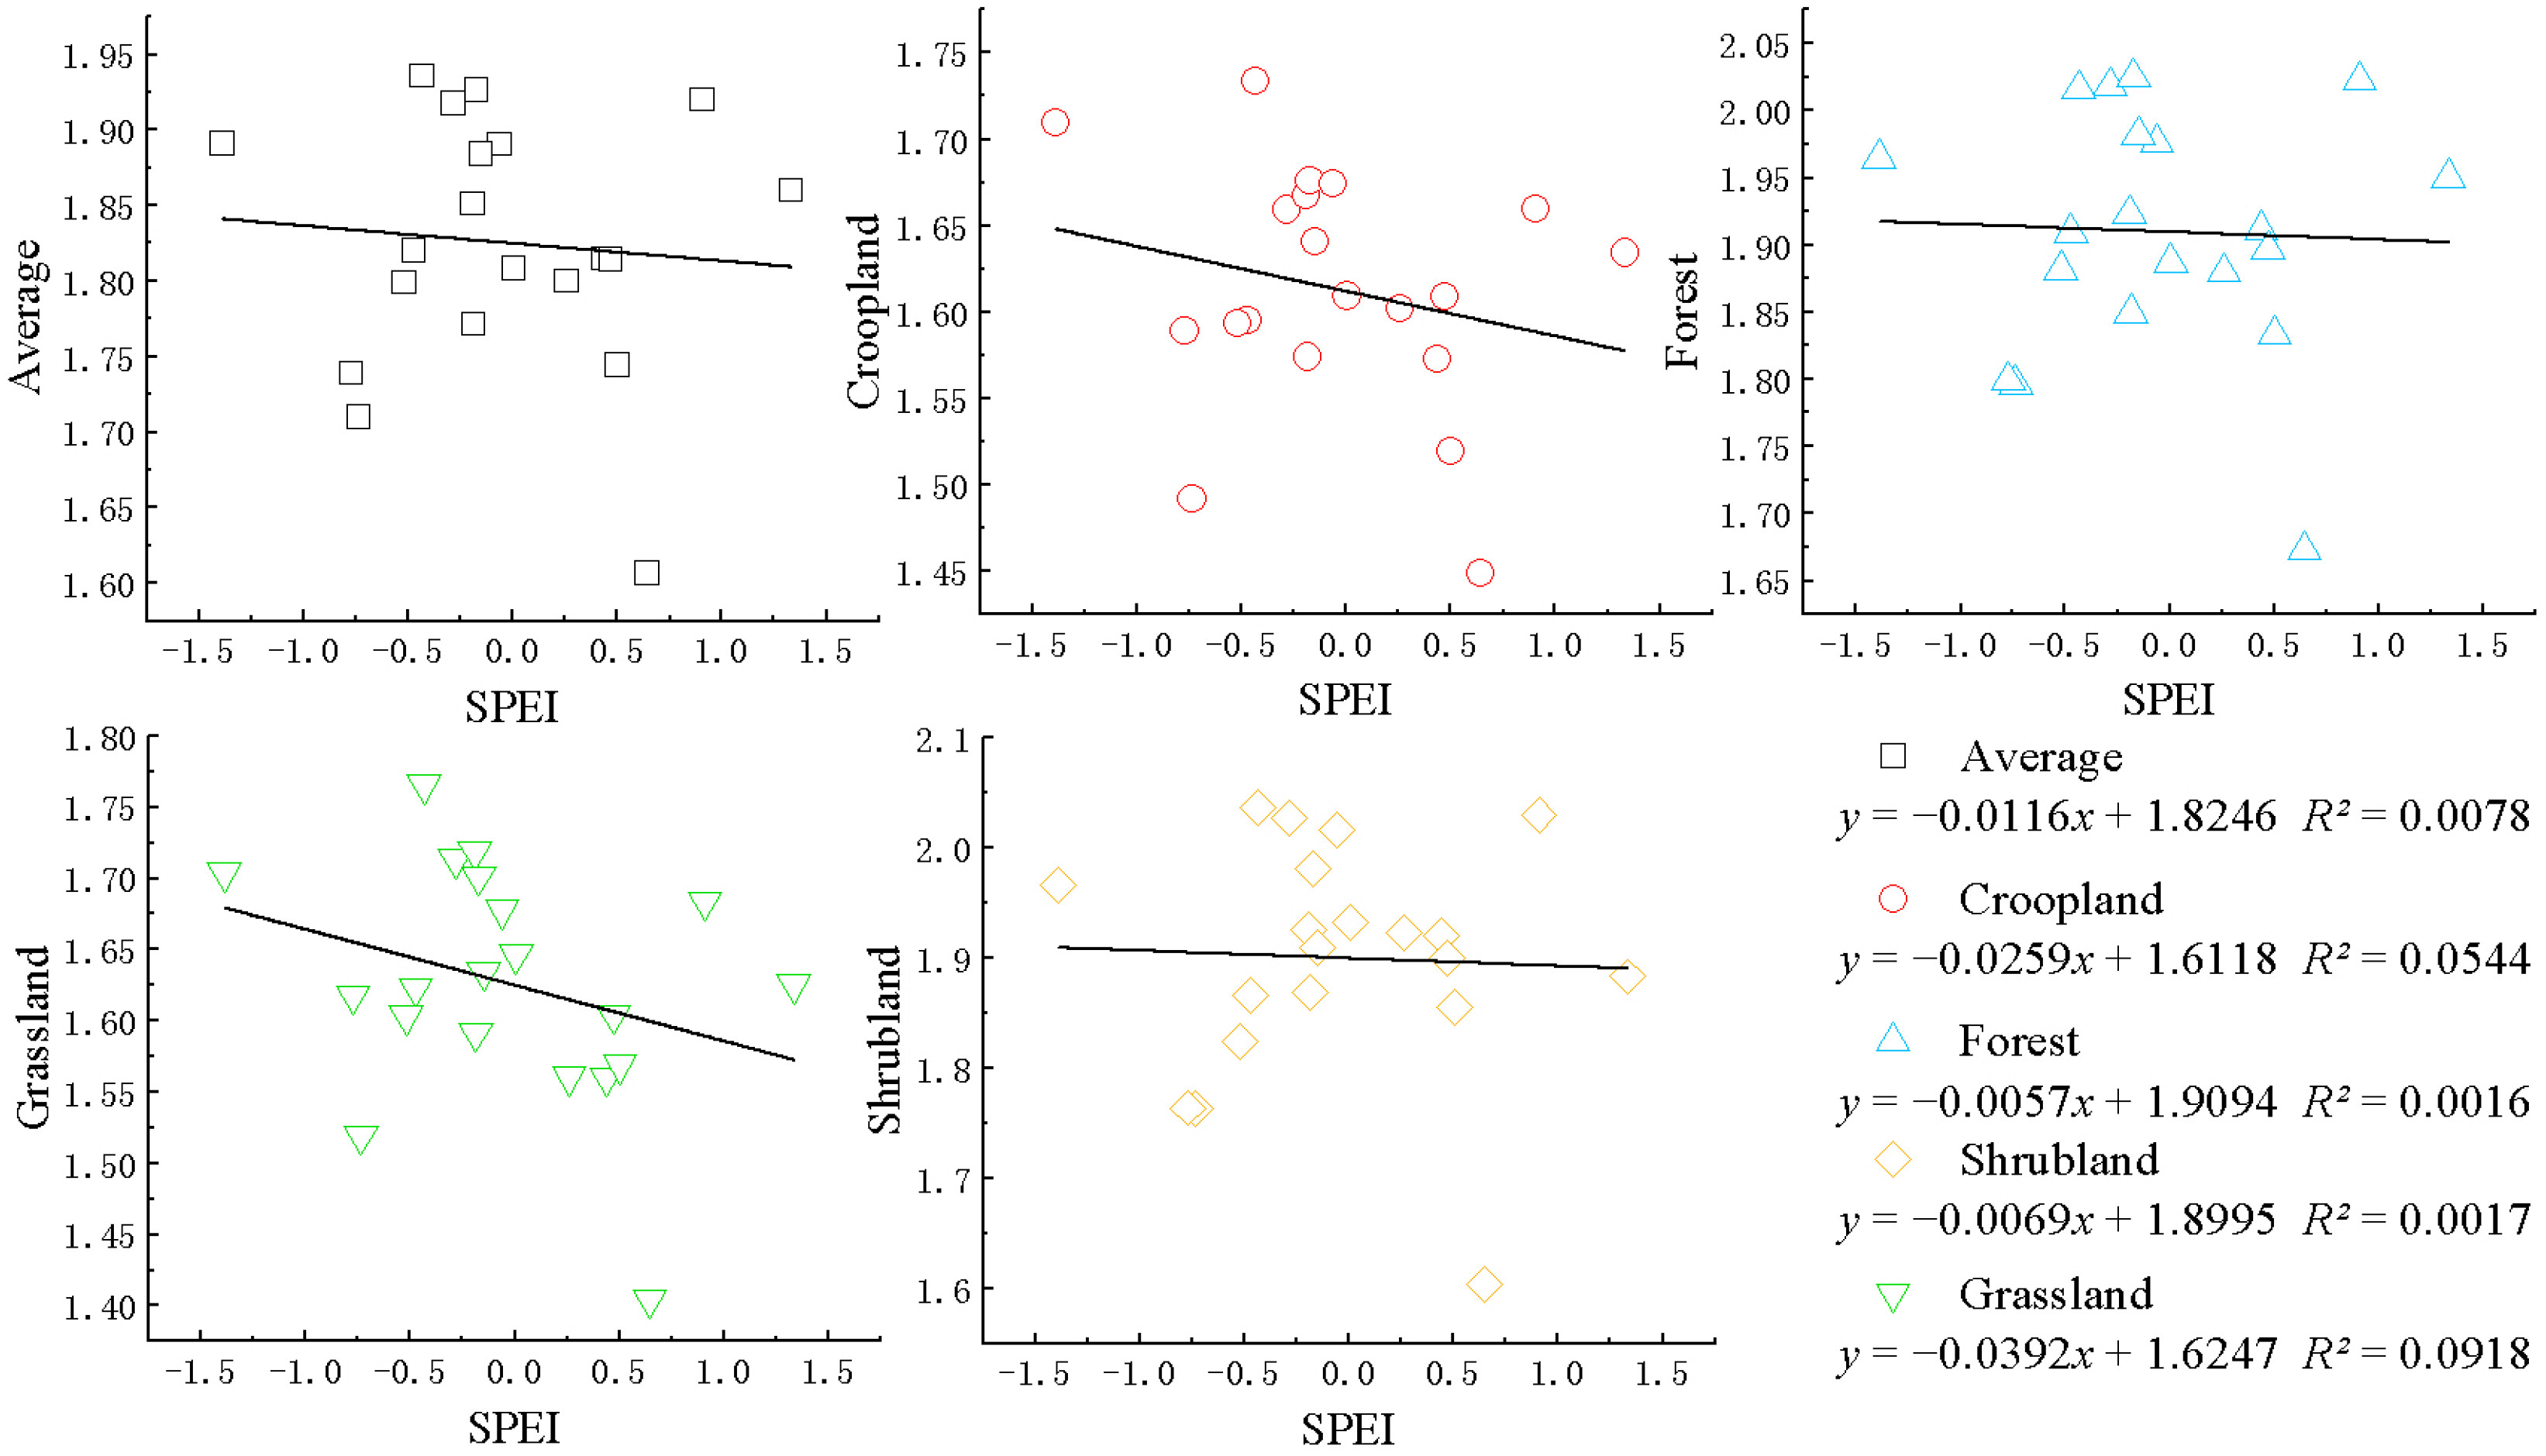
4.4. Impact of Drought Events on WUE
5. Discussion
6. Conclusions
- (1)
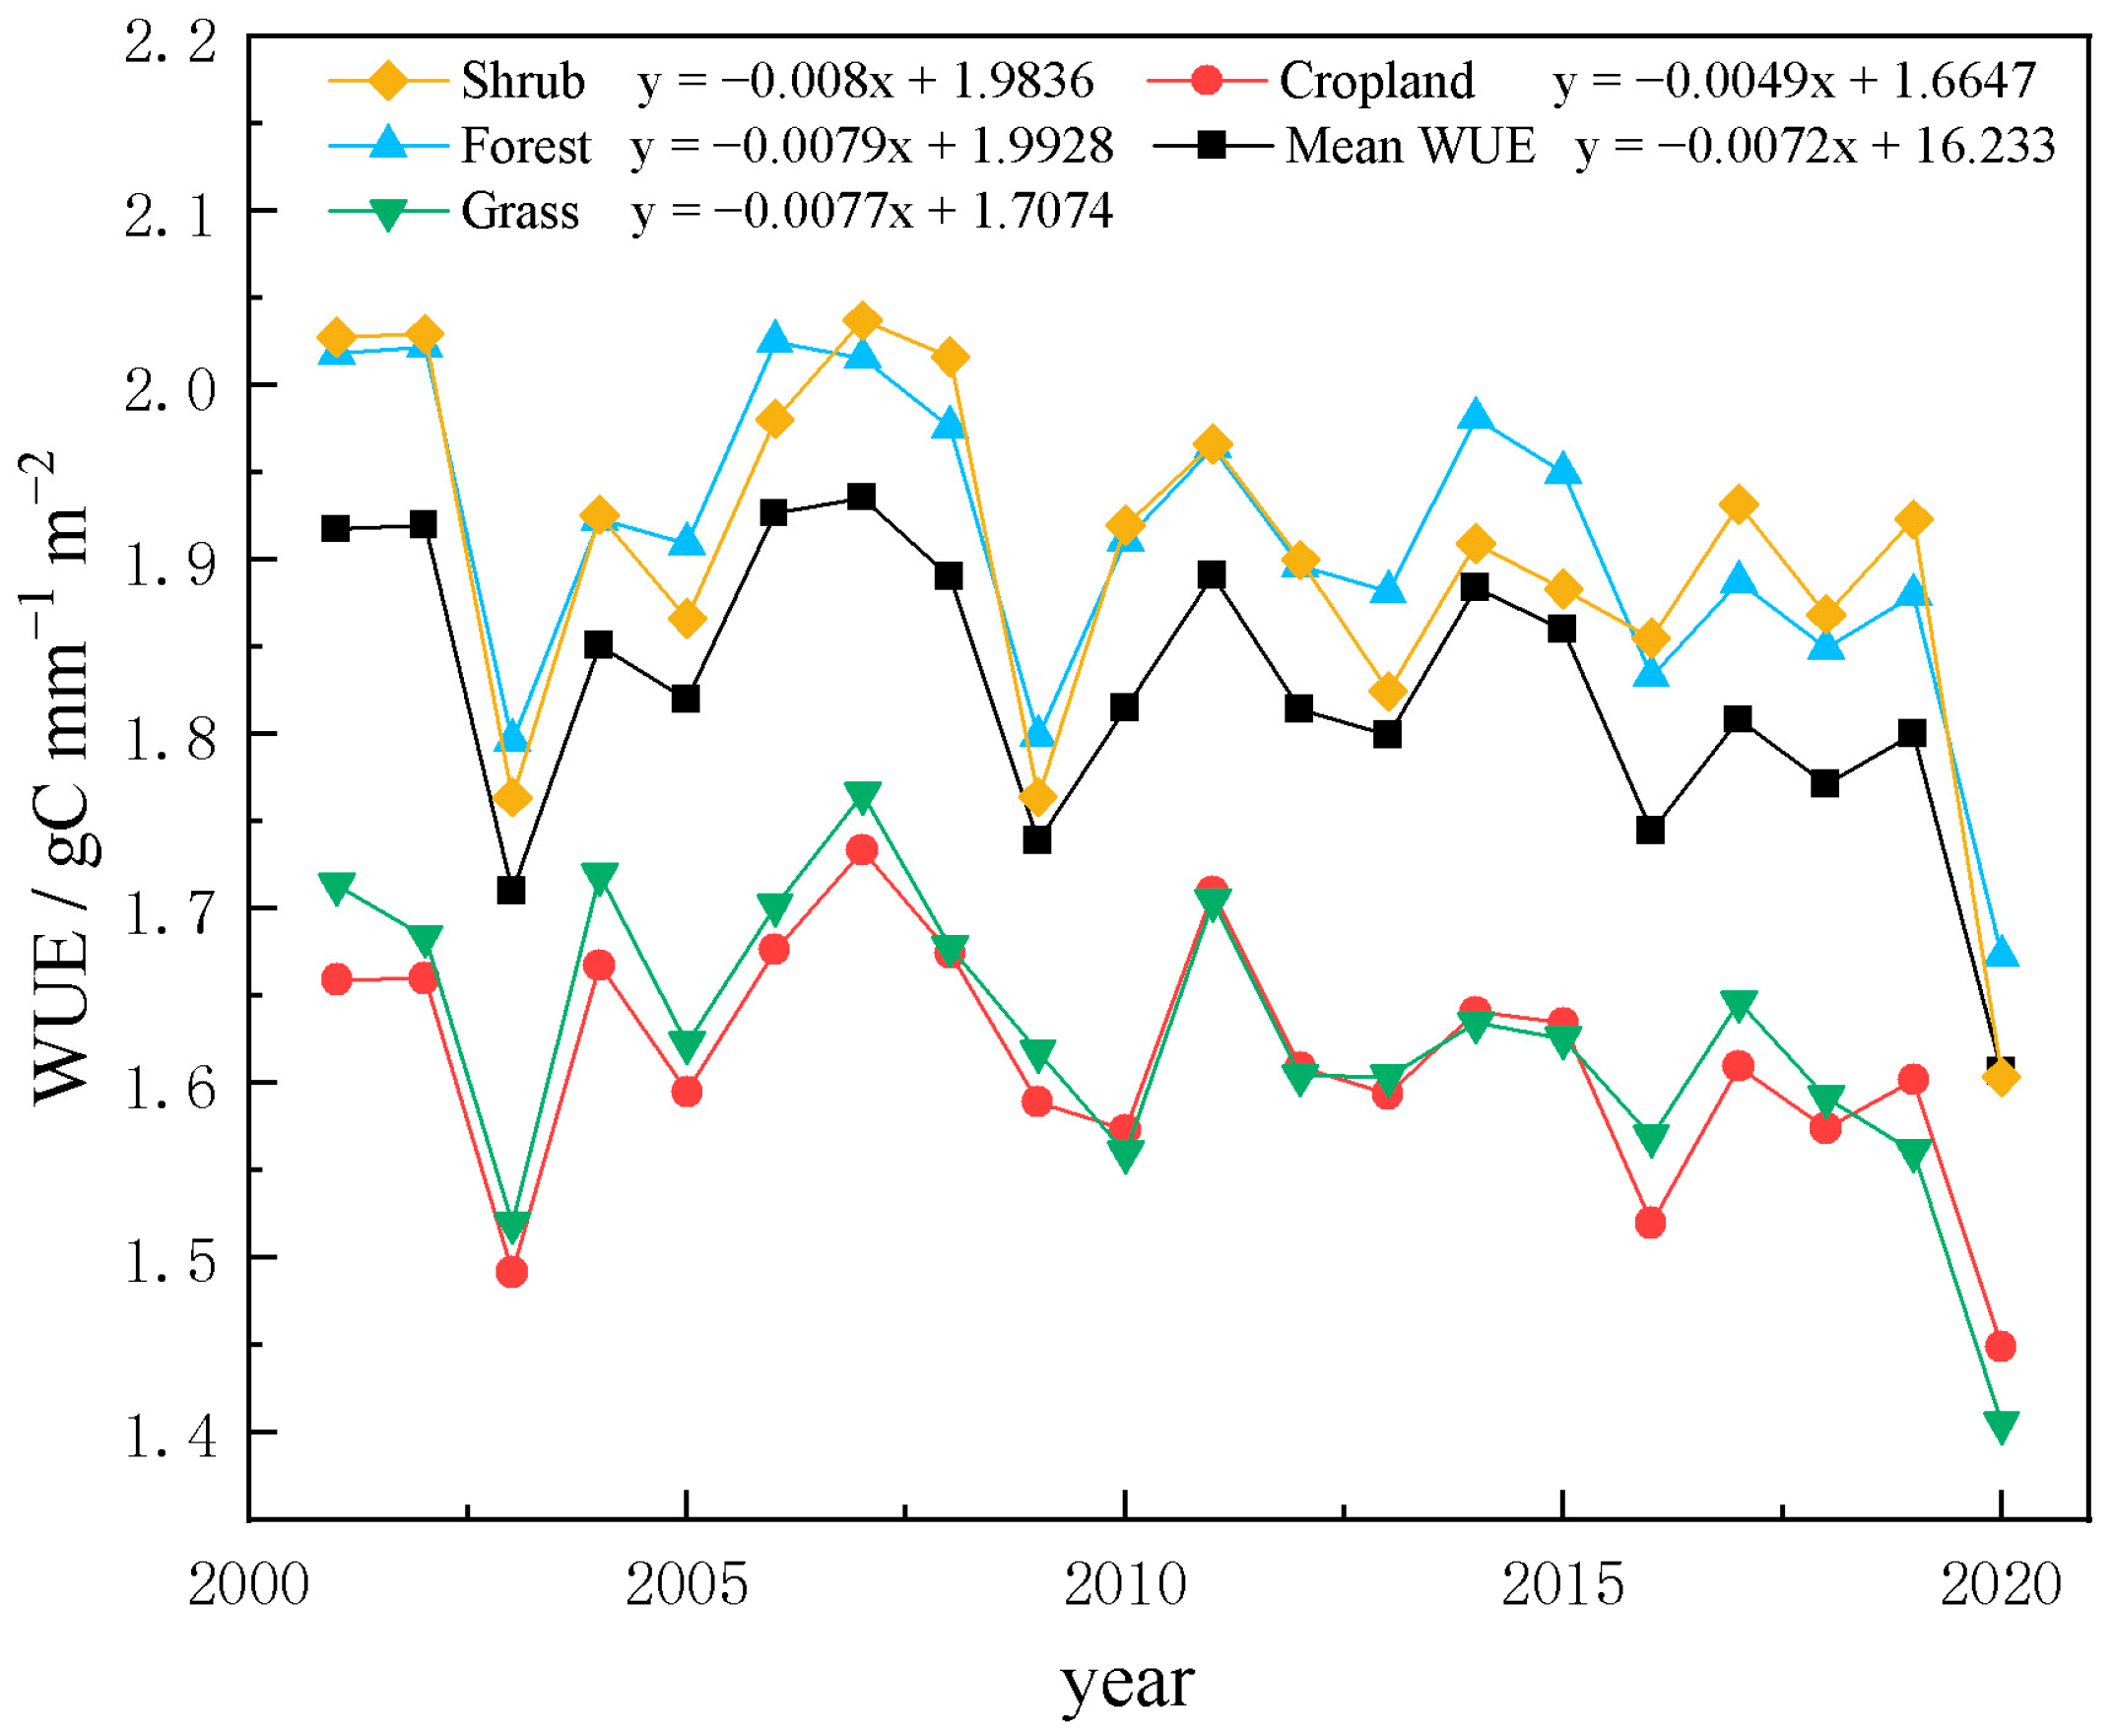
- The average value of WUE in the Li River Basin from 2001 to 2020 was 1.8251 gC·mm−1·m−2 and showed a decreasing trend at a rate of 0.0072 gC·mm−1·m−2·a−1. The WUE of the various land cover types from high to low were forest > shrubland > grassland > cropland; spatially, the south side of the basin was the main distribution area of the high values of WUE, while the low values were mostly located in the central part of the basin.
- (2)
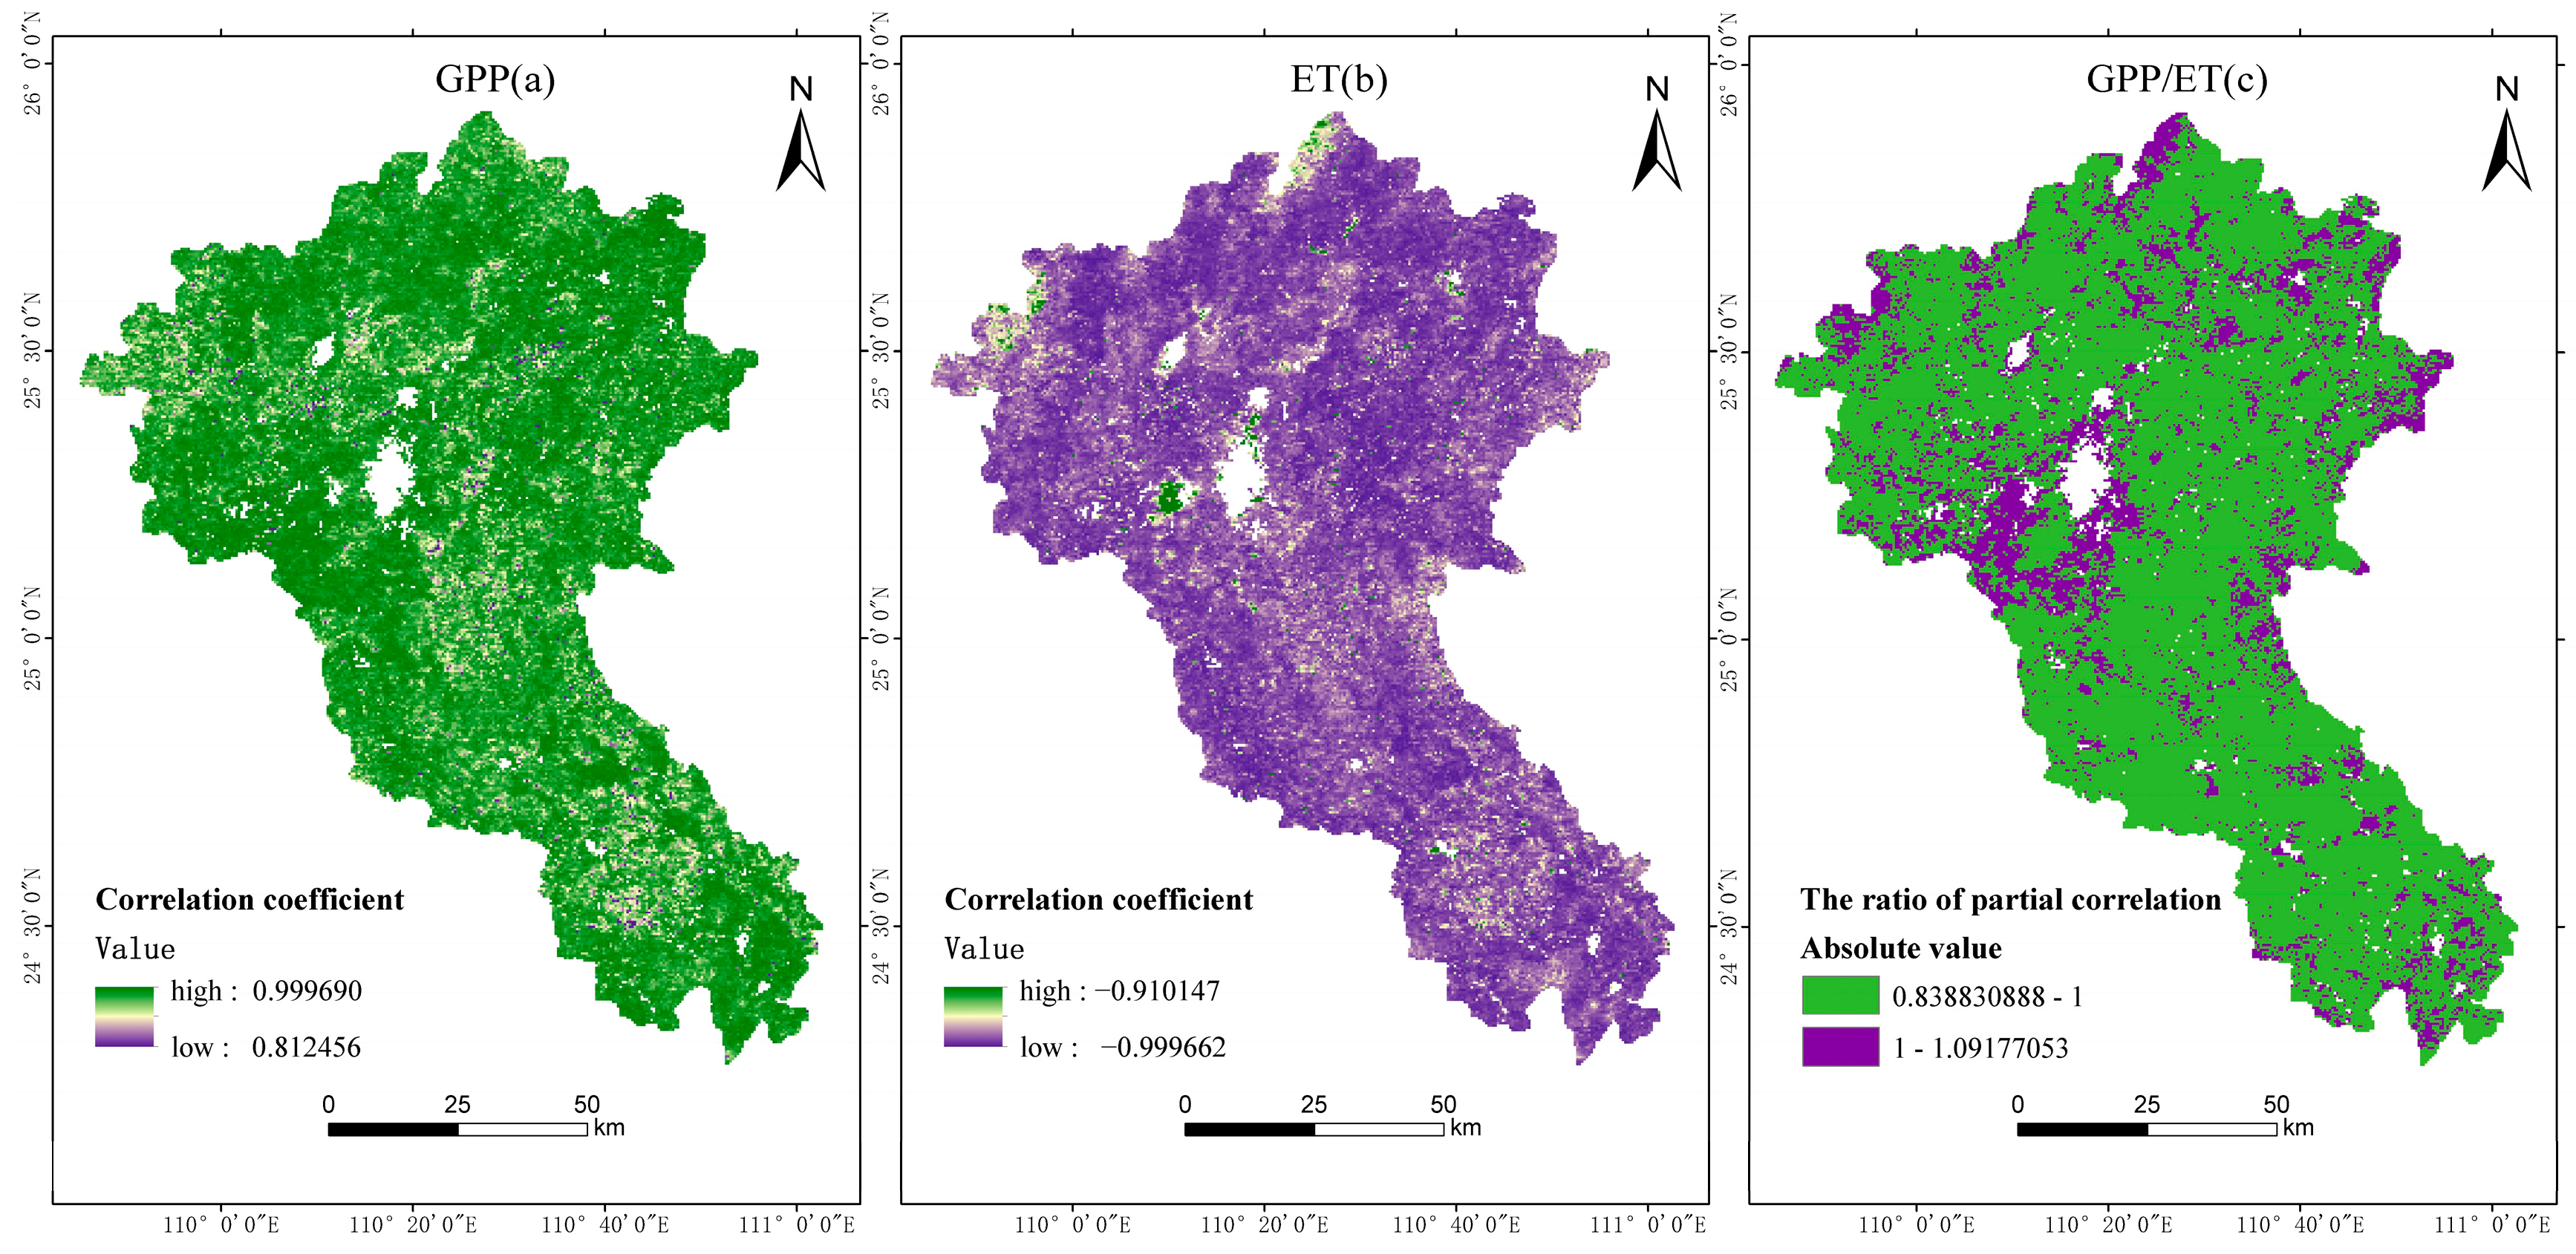
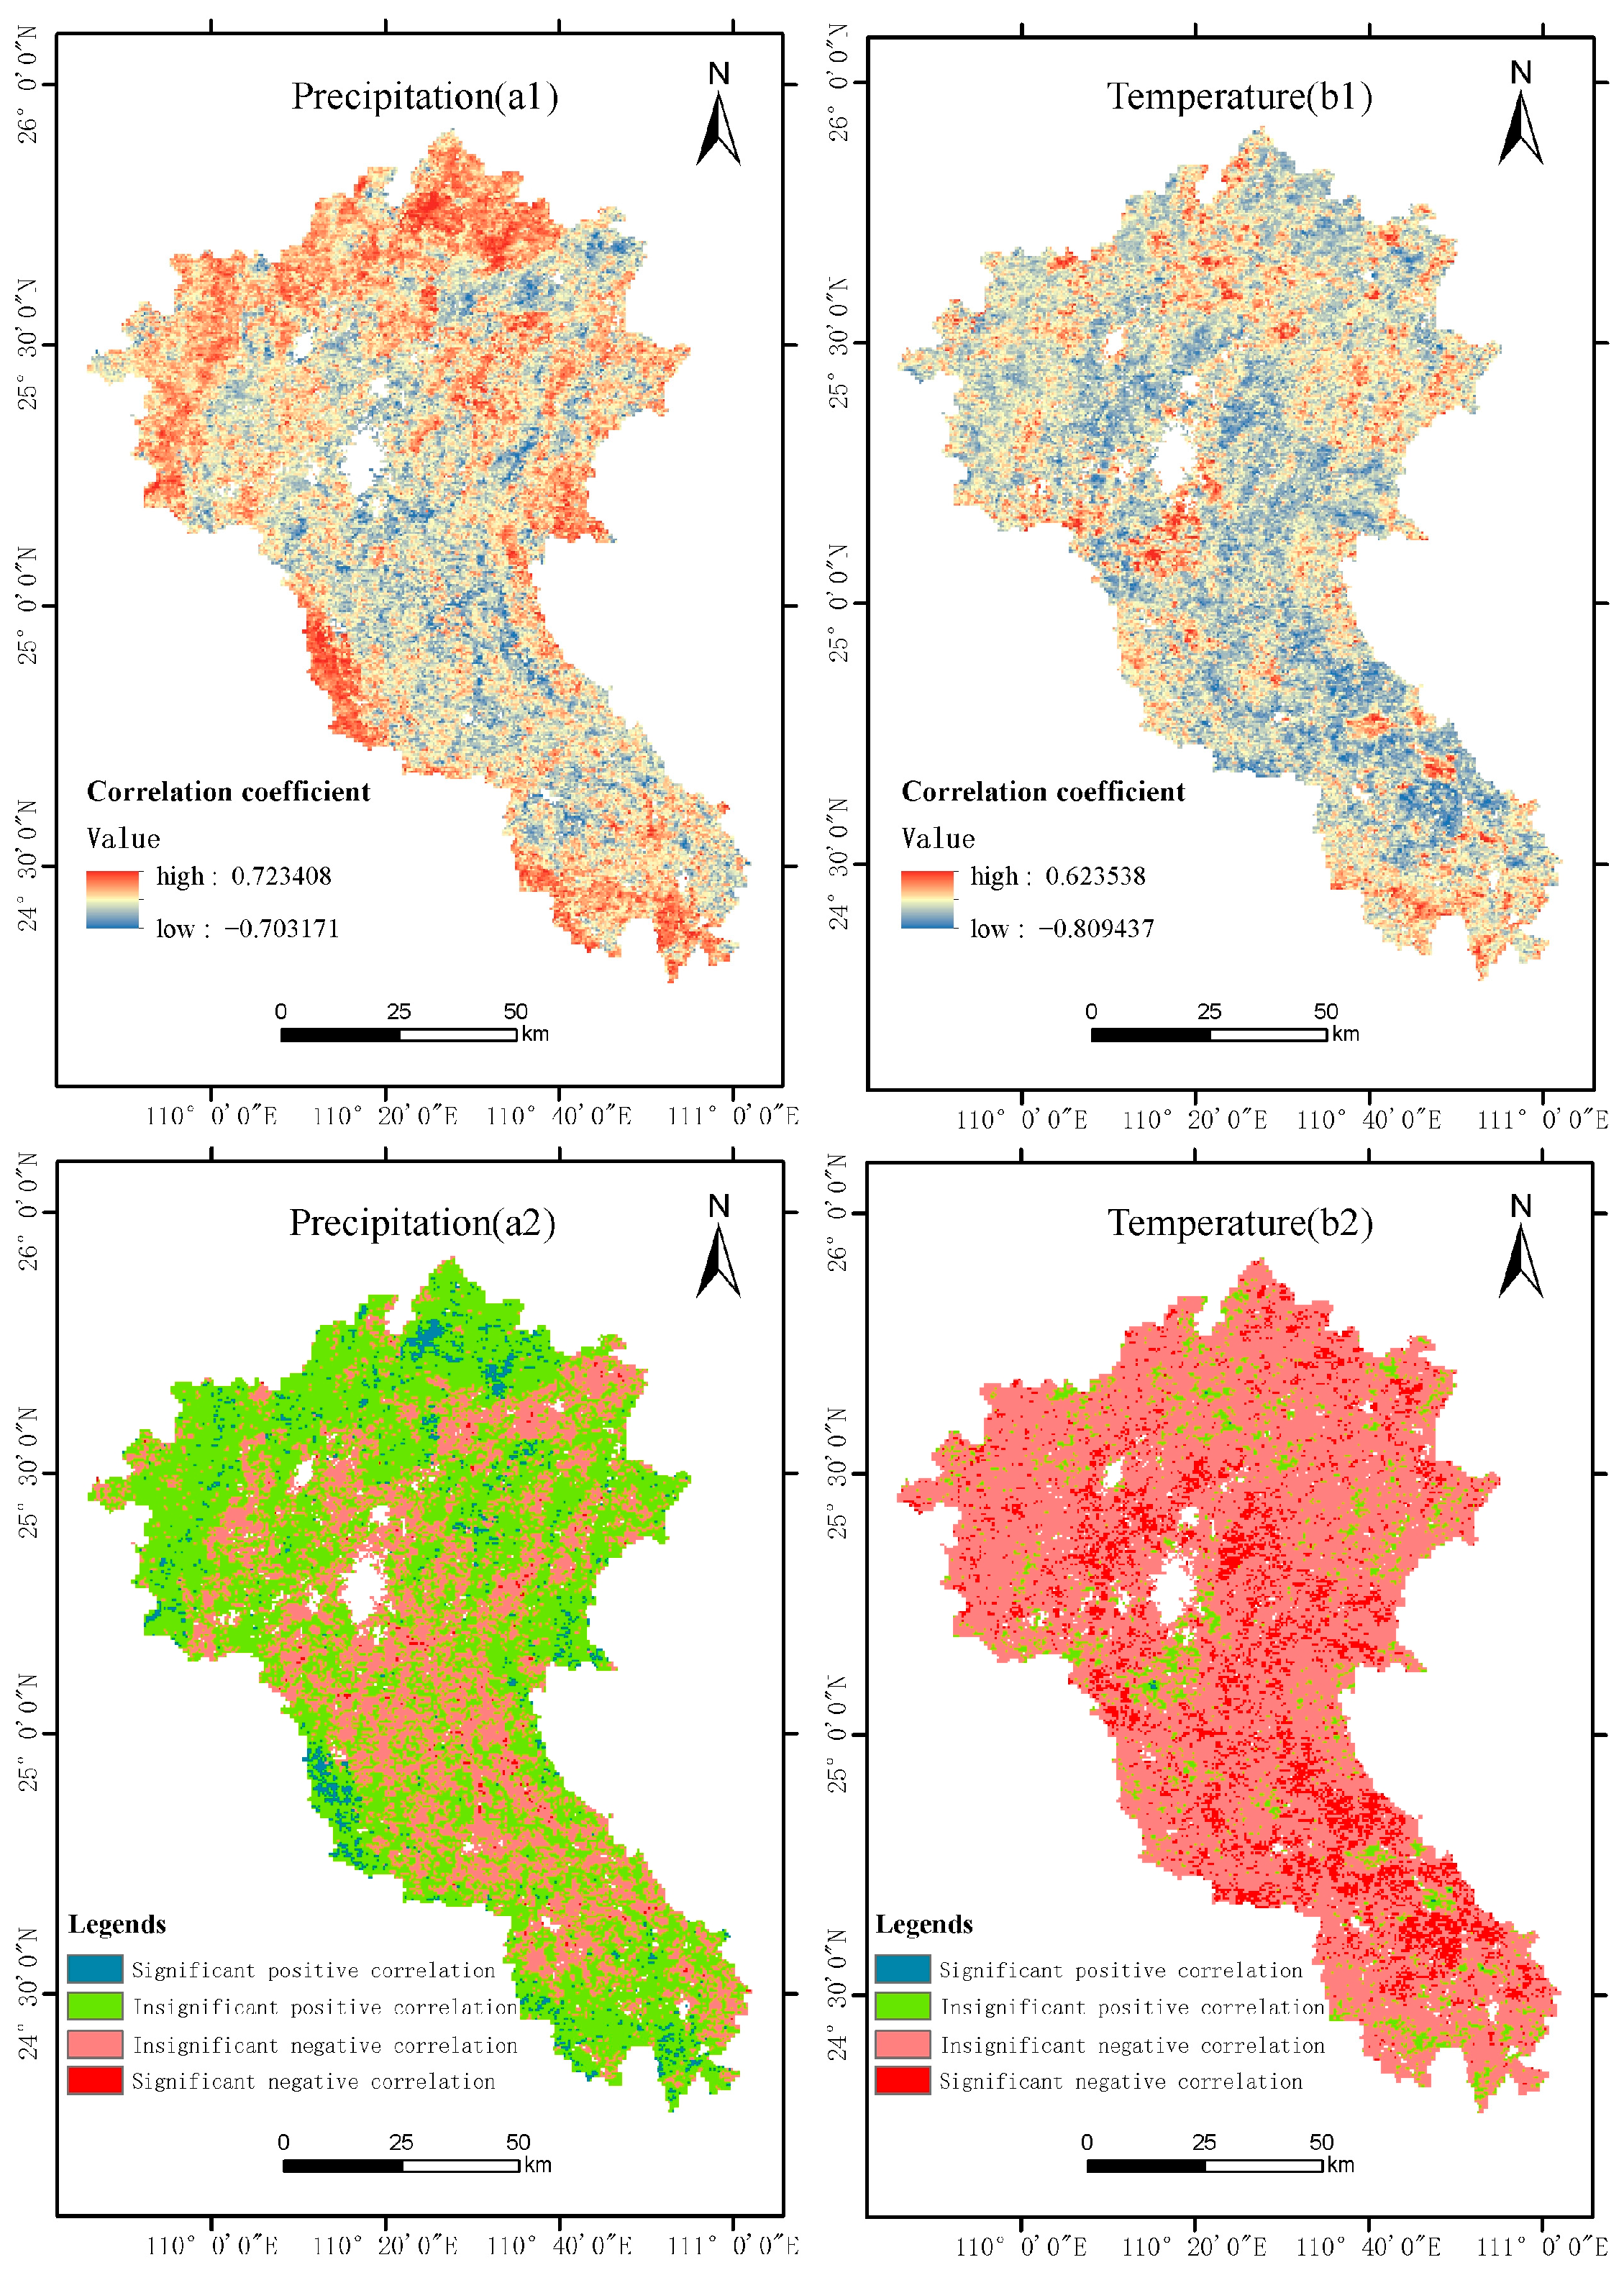
- By using the correlation analysis method to determine the relationship between different influencing factors and WUE, it was found that ET was the primary influencing factor in the change in WUE; in 67.22% of the total area of the basin, precipitation was positively correlated with WUE; in 92.67% of the total study area, air temperature was negatively correlated with WUE.
- (3)
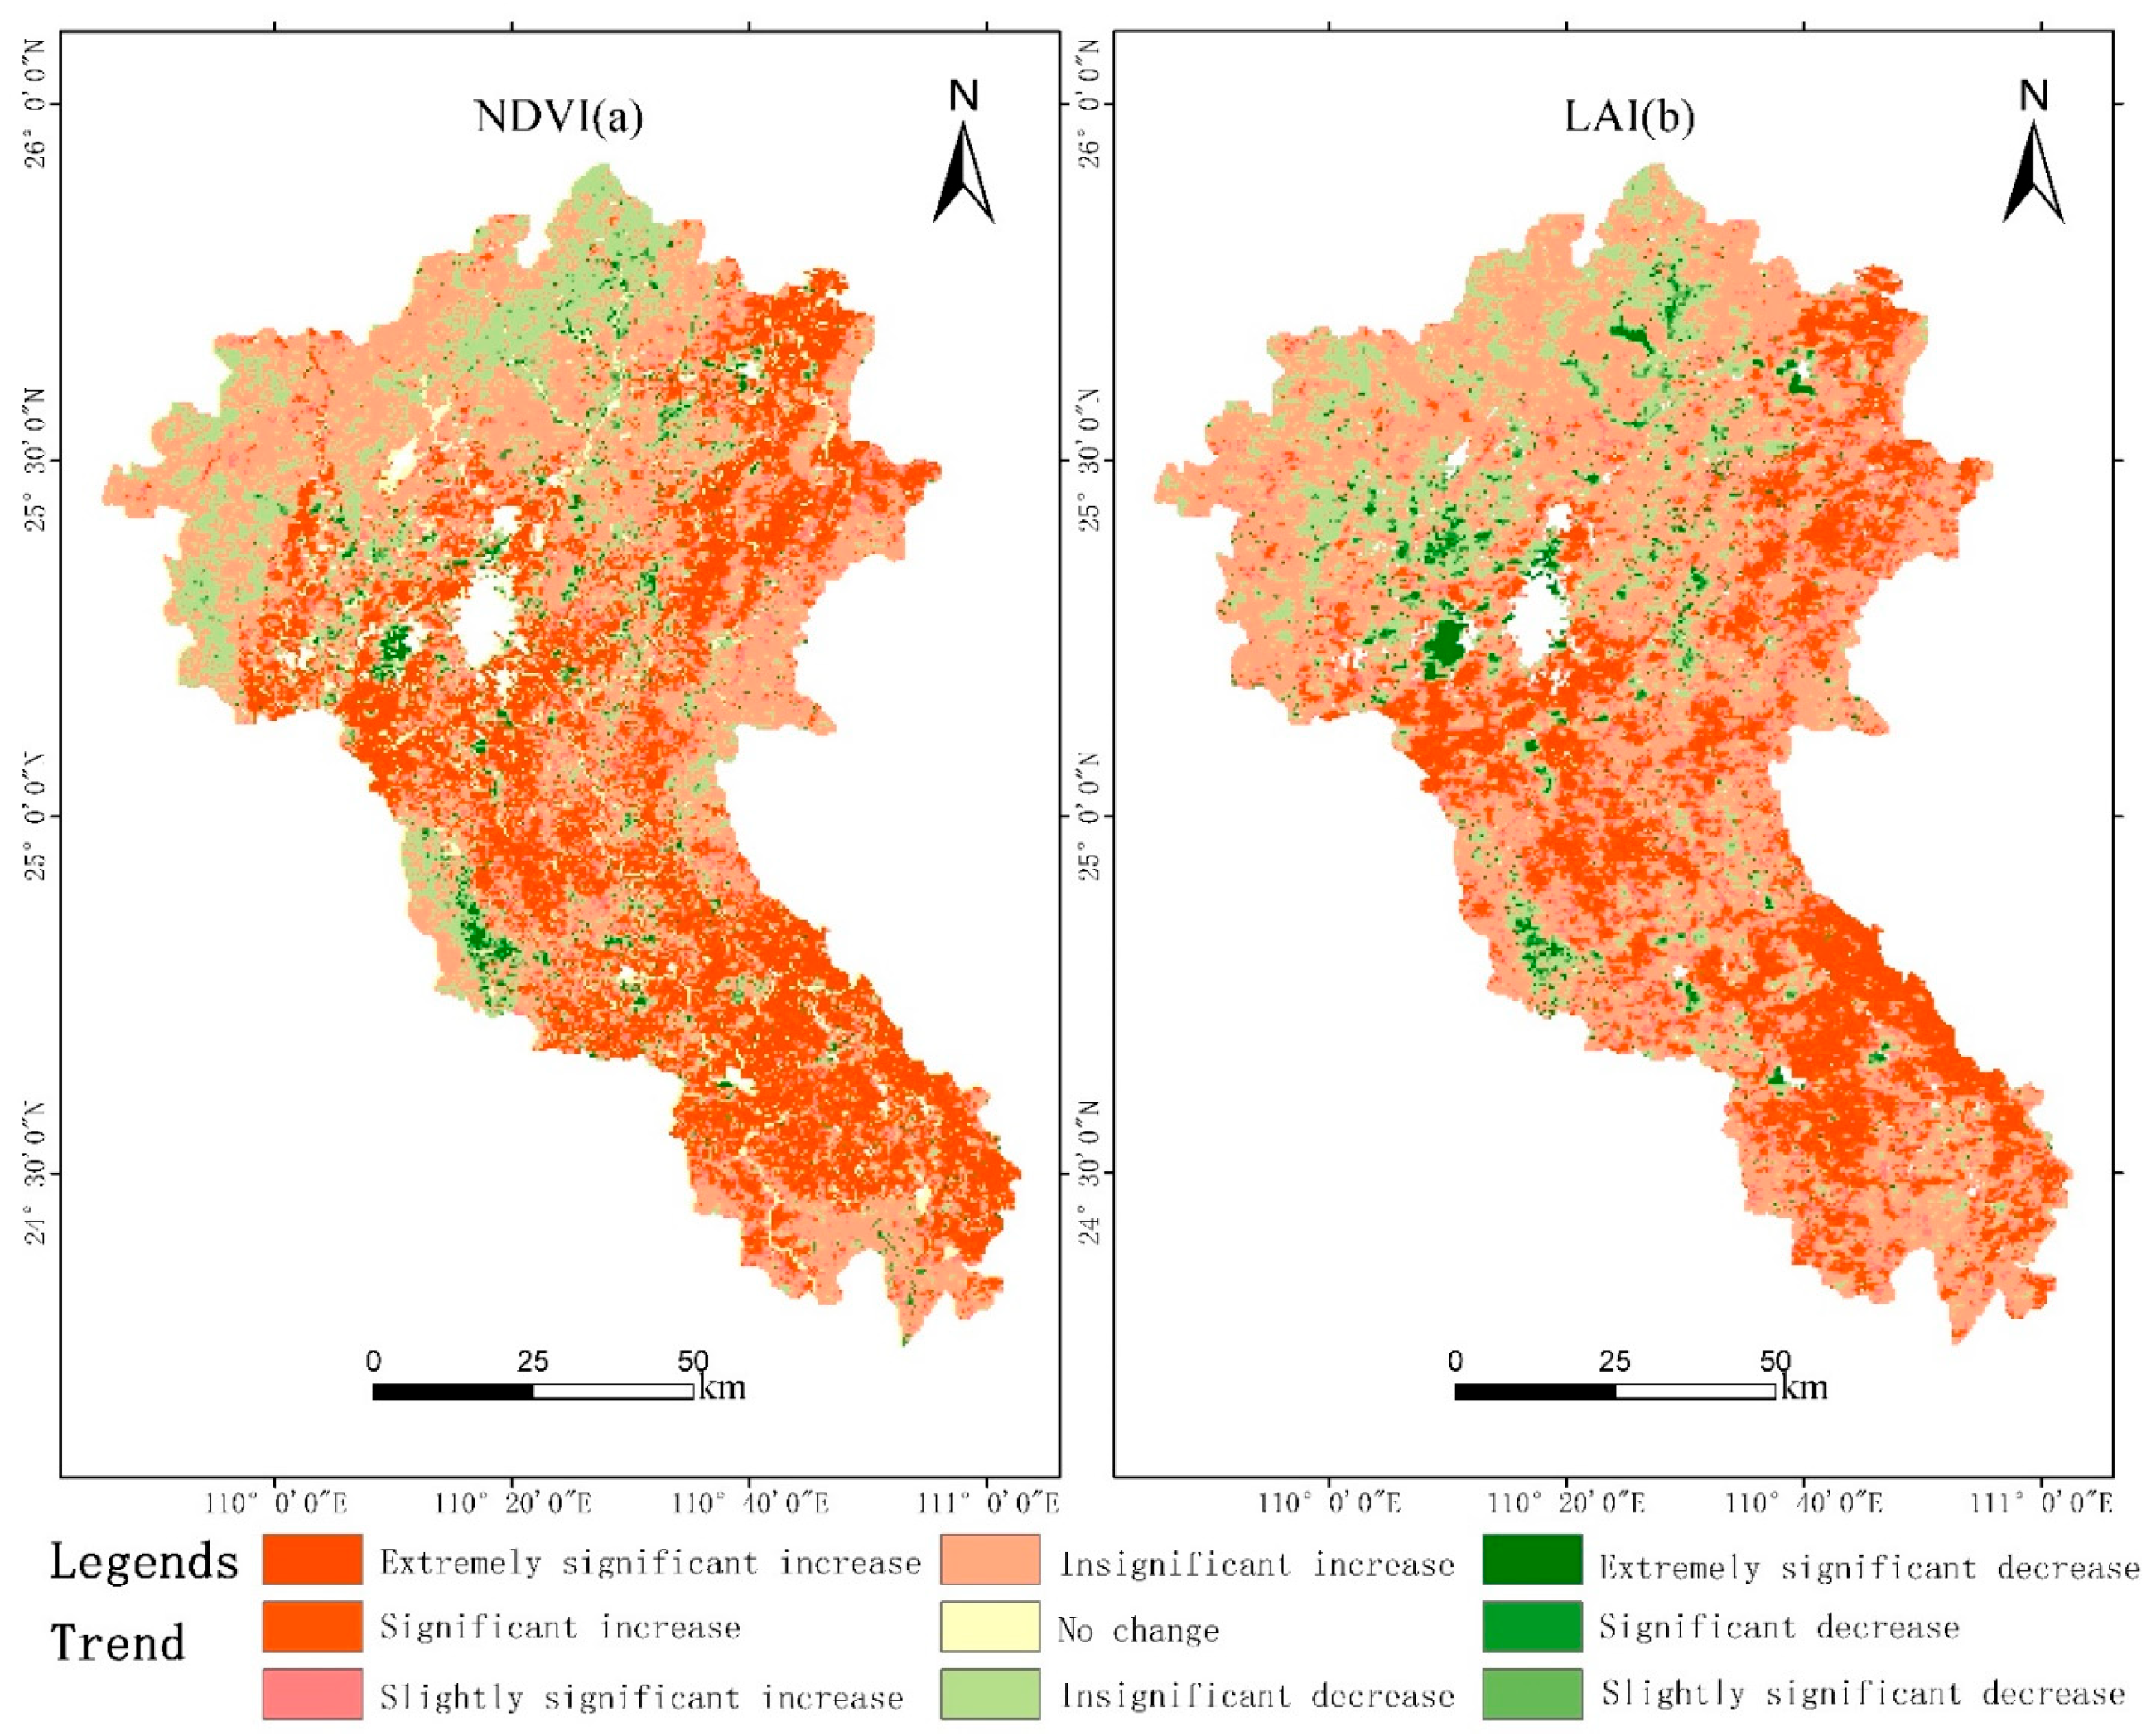
- The analysis showed that the NDVI, LAI, and WUE were all negatively correlated with WUE, and the percentages of negatively correlated areas were similar, both between 60 and 70%, and the growth of vegetation inhibited the increase in WUE in the basin to a certain extent. Regarding VPD, the proportions of positive and negative correlation areas with WUE were similar, accounting for 49.58% and 50.42%, respectively.
- (4)
- Based on the SPEI, we found that the occurrence of drought events and their enhancement resulted in a continuous increase in WUE in the basin; for different vegetation types, the correlation of the SPEI and WUE from strongest to weakest was grassland > cropland > forest > shrubland.
Author Contributions
Funding
Data Availability Statement
Conflicts of Interest
References
- Niu, S.L.; Xing, X.R.; Zhang, Z.; Xia, J.Y.; Zhou, X.H.; Song, B.; Li, L.H.; Wan, S.Q. Water-use efficiency in response to climate change: From leaf to ecosystem in a temperate steppe. Glob. Chang. Biol. 2011, 17, 1073–1082. [Google Scholar] [CrossRef]
- Chen, J.; Pu, J.; Li, J.; Zhang, T. Response of carbon- and water-use efficiency to climate change and human activities in China. Ecol. Indic. 2024, 160, 111829. [Google Scholar] [CrossRef]
- de Oliveira, G.; Brunsell, N.A.; Moraes, E.C.; Shimabukuro, Y.E.; Bertani, G.; dos Santos, T.V.; Aragao, L.E.O.C. Evaluation of MODIS-based estimates of water-use efficiency in Amazonia. Int. J. Remote Sens. 2017, 38, 5291–5309. [Google Scholar] [CrossRef]
- Cui, G.; Li, Q.; Zhao, J.; Chen, Q. Spatiotemporal evolution of ecosystem water use efficiency and its influencing factors in the Ili River–Balkhash Lake Basin. Chin. J. Ecol. 2023, 42, 2712–2720. [Google Scholar]
- Cai, W.; Ullah, S.; Yan, L.; Lin, Y. Remote sensing of ecosystem water use efficiency: A review of direct and indirect estimation methods. Remote Sens. 2021, 13, 2393. [Google Scholar] [CrossRef]
- Du, X.Z.; Zhao, X.; Wang, H.Y.; He, B. Responses of terrestrial ecosystem water use efficiency to climate change: A review. Acta Ecologica. Sinica. 2018, 38, 8296–8305. [Google Scholar]
- Tang, X.; Li, H.; Desai, A.; Nagy, Z.; Luo, J.; Kolb, T.E.; Olioso, A.; Xu, X.; Yao, L.; Kutsch, W.; et al. How is water-use efficiency of terrestrial ecosystems distributed and changing on Earth? Sci. Rep. 2014, 4, 7483. [Google Scholar] [CrossRef]
- Cui, S.Y.; Xiao, Y.S.; Yang, Y.T.; Hu, Z.M.; Zheng, G. Spatial variations in water use efficiency across global terrestrial ecosystems. Catena 2024, 235, 107670. [Google Scholar] [CrossRef]
- Du, X.; Zhao, X.; Zhou, T.; Jiang, B.; Xu, P.; Wu, D.; Tang, B. Effects of Climate Factors and Human Activities on the Ecosystem Water Use Efficiency throughout Northern China. Remote Sens. 2019, 11, 2766. [Google Scholar] [CrossRef]
- Guo, L.M.; Sun, F.B.; Liu, W.B.; Zhang, Y.G.; Wang, H.; Cui, H.J.; Wang, H.Q.; Zhang, J.; Du, B.X. Response of Ecosystem Water Use Efficiency to Drought over China during 1982–2015: Spatiotemporal Variability and Resilience. Forests 2019, 10, 598. [Google Scholar] [CrossRef]
- Peng, D.W.; Zhou, Q.W.; Wei, X.C.; Li, H.G.; Tang, X.; Yan, W.H. Change of water use efficiency and its response to meteorological factors in karst area of Southwest China. Acta Ecologica. Sinica. 2021, 41, 9470–9480. [Google Scholar]
- Zhang, J.; Yang, S.; Yang, S.; Fan, L.; Zhou, X. Spatio-Temporal Variations of Ecosystem Water Use Efficiency and Its Drivers in Southwest China. Land 2023, 12, 397. [Google Scholar] [CrossRef]
- Wang, M.; Ding, Z.; Wu, C.Y.; Song, L.S.; Ma, M.G.; Yu, P.J.; Lu, B.Q.; Tang, X.G. Divergent responses of ecosystem water-use efficiency to extreme seasonal droughts in Southwest China. Sci. Total Environ. 2020, 760, 143427. [Google Scholar] [CrossRef] [PubMed]
- Zhou, X.; Ao, Y.; Jiang, X.; Yang, S.T.; Hu, Y.X.; Wang, X.H.; Zhang, J. Water use efficiency of China’s karst ecosystems: The effect of different ecohydrological and climatic factors. Sci. Total Environ. 2023, 905, 167069. [Google Scholar] [CrossRef]
- Gao, X.Y.; Hao, H.C.; Zhang, X.Q.; Chen, Y.N. Responses of vegetation water use efficiency to meteorological factors in arid areas of northwest China: A case of Xinjiang. Arid Land Geogr. 2023, 46, 1111–1120. [Google Scholar]
- IPCC. Climate Change 2021: The Physical Science Basis; Cambridge University Press: Cambridge, UK, 2021. [Google Scholar]
- Xu, H.J.; Wang, X.P.; Zhao, C.Y.; Zhang, X.X. Responses of ecosystem water use efficiency to meteorological drought under different biomes and drought magnitudes in northern China. Agric. For. Meteorol. 2019, 278, 107660. [Google Scholar] [CrossRef]
- Zhao, J.; Xu, T.; Xiao, J.; Liu, S.; Mao, K.; Song, L.; Yao, Y.; He, X.; Feng, H. Responses of Water Use Efficiency to Drought in Southwest China. Remote Sens. 2020, 12, 199. [Google Scholar] [CrossRef]
- Li, L.L.; Du, J.; Li, Y.H.; Chen, M.K.; Wan, B.W.; Wang, D.W. Changes of vegetation water use efficiency and their responding to scPDSI in frozen ground area of the Qilian Mountains from 2000 to 2020. J. Glaciol. Geocryol. 2023, 45, 688–698. [Google Scholar]
- Xue, L.Q.; Xiao, Y.; Liu, Y.H.; Yang, M.J.; Liu, S.H.; Zhang, Y.H. Spatiotemporal accumulation response of vegetation water use efficiency to drought in the Yellow River Basin. Water Resour. Prot. 2023, 39, 32–41. [Google Scholar]
- Zou, J.; Ding, J.L.; Qin, Y.; Wang, F. Response of water use efficiency of Central Asia ecosystem to drought based on remote sensing data. Trans. Chin. Soc. Agric. Eng. 2018, 34, 145–152. [Google Scholar]
- Ma, J.Y.; Jia, X.; Zha, T.S.; Bourque, C.P.A.; Tian, Y.; Bai, Y.J.; Liu, P.; Yang, R.Z.; Li, C.; Li, C.Y.; et al. Ecosystem water use efficiency in a young plantation in Northern China and its relationship to drought. Agric. For. Meteorol. 2019, 275, 1–10. [Google Scholar] [CrossRef]
- Kuang, X.Y.; Su, Z.; Tu, F.X. Climate Regionalization of Guangxi. Guangxi Sci. 2007, 14, 278–283. [Google Scholar]
- Yang, J.; Huang, X. The 30 m annual land cover datasets and its dynamics in China from 1985 to 2022 [Data set]. In Earth System Science Data; Zenodo: Geneve Switzerland, 2023; Volume 13, pp. 3907–3925. [Google Scholar] [CrossRef]
- Sen, P.K. Estimates of the regression coefficient based on Kendall’s tau. JASA J. Am. Stat. Assoc. 1968, 63, 1379–1389. [Google Scholar] [CrossRef]
- Mann, H.B. Nonparametric tests against trend. Econometrica 1945, 13, 245. [Google Scholar] [CrossRef]
- Kendall, M.G. Rank correlation methods. In Public Program Analysis; Springer: Boston, MA, USA, 1975. [Google Scholar]
- Sun, G.K.; Huang, R.; Wang, G.S.; Wang, X.; Ma, L.; Wang, L.; Mo, C. Spatiotemporal Variation of Water Use Efficiency and Its Influencing Factors in Xijiang River Basin from 2001 to 2018. Res. Soil Water Conserv. 2023, 30, 327–335. [Google Scholar]
- Ma, H.; Zhang, G.; Mao, R.; Su, B.; Liu, W.; Shi, P. Snow depth variability across the Qinghai Plateau and its influencing factors during 1980–2018. Int. J. Climatol. 2023, 43, 1094–1111. [Google Scholar] [CrossRef]
- Zhao, J.; Feng, H.; Xu, T.; Xiao, J.; Guerrieri, R.; Liu, S.; Wu, X.; He, X.; He, X. Physiological and environmental control on ecosystem water use efficiency in response to drought across the northern hemisphere. Sci. Total Environ. 2021, 758, 143599. [Google Scholar] [CrossRef]
- Li, Y.P.; Zhang, K.; Liu, L.X. Water use efficiency at multi-time scales and its response to episodic drought and wet periods in a typical subtropical evergreen forest of Southeast China. Ecol. Indic. 2023, 151, 110254. [Google Scholar] [CrossRef]
- Gong, F.; Du, L.T.; Meng, C.; Yang, D. Characteristics of water use efficiency in terrestrial ecosystems and its influence factors in Ningxia Province. Acta Ecologica. Sinica. 2019, 39, 9068–9078. [Google Scholar]
- Keeling, C.D.; Chin, J.F.S.; Whorf, T.P. Increased activity of northern vegetation inferred from atmospheric CO2 measurements. Nature 1996, 382, 146–149. [Google Scholar] [CrossRef]
- Higgins, S.I.; Scheiter, S. Atmospheric CO2 forces abrupt vegetation shifts locally, but not globally. Nature 2012, 488, 209–212. [Google Scholar] [CrossRef]
- Adole, T.; Dash, J.; Peter, M.; Atkinson, A. systematic review of vegetation phenology in Africa. Ecol. Inform. 2016, 34, 117–128. [Google Scholar] [CrossRef]
- Chen, J.M.; Black, T.A. Defining leaf area index for non-fiat leaves. Plant Cell Environ. 1992, 15, 421. [Google Scholar] [CrossRef]
- Veroustraete, F.; Patyn, J.; Myneni, R.B. Estimating net ecosystem exchange of carbon using the normalized difference vegetation index and an ecosystem model. Remote Sens. Environ. 1996, 58, 115–130. [Google Scholar] [CrossRef]
- Wang, D.W.; Zhao, C.Z.; Fang, F.; Lin, J.J.; Li, L.L.; Yang, Y.M. Spatial-temporal dynamics of water use efficiency and responding to vapor pressure deficit in Shiyang River Basin, northwestern China. Acta Ecologica. Sinica. 2023, 43, 3090–3102. [Google Scholar]
- Vicente-Serrano, S.M.; Beguería, S.; López-Moreno, J.I. A Multiscalar Drought Index Sensitive to Global Warming: The Standardized Precipitation Evapotranspiration Index. J. Clim. 2010, 23, 1696–1718. [Google Scholar] [CrossRef]
- Campos, G.E.; Moran, M.S.; Huete, A.; Zhang, Y.; Bresloff, C.; Huxman, T.E.; Eamus, D.; Bosch, D.D.; Buda, A.R.; Gunter, S.A.; et al. Ecosystem resilience despite large-scale altered hydroclimatic conditions. Nature 2013, 494, 349–352. [Google Scholar] [CrossRef]
- Guo, L.M. Spatiotemporal Variations of Terrestrial Ecosystem Water Use Efficiency and Its Response to Drought in Recent 35 Years in China. Master’s Thesis, Nanjing University, Nanjing, China, 2020. [Google Scholar]
- Huang, Z.; Cao, Y.; Xu, X.; Chen, S.; Feng, H.; Wang, Z.; Yu, Q.; He, J. Study on the Ecosystem Water Use Efficiency of the Qinling Mountains with Multi-source GPP and ET Products. J. Soil Water Conserv. 2022, 36, 181–194+203. [Google Scholar]


| Trends | M-K Test Confidence Level | Type of Change |
|---|---|---|
| V > 2.58 | Extremely significant increase | |
| β > 0 | 2.58 ≥ V > 1.96 | Significant increase |
| 1.96 ≥ V > 1.65 | Slightly significant increase | |
| V ≥ 1.65 | Insignificant increase | |
| β | V | No change |
| V ≥ 1.65 | Insignificant decrease | |
| 1.96 ≥ V > 1.65 | Slightly significant decrease | |
| β < 0 | 2.58 ≥ V > 1.96 | Significant decrease |
| V > 2.58 | Extremely significant decrease |
Disclaimer/Publisher’s Note: The statements, opinions and data contained in all publications are solely those of the individual author(s) and contributor(s) and not of MDPI and/or the editor(s). MDPI and/or the editor(s) disclaim responsibility for any injury to people or property resulting from any ideas, methods, instructions or products referred to in the content. |
© 2024 by the authors. Licensee MDPI, Basel, Switzerland. This article is an open access article distributed under the terms and conditions of the Creative Commons Attribution (CC BY) license (https://creativecommons.org/licenses/by/4.0/).
Share and Cite
Chu, Y.; Tang, X.; Zhong, X. Spatial–Temporal Variations in Water Use Efficiency and Its Influencing Factors in the Li River Basin, China. Water 2024, 16, 2864. https://doi.org/10.3390/w16192864
Chu Y, Tang X, Zhong X. Spatial–Temporal Variations in Water Use Efficiency and Its Influencing Factors in the Li River Basin, China. Water. 2024; 16(19):2864. https://doi.org/10.3390/w16192864
Chicago/Turabian StyleChu, Yanqi, Xiangling Tang, and Xuemei Zhong. 2024. "Spatial–Temporal Variations in Water Use Efficiency and Its Influencing Factors in the Li River Basin, China" Water 16, no. 19: 2864. https://doi.org/10.3390/w16192864
APA StyleChu, Y., Tang, X., & Zhong, X. (2024). Spatial–Temporal Variations in Water Use Efficiency and Its Influencing Factors in the Li River Basin, China. Water, 16(19), 2864. https://doi.org/10.3390/w16192864