Article

Application of Vertical Electrical Sounding and Toxicity Tests for the Analysis of Vertical Hydraulic Connectivity through the Vadose Zone

by
Isaí Gerardo Reyes-Cedeño
1,*,
Martín Hernández-Marín
2,
Jesús Pacheco-Martínez
2,
Roberto Rico-Martínez
3,
Mario Alberto Arzate-Cárdenas
4,
Anuard Pacheco-Guerrero
5,
Hugo Luna-Villavicencio
2 and
Raudel Padilla-Ceniceros
6
1
Facultad de Ingeniería, Universidad Panamericana, Josemaría Escrivá de Balaguer 101, Aguascalientes 20296, Mexico
2
Departamento de Ingeniería Civil, Universidad Autónoma de Aguascalientes, Aguascalientes 20100, Mexico
3
Departamento de Química, Universidad Autónoma de Aguascalientes, Aguascalientes 20100, Mexico
4
Consejo Nacional de Humanidades, Ciencias y Tecnologías, Universidad Autónoma de Aguascalientes, Aguascalientes 20100, Mexico
5
Unidad Académica de Ingeniería, Universidad Autónoma de Zacatecas, Zacatecas 98000, Mexico
6
Departamento de Construcción, Universidad Tecnológica de Calvillo, Carretera al Tepetate No. 102, Col. El Salitre, Calvillo 20860, Mexico
*
Author to whom correspondence should be addressed.
Water 2024, 16(2), 222; https://doi.org/10.3390/w16020222
Submission received: 4 November 2023 / Revised: 9 December 2023 / Accepted: 14 December 2023 / Published: 9 January 2024

Abstract

:
In this research, a hydraulic characterization of a 14 km segment of the San Pedro River, flowing through the center of the Aguascalientes Valley, was conducted. More than 50 years of flow measurement records were processed to obtain daily flows during dry and rainy seasons. Through geospatial analysis, areas with hydraulic retention, influenced by the region’s topography and sediment accumulation during the flood season, were identified. Similarly, the digital map of geological surface features revealed that some of these structures spatially coincide with these retention areas. Later, potential hydraulic connectivity between the surface and the aquifer were evaluated in the identified hydraulic stagnation areas (HSAs) using vertical electrical soundings (VESs). Finally, through an experimental process in which water collected from the San Pedro River flowed through a device filled with surface soil taken from the retention areas, the potential retention of pollutants by the local soil was evaluated based on toxicity tests using the monogonont rotifer Lecane papuana. The findings suggest the presence of three hydraulic stagnation areas (HSAs) in the examined section of the river, with one of them intersected by a surface discontinuity. According to the results of the VES, the water table beneath the HSA varies between 70 and 90 m in depth. Further analysis of the vertical electrical sounding (VES) results suggests the presence of vertical hydraulic connectivity between the San Pedro River and the local aquifer in the hydraulic stagnation areas (HSA). This is indicated by the identification of low-resistivity strata associated with highly saturated soil above the water table, as measured in the adjacent pumping wells. Additionally, the experiments involving the device filled with soil showed a reduction in water toxicity (ranging from 12 to 40%) as the San Pedro River water flowed through a 1 m column of local near-surface soil. The results of this experimental work suggest that the soil acts as a natural filter for contaminant transport under conditions in time and space similar to those of the experiment. However, there is still a significant research niche in conducting an experimental campaign in terms of hydrogeochemistry to obtain more specific results.

1. Introduction

In recent years, in many areas around the world, the transport of pollutants through the vertical connectivity between surface water and aquifers as a consequence of human activities has become a critical issue. This is due to the increase in population, industry, agriculture, and livestock [1,2,3]. Indeed, some phenomena serve as continuous warnings about the deterioration resulting from the improper use of water and other natural resources, although certain issues may necessitate more in-depth investigation for their detection. In the majority of instances, the adverse effects of pollution on both surface and underground hydrological systems are primarily attributed to urbanization processes [4,5,6,7]; this is because the incursion of infrastructure modifies the natural hydrological conditions of a river, for instance, with the construction of dams, spillways, sewage discharges, or dikes, among others [8,9,10].
The hydrological and environmental characteristics of rivers and streams are integrally linked to their respective hydrographic basins; therefore, potential disruptions may have negative direct impacts on runoff not only in the magnitude of the flow but also in the duration of its occurrence as well as the quality of the flowing water. Naturally, these parameters are controlled by the volume and intensity of the precipitation, the infiltration into the subsoil, and evaporation and plant transpiration [11,12,13].
In this regard, to study the vertical connectivity between natural surface currents and aquifers, there exist several investigations, such as those on vertical aquifer recharge, for instance, Hernandez-Marin and collaborators [14] who in 2018 analyzed the spatial and temporal distribution of recharge of the semi-arid Valley of Aguascalientes, and the role played by the surface drainage network of rivers and streams, among other factors. On the other hand, to analyze the current problems of contamination in underground water resources, modeling the flow regime of the aquifer system is one of the most recurrent processes, since its results permit the evaluation of the dynamic behavior of water in different scenarios, especially at a regional scale. In this regard, Guzmán-Colis et al. [15] evaluated the spatio-temporal variation of concentrations of organic matter, nutrients, organic toxins and coliform organisms, and heavy metals in the San Pedro River, state of Aguascalientes; this was carried out by performing a geochemical characterization of a river section of approximately 90 km. This section of the river receives the hydraulic contribution of 24 tributary streams and close to 96% of the treated and raw wastewater generated by the various productive sectors. On the other hand, Hernández-Marín et al. [14] investigated the transit flow times through the vadose zone of the Aguascalientes Valley using the Richards equation. In that work, the estimated transit times of flow were presented as a map of isocurves of recharge time, analyzing lithological, geological, and geophysical information [16,17] Recently, other studies related to the exploration of vertical connectivity such as Pacheco-Guerrero et al. [18] coupled hydrological and hydraulic models in a 2D numerical model to estimate hydraulic losses due to infiltration in a river, which belongs to Walnut Guch Watershed in the states of Sonora Mexico and Arizona U.S.A.
Most of the previous studies focus on the analysis of surface variables of infiltration losses and characterization of surface water; therefore, it is important to understand the hydraulic response of the subsoil and its role in the process of transporting polluting fluids. Thus, the main objective of this work is to contribute to the understanding of the hydraulic relationship between surface water and aquifer interaction through the vadose zone on the Aguascalientes Valley since groundwater is the main source of supplying water in the valley. The main tools of this study are applying hydraulic modeling and vertical electrical soundings on the banks of a natural river.

2. Materials and Methods

2.1. Characteristics of the Study Area (Aguascalientes; Mexico)

The study area is located in a suburban region adjacent to a tributary of the San Pedro River, within the Lerma-Santiago hydrological region, which covers several states in western Mexico. The river originates in the Sierra de San Pedro, Zacatecas State, and primarily flows from north to south through the State of Aguascalientes [15]. It serves as a seasonal natural watercourse within the heart of the Aguascalientes Valley. For our research, we chose a 14 km stretch of the river, which partially irrigates approximately 50 communities and six municipalities, including the city of Aguascalientes (see Figure 1). This section plays a vital role, benefiting up to 80% of the state’s population and serving as a critical resource for various industries, including textiles, clothing, food processing, automotive, and electronics [19]. The substantial extraction of groundwater from the Aguascalientes Valley aquifer, which underlies the San Pedro River, has resulted in fissures associated with subsidence [20,21,22,23,24], elevating the risk of groundwater contamination through direct infiltration of surface water through these ground discontinuities. Furthermore, various studies [25,26] have indicated the absence of a base flow in the river, with approximately 96% of the city’s wastewater discharged into it. As a result, the river is contaminated with pollutants such as organic matter, total phosphorus (Pt), total nitrogen (Nt), detergents (SAAM), and heavy metals (Al, Cd, Cr, Fe, Hg, Pb, and Zn). It also exhibits high toxicity in approximately 60% of the water samples.

2.2. Methodology

The activities conducted to fulfill the scope of this research were categorized into four main stages, each comprising various methods and techniques, as described below.
1. Geospatial stage: We selected the analyzed stretch of the river and its hydrologically influenced area due to the presence of disturbances associated with the aforementioned human activities. During this stage, we employed geospatial analysis conducted within the QGIS software, v 3.32.1 utilizing digital elevation models and their vector-geoprocessing tools. The primary features identified in this stage encompass the drainage area, the slope of the main river, vegetation cover, land use, and the locations of climatological and hydrometric stations, among others.
2. Hydraulic stage: The adjustment of hydrometric data was conducted using the methodology of Hydrological Alteration Indicators (IHAs), as described by The Nature Conservancy [27,28]. This methodology proved particularly valuable in obtaining daily flows, enabling us to estimate the base flows occurring in seasonal streams like the San Pedro River [29]. It is worth noting that, while this river is classified as seasonal under natural conditions, it maintains a perennial flow due to wastewater discharge, as previously mentioned. To determine the baseflow, we utilized the database from the Niagara Dam hydrometric station, situated downstream of the study area. We processed the topography of the study area, and with the hydraulic measurements obtained, we delineated a section of the analyzed river to conduct a one-dimensional model of the average monthly flow. This allowed us to identify the hypothesized hydraulic stagnation areas (HSAs)—surface areas with a higher likelihood of hydraulic vertical connectivity with the aquifer. To accomplish this, we used the HEC-RAS v.5.0.7 program in conjunction with the RiverGIS plugin in QGIS v 3.32.1, employing 2D modeling. The result is presented in Figure 2.
3. Geophysical stage: This stage involved conducting vertical electrical soundings within the hydraulic stagnation areas (HSAs) to establish a stratigraphy, supported by lithological records obtained from nearby pumping wells, from the static water level extraction database of the Veolia operating entity in Aguascalientes, supplemented with records from wells directly owned by the National Water Commission (CNA) [30] in Mexico. To achieve this, the Schlumberger arrangement was employed, offering the advantage of greater electrode spacing, as illustrated in Figure 3. Terrain resistivity models in 1D were generated from the field data through direct modeling using the IPI2WIN v. 3.0.1. software [31,32].
Following the identification of the primary hydraulic stagnation area (HSA) in the hydraulic stage, various vertical electrical soundings (VESs) were conducted in this area to examine potential vertical subsurface flow patterns. The Schlumberger arrangement was employed with AB/2 spacing of 2, 4, 10, 20, 30, 50, 70, 100, 150, 200, and 300 m. This specific arrangement was necessary to reach a depth of at least 100 m, where the water table is typically located, as mentioned earlier. All VES field data were modeled with the minimum number of strata until the error did not exceed 10%.
4. Hydrogeochemical stage: Soil samples were collected from points adjacent to the hydraulic stagnation area (HSA), and the general soil type was determined using the sieve technique. These samples were then incorporated into a device, as depicted in Figure 4, to conduct toxicity tests. These tests were carried out using the test species Lecane papuana (Rotifera: Monogononta) [33]. The toxicity tests on water samples aimed to assess the concentration and exposure time of chemical substances that have adverse effects on aquatic organisms, providing valuable data for risk assessment. Approximately nine water samples were obtained from the San Pedro River within the HSA, with each sample containing roughly 10 L of water. These samples were introduced into the device to evaluate the local soil’s capacity to retain or transmit toxicity from the water. This evaluation involved estimating the difference in water toxicity before and after passing through the device filled with soil. While these tests may not offer conclusive evidence regarding the soil’s ability to retain toxicity, they do provide insights into the pollution process from the San Pedro River to the aquifer.

3. Results

The results of the four stages developed in this work are mentioned below.

3.1. Geospatial Stage

This stage involved the analysis of data from the basin and sub-basin of the study area, along with data concerning the flow of the San Pedro River. The sub-basin that encompasses the study area is referred to as the San Pedro River sub-basin and covers an approximate area of 198 km2. Base daily flows were determined for both dry and rainy seasons by processing more than 50 years of flow records from the “El Niagara” dam hydrometric station. This analysis yielded daily flow rates ranging from 156.8 m3/s to 364.4 m3/s, with an average annual flow of 232.7 m3/s.

3.2. Hydraulic Stage

During this stage, the hydraulic stagnation area (HSA) and the sediment accumulation associated with the flood season were identified. A numerical model was developed for all the months within the hydrological year (January–December). Additionally, the locations of discontinuities such as faults and cracks intersecting the river’s flow in areas close to the HSA were recognized. It is in these intersections that hydraulic connectivity between the surface and the aquifer is more likely, as the zone affected by an active discontinuity appears to be more permeable compared to unaffected areas [34,35,36]. Figure 5 illustrates these intersections, with at least one discontinuity intersecting the river close to the HSA, identified as 1 and 2, particularly in the case of 2.
To complement the cartographic analysis and identify potential areas for contamination through the flow network, groundwater level data from local wells were processed. This information was used to generate equipotential curves using the inverse distance weighting (IDW) method, as shown in Figure 6. This analysis revealed the presence of various drawdown cones within the valley. Based on this assessment, it was observed that groundwater flow exhibited a preferential direction toward natural underground discharge zones. In this context, these discharge zones include rivers and streams with static levels ranging between 90 and 110 m in depth.

3.3. Geophysical Stage

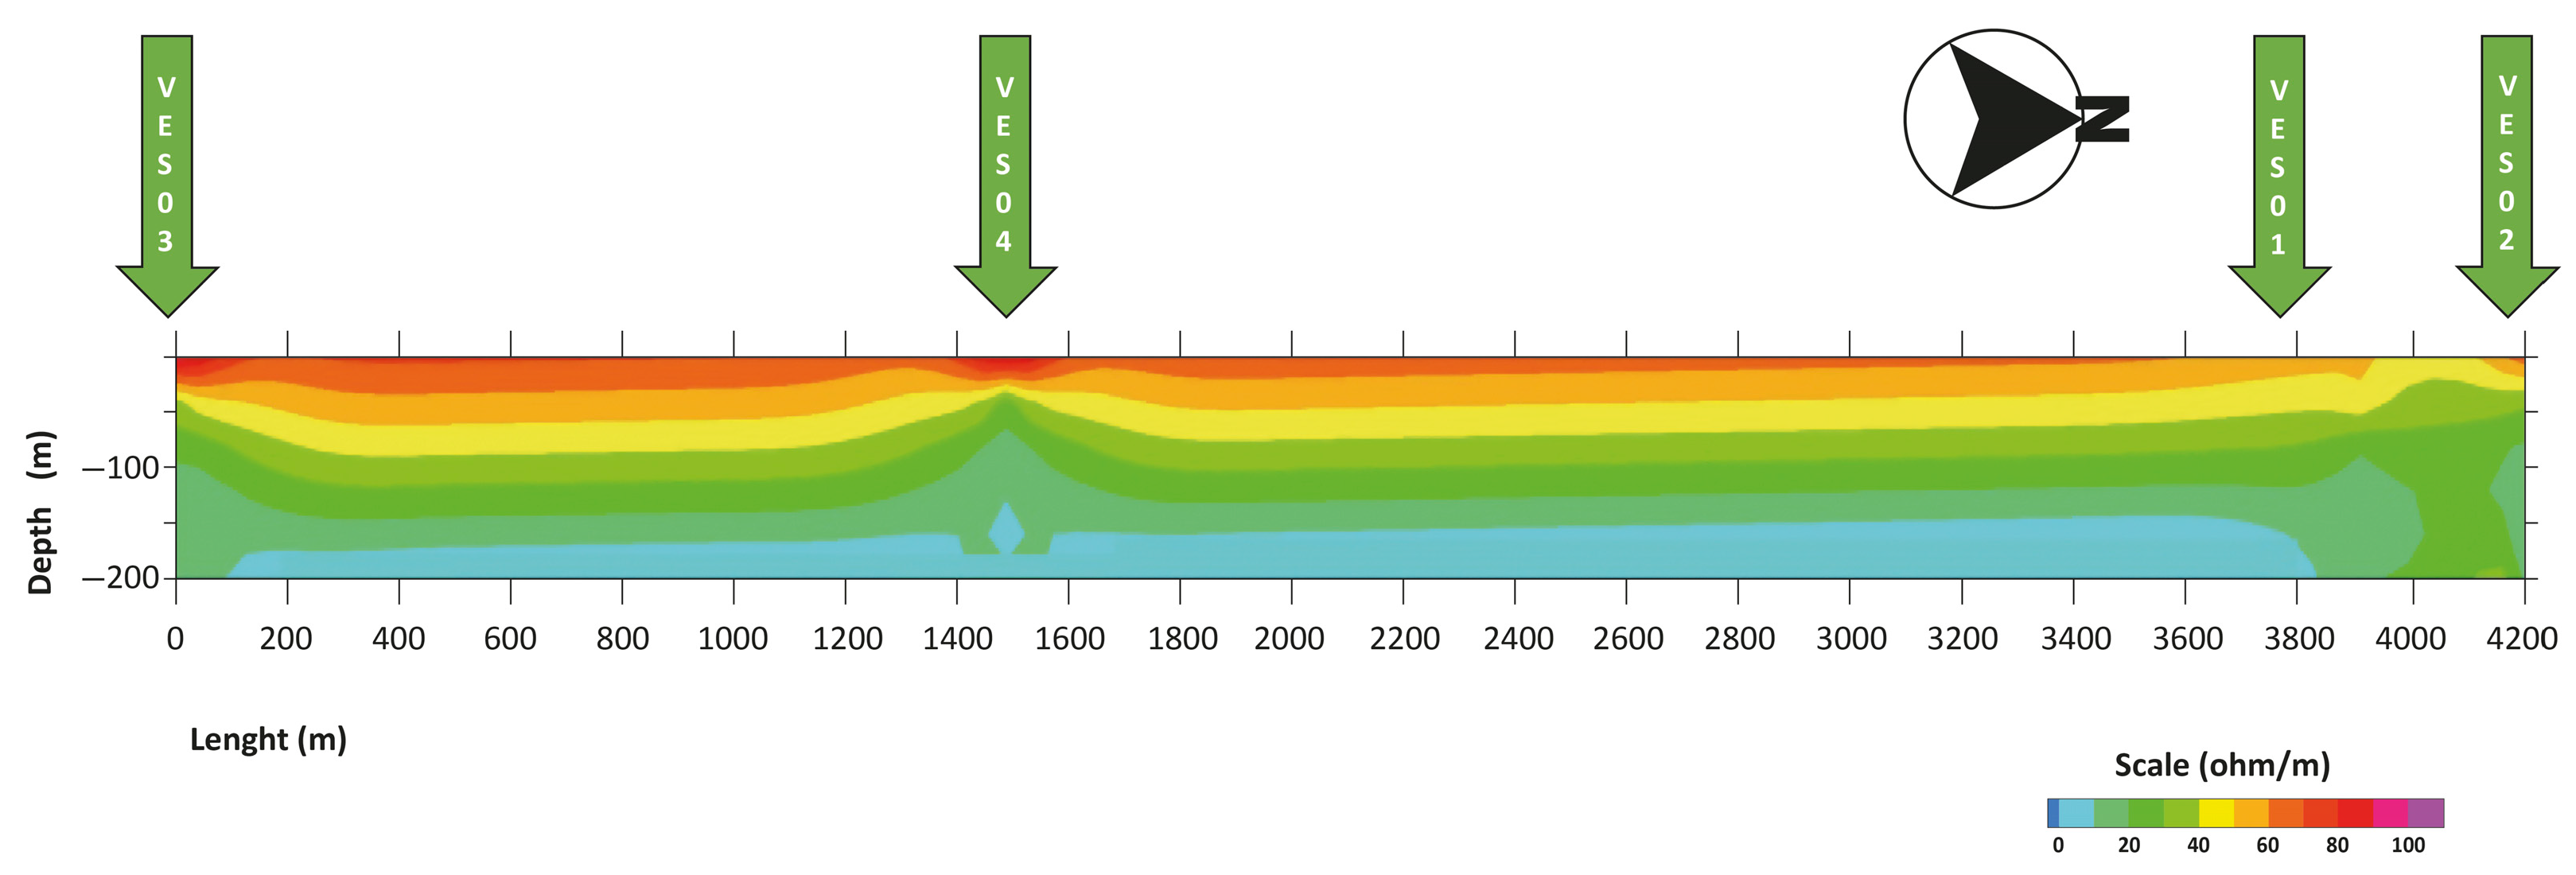
Following the identification of the primary hydraulic stagnation area (HSA) in the hydraulic stage, a series of vertical electrical soundings (VESs) were conducted to pinpoint zones with low resistivity at depth. These zones were then correlated with areas with a potentially high water content, ultimately associating them with a possible hydraulic connection between the San Pedro River and the aquifer. To achieve this, VESs were performed for each HSA using the Schlumberger arrangement with the following AB/2 spacings: 2, 4, 10, 20, 30, 50, 70, 100, 150, 200, and 300 m. This specific arrangement was essential to reach a depth of at least 100 m, where the water table had been observed in nearby pumping wells. The locations of the VESs are depicted in Figure 6 and Figure 7, while the results of their analysis can be seen in Figure 8 and Figure 9.
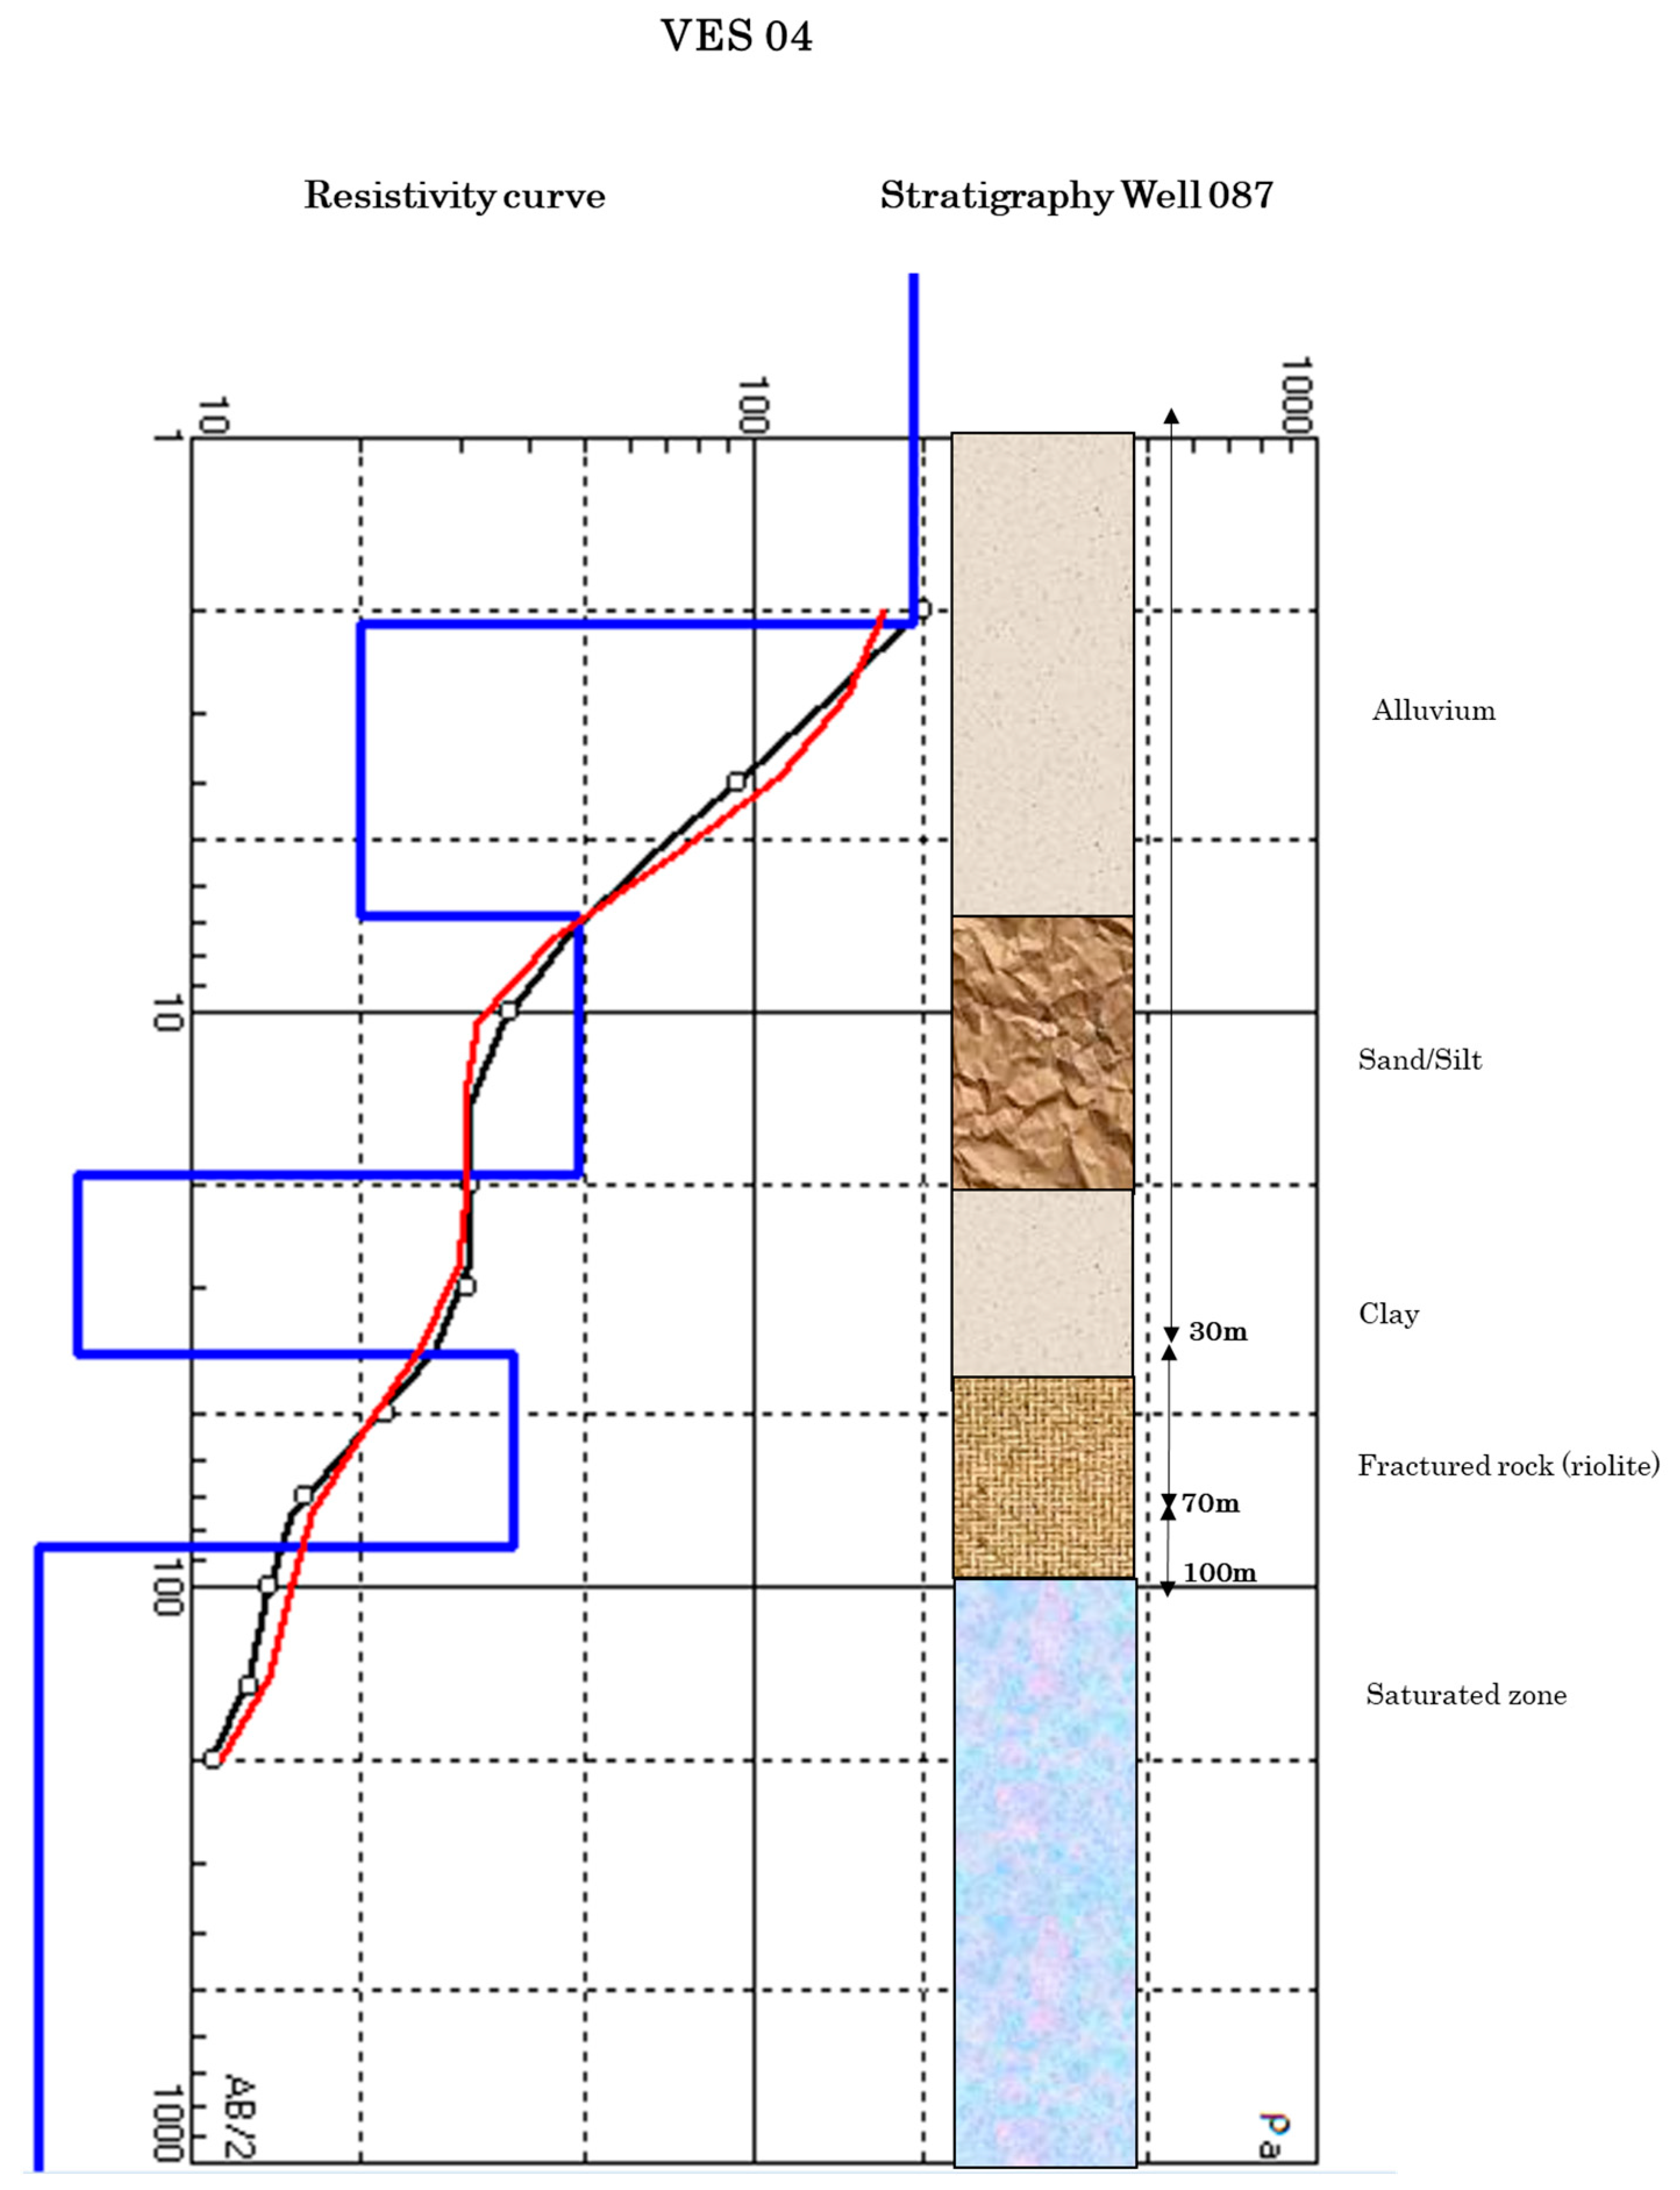
The graphs of Figure 8 show a tendency to reduce the resistivity values with depth; in fact, in all cases, the layer with the lowest resistivity appears between 50 and 72 m. If these results are compared with the water table depth reported in the neighboring wells and considering the difference in surface elevation between those wells and the VES zones, which is less than 25 m, then the observed results suggest that the hydrostratigraphic layer with low resistivity may represent the hydraulic contact between the HSA with the saturated zone. Based on the information provided by Lowrie and Fitchner [37], the hydrostratigraphy below the position of VES 03 and 04 is made up as follows: alluvium on the uppermost sequence from 0 to 30m, an alternation for sands and clays from 30 to 70 m, and then a very low resistivity strata that may indicate saturated medium. This hydrostratigraphy is consistent with those found in lithologic records of wells such as those shown in Figure 10, in which, as depicted, sediments with a relatively high proportion of fine particles are found close to the 30 m depth. Then, a layer of fractured rock is reported from 30 to 70 m and the water table was observed close to the 100 m depth.

3.4. Hydrogeochemical Stage

The results in this stage are mainly based on the outcomes from the experimental device filled with local near-surface soil from the HSA, which after primary tests with sieves, it was determined that the type of soil collected corresponds to sandy silt. The differences in toxicity obtained from water before and after passing through the soil device were very significant, since the level of toxicity decreased after the process, as shown in Table 1.

4. Discussion

The methodology and results presented in this study provide valuable insights into the potential hazards posed by anthropic activities to natural resources, both in terms of surface and subsurface water quality and connectivity. Furthermore, as demonstrated in this research, the hydraulic modeling tool used to identify hydraulic stagnation areas (HSAs) in intermittent rivers proves advantageous in assessing the connection between flood zones and the process of potential vertical hydraulic connectivity with the local aquifer.

Vertical Connectivity Zones Located between Vertical Electrical Soundings Data and Hydraulic Modeling

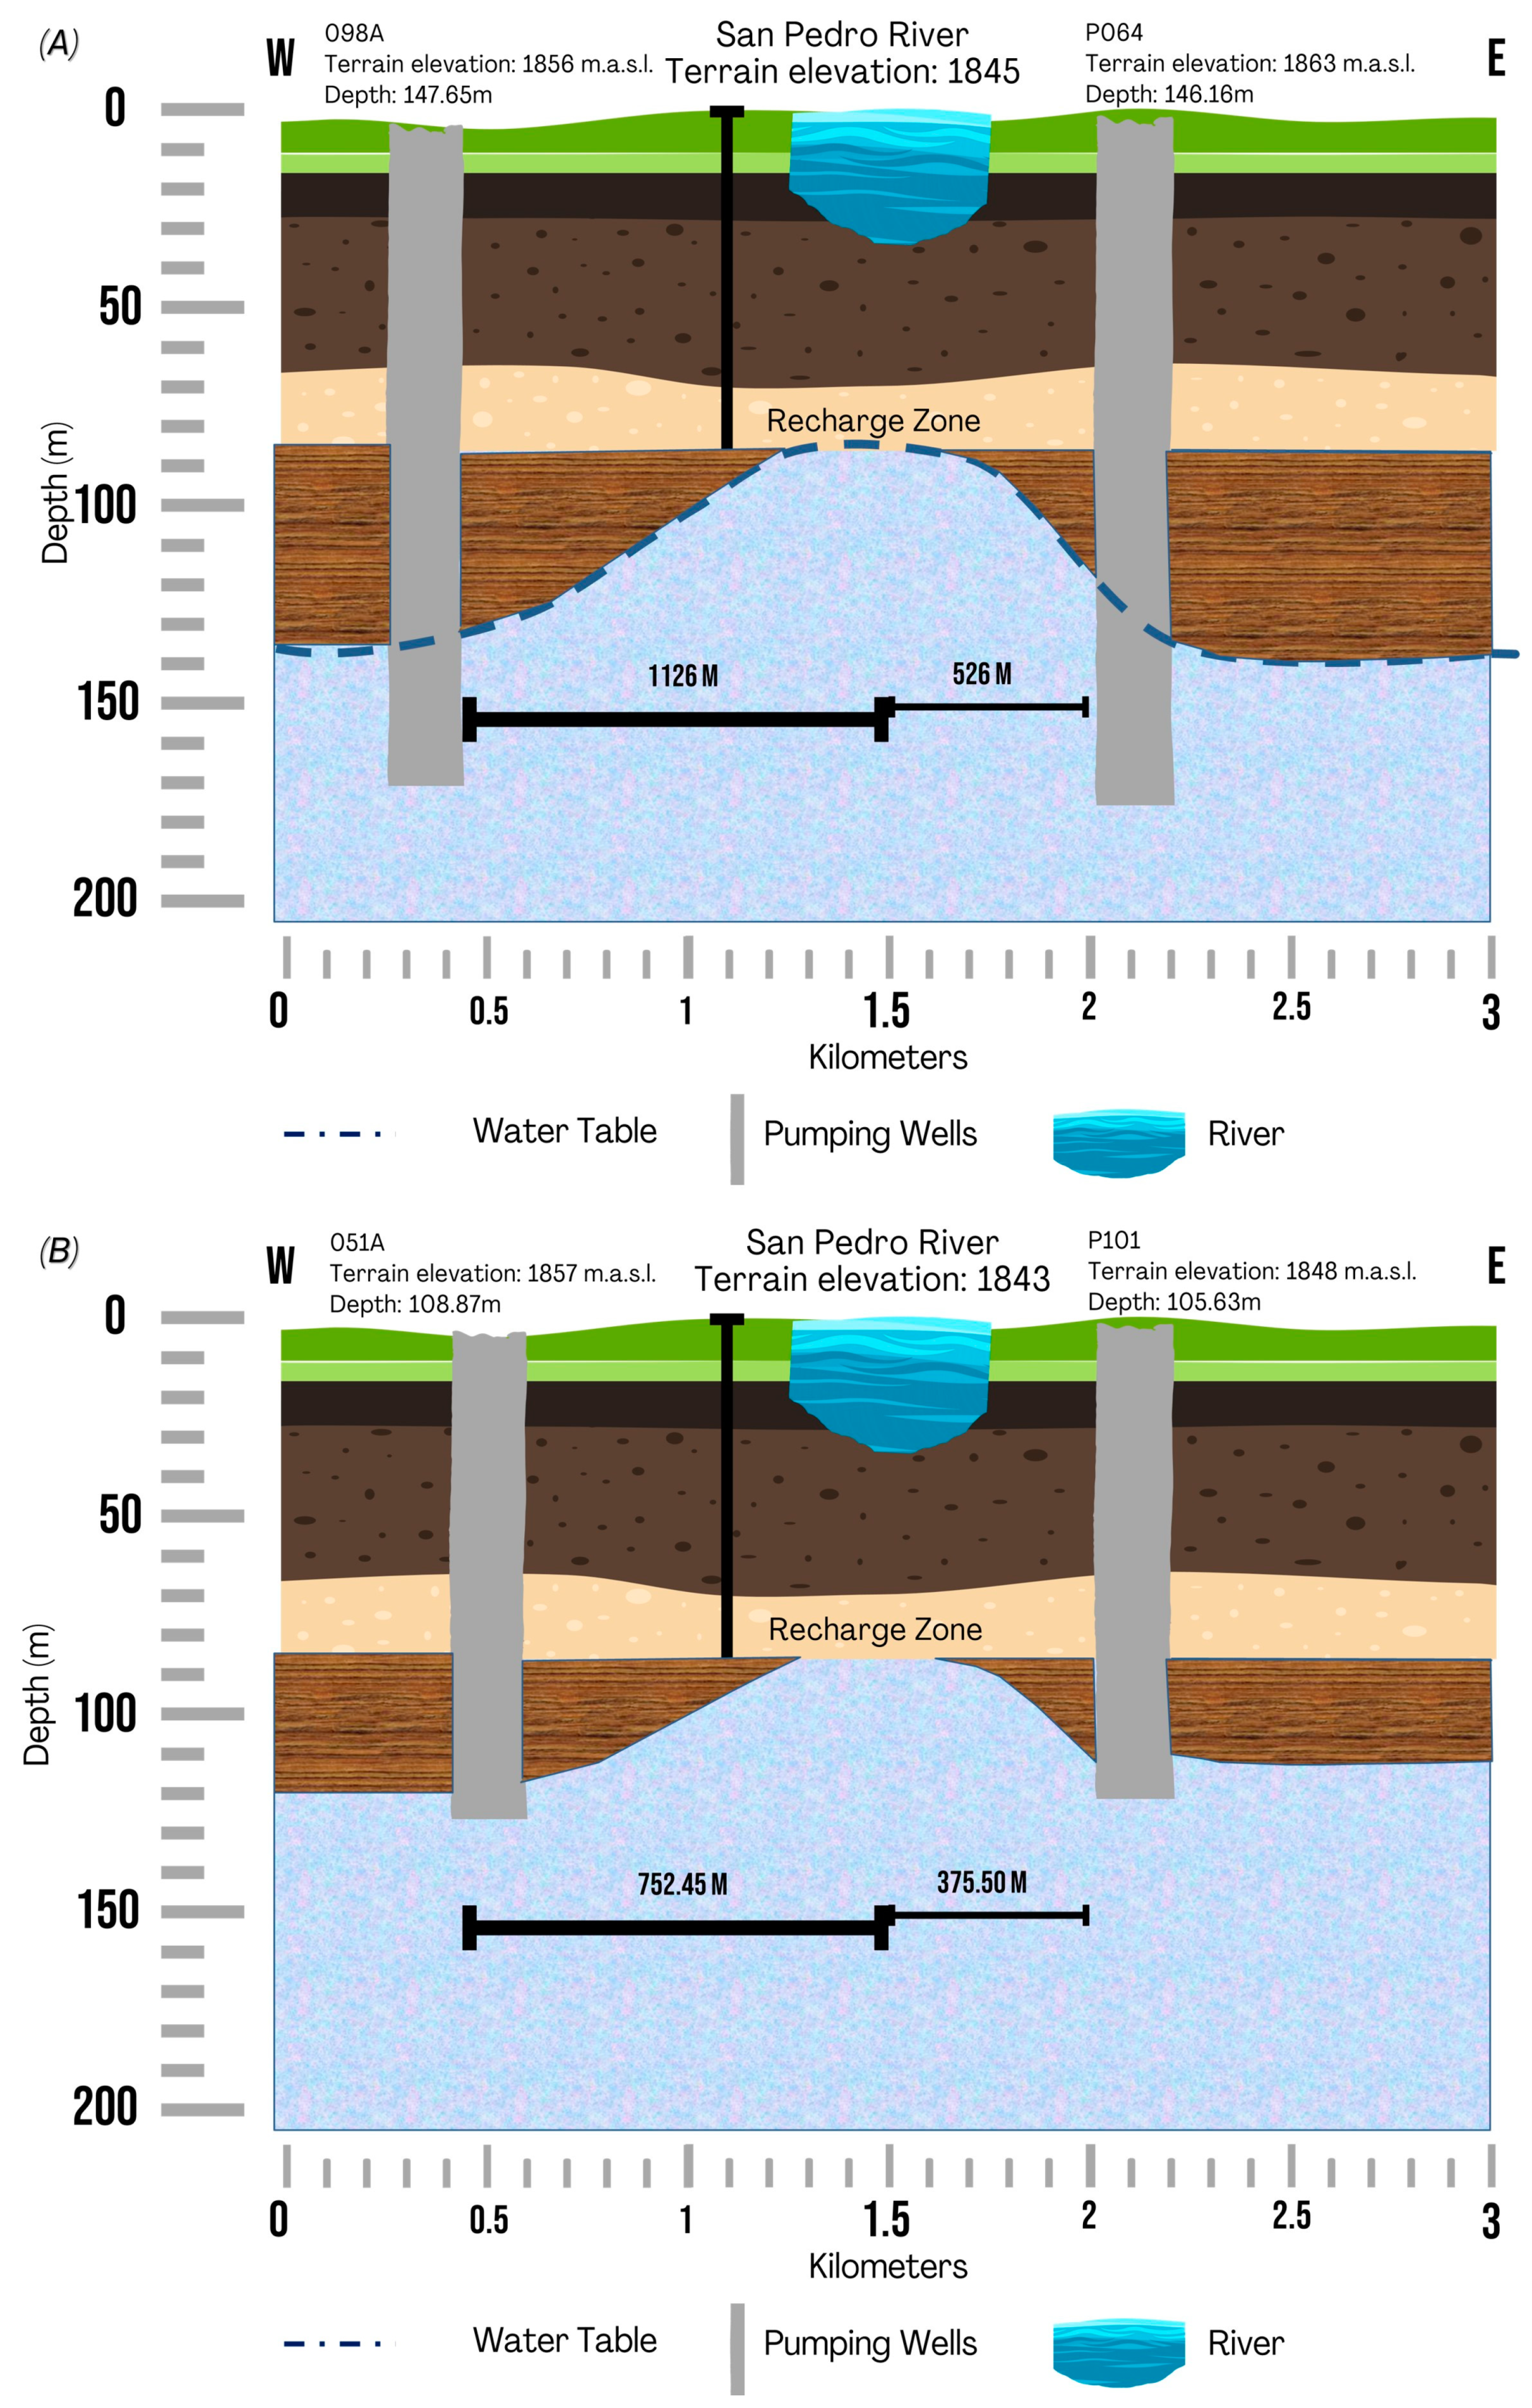
The results from the geophysical stage strongly suggest the existence of vertical hydraulic connectivity in the San Pedro River area between its HSA and the aquifer. These findings align with previous investigations [18], which indicated hydraulic losses through infiltration, where the volume of infiltration depended on the physical conditions of the soil. In that study, a similar technique was employed to demonstrate hydraulic connectivity between the surface stream and the aquifer, particularly at depths of 70 to 90 m. With the information obtained, a correlation was established between areas of low resistivity and the static water levels recorded in nearby wells. This suggests that the natural drainage network can serve as a source for aquifer recharge, and vertical connectivity between surface water and the local aquifer likely occurs in the study area. Table 2 outlines the main characteristics of the consulted pumping wells used in the creation of Figure 10, while Figure 11 provides a schematic representation of the hydraulic connectivity process discussed in this work.
Table 2 shows the UTM Zone 13N coordinates of the wells that are no closer than one kilometer, in addition to showing the difference in levels in meters above sea level of the river axis with respect to the elevation of the well curb. Figure 10 shows that most of the riverbed section presents a static level close to a 100 m depth, except in the southeast part, probably due to the lack in wells and records of the nearby wells.
It is worth noting that the equipotential curves suggest the presence of a water table in close proximity to the areas of low resistivity identified in the geophysical tests, at least within the study area. Therefore, it is essential to conduct further water quality tests in the pumping wells near the natural channels to assess vertical connectivity in other regions of the Aguascalientes Valley.

5. Conclusions

The results of this research are relevant both locally and globally; the first is due to the information generated about the potential risk by contamination of groundwater, which is the main source of supply for the city of Aguascalientes (1.2 million inhabitants), while for the second, the case study has methodological value that is worth publishing due to the application of different tools, such as geophysics, water toxicology, and underground and surface hydrology whose results are integrated in interpretation that provides resolutions for a complex problem. On the other hand, this research indeed uses techniques that could be considered routine to obtain data, but both their design, and knowing where and when and how to apply them is what makes this work go beyond the scope of a simple technical report.
Moreover, vertical hydraulic connectivity between intermittent rivers and aquifer systems is plausible at subsurface levels, as evidenced by geophysical tests conducted in the study area. These tests revealed the presence of low-resistivity strata at a depth of approximately 70 m. When compared to the observed water level depths in nearby pumping wells, this suggests the potential for hydraulic contact between the surface and the aquifer. This hydraulic connectivity was established in all four hydraulic stagnation areas (HSAs) identified through numerical modeling.
These HSAs contain soil with a high concentration of fine particles, especially silt, within the first few meters of depth. This characteristic has been confirmed through lithological records from pumping wells and with the VES method, which identified strata with low electrical resistivity associated with alternating layers of saturated soil, including sands, silts, and, to a lesser extent, clays.

Author Contributions

I.G.R.-C., writing—original draft; M.H.-M., formal analysis and editing; A.P.-G., conceptualization and methodology; J.P.-M., R.R.-M., M.A.A.-C., H.L.-V. and R.P.-C., review and editing. All authors have read and agreed to the published version of the manuscript.

Funding

This research received no external funding.

Data Availability Statement

Data are available upon request from the authors.

Acknowledgments

The results of this publication are the product of the doctoral thesis of the first author, who thanks CONACyT for the financial support during the postgraduate course.

Conflicts of Interest

The authors declare no conflicts of interest.

References

  1. Mussabek, D.; Söderman, A.; Imura, T.; Persson, K.M.; Nakagawa, K.; Ahrens, L.; Berndtsson, R. PFAS in the Drinking Water Source: Analysis of the Contamination Levels, Origin and Emission Rates. Water 2023, 15, 137. [Google Scholar] [CrossRef]
  2. Kikuda, R.; Pereira Gomes, R.; Rodrigues Gama, A.; De Paula Silva, J.A.; Pereira Dos Santos, A.; Rodrigues Alves, K.; Nascimento Arruda, P.; Scalize, P.S.; Gonçalves Vieira, J.D.; Carneiro, L.C.; et al. Evaluation of Water Quality of Buritis Lake. Water 2022, 14, 1414. [Google Scholar] [CrossRef]
  3. Salinas-Rodríguez, S.A.; van de Giesen, N.C.; McClain, M.E. Inter-Annual and Seasonal Variability of Flows: Delivering Climate-Smart Environmental Flow Reference Values. Water 2022, 14, 1489. [Google Scholar] [CrossRef]
  4. Rodrigues, S.; Xavier, B.; Nogueira, S.; Antunes, S.C. Intermittent Rivers as a Challenge for Freshwater Ecosystems Quality Evaluation: A Study Case in the Ribeira de Silveirinhos, Portugal. Water 2023, 15, 17. [Google Scholar] [CrossRef]
  5. Zhang, Q.; Cui, Y.; Chen, Y.D. Ecological Flow Evaluation Based on Hydrological Alterations in the Dongjiang River Basin. J. Nat. Resour. 2012, 27, 790–800. [Google Scholar]
  6. Datry, T.; Larned, S.T.; Tockner, K. Intermittent Rivers: A Challenge for Freshwater Ecology. BioScience 2014, 64, 229–235. [Google Scholar] [CrossRef]
  7. Leigh, C.; Boulton, A.J.; Courtwright, J.L.; Fritz, K.; May, C.L.; Walker, R.H.; Datry, T. Ecological Research and Management of Intermittent Rivers: An Historical Review and Future Directions. Freshw. Biol. 2016, 61, 1181–1199. [Google Scholar] [CrossRef]
  8. Gómez-Balandra, M.A.; del, P. Saldaña-Fabela, M.; Llerandi-Juárez, R.D. Environmental Approaches during Planning and Construction Stages of Hydropower Projects in Mexico. J. Environ. Prot. 2015, 6, 1186. [Google Scholar] [CrossRef]
  9. Połeć, K.; Grzywna, A.; Tarkowska-Kukuryk, M.; Bronowicka-Mielniczuk, U. Changes in the Ecological Status of Rivers Caused by the Functioning of Natural Barriers. Water 2022, 14, 1522. [Google Scholar] [CrossRef]
  10. Shin, J.; Hwang, S.; Jung, S.H.; Han, W.S.; Son, J.-S.; Nam, M.J.; Kim, T. Development of Site-Scale Conceptual Model Using Integrated Borehole Methods: Systematic Approach for Hydraulic and Geometric Evaluation. Water 2022, 14, 1336. [Google Scholar] [CrossRef]
  11. Delso, J.; Magdaleno, F.; Fernández-Yuste, J.A. Flow Patterns in Temporary Rivers: A Methodological Approach Applied to Southern Iberia. Hydrol. Sci. J. 2017, 62, 1551–1563. [Google Scholar] [CrossRef]
  12. Ma, C.; Qiu, D.; Mu, X.; Gao, P. Morphological Evolution Characteristics of River Cross-Sections in the Lower Weihe River and Their Response to Streamflow and Sediment Changes. Water 2022, 14, 3419. [Google Scholar] [CrossRef]
  13. Conallin, J.; Wilson, E.; Campbell, J. Implementation of Environmental Flows for Intermittent River Systems: Adaptive Management and Stakeholder Participation Facilitate Implementation. Environ. Manag. 2017, 1–9. [Google Scholar] [CrossRef] [PubMed]
  14. Hernández-Marín, M.; Guerrero-Martínez, L.; Zermeño-Villalobos, A.; Rodríguez-González, L.; Burbey, T.J.; Pacheco-Martínez, J.; Martínez-Martínez, S.I.; González-Cervantes, N. Spatial and Temporal Variation of Natural Recharge in the Semi-Arid Valley of Aguascalientes, Mexico. Hydrogeol. J. 2018, 26, 2811–2826. [Google Scholar] [CrossRef]
  15. Guzmán-Colis, G.; Thalasso, F.; Ramírez-López, E.M.; Rodríguez-Narciso, S.; Guerrero-Barrera, A.L.; Avelar-González, F.J. Evaluación Espacio-Temporal de La Calidad Del Agua Del Río San Pedro En El Estado de Aguascalientes, México. Rev. Int. Contam. Ambient. 2011, 27, 89–102. [Google Scholar]
  16. Andrade, R.; Rangarajan, R. Transient Resistivity Response to Infiltrating Water Front through Vadose Zone. HydroResearch 2019, 2, 12–20. [Google Scholar] [CrossRef]
  17. Ikard, S.J.; Carroll, K.C.; Rucker, D.F.; Teeple, A.P.; Tsai, C.-H.; Payne, J.D.; Fuchs, E.H.; Jamil, A. Geoelectric Monitoring of the Electric Potential Field of the Lower Rio Grande before, during, and after Intermittent Streamflow, May–October, 2022. Water 2023, 15, 1652. [Google Scholar] [CrossRef]
  18. Pacheco-Guerrero, A.; Goodrich, D.C.; González-Trinidad, J.; Júnez-Ferreira, H.E.; Bautista-Capetillo, C.F. Flooding in Ephemeral Streams: Incorporating Transmission Losses. J. Maps 2017, 13, 350–357. [Google Scholar] [CrossRef]
  19. Hansen, A.M.; Lara, F.; Ortiz, G.; Trejo, P. Recarga Artificial de Acuíferos Con Agua Residual Tratada. In Inf. Bull.; Mexican Institute of Water Technology: Jiutepec, Mexico, 1997. [Google Scholar]
  20. Cigna, F.; Tapete, D. Satellite InSAR Survey of Structurally-Controlled Land Subsidence Due to Groundwater Exploitation in the Aguascalientes Valley, Mexico. Remote Sens. Environ. 2021, 254, 112254. [Google Scholar] [CrossRef]
  21. Song, H.; Zhang, J.; Zuo, J.; Liang, X.; Han, W.; Ge, J. Subsidence Detection for Urban Roads Using Mobile Laser Scanner Data. Remote Sens. 2022, 14, 2240. [Google Scholar] [CrossRef]
  22. Luna-Villavicencio, H.; Pacheco-Martínez, J.; Ochoa-González, G.H.; Hernández-Marín, M.; Hernández-Madrigal, V.M.; López-Doncel, R.A.; Reyes-Cedeño, I.G. Determination of Susceptibility to the Generation of Discontinuities Related to Land Subsidence Using the Frequency Ratio Method in the City of Aguascalientes, Mexico. Remote Sens. 2023, 15, 2597. [Google Scholar] [CrossRef]
  23. Lermo, J.; Nieto-Obregón, J.; Zermeño, M. Faults and Fractures in the Valley of Aguascalientes. Preliminary Microzonification. In Proceedings of the Eleventh World Conference on Earthquake Engineering, Acapulco, Mexico, 23–28 June 1996; pp. 23–28. [Google Scholar]
  24. Aranda-Gómez, J.J. Geología Preliminar Del Graben de Aguascalientes. In Revista del Instituto de Geología; Universidad Nacional Autónoma de México: Mexico City, Mexico, 1989; Volume 8, pp. 22–32. [Google Scholar]
  25. Avelar González, F.J.A.; Ramírez López, E.M.R.; Martínez Saldaña, M.C.M.; Guerrero Barrera, A.L.G.; Juárez, F.J.; Reyes Sánchez, J.L.R. Water Quality in the State of Aguascalientes and Its Effects on the Population’s Health. In Water Resources in Mexico: Scarcity, Degradation, Stress, Conflicts, Management, and Policy; Hexagon Series on Human and Environmental Security and Peace; Springer: Berlin/Heidelberg, Germany, 2011; pp. 217–229. [Google Scholar] [CrossRef]
  26. Ramirez Castillo, F.Y.; Avelar González, F.J.; Garneau, P.; Marquez Diaz, F.; Guerrero Barrera, A.L.; Harel, J. Presence of Multi-Drug Resistant Pathogenic Escherichia Coli in the San Pedro River Located in the State of Aguascalientes, Mexico. Front. Microbiol. 2013, 4. [Google Scholar] [CrossRef] [PubMed]
  27. Richter, B.D.; Mathews, R.; Harrison, D.L.; Wigington, R. Ecologically Sustainable Water Management: Managing River Flows for Ecological Integrity. Ecol. Appl. 2003, 13, 206–224. [Google Scholar] [CrossRef]
  28. Bautista-de-los-Santos, Q.M. Determinación de caudales ambientales en la cuenca del río Yuna, República Dominicana. Tecnol. Cienc. Agua 2014, 5, 33–40. [Google Scholar]
  29. Reyes-Cedeño, I.G.; Hernández-Marín, M.; Pacheco-Guerrero, A.I.; Gannon, J.P. Comprehensive Methodology and Analysis to Determine the Environmental Flow Regime in the Temporary Stream “La Yerbabuena” in Aguascalientes, Mexico. Water 2023, 15, 879. [Google Scholar] [CrossRef]
  30. CNA. Map of Piezometric Wells 2021. 2021. Available online: https://sigagis.conagua.gob.mx/rp20/ (accessed on 13 December 2023).
  31. Ghosh, D.P. The Application of Linear Filter Theory to the Direct Interpretation of Geoelectrical Resistivity Sounding Measurements*. Geophys. Prospect. 1971, 19, 192–217. [Google Scholar] [CrossRef]
  32. Kirsch, R. Groundwater Geophysics: A Tool for Hydrogeology; Springer Science & Business Media: Berlin/Heidelberg, Germany, 2006. [Google Scholar]
  33. Tovar-Aguilar, G.I.; Arzate-Cardenas, M.A.; Rico-Martínez, R. Effects of Diclofenac on the Freshwater Rotifer Lecane papuana (Murray, 1913) (Monogononta: Lecanidae). Hidrobiológica 2019, 29, 63–72. [Google Scholar] [CrossRef]
  34. Mathews, R.; Richter, B.D. Application of the Indicators of Hydrologic Alteration Software in Environmental Flow Setting. JAWRA J. Am. Water Resour. Assoc. 2007, 43, 1400–1413. [Google Scholar] [CrossRef]
  35. Li, D.; Wan, W.; Zhao, J. Optimizing Environmental Flow Operations Based on Explicit Quantification of IHA Parameters. J. Hydrol. 2018, 563, 510–522. [Google Scholar] [CrossRef]
  36. Yang, P.; Yin, X.-A.; Yang, Z.-F.; Tang, J. A Revised Range of Variability Approach Considering the Periodicity of Hydrological Indicators. Hydrol. Process. 2014, 28, 6222–6235. [Google Scholar] [CrossRef]
  37. Lowrie, W.; Fichtner, A. Fundamentals of Geophysics; Cambridge University Press: Cambridge, UK, 2020. [Google Scholar]
Figure 1. Description of study area inside the state of Aguascalientes, in central Mexico. (A) It is the general map of Mexico, (B) is the map of the state of Aguascalientes, located in the center of the country, where, in addition to showing urban areas, elevations are indicated, and there is zoning of the most relevant urban localities. (C) is the city of Aguascalientes with its natural drainage network, highlighting the San Pedro River, (D) shows the delineation of the river characterized in the methodology.
Water 16 00222 g001
Figure 2. Description of the study area and the San Pedro River in Aguascalientes city. The river branch colored in green in the figure corresponds to the approximately 14 km long portion analyzed in HEC-RAS, which includes cutlines, stream centerlines, and upstream and downstream points.
Water 16 00222 g002
Figure 3. Descriptive scheme of the VES methodology such as that applied in this study. The arrangement of the VES consists of four electrodes arranged in an A, M, N, B sequence, in which readings of resistivity are taken by moving the A and B electrodes to a certain distance that changes according to the desired depth to be explored, while M and N remain fixed.
Water 16 00222 g003
Figure 4. Scheme of the experimental device for toxicity tests.
Water 16 00222 g004
Figure 5. Distribution of HSA in the river segment of the study. The surface discontinuities (faults and fissures) are also indicated.
Water 16 00222 g005
Figure 6. Map with isolines of water-level decline in the study area with varying contour intervals. The numbers adjacent to the lines indicate the depth of the groundwater levels in meters.
Water 16 00222 g006
Figure 7. VES processing. The blue line represents the different strata correlated with the resistivity curve (ohm/m) of adjustment that is observed in the red line. The interpretation of the graphs can be visualized in Figure 10.
Water 16 00222 g007aWater 16 00222 g007b
Figure 8. Vertical electrical profile along the San Pedro River, based on the resulting information of the four VESs.
Water 16 00222 g008
Figure 9. Correlation of VES results with the stratigraphy described in the nearest pumping well. Notice that the scale of depth in the lithologic column is also logarithmic.
Water 16 00222 g009
Figure 10. Location of pumping wells near the study area, as well as the location of vertical electrical soundings, for the association of isopiestic lines of static level with the depths of the VES. The lines A-A’ and B-B’ represent cross-sections shown in Figure 11, which is presented later. Extraction levels are in meters, represented with the same color as the isopiestic lines.
Water 16 00222 g010
Figure 11. Schematic profile of the process of hydraulic connectivity of the San Pedro River and the local aquifer. The water table configuration is idealized according to the resistivity results. (A) Schematic profile A-A’ from well 098A to 064. (B) Schematic profile B-B’ from well 051A to P101.
Water 16 00222 g011
Table 1. Determination of lethal concentration (LC) at different levels of probability (1, 10, and 50% of the total population) toward Lecane papuana (Rotifera: Monogononta).
HAS Influent (%)Effluent * (%)
1 (one)LC0120.43
(15.57–25.28)
>95
LC1030.49
(26.90–34.08)
>100
LC5044.01
(41.51–46.52)
>100
2 (two)LC0130.57
(23.74–37.39)
>95
LC1040.80
(35.69–45.92)
>100
LC5053.17
(50.14–56.19)
>100
3 (three)LC015.94
(1.95–9.93)
>95
LC1018.19
(13.34–23.04)
>100
LC5050.74
(33.65–67.82)
>100
Notes: Numbers between parenthesis represent the confidence interval (p ≤ 0.05). * Lethal median concentration (LC50) was not estimated in the effluent because the mortality of the test organisms was not significant in comparison to the controls (≤5%). Lethal concentrations were estimated with the aid of the package drc in R for Windows (v4.1.2).
Table 2. Characteristics of the pumping wells in proximity to the study area include their geographical location, distance to the center of the river, and the topographic difference between the wellhead and the riverbed at its nearest point.
Well IDX-Coordinates (m)Y-Coordinates (m)Distance to San Pedro River (m)Topographic Difference between Wellhead and River Bed (m)
P002777,406.5242,422,221.559747.3412
P046A777,550.7692,425,089.548742.8424
P051A775,819.3712,421,726.304752.4518
P054777,455.5992,424,441.877564.08121
P057777,465.1162,424,075.273722.0218
P064777,114.3782,425,269.177505.6817
P066777,128.3452,423,937.525761.8211
P066A776,054.8942,423,090.543366.276
P067777,277.2252,423,465.874959.2818
P070A775,622.9892,418,917.316512.167
P075777,136.9532,418,821.750993.3715
P076776,951.952,419,347.070154.998
P079776,449.6432,420,869.657401.018
P081776,287.2102,427,283.600420.624
P097A774,914.1912,423,233.058576.1525
P098775,439.3282,426,695.966653.6518
P098A775,658.9422,426,077.059814.0910
P101777,228.2102,420,943.063375.58
P102777,600.2642,423,000.040917.3416
P106A775,682.5492,419,836.920540.3521
P107775,547.2582,419,586.371672.825
P113777,175.5272,426,679.710722.423
P119A776,307.2782,427,673.988900.322
P155776,677.9572,420,381.110154.53
P184775,129.7012,418,642.189722.1223
Disclaimer/Publisher’s Note: The statements, opinions and data contained in all publications are solely those of the individual author(s) and contributor(s) and not of MDPI and/or the editor(s). MDPI and/or the editor(s) disclaim responsibility for any injury to people or property resulting from any ideas, methods, instructions or products referred to in the content.