Article

Phosphorus Sources and Transport Pathways in the North Chaohu Lake Catchment of China

1
School of Resources and Environmental Engineering, Anhui Water Conservancy Technical College, Hefei 230051, China
2
Department of Geology & Geophysics, Texas A&M University, College Station, TX 77843-3115, USA
3
School of Resources and Environmental Engineering, Hefei University of Technology, Hefei 230009, China
4
Post-Doctoral Research Station, University of Science & Technology of China, Hefei 230009, China
5
Geological Survey of Anhui Province (Anhui Institute of Geological Sciences), Hefei 230009, China
*
Author to whom correspondence should be addressed.
Water 2024, 16(2), 244; https://doi.org/10.3390/w16020244
Submission received: 20 November 2023 / Revised: 31 December 2023 / Accepted: 5 January 2024 / Published: 10 January 2024

Abstract

:
To understand the cause of the high content of phosphorus in the North Chaohu Lake Catchment of China, the distribution of the total phosphorus in groundwater and the dissolution of rock phosphorus near Chaohu Lake were investigated, and a few interesting findings have been revealed. Firstly, four main processes affecting the groundwater quality in North Chaohu Lake Catchment were identified with the results of factor analysis, including anthropogenic activities and the dissolution of carbonate rocks, phosphorus, and fluorine-bearing minerals. Secondly, the dissolution of rock phosphorus can be well described using the one-dimensional diffusion equation, with a semi-infinite boundary condition, and the Langmuir kinetic equation. A relatively low ambient temperature (less than 25 °C) was probably responsible for the small diffusion coefficient compared to that of the previous studies. Thirdly, the high-potential maximum dissolution of rock phosphorus (Cmax) indicated that the dissolution of rock phosphorus could pose a risk to the ambient water body, and Cmax was found to be independent of the total rock phosphorus content.

1. Introduction

Chaohu is one of the largest lakes in Central China with a surface area of about 760 km2. It is located in the urban area of Hefei, Anhui Province of China, with a catchment area of 13,486 km2. The eutrophication of Chaohu Lake has been a great public concern because of the widespread intensity and high frequency of cyanobacterial blooms in recent decades [1]. In 2018, the algae bloom area of the whole Chaohu Lake increased from 0.14% to 27.52% during May to October. Studies showed that the relatively high level of nitrogen (N) and phosphorus (P) in the lake, caused the frequent cyanobacterial outbreak, for which P is the main factor [2,3]. Due to the wide distribution of ancient phosphate-bearing metamorphic rocks and intensive mining activities near the lake, some researchers believed that the release of P from phosphorus rock may contribute to the high content of phosphorus underneath the Chaohu Lake Catchment [4]. It has been hypothesized that runoffs and groundwater from phosphate-bearing sequence and phosphorus mineral region would carry P to Chaohu Lake, and experiments have found that the recurrent rainfall and oxalic acid will increase the P release, which would probably aggravate the eutrophication of the lake [5,6]. However, there is still not enough concern about the release of P from rocks in the Chaohu Lake Catchment; thus, a study on the groundwater quality and the P release from phosphate-bearing rock has profound societal significance.
Previous studies have shown that the erosion of phosphate rock can increase the content of P in vegetation [7,8], indicating that the accumulated rock phosphorus in some places can enter the adjacent ecosystem and may become an environmental problem such as eutrophication. In recent years, much more P was found to be released from various rocks and then incorporated into other ions in many parts of the world due to increasing global agricultural and industrial activities [9]. Microorganisms, the fine roots of plants, the reduction in soil water/groundwater pH values, etc., can be factors that affect the P dissolution [10,11,12,13]. Once P enters groundwater, advection and diffusion are the primary processes affecting its fate and transport [14]. Therefore, understanding the release of P from phosphate rock is indispensable for assessing its environmental impact.
Along with the dissolution, advection, and diffusion processes, the adsorption/desorption process occurs simultaneously. Several kinetic models, including the first-order, the second-order, the parabolic diffusion, the Elovich, and the Langmuir kinetic equations, were compared for describing the dissolution of P from phosphate rock and its subsequent transport. Some investigators claimed that the Elovich kinetic equation best fitted the experimental findings [15,16].
In this study, groundwater, surface water, soil, and rock samples in North Chaohu Lake Catchment were collected for detecting the contents of some chemical components in the laboratory, seeking answers for three questions by analyzing the obtained data:
(a)
The main factors affecting the groundwater quality in the North Chaohu Lake Catchment were revealed using the factor analysis by employing the statistical software SPSS (version 19).
(b)
The P dissolution and diffusion were illustrated by analyzing the release of P from phosphate rock.
(c)
The risk to the ambient aquatic environment posed by the dissolution of P in this region was discussed by fitting the experimental data to the Langmuir kinetic equation.

2. Study Area

Chaohu Lake is in the middle of the Anhui Province of China and on the left bank of the middle and lower reaches of Yangtze River (Figure 1). The Chaohu Lake Catchment’s topography is characterized by many low-elevation hills, foothills, downlands, and plains. The terrain is high in the east and low in the west. The catchment’s climate is mild and moist, with distinctive four seasons and a long frost-free period. The mean annual temperature is 15~16 °C, and the mean annual precipitation is 1000~1158 mm. The study area is located in the north of the Chaohu Lake Catchment and is dominated by low-elevation hills and undulating plains. The catchment is rich in surface water and groundwater resources due to the thirty-three surface inflows into the Chaohu Lake and the widely distributed Holocene unconsolidated rock pore water and carbonate fracture-karst water of this region. The groundwater is replenished by precipitation and horizontal flux and discharged via evaporation and base flow to the rivers and the Chaohu Lake. The Holocene unconsolidated rock pore water is mainly distributed over the west and the middle parts of the study area, with an aquifer thickness of about 50 m, while the carbonate fracture-karst water is in the east, with a water depth of less than 15 m below ground surface.
The previous study showed that more than 500 out of 12,938 km2 area in the Chaohu Lake Catchment had scattered ancient phosphorus metamorphic rocks, including the Feidong County of Hefei City and the Juchao district of Chaohu City located in the north of the Chaohu Lake [6], and more than 0.41% of the phosphorus can be released from the rocks, depending on the weathering condition, human activities, etc. [17]. Therefore, the North Chaohu Lake Catchment was selected as the study area.

3. Methods and Results

3.1. Sampling and Experimental Procedure

Seventeen groundwater samples were collected from different locations in the north and west of the study area, with sampling depths varying from 1 to 10 m (see Figure 1) in the winter of 2009. The electrical conductivity (EC) was measured in situ (Orion 290 A), and the samples were stored in polypropylene containers that were rinsed three times. Then, each sample was separated into two subsamples, one of which was for the cations analysis, and the other was for the anion analysis. Cation analysis subsamples were acidified with HNO3, while the anion analysis ones were kept at a temperature of 4–6 °C, and sent to the Geochemical Laboratory at Hefei University of Technology (HUT) for analysis within 24 h.
The concentration of sulfate (SO42−), nitrate (NO3), nitrite (NO2), and potassium (K+) in the groundwater samples were measured using the ion chromatography method (LC -10A, Shimadzu). Inductively coupled plasma atomic emission spectrometry (ICPS-1000 III C, Shimadzu) was employed to determine the concentration of sodium (Na+), calcium (Ca2+), and magnesium (Mg2+). Chlorine (Cl) was measured using the titrimetric method. Dissolved total solid (TDS) was calculated by multiplying EC and a factor of 640 [18]. The total P in the groundwater samples was measured employing molybdate blue, an ascorbic acid method in a 10 mm cuvette at 700 nm (UVmini-1240, Shimadzu, Kyoto, Japan).
Twelve rock samples were also collected from locations near Pingding Hill located on the northeast side of the Chaohu Lake in the winter of 2009 (Figure 1), of which sample numbers 1–8 were from the low-P content region, while the sample numbers 9–12 were from the high-P content region. The samples were immediately sent to the Geochemical Laboratory at HUT for analysis and grounded to grain sizes of less than 0.15 mm.
The total P contents of rock samples were measured as follows: Firstly, 0.2 g of grounded rock was added to the bottom of a nickel crucible and was humidified with 95% ethanol. Secondly, 2.0 g of solid NaOH was added to the sample, and the mixture was placed inside a Muffle furnace set at 720 °C for 15 min. Thirdly, the furnace was cooled to room temperature, and then, a sulfuric acid solution with a volume water/sulfuric acid ratio of 1:1 was added into the sample until the precipitated materials were completely dissolved. Fourthly, the solution was diluted to a 50 mL volume by adding distilled water with a resulting pH value of 3.0. Fifthly, 25 mL of solution was taken out and mixed with 1 mL of ascorbic acid solution. Thirty seconds later, 2 mL of molybdate solution was added into the solution. The solution was ready for measurement after a minimum of 15 min. The sample’s absorbance was measured in a 30 mm cuvette at 700 nm (UVmini-1240, Shimadzu) using distilled water as a reference. The content of total P can be obtained from the calibration curve after deducting the reference solution’s absorbance.
Olsen phosphorus (Olsen P), which is also called available phosphorus, represents P that can be taken up by plants from soil and is commonly used as a soil fertility and soil quality indicator [19]. In this study, the Oslen P of phosphate rock was measured to see how much P could be taken up by plants from the rock. The cumulative content of Olsen P was measured as follows (see Figure 2). Firstly, 0.25 g of grounded rock was mixed with 50 mL of NaHCO3 solution (the concentration of which is 0.5 mol/L), keeping a solid–liquid ratio of 1:20. Secondly, the sample was added to a centrifuge tube and was oscillated continuously for 1 h in a 200 r/min 25 °C water bath oscillator. Thirdly, the centrifuge tube was placed in an incubator of 25 °C for 24 h and centrifuged for 15 min at a rate of 4500 r/min. Fourthly, the supernatant was taken out and filtered using a 0.45 μm membrane, and then, the Oslen P concentration, denoted as Ci, in the supernatant was measured using the molybdenum–antimony anti-spectrophotometric method (UVmini-1240, Shimadzu). Fifthly, 50 mL of NaOH solution (concentration of which is 0.5 mol/L) was added into the residual in the centrifuge tube, keeping the same solid–liquid ratio of 1:20. The above steps are repeated to measure the extracted Oslen P after incubation times of 24, 72, 144, 240, 360, 480, 648, 888, and 1224 h, respectively [20]. A sequential time index i from 1 to 9 was used to denote 24, 72, 144, 240, 360, 480, 648, 888, and 1224 h, respectively.
The cumulatively released amount of P at the i-th time step, denoted as Ci (mg/L), can be calculated using the following formula:
C 1 = C 1 e ,   C i = i = 2 9 C i e V i i = 2 9 C i 1 e ( V i V i 1 ) V i , i = 2 , 9 ,
where i is the sequential time index of measurements, V i is the volume of solution (L) in the centrifuge measured at the i-th time step, V i 1 is the volume of NaHCO3 solution added at the (i − 1)-th time step, and C i e and C i 1 e are the P concentrations (mg/L) in the supernatant measured at the i-th and (i − 1)-th time steps, respectively.

3.2. Analysis Method

Both qualitative and quantitative methods were utilized in this study to conduct the groundwater geochemical analysis, including the interpretation of maps and diagrams, factor analysis, the best-fitting exercises of the measured breakthrough curves (BTCs) to the one-dimensional (1D) diffusion equation, etc.
After being treated by the chemical reagents, the Oslen P might experience three processes: Firstly, Oslen P was dissolved from the rock grains via a chemical reaction with molybdate on the surface of the grains. Secondly, Oslen P was desorbed from the grain surface into the ambient solution (some desorbed P in the ambient solution may be simultaneously adsorbed on the grain surface again). Thirdly, the dissolved Oslen P moved away from the grain surface to the ambient solution via diffusion. A 1D diffusion equation was employed to study the diffusive process of P in groundwater. Similar approaches have been used by some researchers, including Spiteri et al. [21], who used the 1D diffusion equation with a reaction term to understand the fate of P in two contrasting aquifer systems. In this study, the measured BTCs were fitted by the 1D diffusion equation to identify the effective diffusion coefficient, and a geometric factor was used to describe the additive effect that was related to the grain size distribution and the surface/volume ratio of the grains.

3.2.1. Fit of the Cumulative Content of P versus 1D Diffusion Equation

The 1D diffusion equation was used to describe the transport process:
D x 2 C x 2 = C t ,
where Dx is the effective diffusion coefficient, C is the solute concentration, x is the distance perpendicular to the diffusion layer, and t is time. Assuming that the grain surface has a constant P concentration equal to the initial P concentration (C0), and the ambient solution is initially free of P, one can formulate the initial and boundary conditions associated with the above governing equation and are as follows:
C ( x , 0 ) = 0 ,   x 0 ,
C ( 0 , t ) = C 0 , t 0 ,
C ( , t ) = 0 , t 0 .
A semi-infinite boundary condition is used here (see Equation (5)), which is a standard approach for analyzing solute transport in a finite-length column in subsurface hydrology [22]. For a more specific discussion of the choice of boundary conditions, one can refer to Parker and van Genuchten [23] , You and Zhan [24], and references cited in those studies. The solution of the above boundary value problem (BVP) [22] is as follows:
C = C 0 e r f c ( x 2 D x t ) ,
where erfc () is the complementary error function. Equation (6) is a special case of the Ogata and Banks solution [25] with a zero advective velocity (i.e., no advective and mechanical dispersive transport processes). Since the concentration determined in the experiment is the average concentration of P in the centrifuge tube at time t, a geometric factor A was introduced to modify Equation (6):
C = A C 0 e r f c ( x 2 D x t ) .
The geometric factor A accounts for the variations in grain sizes and grain shapes of multiple grains in the sample that are too complex to be described specifically. The following Equation (8) was used to convert the unit of the measured P dissolved from the rock mass ( C 0 * ) from mg/kg into mg/L:
C 0 = ρ b C 0 * ,
where ρ b is the bulk density of the rock sample. Therefore, C0 in Equation (8) is replaced, and the concentration of the solute can be calculated as follows:
C = A ρ b C 0 * e r f c ( x 2 D x t ) .
Equation (9) is fitted with experimental BTCs to predict the values of A and Dx. The goodness of fit is judged with the Pearson correlation coefficient, denoted as rj, using the following formula:
r j = j = 1 9 ( C i , j C j ¯ ) ( C i , j C j ¯ ) n = 1 9 ( C i , j C j ¯ ) 2 n = 1 9 ( C i , j C j ¯ ) 2 , i = 1 , 2 9 ,   j = 1 , 2 1
where Ci,j and C i , j are the experimental and calculated concentrations of sample j at i-th experimental time step, respectively, C j ¯ and C j ¯ are the averaged experimental and calculated concentrations of sample j, 9 is the number of experimental time steps described in Section 3.1, and 12 is the number of samples used in the calculation.

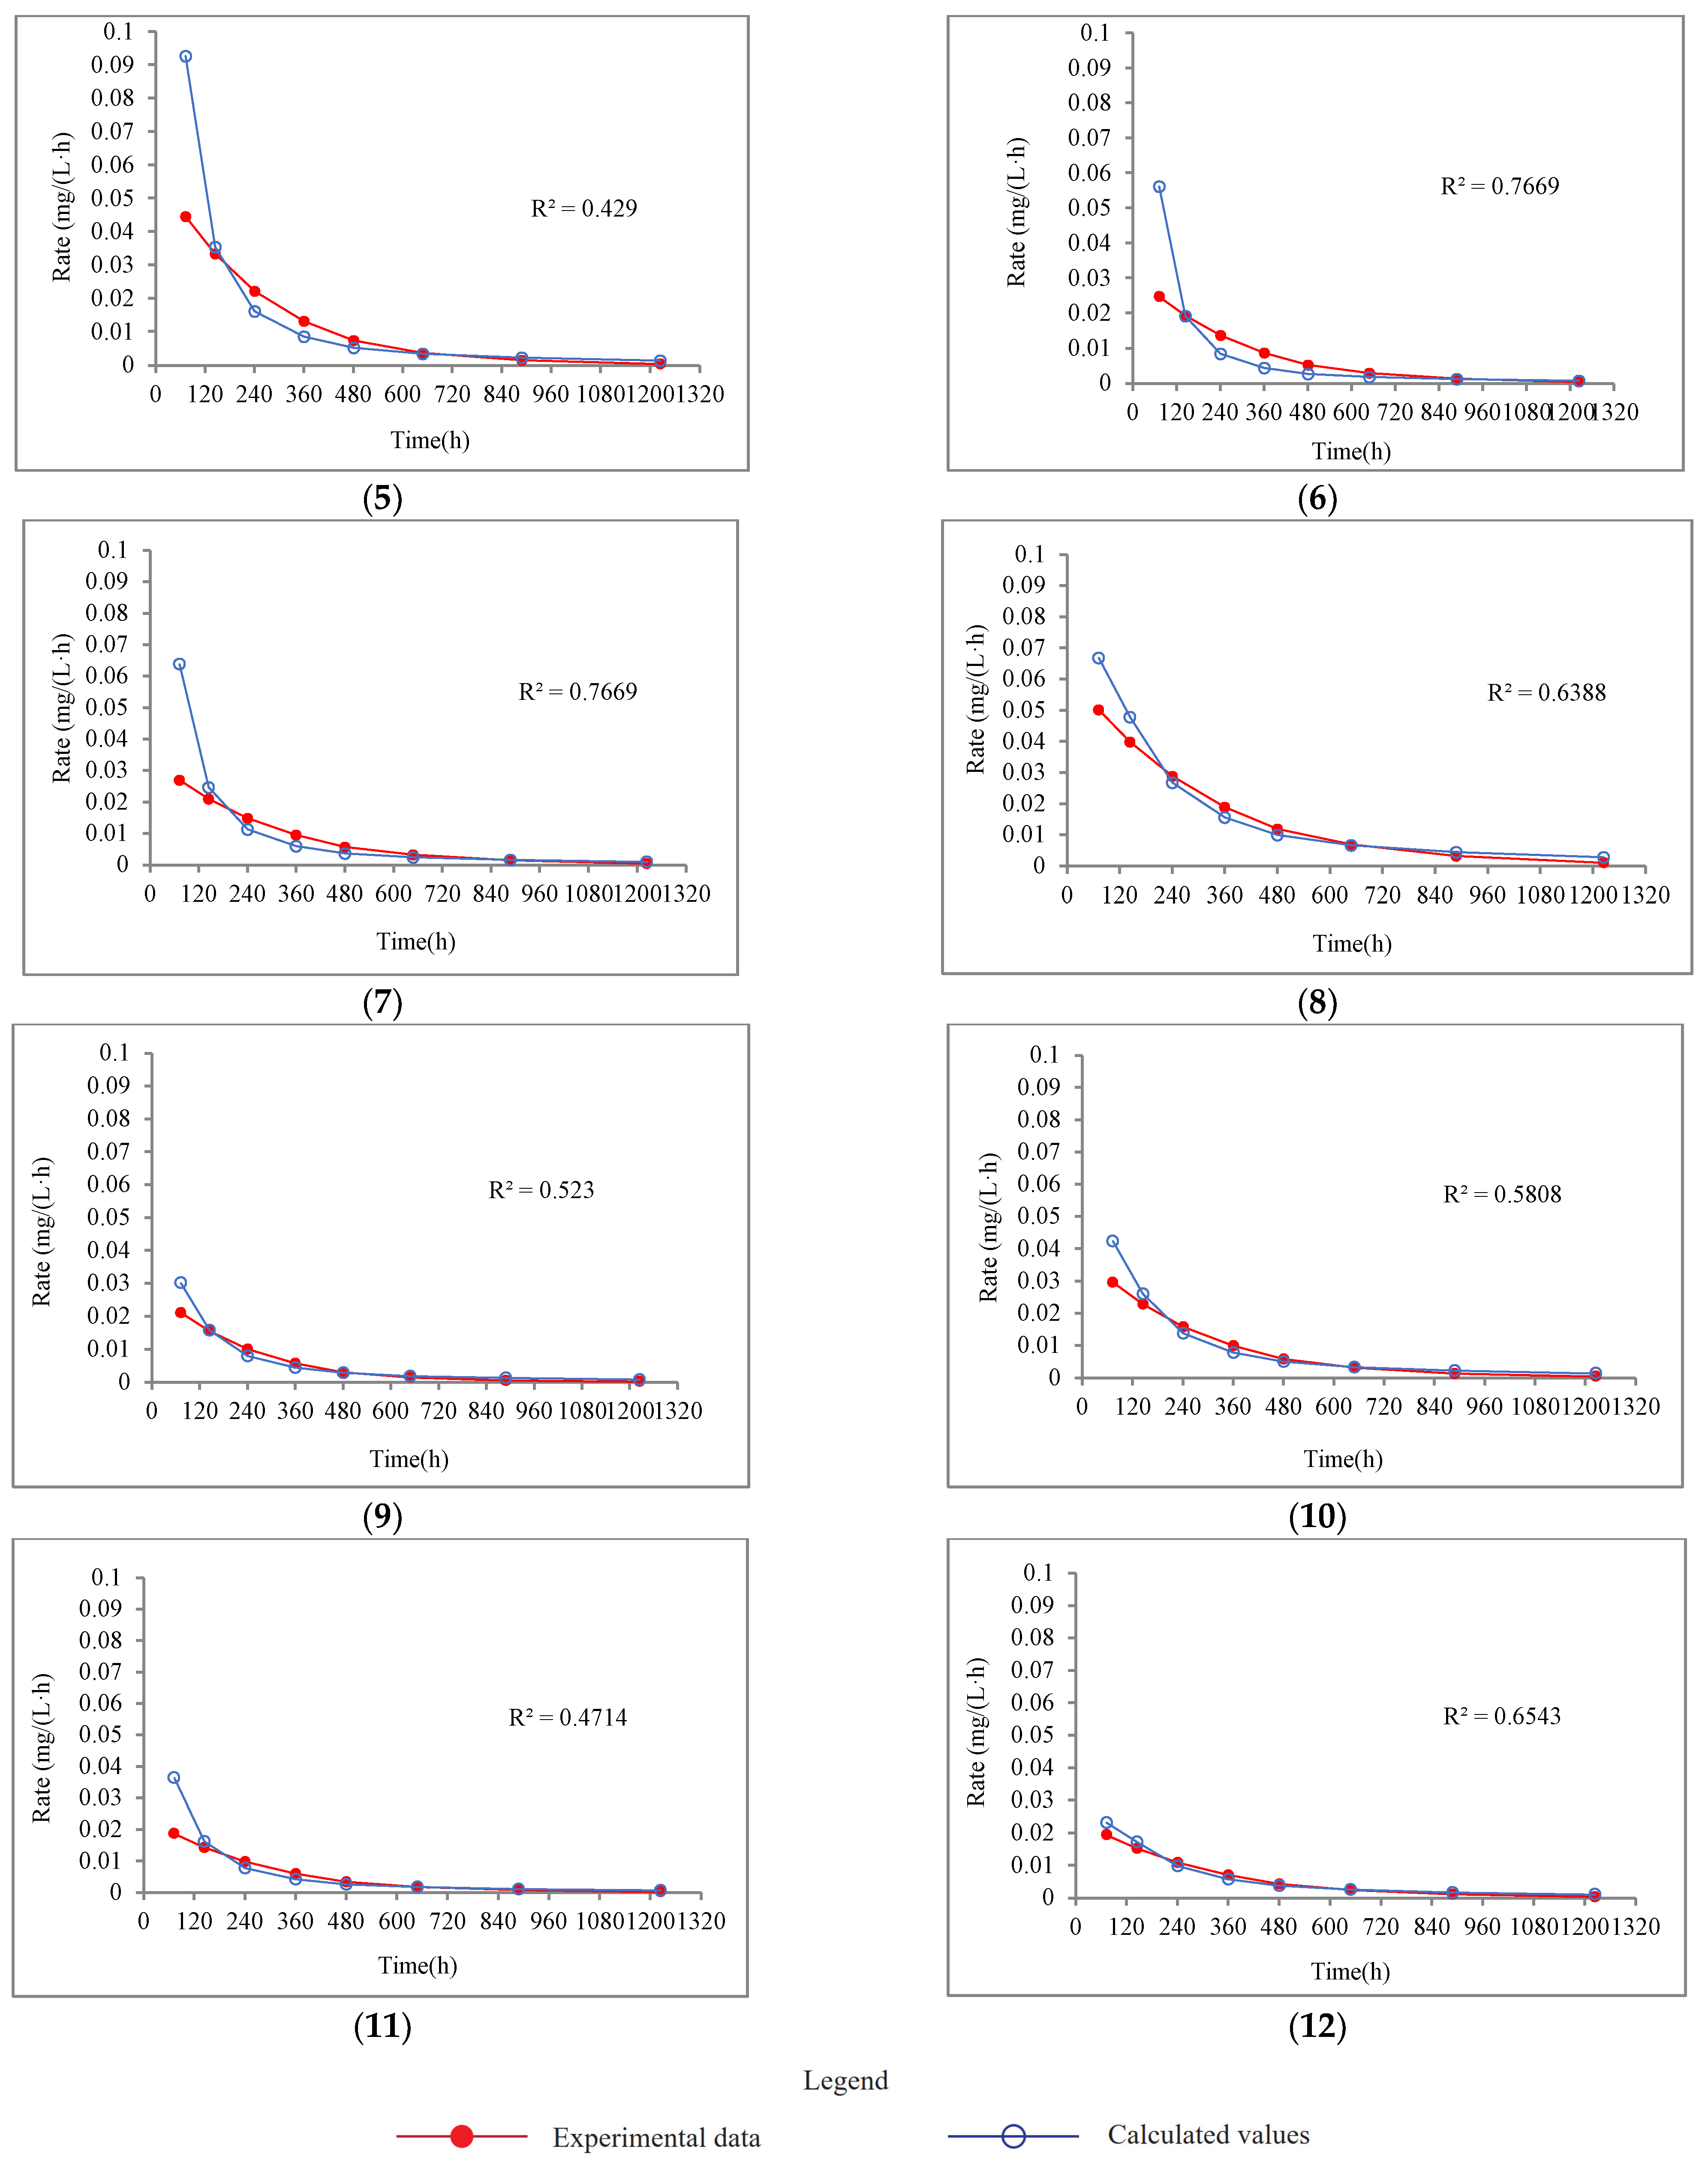
3.2.2. Fit of the P Release Rate Data versus the Derivative of the Diffusion Equation

The first derivation of Equation (9) was used to study the release rate of P and is written as follows:
C t = A ρ b C 0 * x 2 D x π t 3 exp ( x 2 4 D x t ) ,
The release rate can also be calculated using the Euler’s approximation based on the experimental data at i, which counts from the second test time to the ninth test time:
C i t = C i C i 1 t i t i 1 , 2 i 9 ,
where i is an index for the test time step. The values of A and Dx, obtained from the best-fitting exercises of Equation (9) versus the experimental BTCs, are substituted into Equation (11) to calculate the theoretical value of the release rate and then compared against the experimentally determined release rate from Equation (12). The Pearson correlation coefficient of the experimental and theoretical release rates was also calculated using Equation (10) and represented as r2.

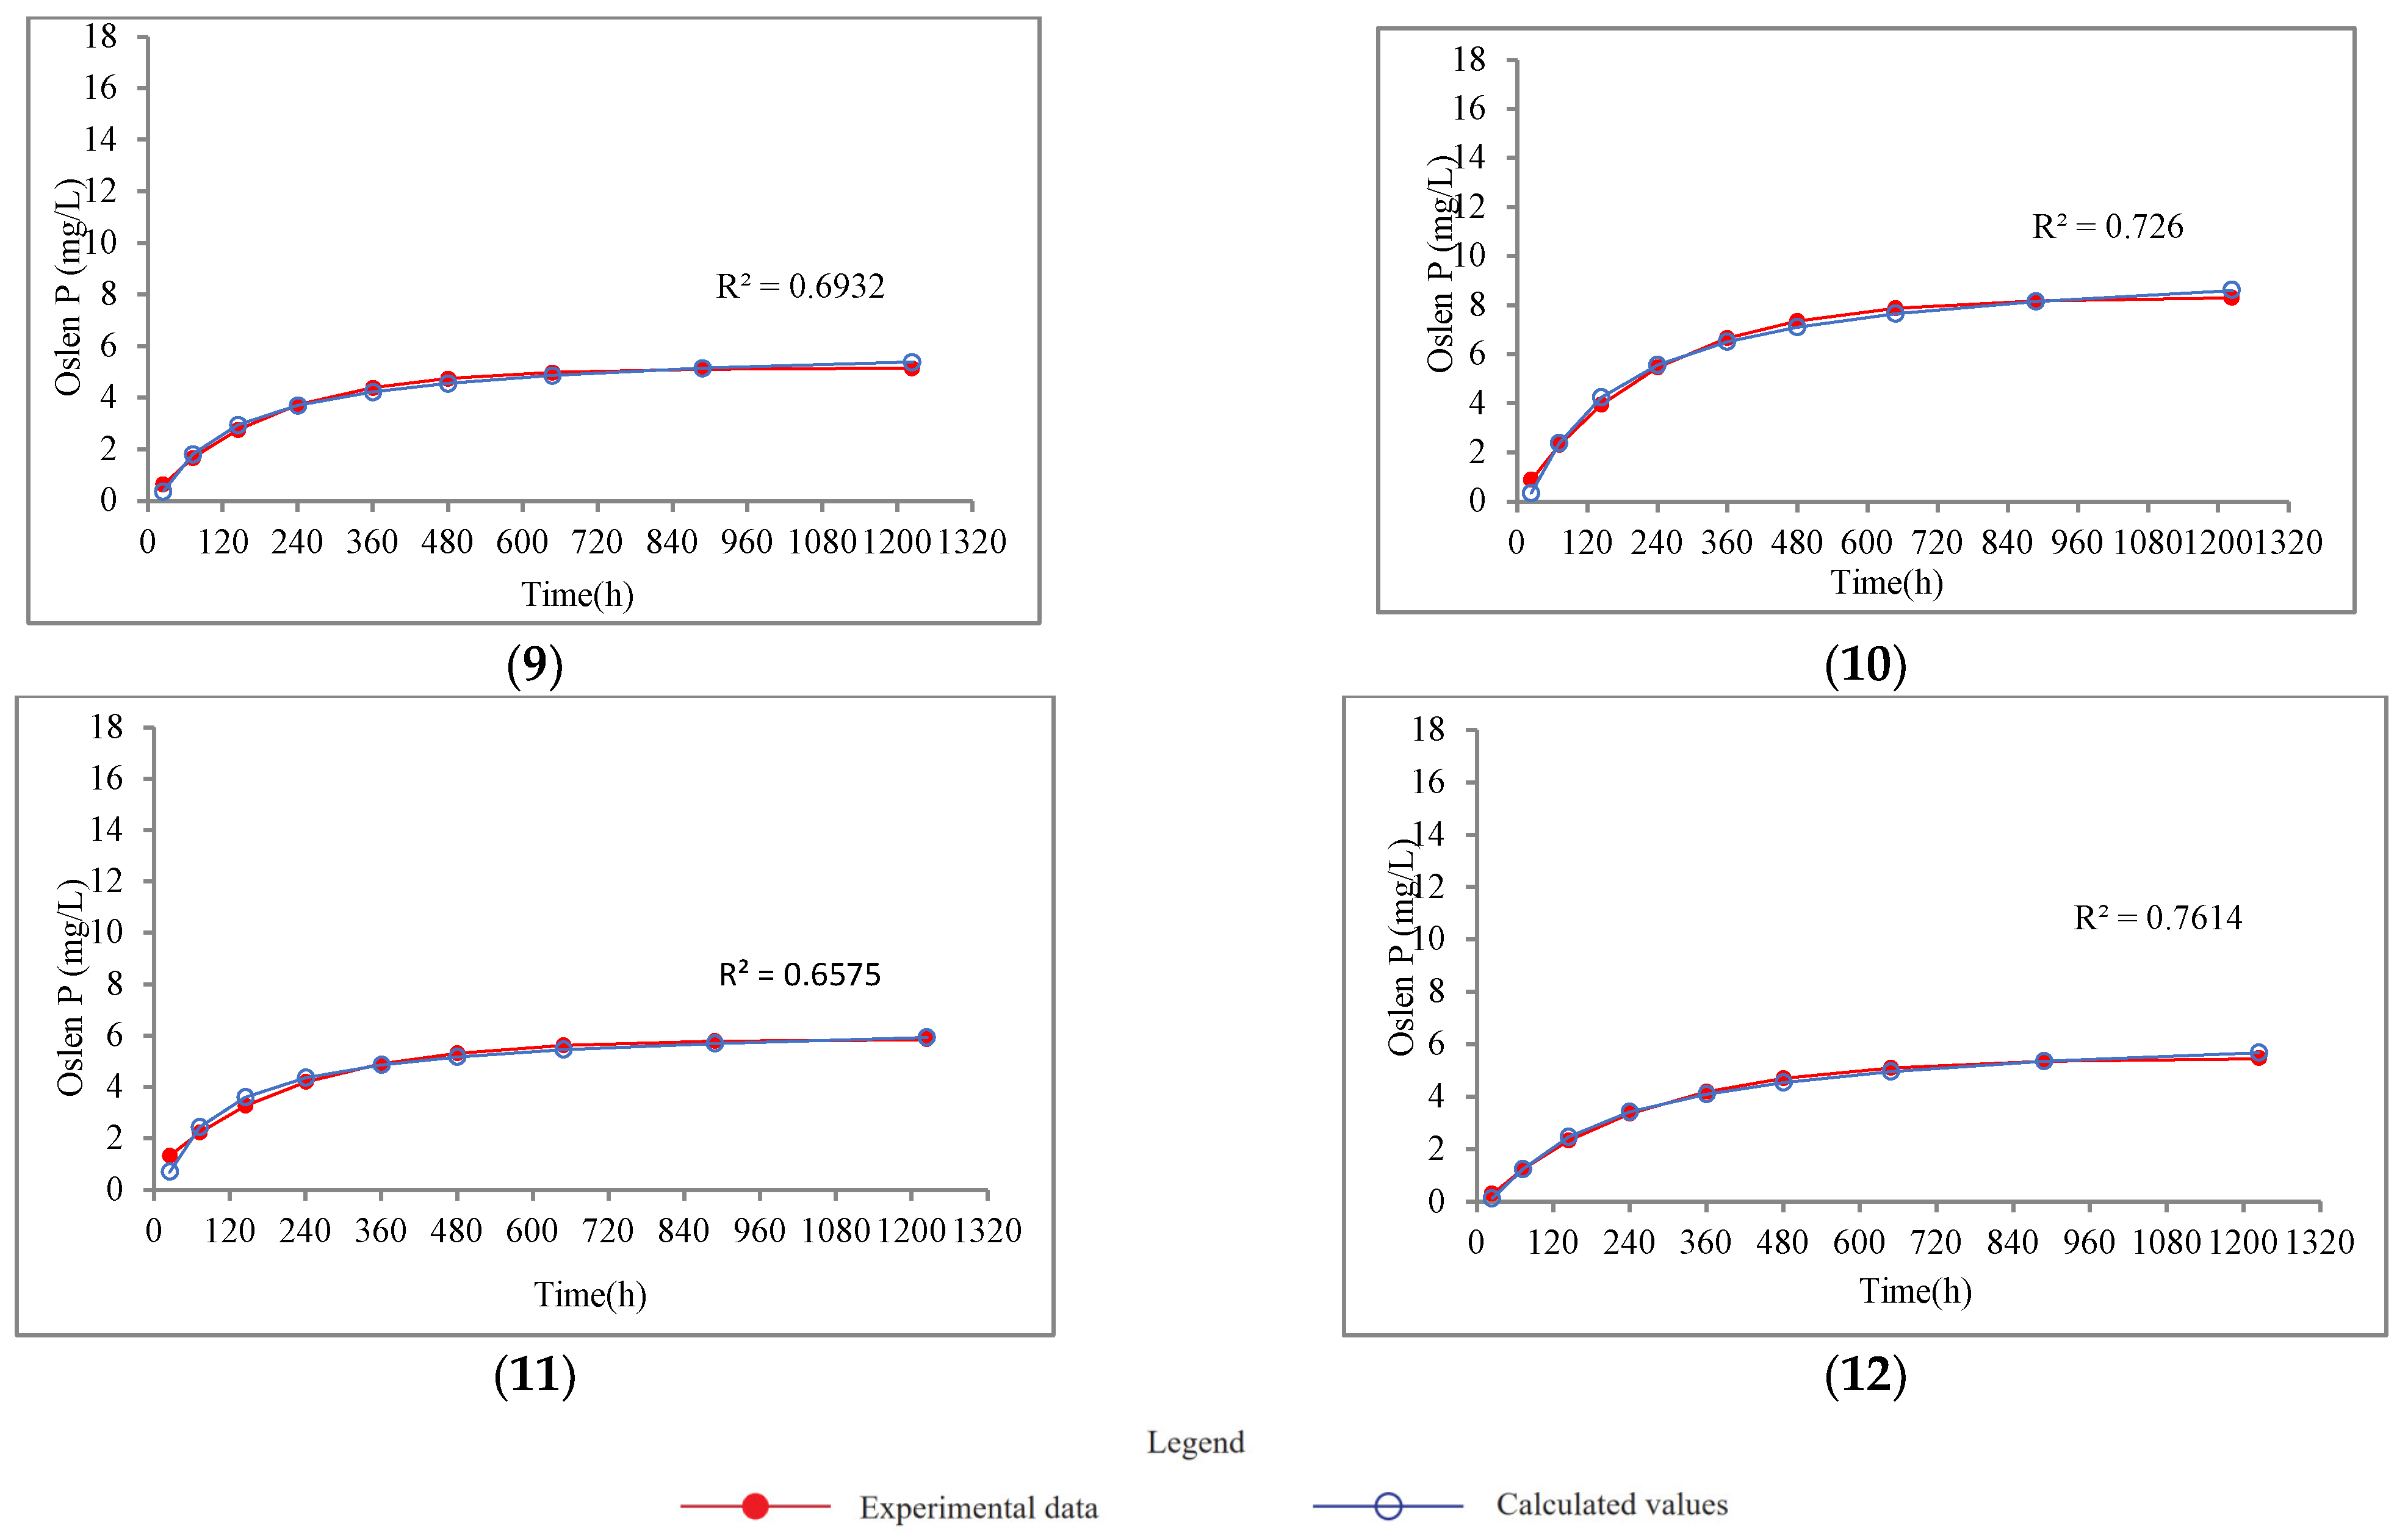
3.2.3. Fit of the Released P Concentration versus the Langmuir Kinetic Equation

To find the potential maximum dissolution of P, the experimental data were fitted with the Langmuir kinetic equation as follows [26] (He et al., 1996):
t C t = 1 k C m a x + t C m a x ,
where Ct is the concentration of dissolved RP at time t, k is a constant, and Cmax is the potential maximum dissolution of P. The Pearson correlation coefficient of the experimental data and the theoretical results from Equation (13) were also calculated using Equation (9) and represented as r3.

4. Analysis and Discussion

4.1. Groundwater Analysis

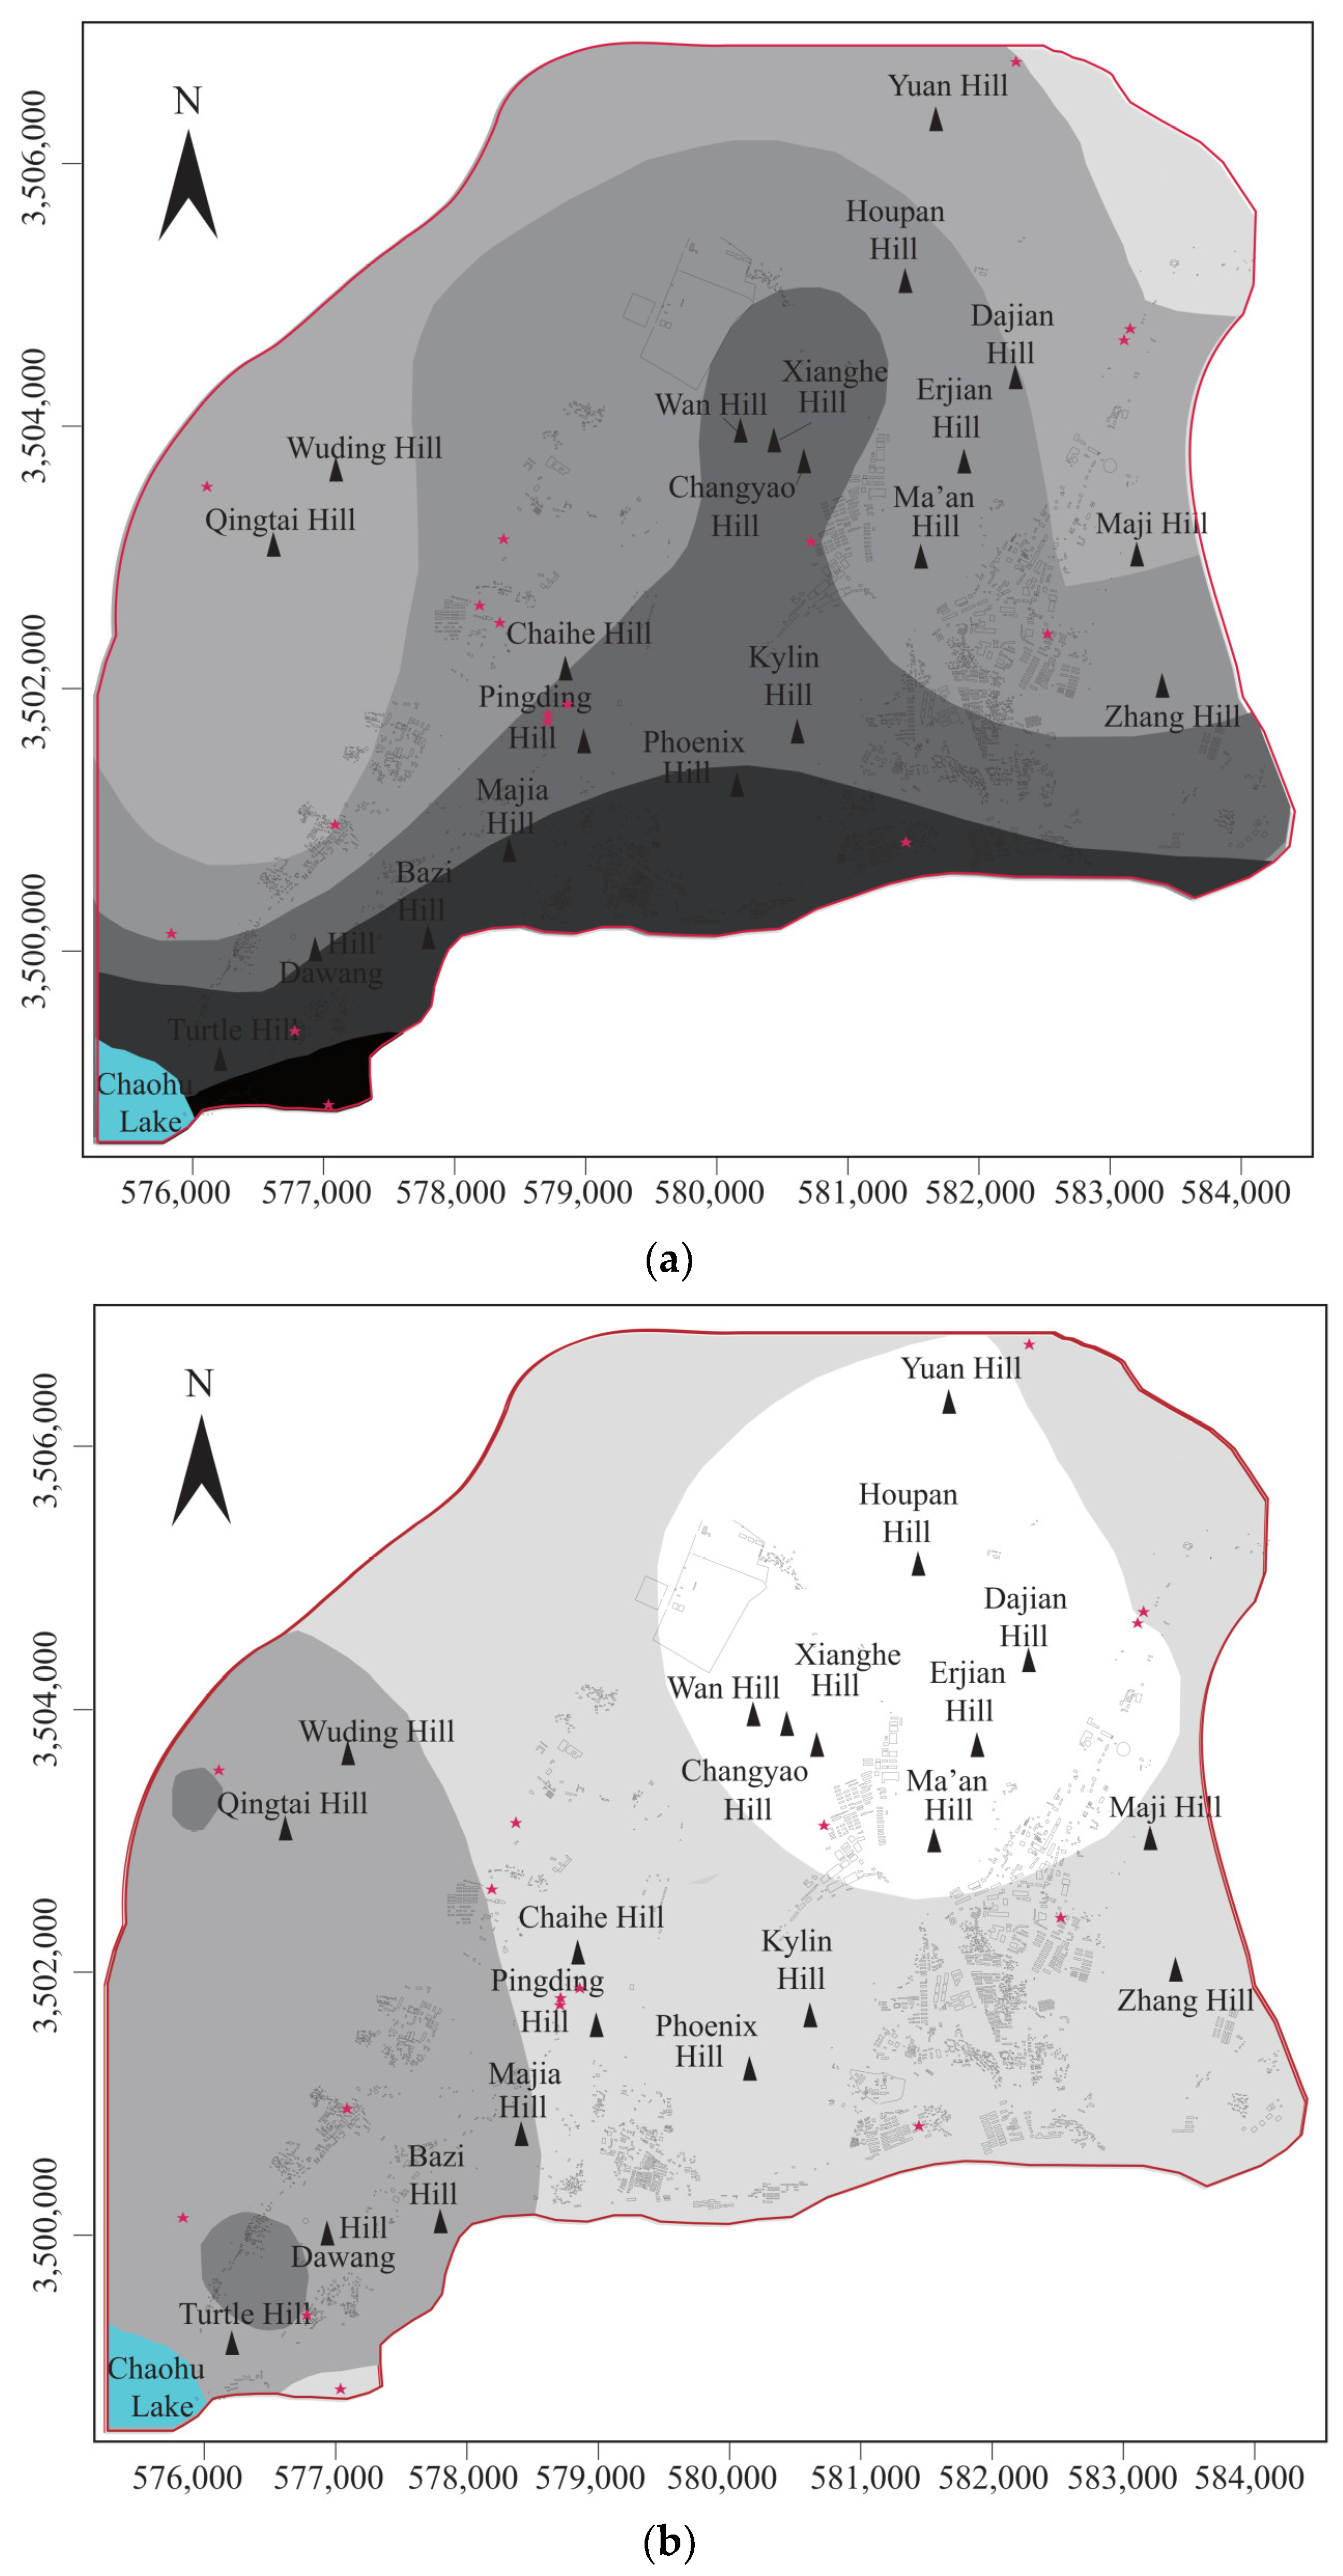
4.1.1. Spatial Analysis of Groundwater Total P

The key chemical parameters of 17 groundwater samples in the North Chaohu Lake Catchment were analyzed, and the iso-concentration map of the groundwater TP is shown in Figure 3. The concentration of total P in groundwater varied widely from 0.04 to 3.2 mg/L, with an average of 0.33 mg/L. There is no drinking water standard for P in China thus far, but 4 of the 17 samples could pose a health risk since their total P concentration exceeds 0.1 mg/L [27]. Golden Surfer 8.0 and MAPGIS software (version 6.6) were employed to draw the iso-concentration map of the groundwater total P content in the study area. Obviously, the total P concentration in groundwater was high in the west and low in the east of the study area, and the total P content reached the highest level (more than 2.0 mg/L) around the Chaohu Lake (Figure 3).
As one of the three most eutrophic lakes in China [28], the Chaohu Lake is rich in P. The high background value of P in the whole catchment and the high elevation in the west and the low elevation in the east of the study area are probably the two primary controlling factors for the distribution of groundwater total P of the area. The widely distributed P-containing metamorphic rock series and phosphorite in the North Chaohu Lake Catchment provide a naturally high P background content, and the soft and soluble properties of the phosphorus strata facilitate the release of phosphorus. Meanwhile, the abundant rainfall in the region accelerates the dissolution of P from the P-rich rock and soil, and then, the dissolved P is subsequently transported to the surface water and groundwater bodies, eventually ending up in the Chaohu Lake and the groundwater aquifers near the Lake.

4.1.2. Factor Analysis

The statistical software SPSS (version 19) was employed to conduct the factor analysis, which extracted a small number of factors for inferring the possible groundwater quality variation sources [29,30,31]. Eleven parameters were finally chosen to optimize the factor analysis, including TP, NO3, SO42−, Na+, K+, Mg2+, Ca2+, TDS, Cl, F, and pH. The results, such as factor loadings, eigenvalues, and the percent of variance explained by the main factors, are listed in Table 1. The varimax rotation was applied to maximize the variance of the loadings on the four retained factors [32], and only factors with eigenvalues greater than or equal to one are considered as sources of variance in the data. In this analysis, four factors had eigenvalues greater than one and accounted for 86.50% of the explained variance. They were extracted and considered as the possible sources of variation of the groundwater quality in the north of the Chaohu Lake Catchment.
The factor loadings represent the statistical weight of each chemical parameter on the factors, and a higher absolute value of the factor loading implies a closer correlation between the parameter and the factor. Garcia et al. [33] considered a factor loading of greater than 0.71 as excellent, whereas a factor loading lower than 0.32 as poor. Three levels have been classified by Liu et al. [34] based on the absolute values of factor loading: strong (>0.75), moderate (0.75–0.50), and weak (0.50–0.30).
The factor scores of samples were also calculated, and the distribution of the scores reflected how the study area was affected by the corresponding factor. A high factor score (greater than one) and a near-zero score suggest the strong and moderate effects of the process represented by the factor, respectively, while an extremely low score (less than −1) indicates no effect of the factor. The first factor represented 29.83% of the total sample variations with a strong loading of NO3, TDS, and SO42− and a moderate loading of Cl. This factor represented the anthropogenic process because these chemical parameters were often used to measure anthropogenic contamination [35](Dragon, 2006). The chloride and sulfate were the principal products resulting from urbanization that altered the groundwater chemistry [36,37,38], while a strong positive correlation between NO3 and TDS suggested that the contamination was primarily from agricultural activities [29].
The distribution of factor scores in Figure 4a indicated that the south of the study area was affected by the process represented by Factor 1, and the effect decreased from south to north. Farmland has been the primary land use in the North Chaohu Lake Catchment for many decades [39,40], and there were several mining sites in the south of the study area near Changyao Hill and Xianghe Hill. Therefore, anthropogenic activities such as agricultural and mining activities were likely the main factors affecting groundwater quality in this area. Factor 2 represented 24.97% of the sample variation, with a high loading of Mg2+, Ca2+, and Na+. This factor was identified as the interaction between carbonate rock and groundwater since these ions were the main components in certain widely distributed minerals in the study area, including carbonate rock, feldspar, etc. The factor score map in Figure 4b showed that the effect of Factor 2 increased from east to west and reached the highest level near Qingtai Hill and Turtle Hill. This was probably due to the limestone deposition present in these two places. Factor 3 explained 16.70% of the variation and had a high loading of total P and K+. P could be sourced from the following: (1) anthropogenic activities such as fertilizer and the use of P-containing products, (2) the dissolution of phosphate mineral, (3) the decomposed residual of riparian plans, etc. [41,42,43]. The K+ could be derived from the dissolution of potassium-bearing minerals and crop fertilizers. The score of Factor 3 was low in the center and the south of the study area and high in the north and the west of the study area, as can be seen in Figure 4c.
The ancient phosphorus metamorphic rock is widely distributed in the west, the southwest, and the north of the Chaohu Lake Catchment and is associated with other mineral resources such as alum stone [5]. This agrees with the high Pearson correlation coefficient (0.819) between K and total P observed in Table 2. Therefore, this factor was interpreted as the interactions between minerals and groundwater. Factor 4 was associated with the dissolution of fluorine-bearing minerals at high pH values since it had a high fluorine loading and pH [32]. The distribution of scores for this factor showed an increasing trend from east to west, as reflected in Figure 4d.
Based on the factor analysis, anthropogenic activities in this area affect the groundwater quality the most, and the area with the highest factor score of Factor 1 is highly correlated with the highest content of phosphorus in the north shore of the Chaohu Lake [44], indicating that the phosphorus-rich rocks in Turtle Hill, Changyao Hill, Xianghe Hill, Phoenix Hill, etc., are probably the main sources for the contaminant of the groundwater.

4.2. Analysis of the P Dissolution

Studies have shown that a large number of ions can enter the water body by rock weathering in some places and may accelerate the degradation of groundwater, especially in the mining area [45,46]. The high natural background content of P in the whole Chaohu Lake Catchment provides a large source for the release of P, which may be one of the reasons why the dissolution of P-bearing minerals is the third main process affecting the groundwater quality in the study area. Han [39] reported that an area of more than 500 km2 around the catchment was covered by phosphate rocks, and P released from these rocks due to weathering and mining may be transported to the surface water and groundwater and may eventually enter the Chaohu Lake. The cumulative P content was plotted against time, and BTCs are shown in Figure 5. According to the change in the cumulative P content, three periods could be identified from this figure. The first period was from 0 to 480 h after P was released into the solution. During this period, the P concentration in the solution increased rapidly, reaching 80% of the maximum content. The second period lasted from 480 to 648 h when the rate of increase in P concentration declined. The third period was from 648 h to the end of the experiment when the cumulative content of P gradually approached an asymptotic constant. A similar result was found by He et al. [47], in which the P experienced an initial rapid dissolution in the first 30 days and then a slow and steady dissolution stage lasting more than 100 days.

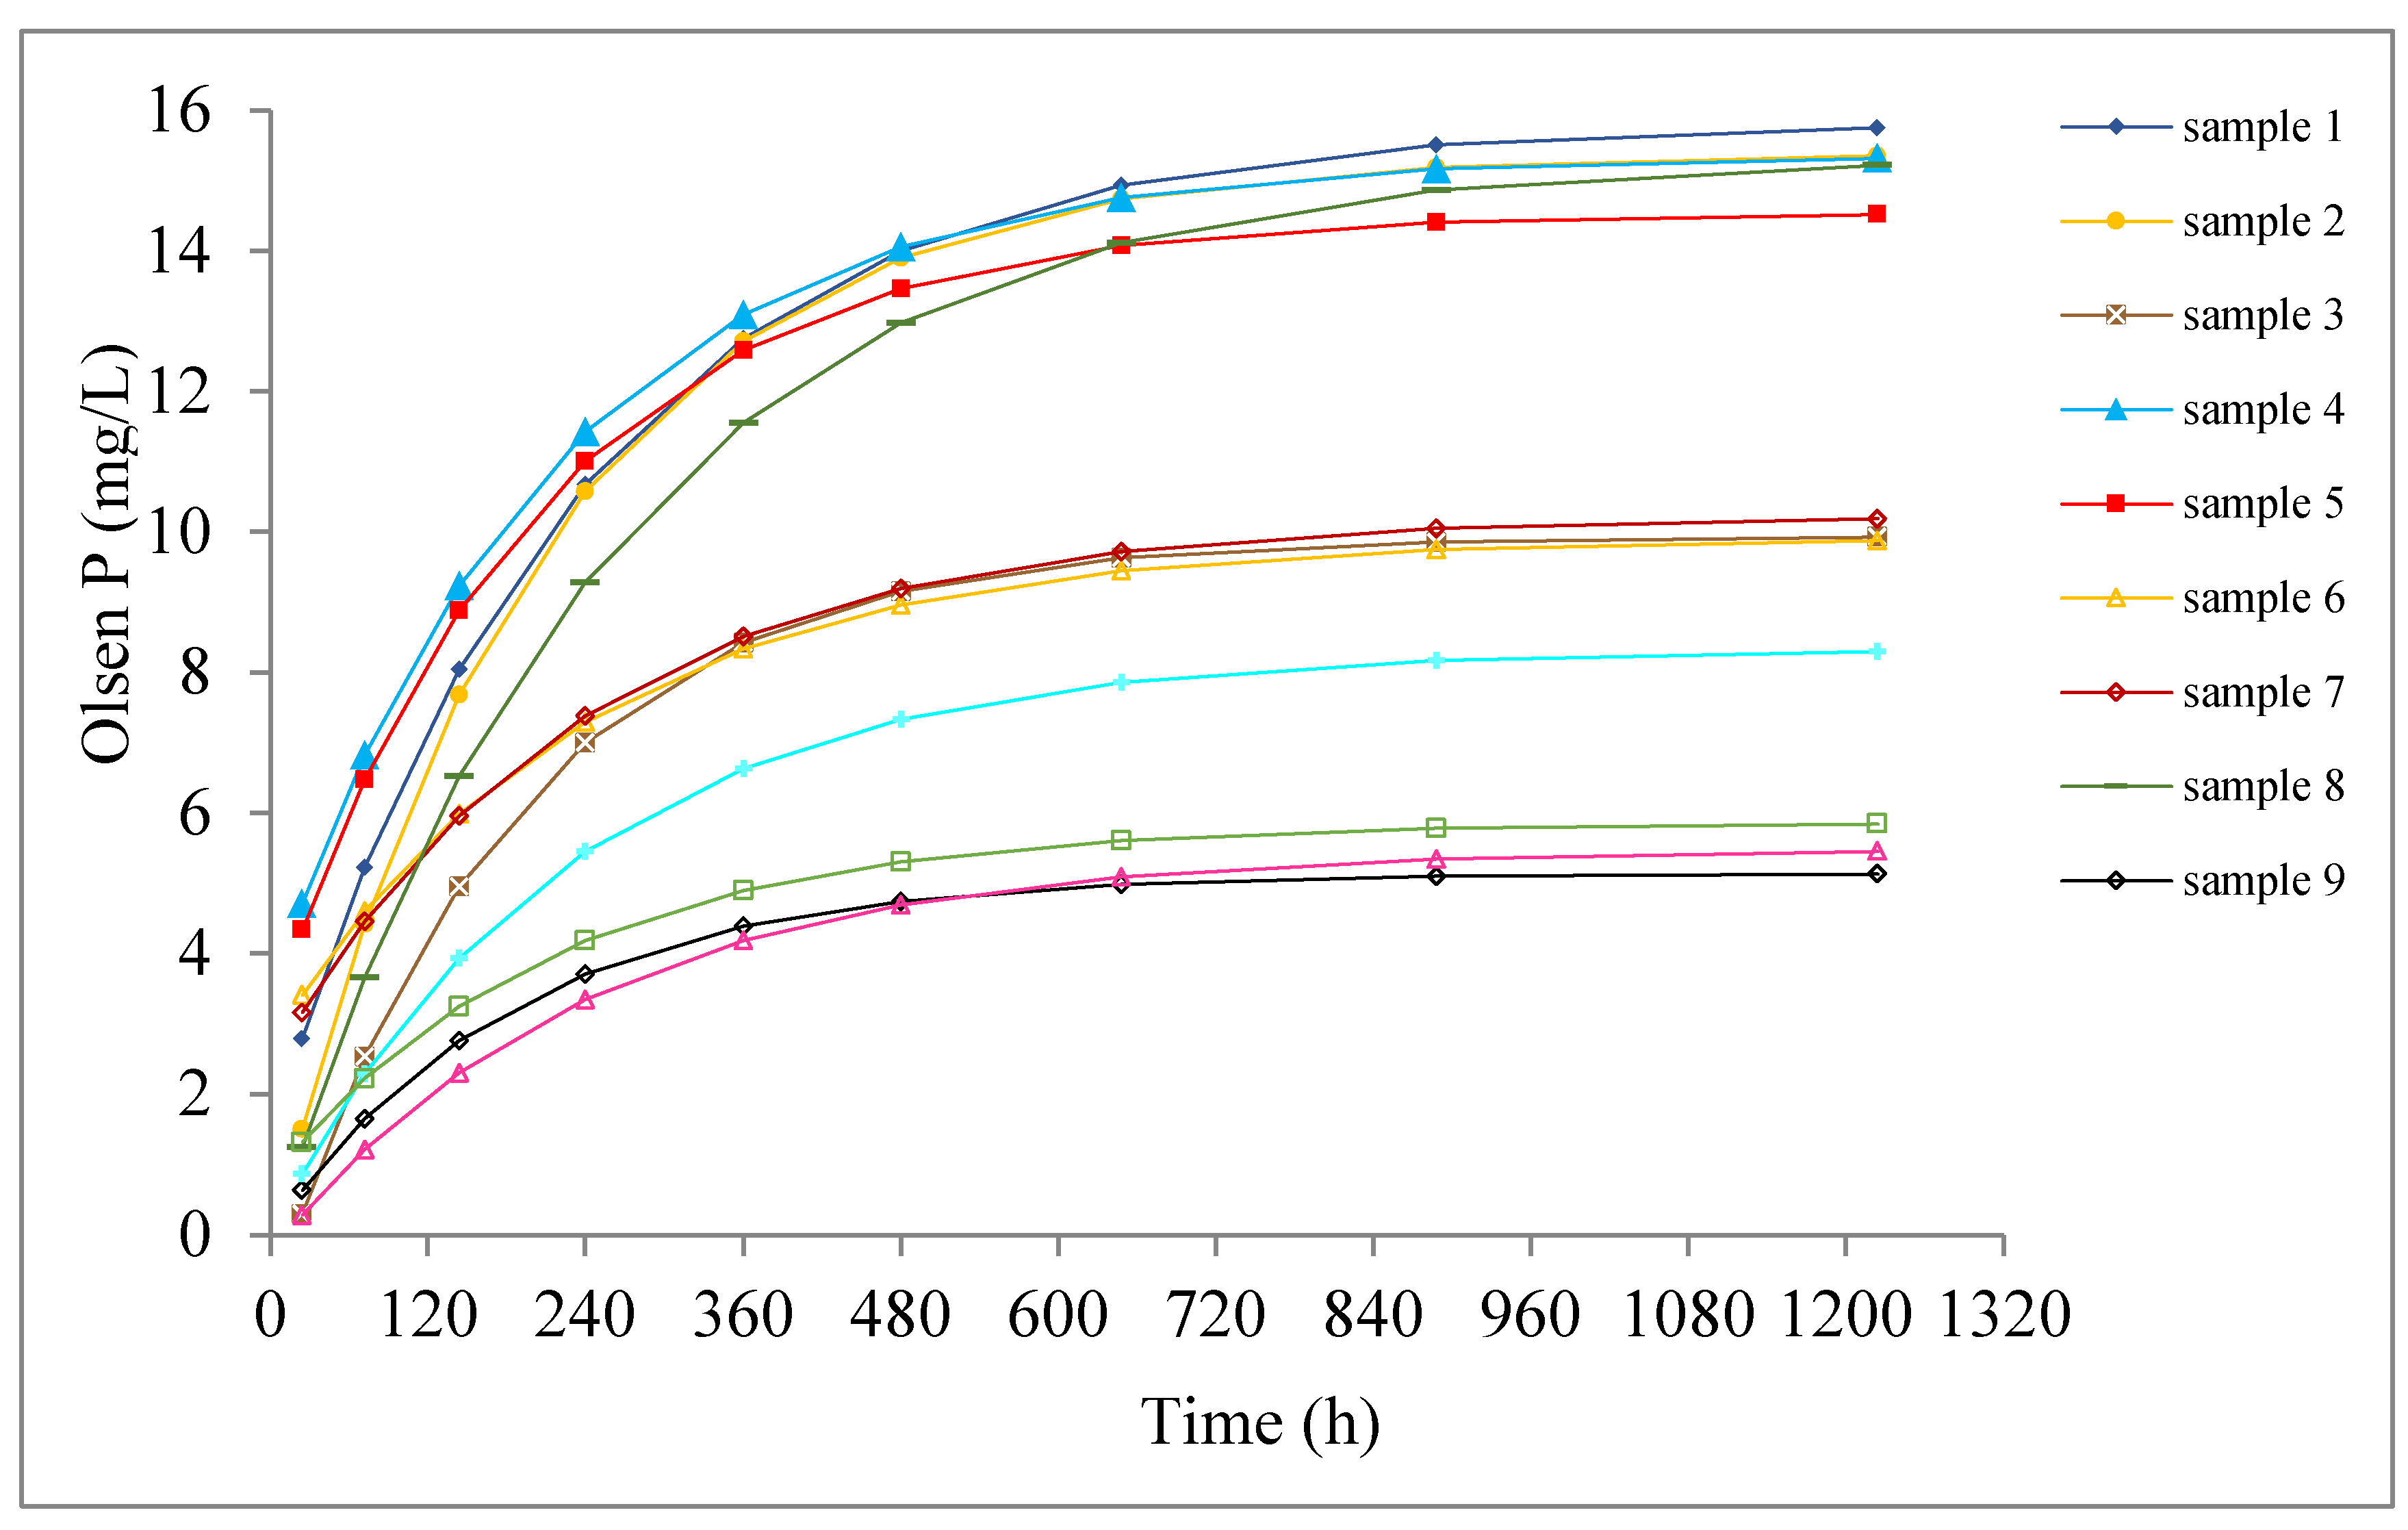
4.2.1. Cumulative Concentration of P

The experimental concentration data were fitted against Equation (9), and the estimated value of A and Dx were obtained following the Marquis algorithm when the goodness of fit reached its maximum. In this experiment, the centrifuge tube was treated as a domain; thus, x should vary from 0 to 9.95 cm, which is the length of the tube. In preliminary simulations, the estimated values of Dx were more consistent and reliable when x = 9.95 cm. Therefore, x = 9.95 cm was selected as the farthest travel distance of P. A similar approach was used by Katsev et al. [48], which chose a specific value of x according to the preliminary simulations when studying the phosphorus efflux from lake sediments.
Figure 6 demonstrates the goodness of fit by comparing the calculated profile with the experimental data. Obviously, the 1D diffusion equation could describe the release of P satisfactorily for all the samples, with a small discrepancy, which may be explained as follows. The most likely reason was that the experimental conditions included many ions in the solution, such as Fe3+, Ca2+, Mg2+, and NO3-N, and pH value variations. The existence of some ions [49,50,51] or the variation in the pH values [52] can affect the solubility of P. For example, Fe(III) can help the transformation of dissolved phosphate into particulate phosphate by the formation of Fe(III)-phosphates at redox gradients [53], and a higher pH value could decrease the initial release rate of P [47]. Another possible reason was the test method used in the experiments. For instance, Na-saturated, Na-zeolite, and H-saturated resin were often added to extract P from soil and apatite in previous studies [54,55]. Lai and Eberl [56] found that the quantity of P released by adding the above-mentioned resin was an order of magnitude higher than that released by apatite alone without the addition of the resin.
The optimal values of A and Dx are listed in Table 3, together with their associated Pearson correlation coefficient (r1). The high values of r1 (greater than 0.95) of all samples suggested a high goodness of fit. The diffusion coefficient Dx varied from 0.96 × 10⁻⁴ to 4.48 × 10⁻⁴ cm2/s, when compared to the diffusion coefficient of H2PO4, HPO42−, and HP43− calculated by Li and Gregory [57], which were 3.04, 2.64, and 2.20 × 10⁻² cm2/s, respectively, at 25 °C. Li and Gregory [57] pointed out that the diffusion of ions was related to temperature, water viscosity, ionic potential, ambient atmospheric pressure, and the even contents of the ions. The experiments were completed during the winter of 2009, and the relatively low ambient temperature (less than 25 °C) in that winter probably slowed down the diffusion of ions. The A values for samples in the high P region (sample 9~12) were two magnitudes smaller than those in the low content P region (sample 1~8), and the release rates of P from the high P region were less than those from the low RP region. This may be due to the different chemical compositions of these two kinds of rocks and will be further investigated in the future.

4.2.2. Release Rate of P

During the dissolution of the rock samples, the release rate of P, which was demonstrated by the gradients of the curves in Figure 7, obviously decreased with time. The gradients were high at the beginning of the experiment, suggesting a high initial release rate, in contrast to the nearly zero release rate after 648 h. In this experiment, the minimum release rate ranged between 6.78 × 10⁻⁴ and 2.40 × 10⁻³ mg/(L·h), the maximum release rate ranged between 2.32 × 10⁻² and 9.69 × 10⁻² mg/(L·h), and the average release rate ranged between 8.07 × 10⁻³ and 5.17 × 10⁻² mg/(L·h), and the rate showed no significant variation between the high-P-content rock and the low-P-content rock. The release rate and the cumulative number of ions released were controlled by many external conditions, including lithology, hydrological characteristics, geographic position, etc. [58]. As the reaction progressed, the variation in temperature, chemical equilibrium, and surface area contact with the solution were the factors influencing the variations in the release rate. The cumulative release function was differentiated to calculate the release rate, which was then compared with the experimental data calculated by Equation (12), and their Pearson correlation coefficient (r2) is listed in Table 3. The moderately high Pearson correlation coefficient (greater than 0.8) indicated that the calculated release rates of P based on the estimated values of Dx and A adequately agreed with the experimental release rates.

4.2.3. Potential Maximum Dissolution of P

It is essential to predict the dissolution of P due to chemical weathering to determine the possibility of risk posed by such a process. The Langmuir kinetic equation was used to assess the potential maximum dissolution of P [26,47]. The constant k and the potential maximum dissolution of P, Cmax, are the two fitted variables of the Langmuir kinetic equation. The estimated values of these two variables are listed in Table 3 together with the corresponding Pearson correlation coefficients, r3. The high Pearson correlation coefficients (r3 ranging from 0.983 to 0.997) indicated that the Langmuir kinetic equation can describe the release of P satisfactorily. The k and Cmax values ranged between 3.83 × 10⁻³–11.40 × 10⁻³ and 6.13–19.27 mg/L, respectively, and the relatively high release of P into water verified the results shown in factor analysis. The low correlation between the total P content in rock samples and the variation in Cmax implied that the release of RP was independent of the total P content of the rock, and other factors should be identified in a future study. For example, some ions such as Ca2+ may be associated with P and were more readily extractable using NaHCO3 [46]. Meanwhile, the relatively high Cmax value also indicated a risk to the ambient aquatic environments.

5. Implications for the Source of P

The above analysis revealed the source and the mobilization of P in the North Chaohu Lake Catchment, and it could be interpreted as follows. In the North Chaohu Lake Catchment, the widely distributed ancient phosphorus metamorphic rock at Turtle Hill, Changyao Hill, Xianghe Hill, Phoenix Hill, etc., provided a high background value of P. The anthropogenic activities (including exploitation etc.), abundant precipitation, and the chemical weathering of the phosphate rock, accelerated the release of P from the rock, which then entered the water body of the area, eventually reaching the Chaohu Lake through the phosphorus migration pathway present in this environment. This release process experienced three periods: a rapid-release period (0~480 h), a slow-release period (480~648 h), and an equilibrium period (after 648 h). The potential maximum dissolution of P could be predicted using the Langmuir kinetic equation. It is independent of the total P content in rocks, and its high values (more than 0.1 mg/L) indicate a risk to the environment. After dissolution, the diffusion effect would help the dissolved P to transport to a finite distance, and a 1D diffusion equation could well describe this movement with a semi-infinite boundary condition.

6. Limitations and Future Works

Despite the great insights gained from this investigation, there are several limitations that should be addressed in future investigations. Firstly, the number of samples collected and tested are limited due to the constraints of funding and the duration of the project. A much larger dataset of water quality samples should be generated in the future. Most importantly, the water quality time-series dataset should be collected as it will offer vital information for the evolutionary process of water quality in the Chaohu watershed. Secondly, the ion exchange between the lake water and groundwater of the Chaohu Catchment should be analyzed in great detail to understand the geochemical process of the lake–aquifer interaction. Thirdly, since the release of P from rock is affected by some other factors that have not been analyzed in this study, such as acid rain, soil type, etc., the release of P from rock under different conditions needs to be scrutinized in a future work.
Through a further study on the RP dissolution and diffusion of P in the water of the Chaohu Lake in the future, we aim to provide the theoretical and scientific basis and guidance for water quality improvement for the area under similar conditions.

7. Conclusions

Based on this study, the conclusions that can be drawn are as follows:
(1)
The groundwater total P content in the North Chaohu Lake Catchment was high in the west and low in the east, with the highest values around the Chaohu Lake (greater than 2.0 mg/L).
(2)
The factor analysis revealed that the anthropogenic activities (especially the agricultural and mining activities) were the major factors affecting groundwater quality. In contrast, the interactions between groundwater and carbonate rock, the dissolution of the P-bearing minerals, and the fluorine-bearing minerals were the second, third, and fourth factors affecting the groundwater quality, in the order of decreasing effectiveness.
(3)
There were three periods for the dissolution of P, evident from the experimental breakthrough curves. The dissolution of P can be well described by a 1D diffusion equation and the Langmuir kinetic equation. The geometric factor A and diffusion coefficient Dx were estimated by fitting the data against the 1D diffusion equation. Samples with high P contents (sample 9~12) had smaller geometric factors, while the opposite was true for samples with low P contents (sample 1~8).
(4)
The low ambient temperature was probably responsible for the relatively lower diffusion coefficient compared to that of the previous studies. The constant k and the potential maximum dissolution of P, Cmax, were also obtained from fitting data with the Langmuir kinetic equation. According to the Cmax values, the dissolution of P could pose a risk to the ambient water body, and the release of P was independent of the total phosphorus content in the rock at the study area.

Author Contributions

Conceptualization, L.W. and R.Z.; methodology, H.Z. and J.Q.; software, L.W.; validation, Q.Z. and H.G.; formal analysis, H.G..; investigation, R.Z.; resources, J.Q.; data curation, L.W.; writing—original draft preparation, L.W.; writing—review and editing, L.W.; visualization, L.W.; supervision, H.Z.; project administration, J.Q. All authors have read and agreed to the published version of the manuscript.

Funding

This work is financially supported by the National Natural Science Foundation of China (U2267218; 41831289) and funded by public welfare geological survey program of Anhui Province (2015-g-26), Collegiate Natural Science Research Project of Anhui (KJ2021A1455), the Provincial Natural Science Foundation of Anhui (2308085US12), and the Key Research and Development Program of Anhui Province (2023AH053041).

Data Availability Statement

The data presented in this study are available from the corresponding author upon reasonable request.

Conflicts of Interest

The authors declare no conflicts of interest.

References

  1. Wang, Y.; Gu, W.; Liu, X.; Liu, H.; Tang, G.; Yang, C. Combined impacts of algae-induced variations in water soluble organic matter and heavy metals on bacterial community structure in sediment from Chaohu Lake, a eutrophic shallow lake. Sci. Total Environ. 2023, 874, 162481. [Google Scholar] [CrossRef] [PubMed]
  2. Wang, Y.; Hua, Z.; Wang, L. Sensitivity analysis of the Chaohu Lake eutrophication model with a new index based on the morris method. Water Sci. Technol. Water Supply 2018, 18, 1375–1387. [Google Scholar] [CrossRef]
  3. Ding, W.; Zhu, R.; Hou, L.; Wang, Q. Matrix-bound phosphine, phosphorus fractions and phosphatase activity through sediment profiles in Lake Chahu, China. Environ. Sci. Process. Impacts 2014, 16, 1135–1144. [Google Scholar] [CrossRef] [PubMed]
  4. Chang, L. Transportation Traits of N and P in Chaohu Lake P-Rich Basin and the Consequent High-Risk Identification. Master’s Thesis, Nanjing Agriculture University, Nanjing, China, 2012. (In Chinese). [Google Scholar]
  5. Wang, X.; Wang, X.; Feng, Y.; Liu, H. Distribution of total phosphorus in the sediments in Chaohu Lake and its geological origin. J. Anhui Norm. Univ. (Nat. Sci.) 2007, 30, 496–499. (In Chinese) [Google Scholar]
  6. Qian, J.; Chu, Q.; Zhang, R.; Liu, Y.; Wan, W. Influence of recurrent rainfall and oxalic acid on phosphorus releasing from rocks phosphate in the Chaohu watershed, China. Chemosphere 2019, 215, 815–826. [Google Scholar] [CrossRef] [PubMed]
  7. Bern, C.R.; Townsend, A.R.; Farmer, G.L. Unexpected dominance of parent-material strontium in a tropical forest on highly weathered soils. Ecology 2005, 86, 626–632. [Google Scholar] [CrossRef]
  8. Porder, S.; Paytan, A.; Vitousek, P.M. Erosion and landscape development affect plant nutrient status in the Hawaiian Islands. Oecologia 2005, 142, 440–449. [Google Scholar] [CrossRef] [PubMed]
  9. Filippelli, G.M.; Souch, C.; Horn, S.P.; Newkirk, D. The pre-Columbian footprint on terrestrial nutrient cycling in Costa Rica: Insights from phosphorus in a lake sediment record. J. Paleolimnol. 2010, 43, 843–856. [Google Scholar] [CrossRef]
  10. Gaur, A.C.; Ostwall, K.P. Influence of phosphate dissolving bacilli on yield and phosphate uptake of wheat crop. Indian J. Exp. Biol. 1972, 10, 393–394. [Google Scholar]
  11. Jurinak, J.J.; Dudley, L.M.; Allen, M.F.; Knight, W.G. The role of calcium oxalate in the availability of phosphorus in soils of semiarid regions: A thermodynamic study. Soil Sci. 1986, 142, 255–261. [Google Scholar] [CrossRef]
  12. Schlesinger, W.H.; Bernhardt, E.S. Biogeochemistry: An Analysis of Global Change, 4th ed.; Academic Press: San Diego, CA, USA, 2020. [Google Scholar]
  13. Aydin, I.; Imamoglu, S.; Aydin, F.; Saydut, A.; Hamamci, C. Determination of mineral phosphate species in sedimentary phosphate rock in Mardin, SE Anatolia, Turkey by sequential extraction. Microchem. J. 2009, 91, 63–69. [Google Scholar] [CrossRef]
  14. Kang, W.J.; Kolasa, K.V.; Rials, M.W. Groundwater inflow and associated transport of phosphorus to a hypereutrophic lake. Environ. Geol. 2005, 47, 565–575. [Google Scholar] [CrossRef]
  15. Chien, S.H.; Clayton, W.R.; McClellan, G.H. Kinetics of dissolution of phosphate rocks in soils. Soil Sci. Soc. Am. J. 1980, 44, 260–264. [Google Scholar] [CrossRef]
  16. Sikora, F.J.; Copeland, J.P.; Mullins, G.L.; Bartos, J.M. Phosphorus dissolution kinetics and bioavailability of water-insoluble fractions from monoammonium phosphate fertilizers. Soil Sci. Soc. Am. J. 1991, 55, 362–368. [Google Scholar] [CrossRef]
  17. Shen, Y.H. Study on the Existing Form and Release Rule of Rock Phosphorus in Eastern Section of the North Shore of Chaohu Lake Area, Hefei; Hefei University and Technology: Hefei, China, 2015; pp. 34–35, (In Chinese). [Google Scholar] [CrossRef]
  18. Hirmas, D.R.; Graham, R.C. Pedogenesis and Soil-Geomorphic Relationships in an arid mountain range, Mojave Desert, California. Soil Sci. Soc. Am. J. 2011, 75, 192–206. [Google Scholar] [CrossRef]
  19. Drewry, J.; Taylor, M.; Curran-Cournane, F.; Gray, C.; McDwell, R. Olsen P methods and soil quality monitoring: Are we comparing “apples” with “apples”? In Tools for Nutrient and Pollutant Management: Applications to Agriculture and Environmental Quality; Proceedings of a workshop. Occasional report No.17; Currie, L.D., Loganathan, P., Eds.; Fertiliser and Lime Research Centre, Massey University: Palmerston North, New Zealand, 2013; pp. 1–2. [Google Scholar]
  20. Jin, X.C.; Tu, Q.Y. Standard for the Investigation and Evaluation on the Eutrophication of Lakes; China Environmental Science Press: Beijing, China, 1990; pp. 15–16. (In Chinese) [Google Scholar]
  21. Spiteri, C.; Slomp, C.P.; Regnier, P.; Meile, C.; van Cappellen, P. Modelling the geochemical fate and transport of wastewater-derived phosphorus in contrasting groundwater systems. J. Contam. Hydrol. 2007, 92, 87–108. [Google Scholar] [CrossRef] [PubMed]
  22. Parker, J.C.; van Genuchten, M.T. Flux-averaged and volume-averaged concentrations in continuum approaches to solute transport. Water Resour. Res. 1984, 20, 866–872. [Google Scholar] [CrossRef]
  23. Fetter, C.W. Contaminant Transport, 2nd ed.; Waveland Press: Long Grove, IL, USA, 1999. [Google Scholar]
  24. You, K.H.; Zhan, H.B. New solutions for solute transport in a finite column with distance-dependent dispersivities and time-dependent solute sources. J. Hydrol. 2013, 487, 87–97. [Google Scholar] [CrossRef]
  25. Ogata, A.; Bank, R.B. A Solution of the Differential Equation of Longitudinal Dispersion in Porous Media; Geological Survey Professional Paper, No. 411-A; United States Government Printing Office, Washington: Washington, DC, USA, 1961. [Google Scholar]
  26. He, Z.L.; Baligar, V.C.; Martens, D.C.; Ritchey, K.D.; Kemper, W.D. Kinetics of phosphate rock dissolution in acidic soil amended with liming materials and cellulose. Soil Sci. Am. J. 1996, 60, 1589–1595. [Google Scholar] [CrossRef]
  27. MPCA. Procedures for Implementing River Eutrophication Standards in NPDES Wastewater Permits in Minnesota (Version 1.0); Minnesota Pollution Control Agency: College Road, MN, USA, 2015. [Google Scholar]
  28. Shang, G.P.; Shang, J.C. Causes and control countermeasures of eutrophication in Chaohu Lake, China. Chin. Geogr. Sci. 2005, 15, 348–354. [Google Scholar] [CrossRef]
  29. Charfi, S.; Zouari, K.; Feki, S.; Mami, E. Study of variation in groundwater quality in a coastal aquifer in north-eastern Tunisia using multivariate factor analysis. Quatern. Int. 2013, 302, 199–209. [Google Scholar] [CrossRef]
  30. Bahar, M.; Reza, S. Hydrochemical characteristics and quality assessment of shallow groundwater in a coastal area of Southwest Bangladesh. Environ. Earth Sci. 2010, 61, 1065–1073. [Google Scholar] [CrossRef]
  31. Edet, A.; Ukpong, A.; Nganje, T. Hydrochemical studies of Cross River Basin (southeastern Nigeria) river systems using cross plots, statistics and water quality index. Environ. Earth Sci. 2013, 70, 3043–3056. [Google Scholar] [CrossRef]
  32. Montcoudiol, N.; Molson, J.; Lemieux, J.M. Groundwater geochemistry of the Outaouais region (Quebec, Canada): A regional-scale study. Hydrogeol. J. 2015, 23, 377–396. [Google Scholar] [CrossRef]
  33. Garcia, J.H.; Li, W.W.; Arimoto, R.; Okrasinski, R.; Greenlee, J.; Walton, J.; Schloesslin, C.; Sage, S. Characterization and implication of potential fugitive dust sources in the Paso del Norte region. Sci. Total Environ. 2004, 325, 95–112. [Google Scholar] [CrossRef] [PubMed]
  34. Liu, C.W.; Lin, K.H.; Kuo, Y.M. Application of factor analysis in the assessment of groundwater quality in a blackfoot disease area in Taiwan. Sci. Total Environ. 2003, 313, 77–89. [Google Scholar] [CrossRef] [PubMed]
  35. Dragon, K. Application of factor analysis to study contamination of a semi-confined aquifer (Wielkopolska Buried Valley aquifer, Poland). J. Hydrol. 2006, 331, 272–279. [Google Scholar] [CrossRef]
  36. Jeong, C.H. Effect of land use and urbanization on hydrochemistry and contamination of groundwater from Taejon area, Republic of Korea. J. Hydrol. 2001, 253, 194–210. [Google Scholar] [CrossRef]
  37. Cronin, A.A.; Taylor, R.G.; Powell, K.L.; Barrett, M.H.; Trowsdale, S.A.; Lerner, D.N. Temporal variations in the depth-specific hydrochemistry and sewage-related microbiology of an urban sandstone aquifer, Nottingham, United Kingdom. Hydrogeol. J. 2003, 11, 205–216. [Google Scholar] [CrossRef]
  38. Choi, B.Y.; Yun, S.T.; Yu, S.Y.; Lee, P.K.; Park, S.S.; Chae, G.T.; Mayer, B. Hydrochemistry of urban groundwater in Seoul, Republic of Korea: Effects of land-use and pollutant recharge. Environ. Geol. 2005, 48, 979–990. [Google Scholar] [CrossRef]
  39. Han, D. Foundation of Chemical Kinetics; Beijing University Press: Beijing, China, 1987; pp. 1–8. (In Chinese) [Google Scholar]
  40. Hu, H.X. Study on the Transportation Process and Regularity of Soil and Water in Middle-Eastern Section of the North Shore of Lake Chaohu; Hefei University and Technology: Hefei, China, 2008; pp. 18–22. (In Chinese) [Google Scholar]
  41. Neal, C.; Heathwaite, A.L. Nutrient mobility within river basins: A European perspective. J. Hydrol. 2005, 304, 477–490. [Google Scholar] [CrossRef]
  42. Neal, C.; Jarvie, H.P. Agriculture, community, river eutrophication and the water framework directive. Hydrol. Process 2005, 19, 1895–1901. [Google Scholar] [CrossRef]
  43. Qian, J.Z.; Wang, L.L.; Zhan, H.B.; Chen, Z. Urban land-use effects on groundwater phosphate distribution in a shallow aquifer, Nanfei River basin, China. Hydrogeol. J. 2011, 19, 1431–1442. [Google Scholar] [CrossRef]
  44. Li, S.N. The Influence of Phosphorus in the Rock on Eutrophication in Chaohu Lake in the Phoenix Area; Hefei University and Technology: Hefei, China, 2012; pp. 19–20. (In Chinese) [Google Scholar]
  45. Yang, Y.; Guo, T.; Jiao, W. Destruction processes of mining on water environment in the mining area combining isotopic and hydrochemical tracer. Environ. Pollut. 2018, 237, 356–365. [Google Scholar] [CrossRef] [PubMed]
  46. Yang, Y.; Meng, Z.; Jiao, W. Hydrological and pollution processes in mining area of Fenhe River Basin in China. Environ. Pollut. 2018, 234, 743–750. [Google Scholar] [CrossRef] [PubMed]
  47. He, Z.L.; Baligar, V.C.; Martens, D.C.; Ritchey, K.D.; Elrashidi, M. Effect of byproduct, nitrogen fertilizer, and zeolite on phosphate rock dissolution and extractable phosphorus in acid soil. Plant Soil 1999, 208, 199–207. [Google Scholar] [CrossRef]
  48. Katsev, S.; Tsandev, I.; L’Heureux, I.; Rancourt, D.G. Factors controlling long-term phosphorus efflux from lake sediments: Exploratory reactive-transport modeling. Chem. Geol. 2006, 234, 127–147. [Google Scholar] [CrossRef]
  49. Kulabako, N.R.; Nalubega, M.; Thunvik, R. Phosphorus transport in shallow groundwater in peri-urban Kampala, Uganda: Results from field and laboratory measurements. Environ. Geol. 2008, 53, 1535–1551. [Google Scholar] [CrossRef]
  50. Bedore, P.D.; David, M.B.; Stucki, J.W. Mechanisms of phosphorus control in urban streams receiving sewage effluent. Water Air Soil Poll. 2008, 191, 217–229. [Google Scholar] [CrossRef]
  51. Solim, S.U.; Wanganeo, A. Factors influencing release of phosphorus from sediments in a high productive polymictic lake system. Water Sci. Technol. 2009, 60, 1013–1023. [Google Scholar] [CrossRef]
  52. Juo, A.S.R.; Adams, F.F. Chemistry of LAC soils. In Soil Management Support Services Technical Monograph No. 14. Soil Conservation Service, Proceedings of the Symposium in Low Activity Clay (LAC) Soils, Las Vegas, NV, USA, 26–30 November 1984; United Nations: Washington, DC, USA, 1986. [Google Scholar]
  53. Van der Grift, B.; Rozemeijer, J.C.; Griffioen, J.; van der Velde, Y. Iron oxidation kinetics and phosphate immobilization along the flow-path from groundwater into surface water. Hydrol. Earth Syst. Sci. 2014, 18, 4687–4702. [Google Scholar] [CrossRef]
  54. Moller, J.; Mogensen, T. Use of an ion-exchanger for determining available phosphorus in soils. Soil Sci. 1953, 76, 297–306. [Google Scholar] [CrossRef]
  55. Chien, S.H.; Hammond, L.L. A simple chemical method for evaluating the agronomic potential of granulated phosphate rock. Soil Sci. Soc. Am. J. 1978, 42, 615–617. [Google Scholar] [CrossRef]
  56. Lai, T.M.; Eberl, D.D. Controlled and renewable release of phosphorus in soils from mixtures of phosphate rock and NH4-exchanged clinoptilolite. Zeolites 1986, 6, 129–132. [Google Scholar] [CrossRef]
  57. Li, Y.H.; Gregory, S. Diffusion of ions in sea water and in deep-sea sediments. Geochim. Cosmochim. Acta 1974, 38, 703–714. [Google Scholar]
  58. Pett-Ridge Julie, C. Contributions of dust to phosphorus cycling in tropical forests of the Luquillo Mountains, Purto Rico. Biogeochemistry 2009, 94, 63–80. [Google Scholar] [CrossRef]
Figure 1. Geological features of the Chaohu Lake Catchment and the location of the groundwater and rock samples.
Water 16 00244 g001
Figure 2. Experimental procedures assessing the phosphorus release from the rock in the Chaohu Lake Catchment.
Water 16 00244 g002
Figure 3. Iso-concentration map of groundwater total phosphorus (in mg/L) and the sampling points of groundwater, surface water, soil, and rock in the North Chaohu Lake Catchment.
Water 16 00244 g003
Figure 4. Distribution of factor scores for (a) Factor 1, (b) Factor 2, (c) Factor 3, and (d) Factor 4.
Water 16 00244 g004aWater 16 00244 g004bWater 16 00244 g004c
Figure 5. The cumulative concentrations of Oslen P released from 12 samples in the Chaohu Lake Catchment over time.
Water 16 00244 g005
Figure 6. The BTCs of the experimental phosphorus concentration from 12 samples in the Chaohu Lake Catchment. The red points represent the experimental data, and the blue circles represent the calculated values. (1) Sample 1; (2) sample 2; (3) sample 3; (4) sample 4; (5) sample 5; (6) sample 6; (7) sample 7; (8) sample 8; (9) sample 9; (10) sample 10; (11) sample 11; and (12) sample 12.
Water 16 00244 g006aWater 16 00244 g006b
Figure 7. The best-fitting curves of the experimental phosphorus release rate from 12 samples in the Chaohu Lake Catchment. The red points represent the experimental data, and the blue circles represent the calculated values. (1) Sample 1; (2) sample 2; (3) sample 3; (4) sample 4; (5) sample 5; (6) sample 6; (7) sample 7; (8) sample 8; (9) sample 9; (10) sample 10; (11) sample 11; and (12) sample 12.
Water 16 00244 g007aWater 16 00244 g007b
Table 1. Factor loadings, eigenvalues, and the percent of explained variance after varimax rotation.
ParameterFactor 1Factor 2Factor 3Factor 4
TDS 0.9540.1120.046−0.104
NO30.949−0.0310.1450.005
SO42−0.939−0.0870.0360.049
Cl0.6970.379−0.056−0.001
Mg2+−0.0320.9450.093−0.130
Na+−0.0330.9350.092−0.123
Ca2+0.2970.8530.0350.052
TP 0.0280.0080.9580.068
K+0.1030.1690.9330.009
F−0.0530.0570.0600.914
pH0.021−0.2370.0140.873
Eigenvalues3.2812.7471.8371.650
% of variance29.8324.9816.7015.00
Table 2. Correlation matrix of the geochemical parameters of groundwater samples collected at the North Chaohu Lake Catchment.
ParametersTPNO3SO42−Na+K+Mg2+Ca2+TDSClFpH
TP1.000
NO30.1851.000
SO42−0.0490.8851.000
Na+0.087−0.028−0.0661.000
K+0.8190.1880.1170.2221.000
Mg2+0.055−0.039−0.1000.9070.2651.000
Ca2+0.1020.2720.1960.7260.1580.7271.000
TDS0.0490.9060.8710.0970.1650.1120.3691.000
Cl−0.0310.5580.5170.2520.1380.3000.4550.6341.000
F0.112−0.030−0.012−0.0620.071−0.0760.049−0.135−0.0011.000
pH0.0640.0260.091−0.303−0.010−0.298−0.148−0.086−0.1100.6211.000
Table 3. The total phosphorus content (TP), bulk density (ρb ), the estimated values of Dx and A, two parameters used in the Langmuir kinetic equation (k and Cmax), and the Pearson correlation coefficients of P desorption (r1, r2, r3).
Sample
ID
TP
(mg/kg)
ρb
(kg/L)
ADx
(cm2/s)
kCmax
(mg/L)
r1r2r3
1852.589.26 × 10−21.58 × 10−45.84 × 10−318.490.9900.9430.997
2862.3710.23 × 10−21.31 × 10−45.15 × 10−318.710.9950.9720.995
3732.617.32 × 10−21.20 × 10−44.83 × 10−312.400.9940.9870.990
4992.477.37 × 10−23.02 × 10−410.21 × 10−316.650.9780.9040.990
5812.687.94 × 10−22.99 × 10−410.28 × 10−315.870.9810.9120.992
6912.215.24 × 10−24.48 × 10−411.40 × 10−310.500.9570.8600.983
7912.395.47 × 10−22.94 × 10−49.70 × 10−311.040.9740.8940.988
81132.497.56 × 10−21.00 × 10−43.83 × 10−319.270.9970.9800.997
935,3902.380.81 × 10−41.54 × 10−46.02 × 10−36.130.9940.9650.995
1034,3902.231.47 × 10−41.21 × 10−44.70 × 10−310.190.9950.9710.997
1117,5902.311.79 × 10−42.07 × 10−47.40 × 10−36.650.9860.9280.996
1213,9902.222.5 × 10−40.96 × 10−43.69 × 10−37.010.9970.9870.995
Disclaimer/Publisher’s Note: The statements, opinions and data contained in all publications are solely those of the individual author(s) and contributor(s) and not of MDPI and/or the editor(s). MDPI and/or the editor(s) disclaim responsibility for any injury to people or property resulting from any ideas, methods, instructions or products referred to in the content.

