Abstract
Iron-containing minerals are key factors controlling arsenic (As) transport in groundwater environments. However, few studies have observed the effect of aqueous Fe [Fe(aq)] on As behavior in a water environment. In this study, river sand in the riparian zone was collected for batch experiments to analyze the effect of Fe(aq) on the adsorption of As on river sand, utilizing characterization analyses to identify the reaction mechanism. The results showed that (1) as the concentration of Fe(aq) in the reaction system increased from 0.1 to 20 mg/L, the equilibrium adsorption capacity (Qe) of river sand for As(III) and As(V) gradually increased. For concentrations of Fe(aq) equal to or greater than 1 mg/L, the Qe for As(V) exceeds that for As(III), whereas at a Fe(aq) concentration of 0.1 mg/L, the Qe for As(III) is higher than that for As(V). (2) Compared to the reaction system without added Fe(aq), the adsorption of As(V) onto river sand was inhibited, while the adsorption of As(III) was enhanced under conditions with low concentrations (0.1, 1 mg/L) of Fe(aq). (3) At higher Fe(aq) concentrations (5, 20 mg/L), the adsorption of both As(V) and As(III) by river sand was more effective than in systems without Fe(aq). Characterization tests confirmed this, while Fe(II) reduced As(V), and Fe(aq) adhered to the surface of river sand to form Fe(OH)3 colloids, thereby facilitating the adsorption of As onto river sand.
1. Introduction
Arsenic (As) contamination in water bodies has emerged as a significant issue for global environmental protection and public health [1,2], with studies showing that countries worldwide suffer from As pollution to varying degrees. Asian countries, especially Bangladesh, India, China, and Vietnam, are among the regions that are most severely affected by As pollution. In aquatic environments, As primarily exists in inorganic forms, represented by arsenites (As(III)) and arsenates (As(V)) [3]. Long-term consumption of water with high As levels can lead to chronic poisoning and various diseases, including gangrene (known as “Blackfoot disease” in China), skin, bladder, liver, lung, and bronchial cancers, and the growth of malignant tumors [4,5]. As a result, extensive research has been conducted on the source, distribution, migration/transformation behavior, and mechanisms of As in the environment to provide reliable theoretical guidance for the management of high-As groundwater.
The distribution, migration, and transformation of As in groundwater are controlled by numerous factors, mainly due to the interactions between Fe-bearing minerals and As. During the rainy season, the rapid rise in groundwater levels can lead to a stronger reductive environment. As a result, particulate Fe in the aquifer media may undergo reductive dissolution, with the adsorbed particulate As(V) transforming into more mobile As(III), causing a rapid increase in the concentrations of dissolved As and Fe. However, after the rainy season, the concentration of As in the water will decrease, as the water level gradually decreases and the oxidative environment strengthens [6,7]. Numerous studies have confirmed that the reductive dissolution of Fe-bearing minerals can release a large amount of As into the groundwater, thus leading to the formation of high-As groundwater (>10 μg/L) [8,9]. Winde and Jacobus van der Walt [10] conducted field experiments in the Witwatersrand basin of South Africa and found that when reductive groundwater was mixed with oxidative surface water, reductive Fe and Mn in the surface water oxidized and precipitated. However, the precipitated or colloidal Fe and manganese oxides acted as strong adsorbents to immobilize As, resulting in reduced As concentrations in groundwater [11]. Nagorski and Moore [12] studied the migration and transformation of Fe and As elements in the riparian zones of western Montana and found that when the pH and redox potential in the groundwater of the hyporheic zone increased, the adsorption capacity of Fe and manganese oxides for As was enhanced. This indicated that in areas with strong interactions between groundwater and surface water, alternating changes in redox conditions will often lead to complex transformations and interactions between As and Fe.
To obtain deeper insights into the impact of Fe-bearing minerals on As behavior, studies have extensively investigated the adsorption characteristics and mechanisms of various natural or synthetically produced Fe-containing minerals for different forms of As, such as zero-valent Fe [13], goethite [14], magnetite [15,16], and hematite [17]. In addition, some studies have focused on the transformation and redistribution of As species during interactions between Fe minerals and As under different hydro-chemical conditions. For example, Ona-Nguema et al. [18] discovered that under aerobic conditions and in the presence of Fe(II), magnetite and ferrihydrite oxidized As(III) to As(V), which was subsequently adsorbed onto Fe (hydro) oxides. Notably, the interaction between Fe oxides and As would inevitably cause changes in the speciation and distribution of Fe in the aquatic environment, further affecting the migration of As in water. However, existing studies, whether in the form of field surveys or laboratory experiments, have mostly focused on the interaction processes between different Fe-bearing minerals and As, and on the changes in the solid and liquid phases of Fe and As, with few exploring the transformation of dissolved Fe (Fe(aq)) in the water environment and its impact on the interaction between As and the aquifer media.
Considering the above context, this study focused on river sand, a primary aquifer medium in riparian zones, and a typical region featuring groundwater and surface water interaction, as the reaction medium to conduct adsorption batch experiments. The investigation process was as follows. (1) We investigated the adsorption characteristics of river sand relating to As under the influence of varying concentrations of Fe(aq), including both divalent and trivalent Fe. (2) The physical and chemical changes of adsorbent materials before and after the adsorption cycles were investigated to provide more insights into how the presence and transformation of Fe(aq) affected the interaction between river sand and As. The findings may deepen our understanding of the As–Fe interaction in groundwater and its impact on As behavior.
2. Material and Methods
2.1. Reagents and Samples
The reagents used in the experimental process included sodium arsenate (Na2HAsO4·7H2O), sodium arsenite (NaAsO2), ferric chloride (FeCl3·6H2O), ferrous chloride (FeCl2·4H2O), thiourea (H2NCSNH2), and ascorbic acid (C6H8O6), which were all of analytical grades. Potassium hydroxide (KOH), sodium hydroxide (NaOH), and hydrochloric acid (HCl) were guaranteed reagent (GR) purity. The As standard solution, with a concentration of 1000 μg/mL, was purchased from the China Nonferrous Metals and Electronic Materials Analysis and Testing Center (Beijing, China).
Natural river sand was used as the reaction medium for the experiments. Samples were collected from the riparian zone of the Li River in Guilin, Guangxi Province, China, and their chemical compositions were shown in Table 1. After removing stones and other impurities and passing the sand through a 2 mm mesh sieve, the sand samples were repeatedly soaked and washed with deionized water until the conductivity stabilized (~30 μS/cm). This was followed by drying at 50 °C in a forced-air drying oven prior to later use. All experimental water consisted of ultrapure water (conductivity < 18 μS/cm), which was further degassed with nitrogen gas before it was used to prepare the As and Fe stock solutions. All solutions were prepared immediately before use.

Table 1.
River sand chemical composition.
2.2. Testing and Calculation
The kinetics experiment involved the following steps. The river sand (1.000 ± 0.001 g) was placed into a series of 50 mL plastic centrifuge tubes. Then, 40 mL of 1 mg/L As(III) or As(V) stock solution was added to each tube, and the pH was adjusted to 7. Finally, each tube was shaken for 1, 3, 5, 12, 24, 48, 72, 96, 120, 144, 168, 192, 216, and 240 h before taking the supernatant for As content determination.
The isothermal adsorption experiment was conducted as follows. River sand (1.000 ± 0.001 g) was transferred into a series of 50 mL plastic centrifuge tubes and the pH was adjusted to 7. Subsequently, 40 mL of simulated solutions was added to the tubes. These solutions contained As(III) or As(V) at concentrations of 0.5, 2, 5, 10, or 20 mg/L. The tubes were then subjected to oscillations for a duration of 200 h. Afterward, the supernatant was filtered through a 0.45 μm membrane filter to determine the As content.
The design of the Fe(aq) impact experiment is shown in Table 2. Control groups A-1 and A-2 were used to elucidate the interaction characteristics between low-concentration Fe(aq) and river sand in the absence of As, as well as the transformation of Fe(aq) between different Fe species during the interaction process. Control groups B-1 and B-2 were used to investigate the adsorption characteristics of river sand for As in the absence of Fe(aq). Test groups C-F were used to explore the impact of Fe(aq) species and concentration on the adsorption of As by river sand. The adsorption experiments involved the following steps. First, 1.00 g of river sand was weighed and placed into a 50 mL centrifuge tube, which was placed in an anaerobic glove box and then added to a series of deoxygenated Fe and As solution combinations. The tube was shaken for a total duration of 200 h while collecting the supernatant at certain time intervals. The supernatant was then filtered through a 0.45 μm filter membrane, and the concentrations of Fe(II), Fe(III), As(III), and As(V) were determined in the adsorption solution. After the adsorption experiments, river sand samples were dried at 35 °C and subjected to characterization. All of the above procedures were performed in duplicate, and the temperature was controlled at 25 ± 1 °C.
Table 2.
Experimental design.
The adsorbed amounts of As(III) and As(V) were calculated using Equation (1):
where Qt (μg/g) is the adsorption capacity per unit mass of river sand for As, C0 and Ct (mg/L) denote the As concentrations in the solution at the initial moment and at time t, respectively, V (mL) is the solution volume of the adsorption system, and m (g) is the mass of the river sand.
The equilibrium adsorption capacity of As(III) and As(V) was calculated using Equation (2):
where Qe (μg/g) represents the equilibrium adsorption capacity per unit mass of river sand for As, C0 and Ce (mg/L) denote the As concentrations in the solution at the initial moment and at the adsorption equilibrium, respectively, V (mL) is the solution volume of the adsorption system, and m (g) signifies the mass of the river sand.
When river sand reached the adsorption equilibrium for As(III) and As(V), the percentage change in the concentration of Fe(aq) in the solution was represented by ΔFe, which could be calculated using Equation (3):
where Ci and Ce represent the concentrations of Fe(aq) in the solution before the adsorption of As by river sand and at the adsorption equilibrium, respectively, where the larger the ∆Fe, the greater the percentage change in the concentration of Fe(aq), indicating a higher utilization rate of Fe(aq).
2.3. Measurements
The concentrations of As(III) and As(V) in the solution were determined using an atomic fluorescence spectrometer (AFS-933/SA-20, Beijing Jitian Instrument Co., Ltd., Beijing, China) with a limit of detection ≤0.01 mg/L, which was equipped with a hollow cathode lamp HAF-2 operating at a 36 mA current. The concentrations of Fe(II) and Fe(III) were measured by a HACH DR1900 (Hach, Loveland, CO, USA) portable spectrophotometer. The pH of the solution before and after the reaction was measured with a portable multiparameter digital analyzer (Hach-HQ30d).
The main phases of the river sand samples and their crystallinity were analyzed with an X’Pert3 multifunctional powder X-ray diffractometer (PANalytical, Almelo, The Netherlands) equipped with a Cu target (λ = 1.54056 Å), with a scanning step size of 0.026°, scanning speed of 0.65°·s−1, and scanning range of 5°–90°. The functional groups, as well as the stretching and bending vibration modes of chemical bonds, were determined using Fourier transform infrared spectroscopy (FTIR, iS10, Thermo Fisher Scientific, Waltham, MA, USA). The surface morphological characteristics and mass percentage of the contained elements were determined using a scanning electron microscope with an energy-dispersive spectrometer (SEM-EDS, JSM-7900F, JEOL Ltd., Tokyo, Japan). The changes in the surface elements and chemical bond energies were measured using an X-ray photoelectron spectrometer (XPS, ESCALAB 250Xi, Thermo Fisher Scientific, Waltham, MA, USA) with Al Ka X-ray excitation source operating at a vacuum pressure of 10−10 mbar. The survey spectra were acquired at a pass energy of 100 eV and step size of 1 eV, and the high-resolution spectra were obtained at 20 eV with a step size of 0.1 eV. The binding energy (BE) values were corrected using the C1s peak (BE = 284.8 eV).
3. Results and Discussion
3.1. Adsorption Characteristics of River Sand for As
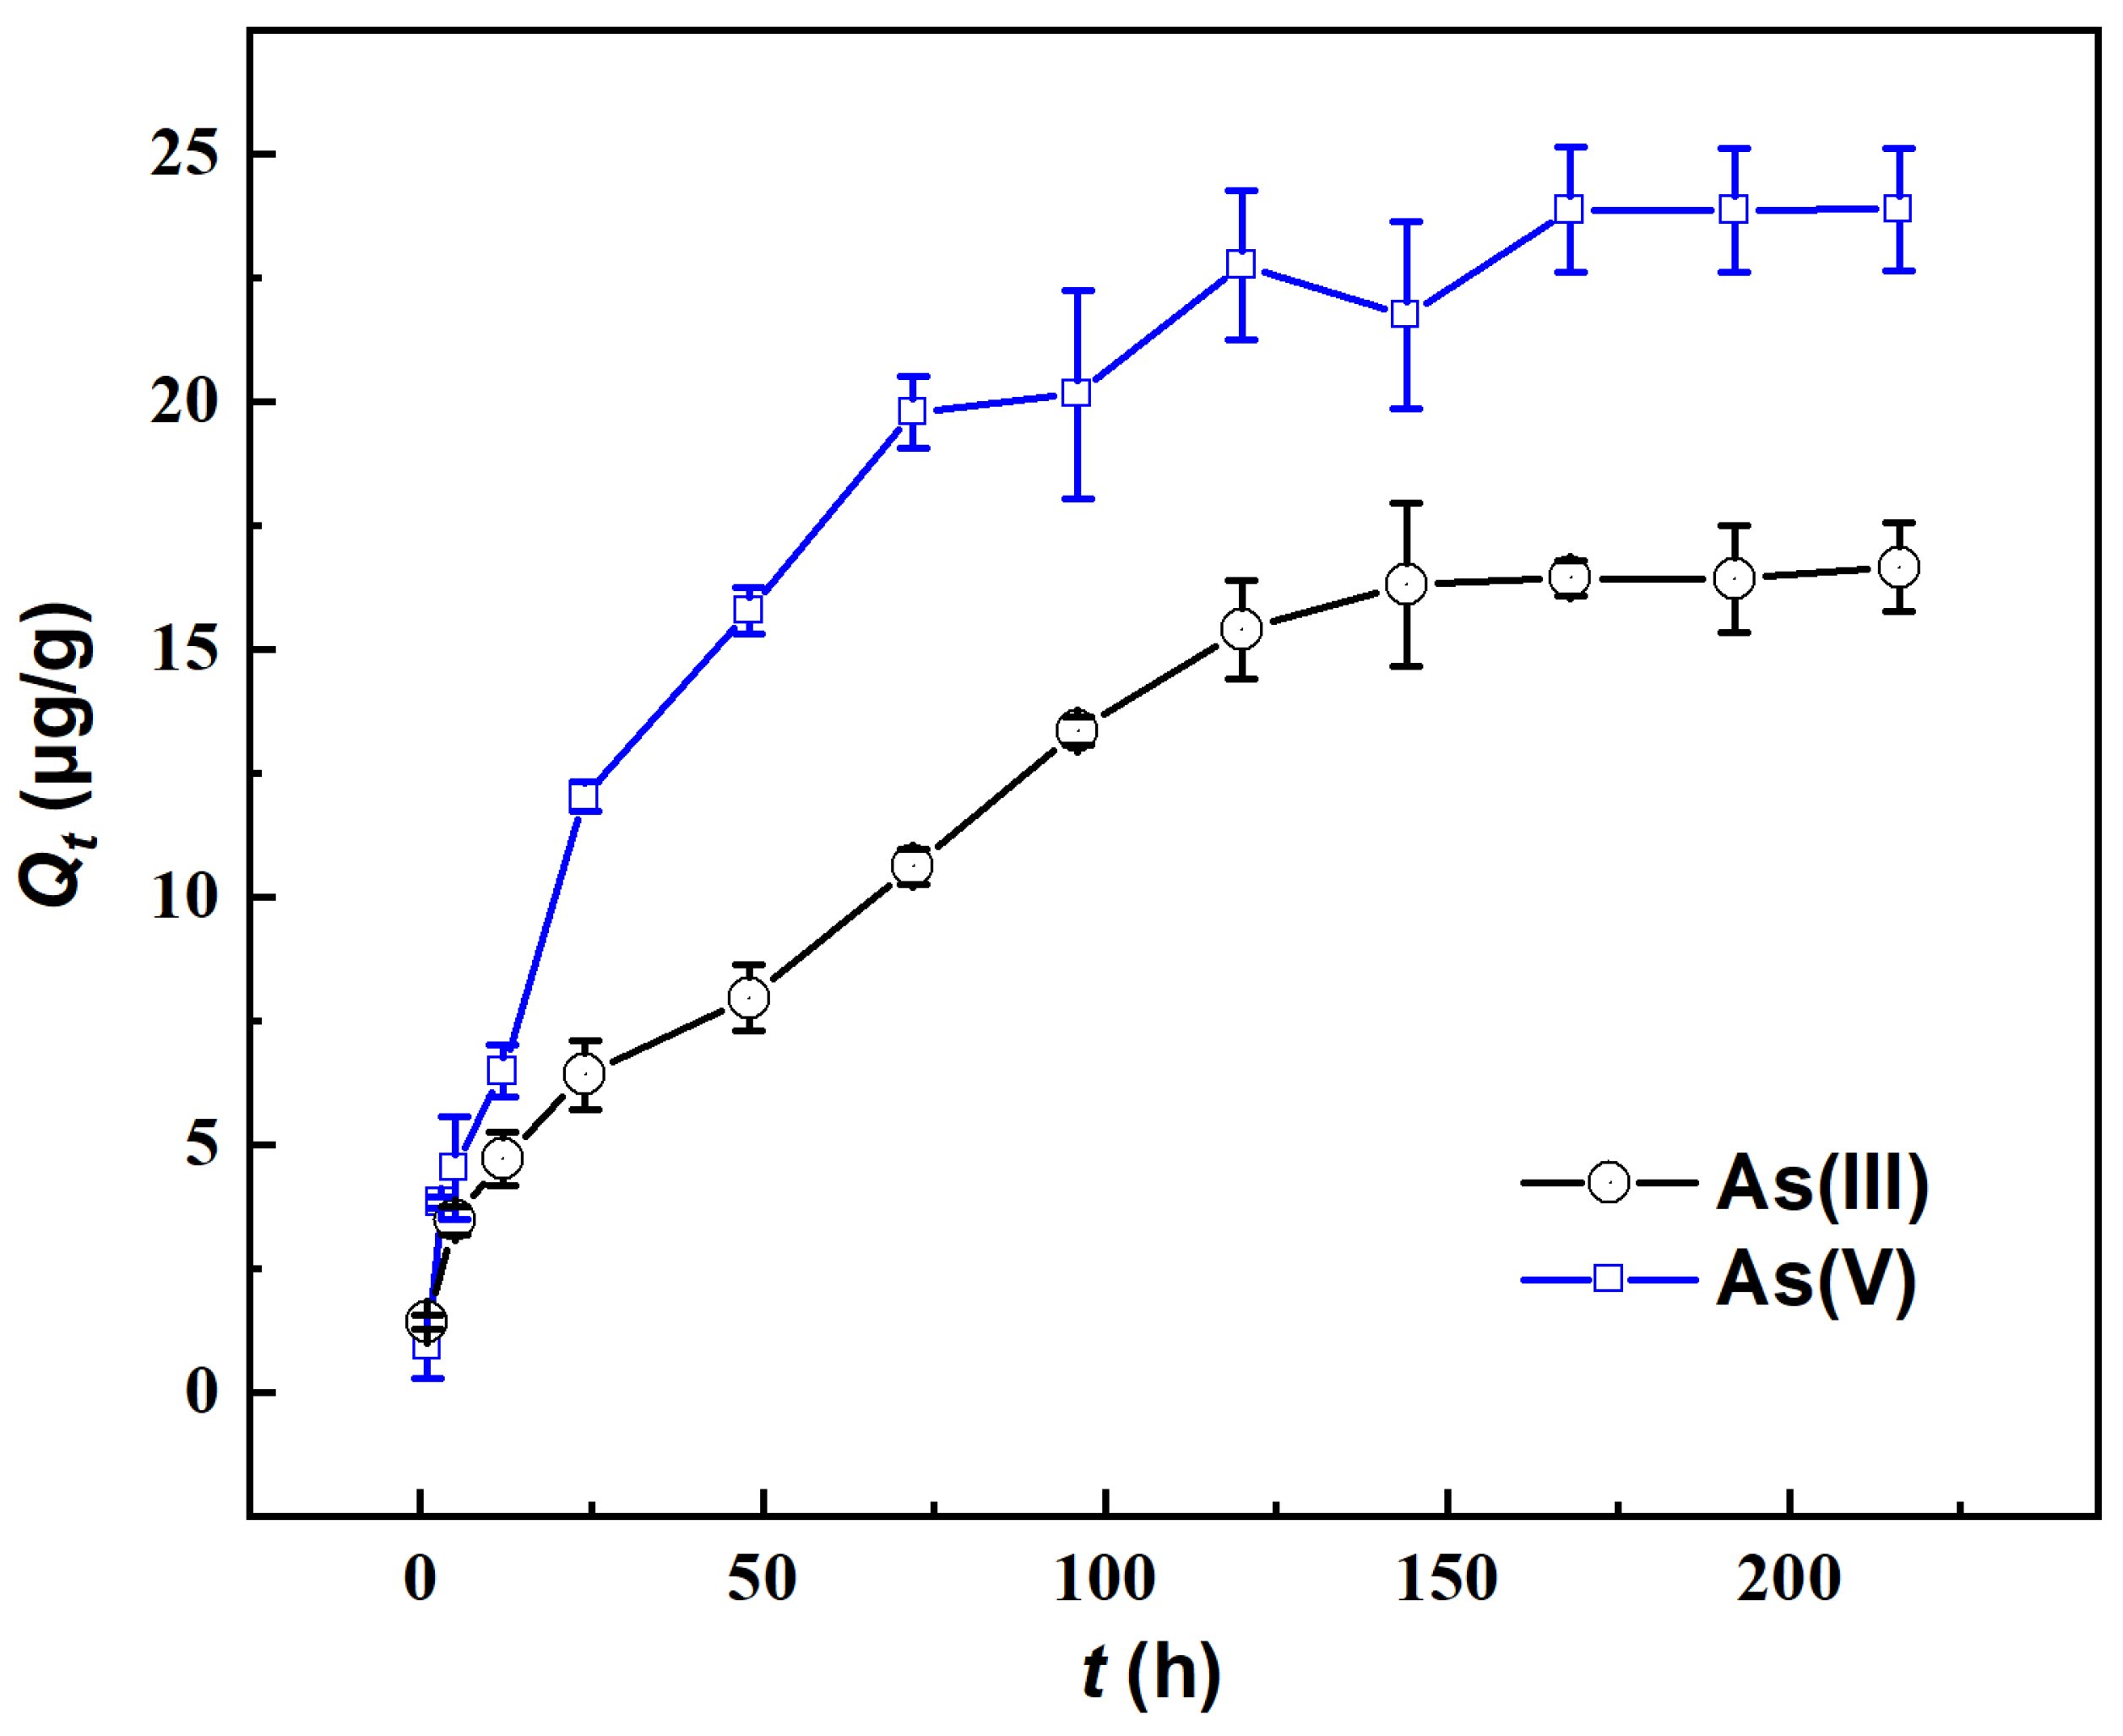
The variation in the adsorbed amount of As on river sand over time in the absence of Fe(aq) is illustrated in Figure 1. With more time, the adsorbed amount (Qt) first rapidly increased and then slowly increased to a relatively stable level, demonstrating higher values for As(V) than for As(III). Specifically, as time progressed from 0 to 96 h, the Qt of As(V) significantly increased to 20.14 μg/g, reaching approximately 84.38% of its adsorption capacity. In the period of 96–168 h, the Qt of As(V) slowly increased to 23.86 μg/g, reaching 99.94% of the adsorption capacity. After 168 h, the adsorption essentially reached equilibrium, with an adsorption capacity of approximately 23.87 μg/g. For As(III), the value of Qt rapidly increased within 0–120 h, reaching 92.44% of the adsorption capacity, while after 144 h, it slowly increased until 168 h when the adsorption equilibrium was reached. Notably, an order of As(V) ≤ As(III) in Qt was observed when the reaction time was ≤5 h, while Qt was significantly higher for As(V) than for As(III) when the reaction time was ≥5 h. This indicated that in the early stages of adsorption (≤5 h), river sand adsorbed As(III) more readily, which was possibly related to the intrinsic properties of As(III). In the later stages of adsorption (≥5 h), river sand adsorbed As(V) more readily. In subsequent experiments on the impact of Fe(aq), the total adsorption time was fixed at 200 h to ensure that the adsorption equilibrium was reached.
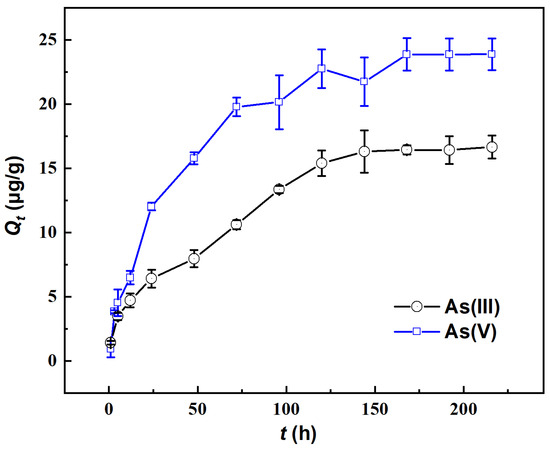
Figure 1.
Changes in the adsorption capacity (Qt) of As(III) and As(V) by river sand.
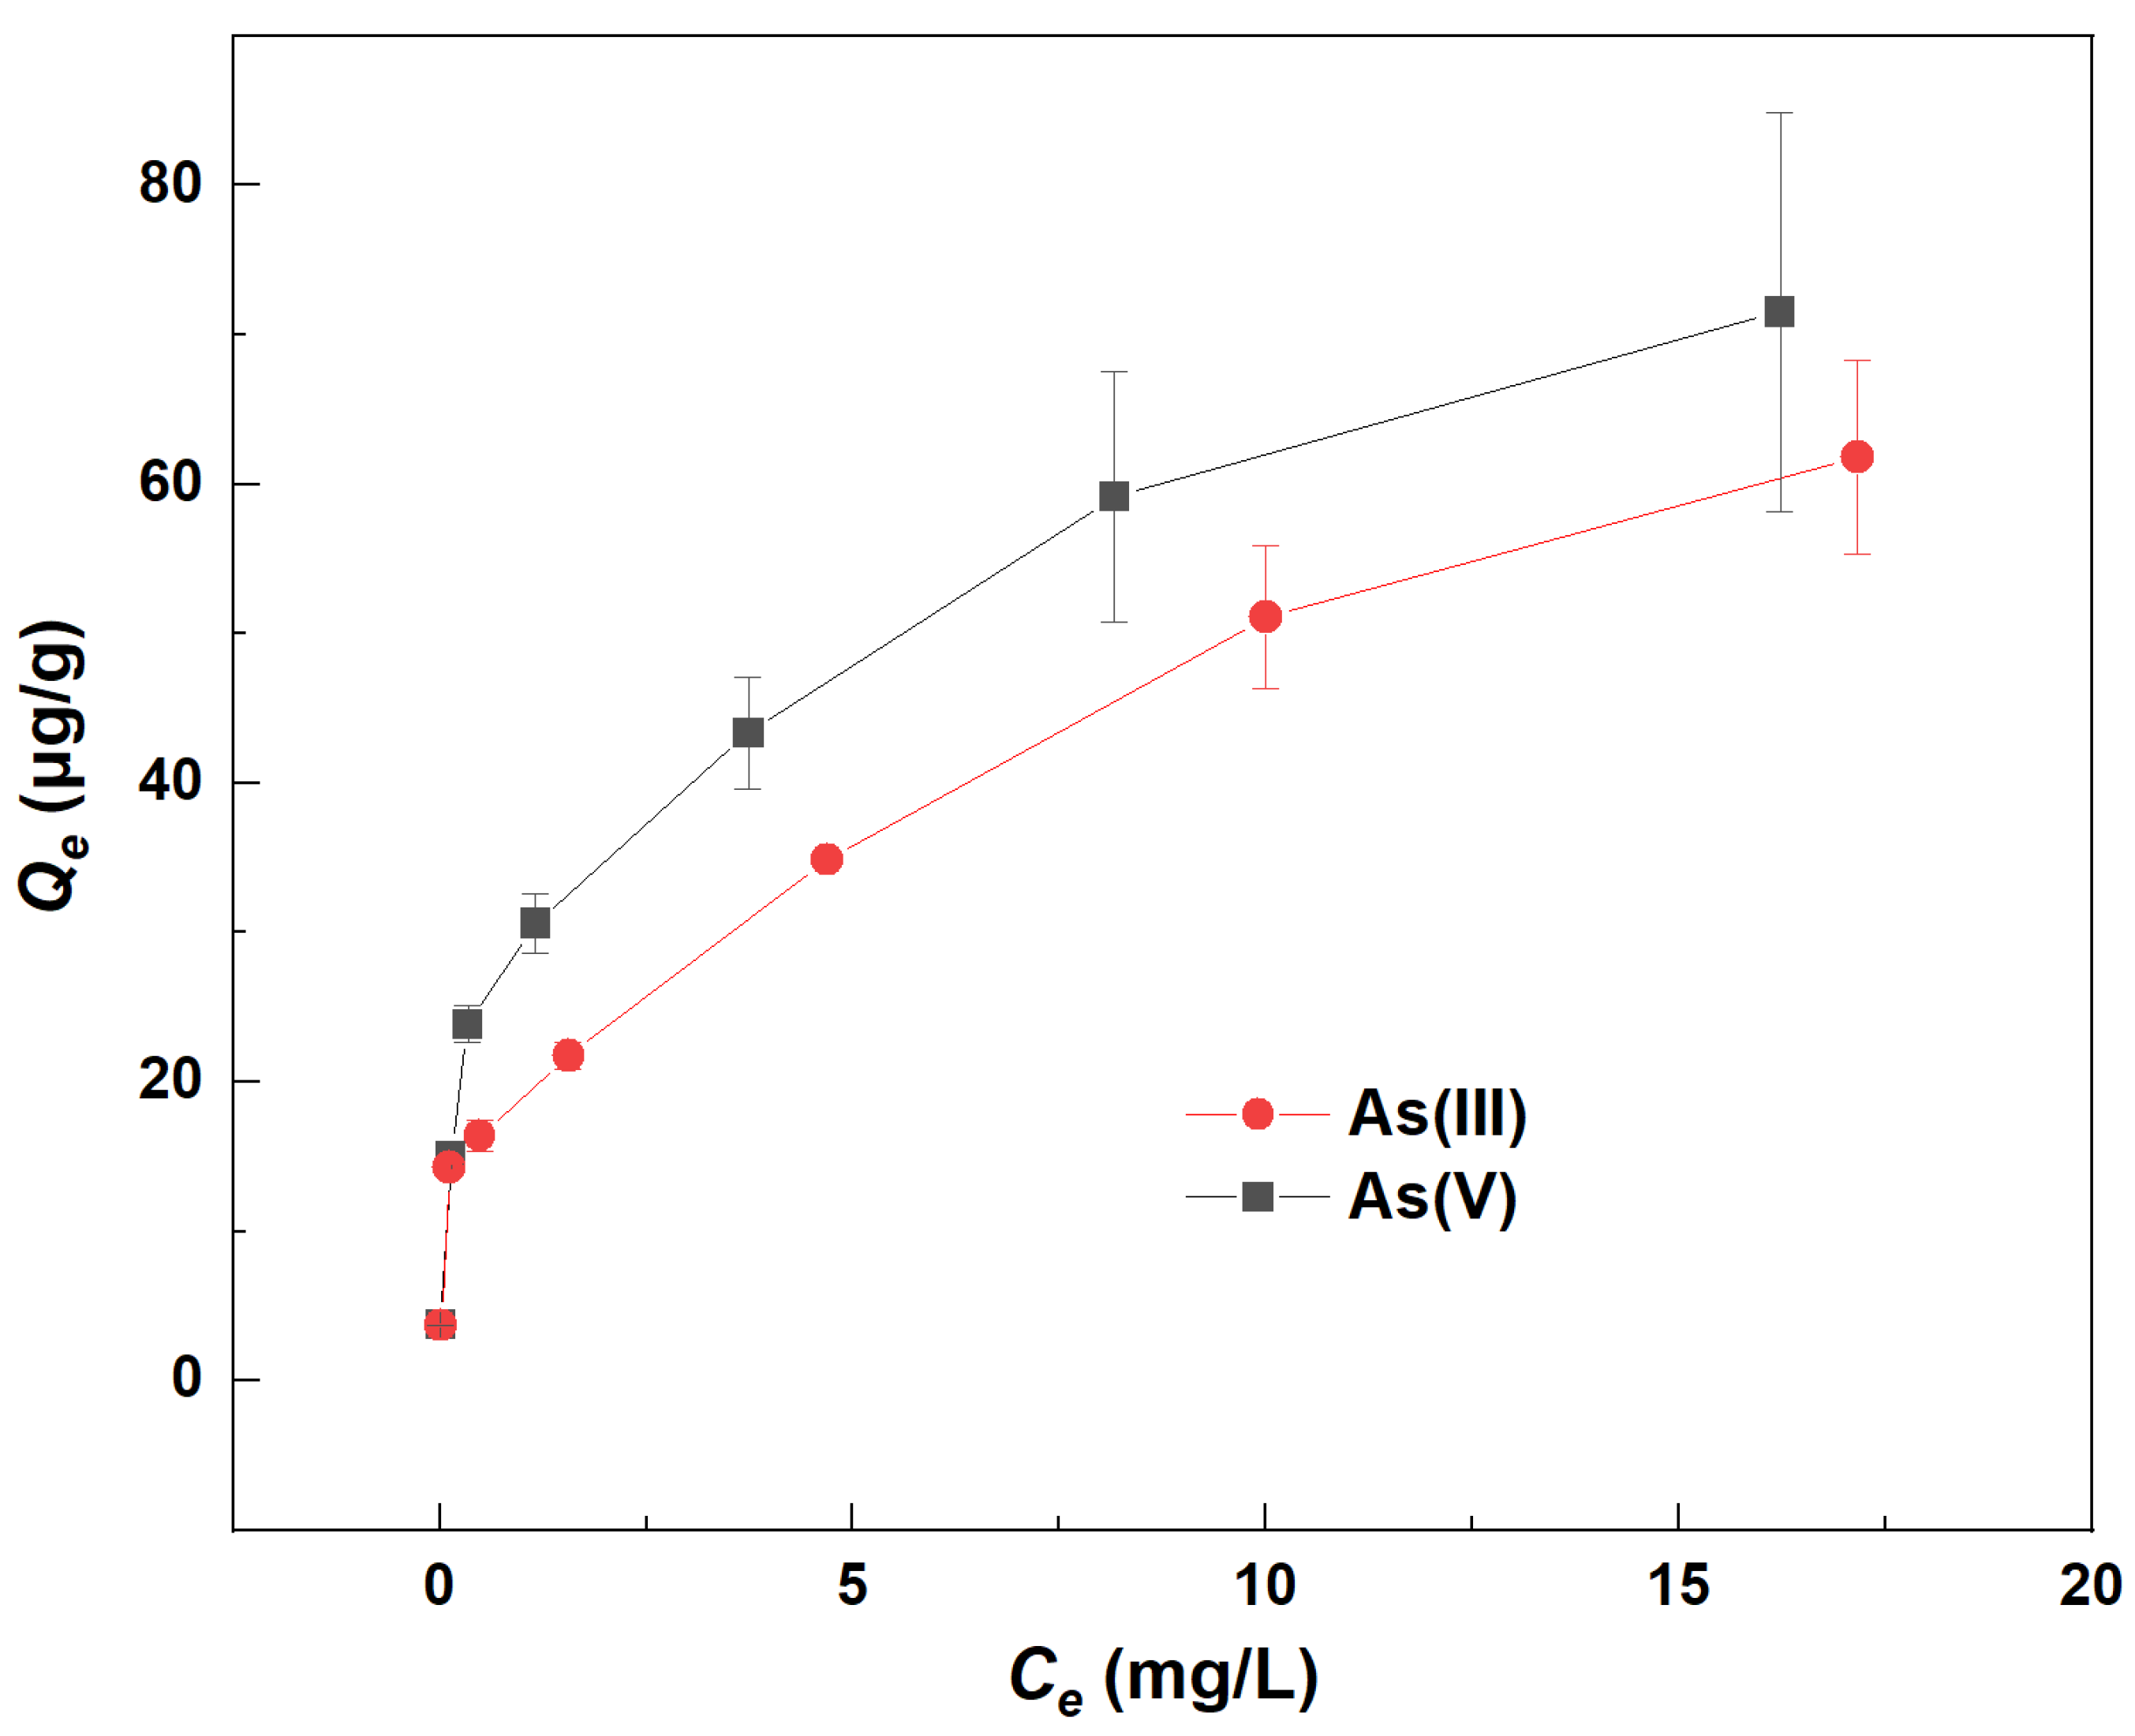
The isotherm adsorption curves of As on river sand without the addition of Fe(aq) are illustrated in Figure 2. The graph demonstrated a positive correlation between Qe and Ce for both As(III) and As(V). This indicated that as the equilibrium concentration (Ce) increased, so did the equilibrium adsorption capacity (Qe) for both forms of As. Moreover, a higher Ce indicated a greater initial concentration (Co) of As. This suggested that the adsorption of As by river sand was influenced by its initial concentration, with a positive correlation between the Co value of As and its Qe value. Consequently, an increase in the Co of As significantly enhanced its adsorption on river sand. Additionally, the Ce for As(III) was consistently higher than for As(V), while the Qe for As(V) surpassed that of As(III). This implied that river sand had a greater affinity for adsorbing As(V) over As(III). This may be attributed to the fact that Al2O3 and Fe2O3 of the sand are responsible for As adsorption and they can adsorb higher As(V) than As(III) [10].
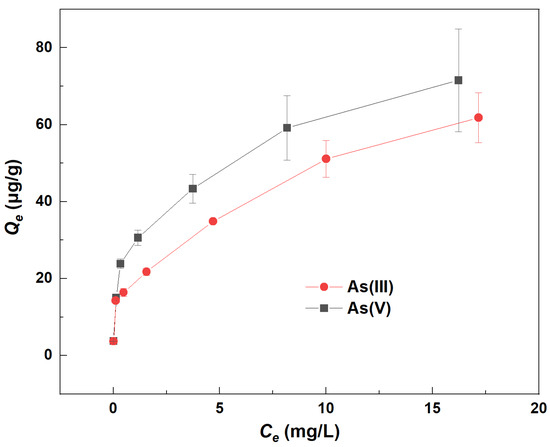
Figure 2.
Changes in the equilibrium adsorption capacity (Qe) of As(III) and As(V) by river sand.
3.2. Impact of Fe(aq) on As Absorption
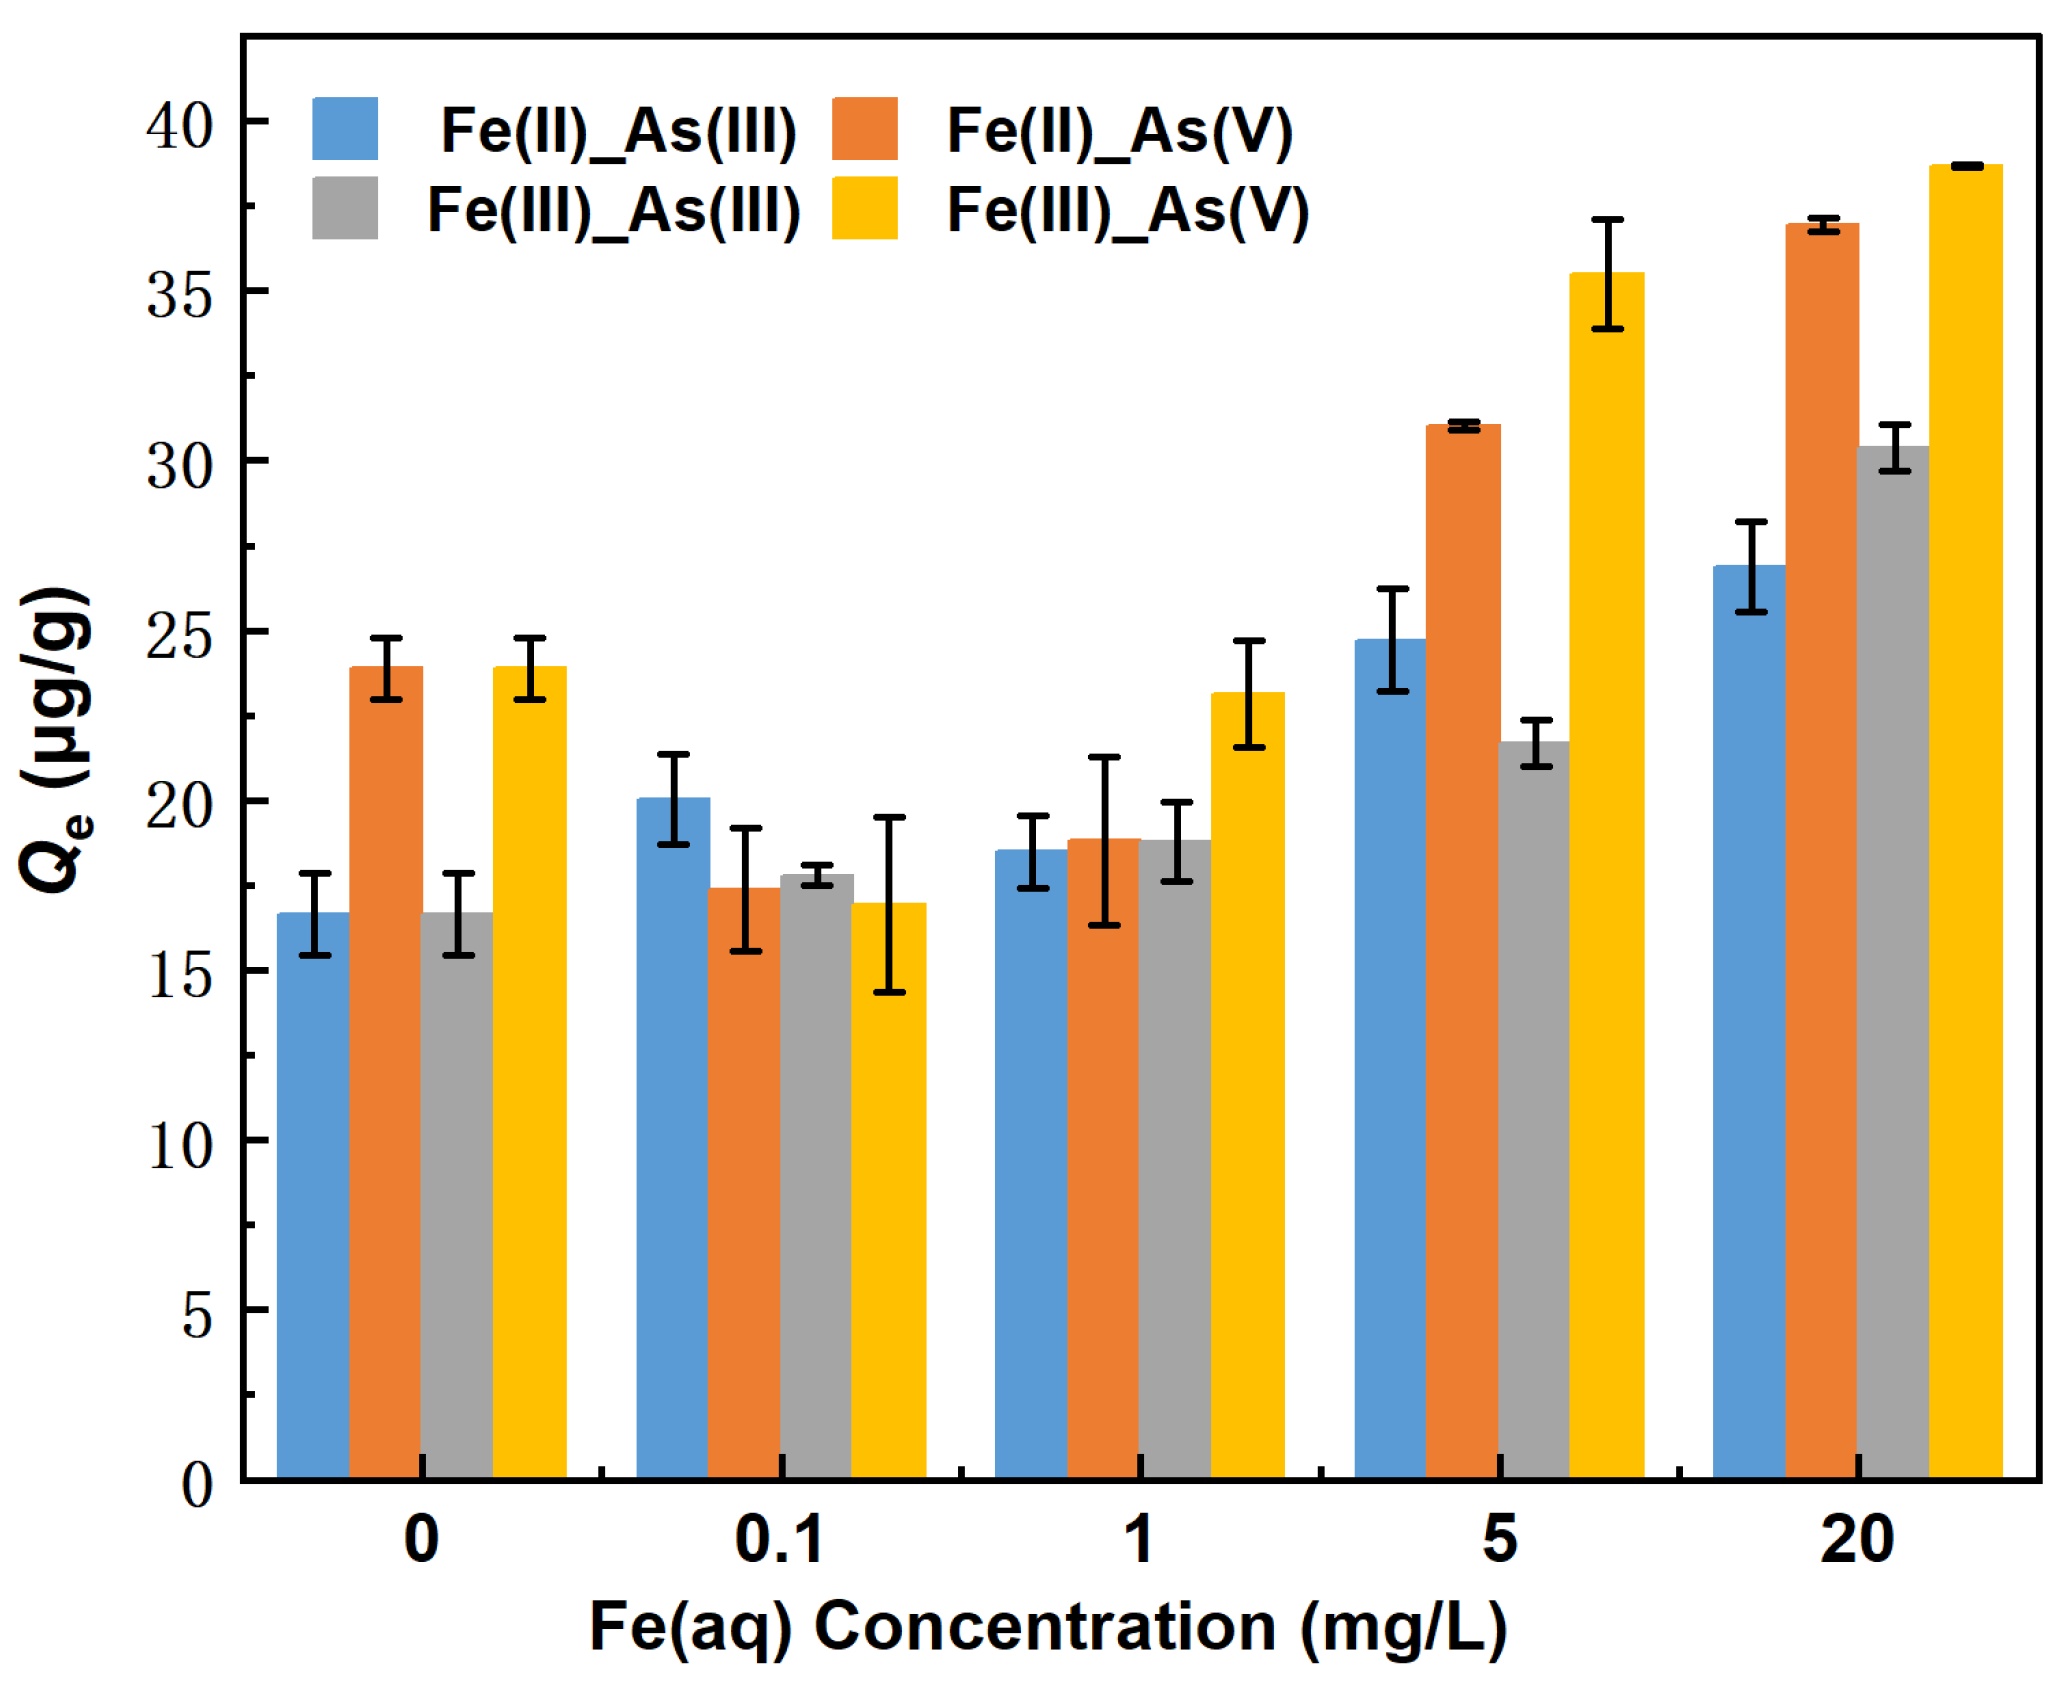
The changes in the equilibrium adsorption capacity (Qe) of river sand for As in the presence of 0–20 mg/L Fe(II) are shown in Figure 3. The Qe for As(III) decreased in the following Fe(II) concentration order: 20 mg/L > 5 mg/L > 0.1 mg/L >1 mg/L > 0 mg/L (control group). The counterpart order of Qe for As(V) was 20 mg/L > 5 mg/L > 0 mg/L (control group) > 1.0 mg/L > 0.1 mg/L. Specifically, when the Fe(II) concentrations were 5 and 20 mg/L, the Qe values of river sand for As(III) were 24.71 μg/g and 26.88 μg/g, respectively, which were 48.42% and 61.44% higher than the counterparts of the control group. The Qe of river sand for As(V) was 31.02 μg/g and 36.94 μg/g, respectively, which were 29% and 54.76% higher than the counterparts of the control group. When Fe(II) concentrations were 0.1 and 1 mg/L, the Qe of river sand for As(III) was 20.03 μg/g and 18.48 μg/g, respectively, which were higher by 20.32% and 11.01% than the counterparts of the control group. The Qe values of river sand for As(V) were 17.36 μg/g and 18.80 μg/g, respectively, which were 27.25% and 21.23% lower than the counterparts of the control group. As indicated above, Fe(II) significantly affected the adsorption of As by river sand, and, in particular, Fe(II) at concentrations ≥5 mg/L promoted the adsorption of both As(III) and As(V). This promotion effect became more noticeable with the increasing Fe(II) concentration. When Fe(II) was present low concentrations (0.1 and 1 mg/L), the adsorption of As(III) and As(V) by river sand increased and slightly decreased with the decreasing Fe(II) concentration, respectively. This was possibly related to the adsorption by the Fe (hydro) oxides, as demonstrated by Liang et al. [19], who observed that arsenites were adsorbed faster than arsenates under certain conditions. We have not identified any correlation between the variations in pH (before and after adsorption) and the changes in Fe(aq) and As(aq) in Table 3. The largest errors were observed in the 1 mg/L Fe(II)_As(V) and 0.1 mg/L Fe(III)_As(V) groups, at 2.47 μg/g and 2.56 μg/g, respectively, while the errors in the remaining experimental groups were all below 2 μg/g.

Figure 3.
Changes in the equilibrium adsorption capacity of As under different concentrations of Fe(aq).
Table 3.
pH variation.
As shown in Figure 3, the Qe values of river sand for As(III) decreased in the following order of Fe(III) concentration: 20 mg/L > 5 mg/L > 1.0 mg/L > 0.1 mg/L > 0 mg/L (control group). Moreover, the counterpart order for As(V) was 20 mg/L > 5 mg/L > 0 mg/L (control group) > 1.0 mg/L > 0.1 mg/L. Specifically, when the Fe(III) concentrations were 20 and 5 mg/L, the Qe values of river sand for As(III) were 30.37 μg/g and 21.69 μg/g, respectively, which were 82.42% and 30.29% higher than the counterparts of the control group. The Qe values for As(V) were 38.67 μg/g and 35.50 μg/g, respectively, which were 62.02% and 48.71% higher than the counterparts of the control group. When the Fe(III) concentrations were 1 and 0.1 mg/L, the Qe values of river sand for As(III) were 18.77 μg/g and 17.94 μg/g, respectively, which were 12.73% and 6.87% higher than the counterparts of the control group. The Qe values for As(V) were 23.12 μg/g and 16.94 μg/g, respectively, which were 3.14% and 29.03% lower than the counterparts of the control group. As indicated above, Fe(III) promoted the adsorption of As(III) by river sand. However, the adsorption of As(V) was influenced by the concentration of Fe(III), with high concentrations of Fe(III) (≥5 mg/L) enhancing adsorption and lower concentrations (≤1 mg/L) and weakening adsorption. The underlying processes of these observations likely occurred as follows. (1) Fe(III) formed Fe (hydro) oxides on the surface of river sand, and portions of As(V) were adsorbed through surface complexation while some of Fe(III) dissolved from the Fe (hydro) oxides into the solution. (2) The dissolved Fe(III) was re-adsorbed onto the surface of river sand, whereas additional portions of As(V) were adsorbed through surface complexation, ultimately forming surface precipitates and promoting the adsorption of As(V) by river sand [20].
The above findings indicated that Fe(aq), whether Fe(II) or Fe(III), significantly affected the adsorption capacity of river sand for As(As). At high concentrations (≥5 mg/L), Fe(aq) significantly enhanced the adsorption of both As(III) and As(V) by river sand, with the adsorption capacity for As increasing as the concentrations of Fe(II) and Fe(III) increased. In contrast, low concentrations (≤1 mg/L) of Fe(aq) only enhanced the adsorption of As(III) by river sand while inhibiting the adsorption of As(V). This suggested that the adsorption of As by river sand was possibly jointly affected by the initial concentrations of Fe(II) and As [21].
3.3. Changes in Fe(aq) Concentration
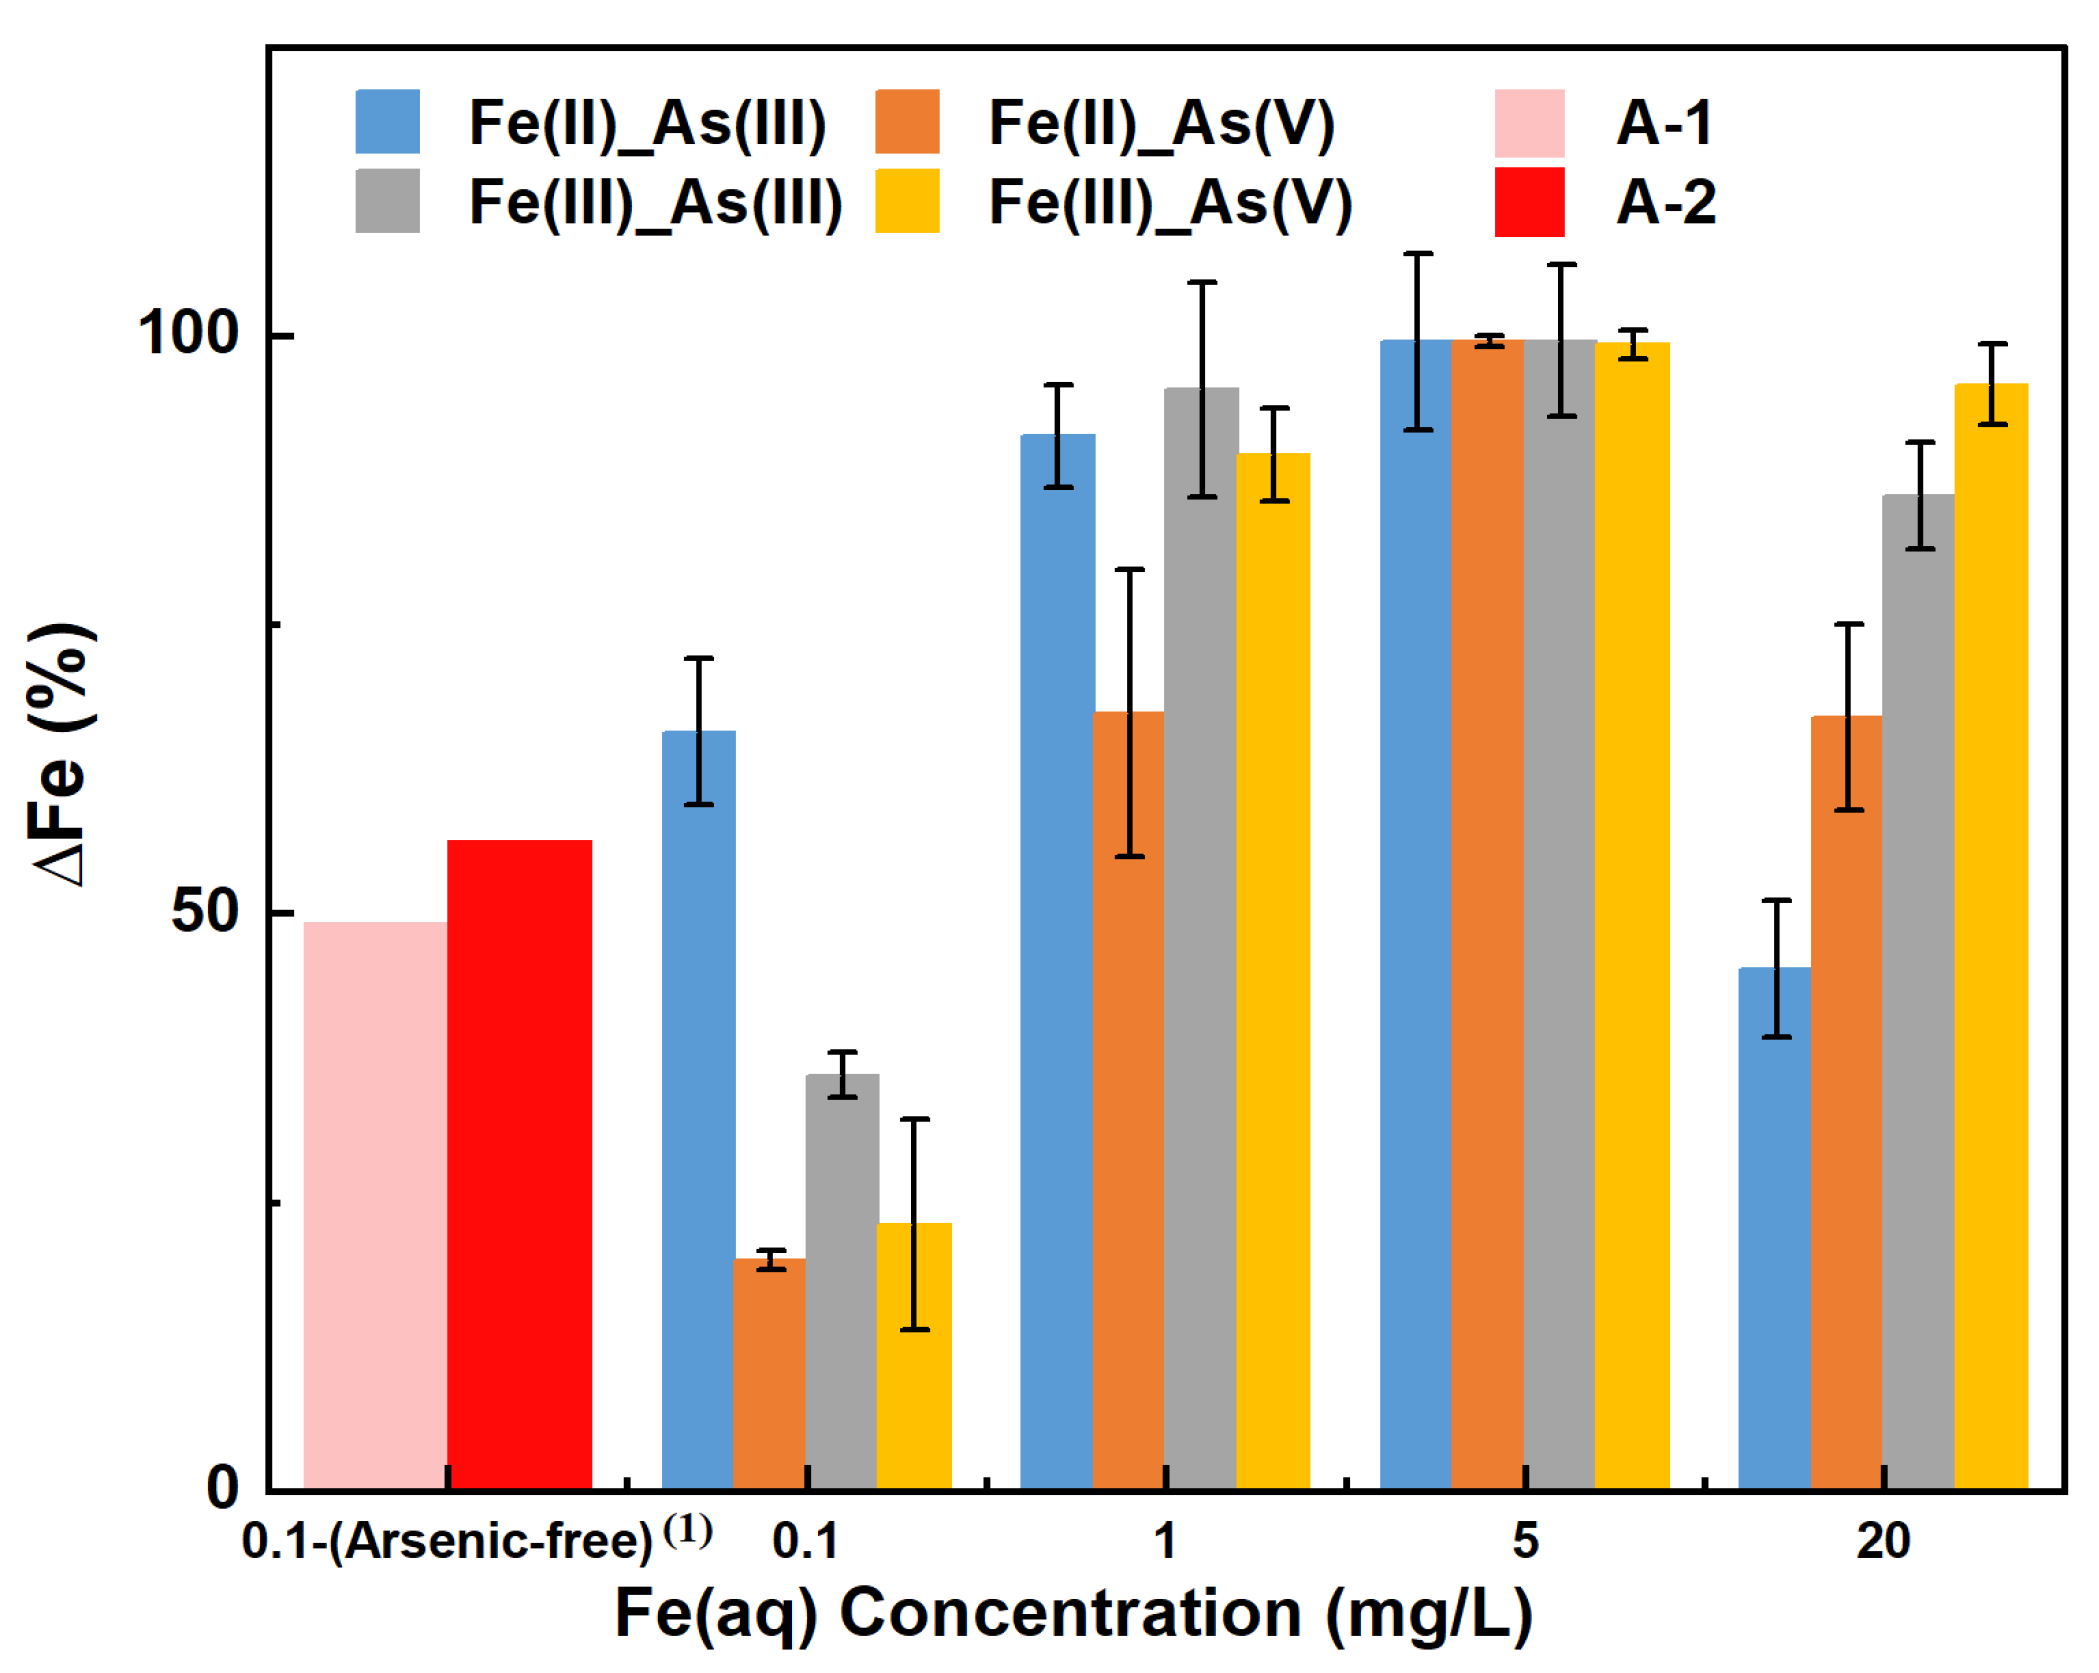
Figure 4 shows the percentage change in the Fe(aq) concentration (∆Fe, %) in each adsorption system when the adsorption of a given As adsorbate (As(III) or As(V)) by river sand reached equilibrium under varying concentrations of a given Fe(aq) species (Fe(II) or Fe(III)). Regarding As(III) adsorption in the presence of Fe(II), ∆Fe(II) decreased in the following order of initial Fe(II) concentration: 20 mg/L (45.17%) < 0.1 mg/L (65.67%) < 1 mg/L (91.33%) < 5 mg/L (99.47%). The order of As(V) adsorption was 0.1 mg/L (20.00%) < 1 mg/L (67.33%) < 20 mg/L (66.97%) < 5 mg/L (99.47%). In terms of As(III) adsorption in the presence of Fe(III), ∆Fe(III) decreased in the following order of initial Fe(III) concentration: 0.1 mg/L (36.00%) < 20 mg/L (86.17%) < 1 mg/L (95.33%) < 5 mg/L (99.53%). The order of As(V) adsorption was 0.1 mg/L (23.00%) < 1 mg/L (89.67%) < 20 mg/L (95.77%) < 5 mg/L (99.27%). These results showed that the higher the initial Fe(aq) concentration in the range of 0.1–1 mg/L, the greater the ∆Fe, indicating an increase in Fe utilization. When the initial Fe(aq) concentration was in the range of 5–20 mg/L, the higher the initial Fe(aq) concentration, the smaller the ∆Fe(aq), indicating a decrease in Fe utilization (i.e., the presence of excess Fe(aq) in the solution). The ∆Fe in all adsorption systems was greater than 0, indicating that the adsorption process led to a reduction in the dissolved Fe concentration, likely because Fe(aq) primarily formed Fe (hydro) oxide precipitates on the surface of river sand and participated in the adsorption of As. Specifically, the 5 mg/L initial concentration of Fe(aq) led to the highest ∆Fe (all above 99%), indicating a high degree of involvement of Fe(aq) in the As adsorption process on the surface of river sand. The highest errors were for the 1 mg/L Fe(II)_As(V) and 1 mg/L Fe(III)_As(III) groups, at 12.45% and 9.28%, respectively, while the errors for all other experimental groups were below 10%.

Figure 4.
∆Fe with increasing concentrations of Fe(aq) in different Fe–As–river sand reaction systems. Note: (1) Arsenic-free: the reaction system did not contain arsenic.
According to the above results, and when combined with the observations in Section 3.2, with the increasing initial Fe(aq) concentration in the range of 5–20 mg/L, the adsorption capacity of river sand for As increased, but the utilization rate of Fe decreased. It was evident that the addition of Fe(aq) promoted the adsorption of As(aq) by river sand; however, at high initial concentrations (e.g., 20 mg/L) of Fe(aq), excess Fe(aq) that could not participate in surface adsorption was present. Conversely, with the increasing initial concentration of aqueous Fe(II) in the range of 0.1–1 mg/L, the utilization rate of Fe improved, while the adsorption capacity for As(III) decreased and the adsorption capacity for As(V) increased. With the increasing initial concentration of aqueous Fe(III) in the same range as stated above, the utilization rate of Fe improved, along with an increase in the adsorption capacities for both As(III) and As(V). This indicated that at low concentrations of Fe(aq) (≤1 mg/L), the utilization rate of Fe was positively correlated with the adsorption capacity for As(V), suggesting that the presence of Fe(aq) significantly affected the adsorption of As(V) by river sand. Notably, under a low initial concentration of Fe(aq), the utilization rate of Fe(II) at the As(V) adsorption equilibrium was lower compared to Fe(III). This suggested that different Fe(aq) species affected the adsorption of As(V) in a different manner. First, As(V) was possibly reduced by aqueous Fe(II) to As(III) while oxidizing Fe(II) to Fe(III), thereby affecting the adsorption of As(V) [22]. Second, aqueous Fe(III), under certain conditions, could form Fe (hydro) oxides and in turn control the adsorption of As(V) [23]. Ji et al. [24] found that in soils from high As regions, Fe-bearing minerals primarily formed through the oxidation process of Fe ions and that this formation was also affected by the proportion of As(V) in soil solutions, especially during the precipitation stage, with a reduction in the proportion after the formation of most Fe minerals, highlighting the impact of Fe(aq) species on the formation process of Fe-bearing minerals and suggesting the importance of the formation process to As migration.
In the control groups A–1 and A–2, where the initial Fe(aq) concentration was 0.1 mg/L and As was absent, the values of ∆Fe(II) and ∆Fe(III) after 200 h of adsorption were determined to be 49.21% and 56.26%, respectively. This indicated that in the absence of As in the solution, both Fe(II) and Fe(III) could form Fe (hydro) oxides and adhere to the river sand, resulting in a decrease in Fe content in the solution. Notably, a comparison of the results of groups A–1 and A–2 vs. the results of groups C–F under the same initial concentration of Fe(aq) of 0.1 mg/L indicated that ∆Fe(II) increased in the order of Fe(II)_As(V) < control group A–1 < Fe(II)_As(III), and ∆Fe(III) increased in the order of Fe(III)_As(V) < Fe(III)_As(III) < control group A-2. Hence, under the initial condition of initial Fe(aq) = 0.1 mg/L, ∆Fe(aq) decreased in the systems of Fe(II)_As(V), Fe(III)_As(III), and Fe(III)_As(V) compared to the control groups, while it increased in the Fe(II)_As(III) system. This implied that under low initial concentrations (≤1 mg/L) of Fe(aq), the decrease in the Fe(aq) utilization rate was possibly one of the reasons for the inhibited adsorption of As(V).
3.4. Changes in the Microstructure and Surface Elemental Composition of River Sand
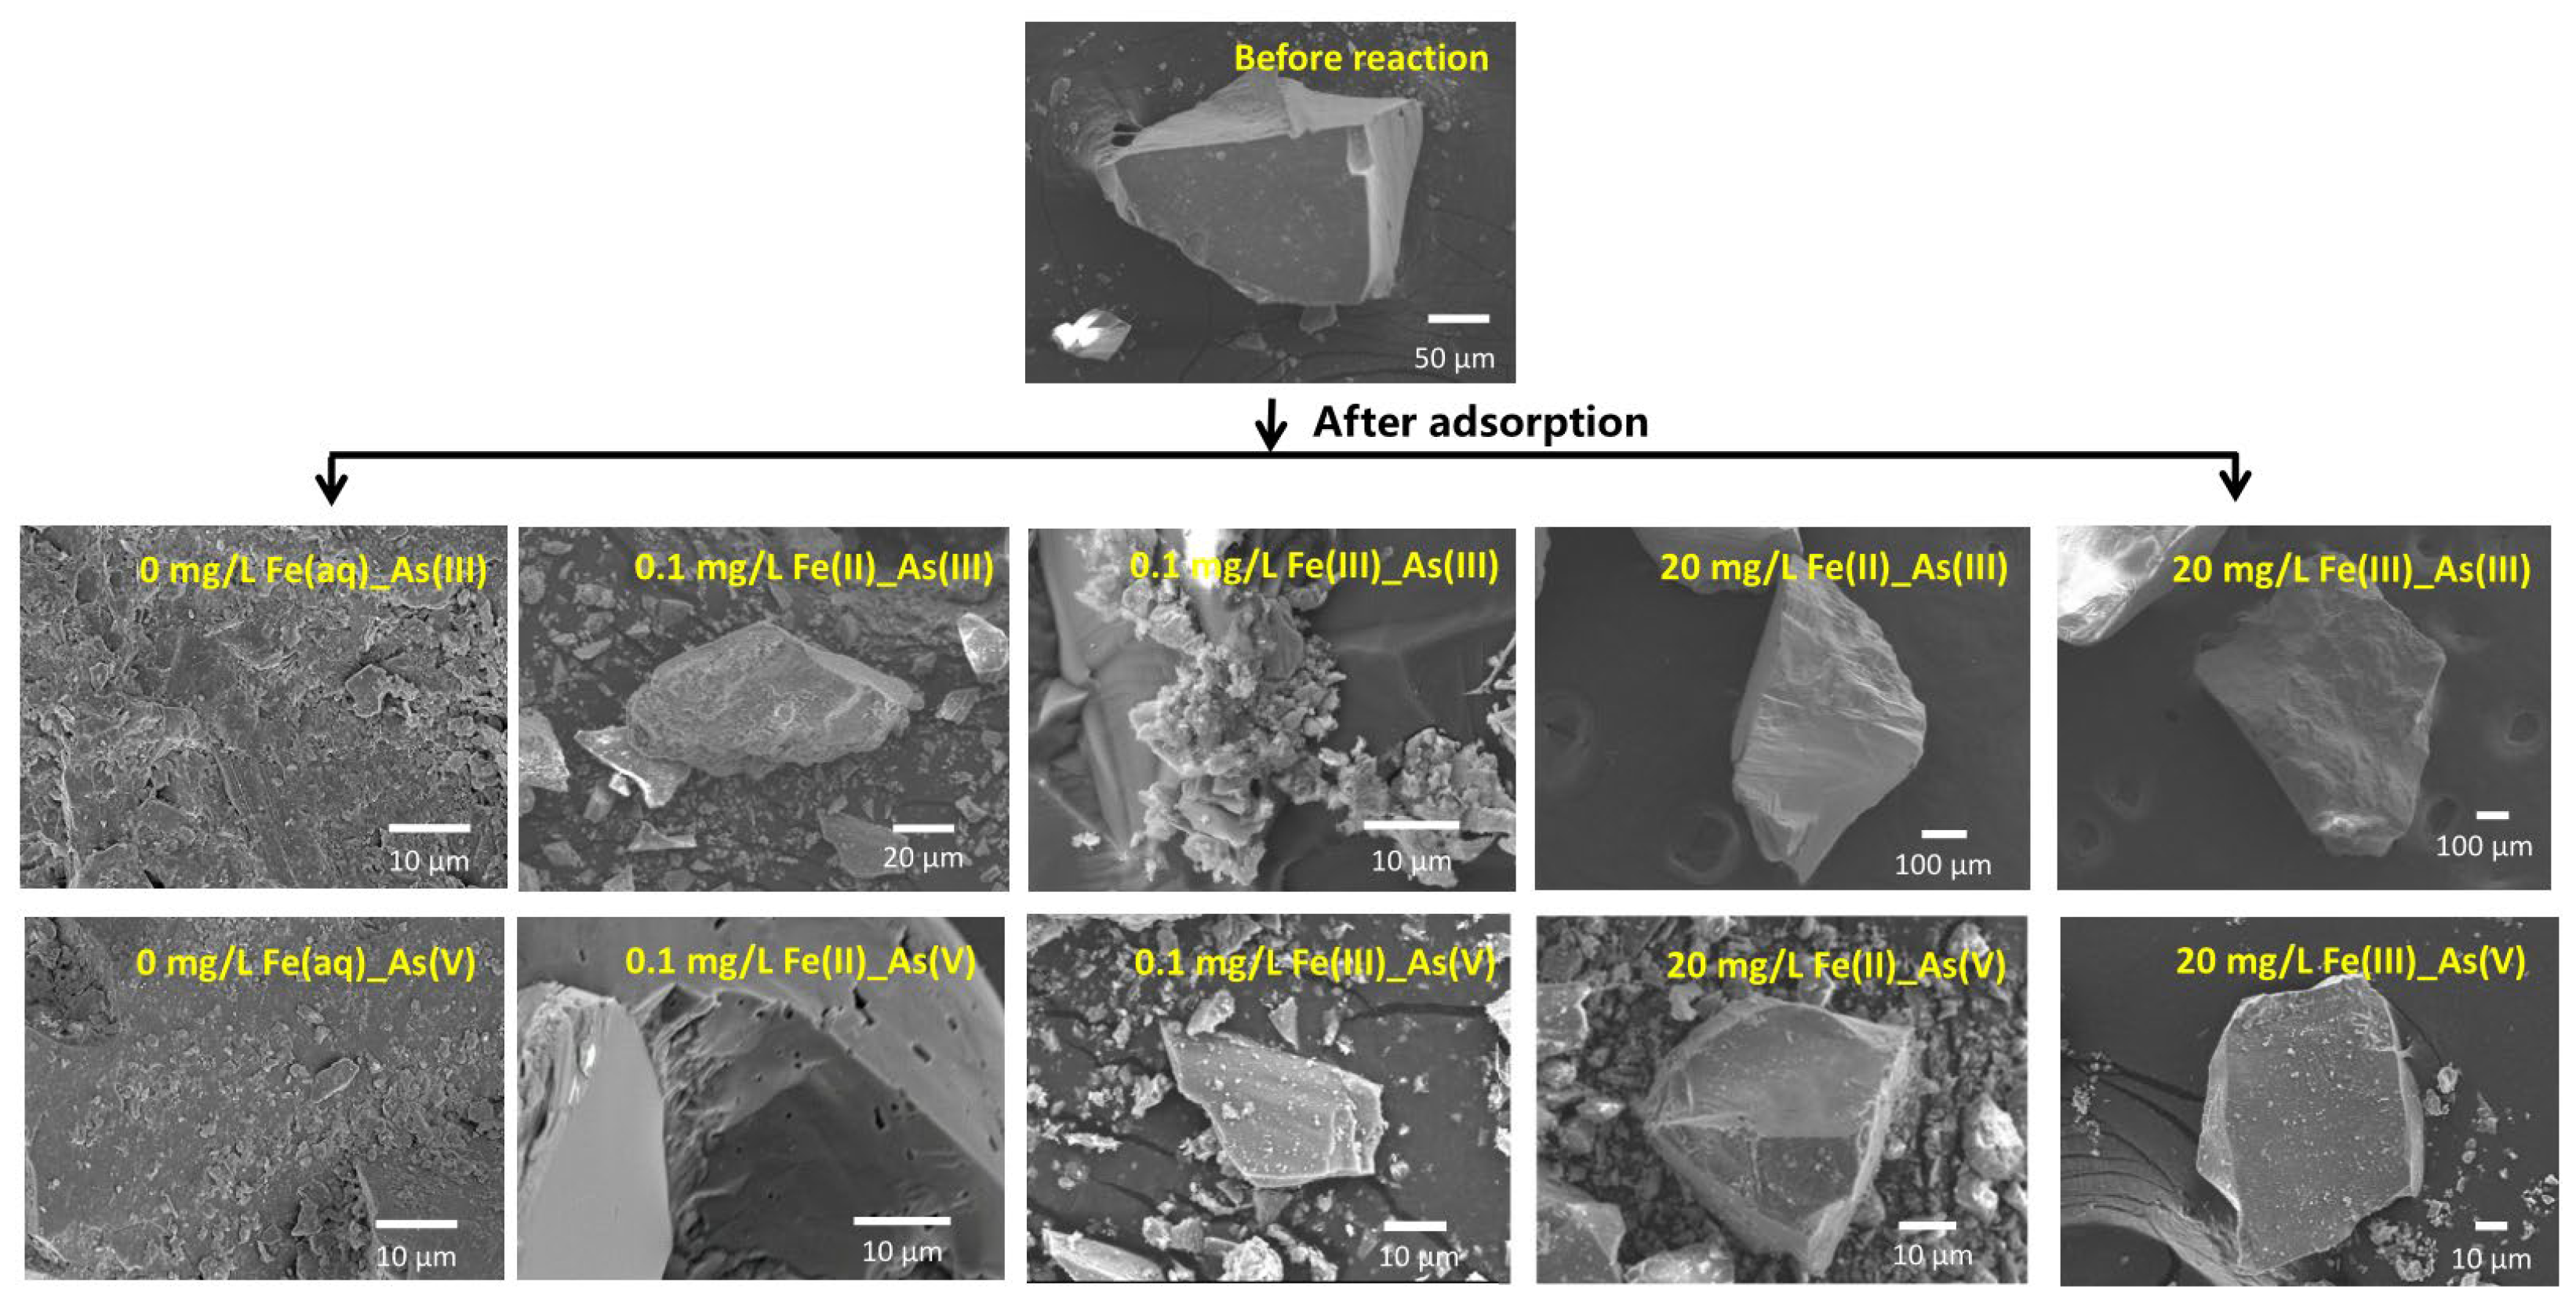
The microstructural morphologies of river sand before and after As adsorption under different initial concentrations of Fe(aq) are shown in Figure 5. The SEM images revealed that prior to adsorption, the surface of the river sand was relatively smooth, while the post-adsorption surfaces exhibited several small particles, which possibly resulted from the adsorption of As(III) and As(V) [25]. Under a low initial concentration of 0.1 mg/L Fe(aq), no marked morphological changes were detected on the surface of the river sand after As(III) or As(V) adsorption if the initially introduced Fe(aq) species was Fe(II). However, if the initially introduced Fe(aq) species was Fe(III), the surface of the river sand exhibited a small amount of crystals after the adsorption of As(III) and displayed a few particulates after the adsorption of As(V). Under the high initial concentration of Fe(aq) of 20 mg/L, no marked morphological changes were detected on the surface of the river sand after the adsorption of As(III) and a few fine particles appeared on the surface after the adsorption of As(V) if the initially introduced Fe(aq) species was Fe(II). If the initially introduced Fe(aq) species was Fe(III), no marked morphological changes were observed on the surface after the adsorption of As(III); however, a significant amount of particulates appeared on the surface after the adsorption of As(V).
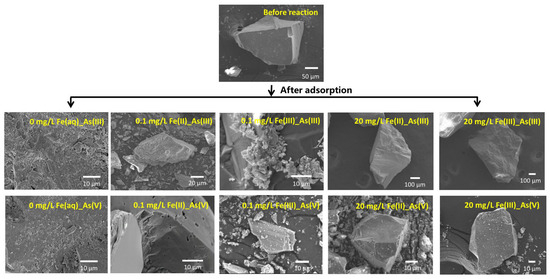
Figure 5.
Microtopography photograph of river sand before and after As(III) and As(V) adsorption under the effects of Fe(II) and Fe(III) addition.
Semi-quantitative EDS analysis (Table 4) showed that prior to adsorption, the main elements on the surface of the river sand were O (52.14%), Si (42.45%), C (4.47%), Fe (0.73%), and Al (0.21%). Without the introduction of external Fe(aq), As was detected on the surface of the river sand after the adsorption experiments of both As(III) and As(V), with concentrations of 0.16% and 0.11%, respectively, confirming that the river sand itself was capable of adsorbing small amounts of As. Under the condition of initial Fe(aq) = 0.1 mg/L, the surface Fe content of the river sand increased to some extent after the adsorption of As(III), and the surface As content remained below 1%. After the adsorption of As(V), the Fe content on the sample surface remained below 0.2%, and As was not detected. This suggested that in the As(III) adsorption systems, Fe (hydro) oxides possibly formed on the surface of the river sand, thereby promoting the adsorption of As(III). In contrast, in the As(V) adsorption systems, fewer Fe (hydro) oxides possibly formed, which was not conducive to the adsorption of As(V) [21]. This was consistent with the results in Section 3.2 and Section 3.3, i.e., when Fe(aq) was introduced at a low concentration of 0.1 mg/L, the As(V) systems exhibited lower ∆Fe compared to groups A-1 and A-2, along with a lower adsorption capacity for As(V) compared to group B-2, where the Fe(aq) concentration was 0 mg/L.
Table 4.
Elemental contents of river sand before and after reaction with As and Fe (unit: %).
In the systems initially containing 20 mg/L Fe(II), the surface As contents of the river sand after the adsorption of As(III) and As(V) were 0.22% and 0.09%, respectively, alongside 2.20% and 0.66% Fe. This indicated that under the influence of high-concentration Fe(II), the adsorption of As(III) by river sand was enhanced, which was likely attributed to the increased Fe content on the river sand surface. In the adsorption systems initially containing 20 mg/L Fe(III), the surface As content of the river sand after the adsorption of As(III) or As(V) was 0.27% or 0.42%, respectively, alongside 2.80% or 2.22% Fe. This indicated that compared to Fe(II), the adsorption systems that initially contained high-concentration Fe(III) exhibited higher As and Fe contents on the surface of the river sand when reaching the sorption equilibrium, with the highest As and Fe contents detected in the 20 mg/L Fe(III)-As(V) system. This was possibly because Fe(III) formed more Fe (hydro)oxides attached to the river sand surface than Fe(II), leading to more surface adsorption sites for As and more As(V) adsorption.
3.5. Changes in the Main Crystalline Phases and Functional Groups of River Sand
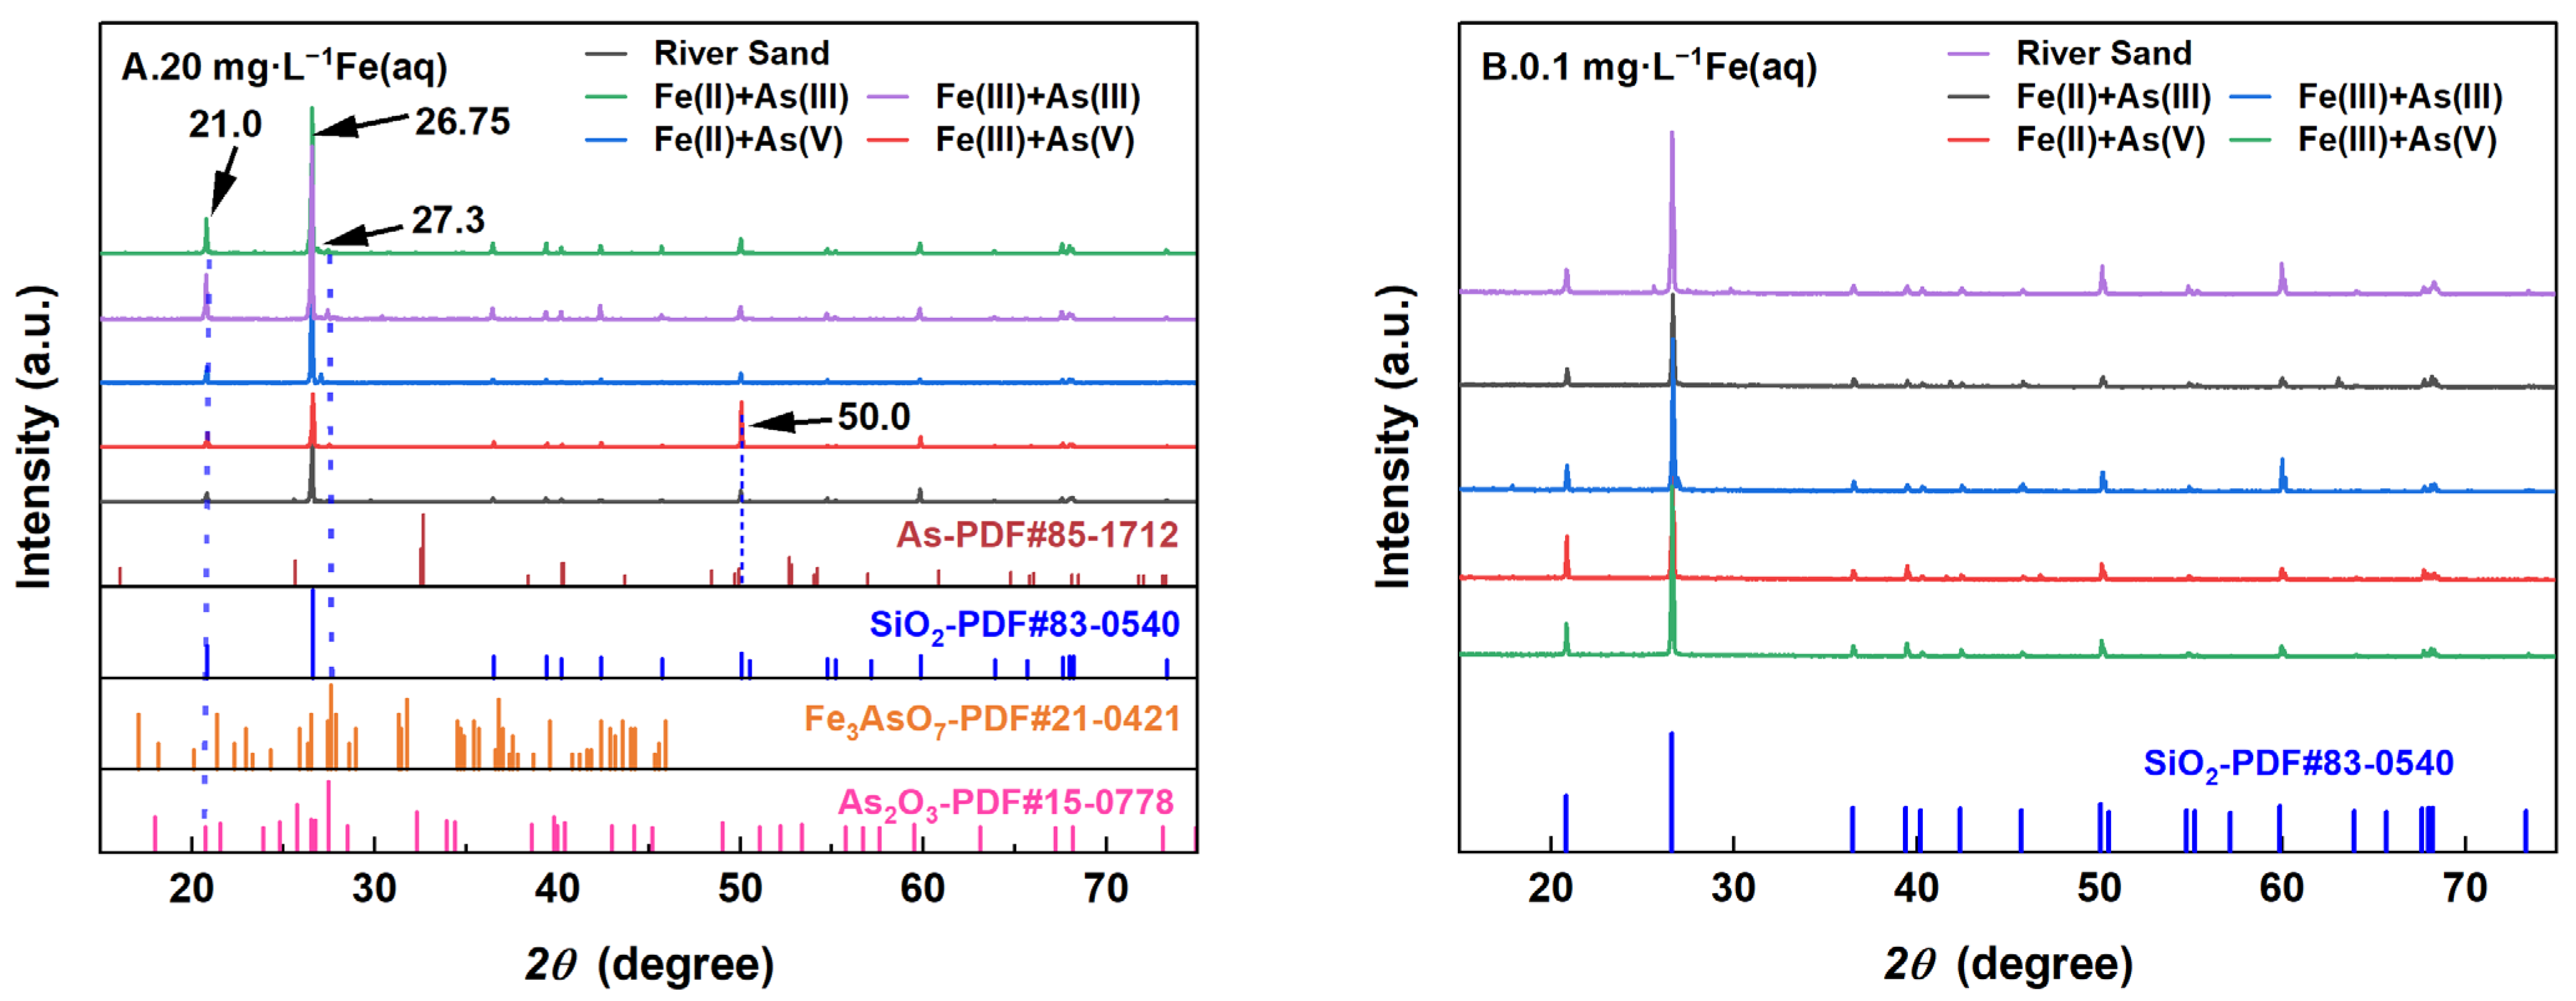
The XRD patterns of the river sand before and after adsorption under the influence of different Fe(aq) concentrations are shown in Figure 6. The results indicated that the main component on the river sand surface was SiO2. Under a high-Fe(aq) concentration of 20 mg/L, trace amounts of As–Fe minerals and arsenides were detected on the surface of the river sand, with the possible presence of Fe(OH)3 crystals. Under a low-Fe(aq) concentration of 0.1 mg/L, no new products formed on the river sand surface, while under a high-Fe(aq) condition, the river sand after As(III) or As(V) adsorption exhibited several marked characteristic peaks in the XRD patterns. The peak at 2θ = 26.75° was attributed to SiO2, indicating that the main component of the river sand did not change after adsorption. Compared to the adsorption systems without Fe(aq), the adsorption systems containing Fe(aq) exhibited a slightly higher peak intensity at 2θ = 21° in the XRD patterns of river sand after adsorption, likely because the sand adsorbed As or Fe oxide colloids co-precipitated with As on the river sand surface. The peak at 2θ = 27.3° represented As–Fe minerals, suggesting that a portion of As(III) was oxidized to As(V) and formed As–Fe mineral precipitates on the river sand surface [26]. For the As adsorption systems containing Fe(aq), the following observations were made on the XRD patterns of river sand after adsorption. (1) With Fe(II) as the Fe(aq) species, the characteristic XRD peak at 2θ = 21° was not noticeably intensified compared to the Fe-absent systems; however, a weak peak attributed to the As–Fe minerals appeared at 2θ = 27.3°. (2) With Fe(III) as the Fe(aq) species, the peaks at 2θ = 21° and 2θ = 27.3° showed no significant change compared to the Fe-absent systems; however, a comparison with the standard card (PDF85-1712) revealed a characteristic peak of As near 2θ = 50°, which was significantly intensified. This was possibly due to two reasons. (1) The hydrolysis of Fe(aq) led to the formation of Fe(OH)3 colloids, which were adsorbed together with As(V) by river sand, forming co-precipitates on the sand surface [27]. (2) Co-precipitates were also present within the amorphous Fe oxides. Under low-Fe(aq) conditions, only the characteristic peak of SiO2 was observed after adsorption, indicating that the content of Fe (hydro) oxides on the river sand surface was insufficient for detection.
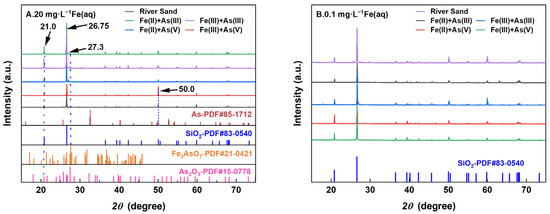
Figure 6.
XRD patterns of the river sand before and after reaction at 20 mg/L Fe(aq) (A) and 0.1 mg/L Fe(aq) (B).
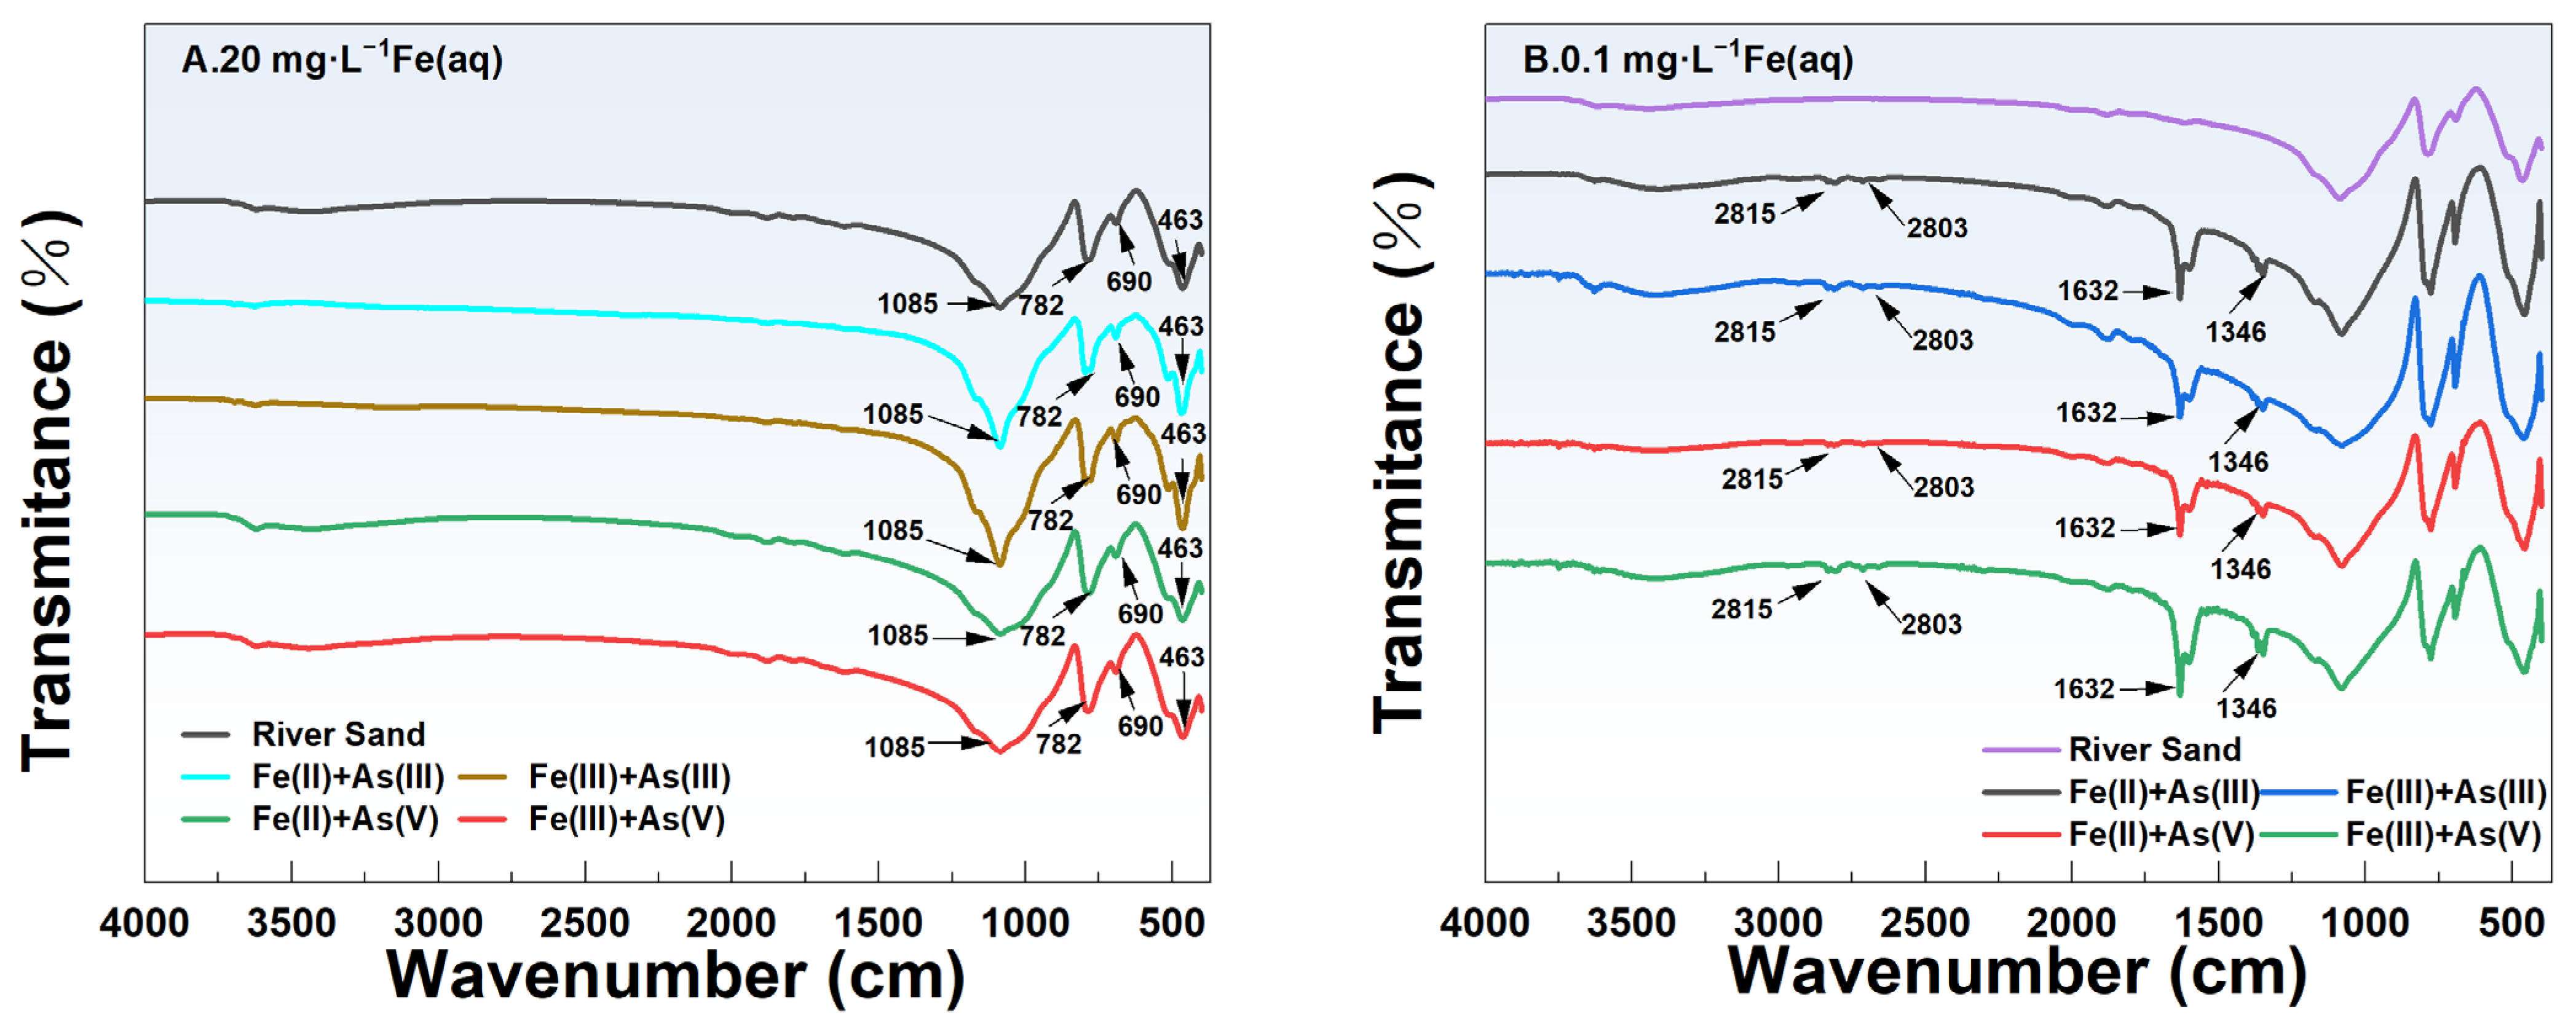
The FTIR spectra of river sand before and after adsorption in the different adsorption systems are shown in Figure 7. Under the same initial concentration of Fe(aq) (i.e., 20 mg/L or 0.1 mg/L), the FTIR spectra of the river sand after As adsorption were different among the different sand–Fe–As adsorption systems. Specifically, under high-Fe(aq) conditions (Fe(aq) = 20 mg/L), two characteristic absorption peaks were observed at 690 and 512 cm−1, which were attributed to SiO2 [28], indicating that the main component of the river sand used in this study was SiO2, and this was consistent with the EDS and XRD results. Previous research found characteristic vibrational absorption peaks of Si-O at 463.06, 797.49, and 1084.72 cm−1 [29], while 463.06 and 797.49 cm−1 were attributed to the stretching vibrations of the Si-O bonds and 1084.72 cm−1 was attributed to the asymmetric stretching vibrations of Si-O-Si [29]. The characteristic absorption peaks between 950 and 1250 cm−1 were primarily attributed to the stretching vibrations of Si-OH and the asymmetric stretching vibrations of Si-O-Si [30]. In adsorption systems containing Fe(II) or Fe(III), no new characteristic peaks of Fe minerals such as a-FeOOH (889 cm−1, 795 cm−1) [31], γ-FeOOH (1020 cm−1) [31], Fe2O3 (559, 427 cm−1) [32], and Fe3O4 (586 cm−1) [33] were observed on the river sand surface after adsorption, indicating that no new Fe-containing functional groups were formed. These observations, when combined with the batch experiment results, indicated that in the river sand–As–Fe systems under a high concentration of Fe(aq), Fe(aq) mainly formed Fe(OH)3 colloids attached to the river sand surface. This increased the adsorption capacity of river sand for As. At a low concentration of Fe(aq) (0.1 mg/L), characteristic absorption peaks of aldehydic substances were observed at 2815 and 2803 cm−1, caused by the stretching vibrations of the C-H bonds. The absorption peaks at 1632 and 1346 cm−1 were attributed to the stretching vibrations of C=O and bending vibrations of -OH, respectively, which was indicative of the presence of a small amount of water molecules [34]. Hence, Fe (hydro) oxides were nearly undetectable on the surface of river sand under a low-Fe(aq) condition (Fe(aq) = 0.1 mg/L), indicating an exceedingly low content of Fe (hydro)oxides.
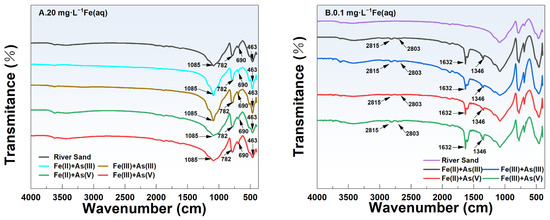
Figure 7.
FTIR spectra of the river sand surface at 20 mg/L Fe(aq) (A) and 0.1 mg/L Fe(aq) (B).
3.6. Changes in the Valence of As and Fe on the Surface of River Sand
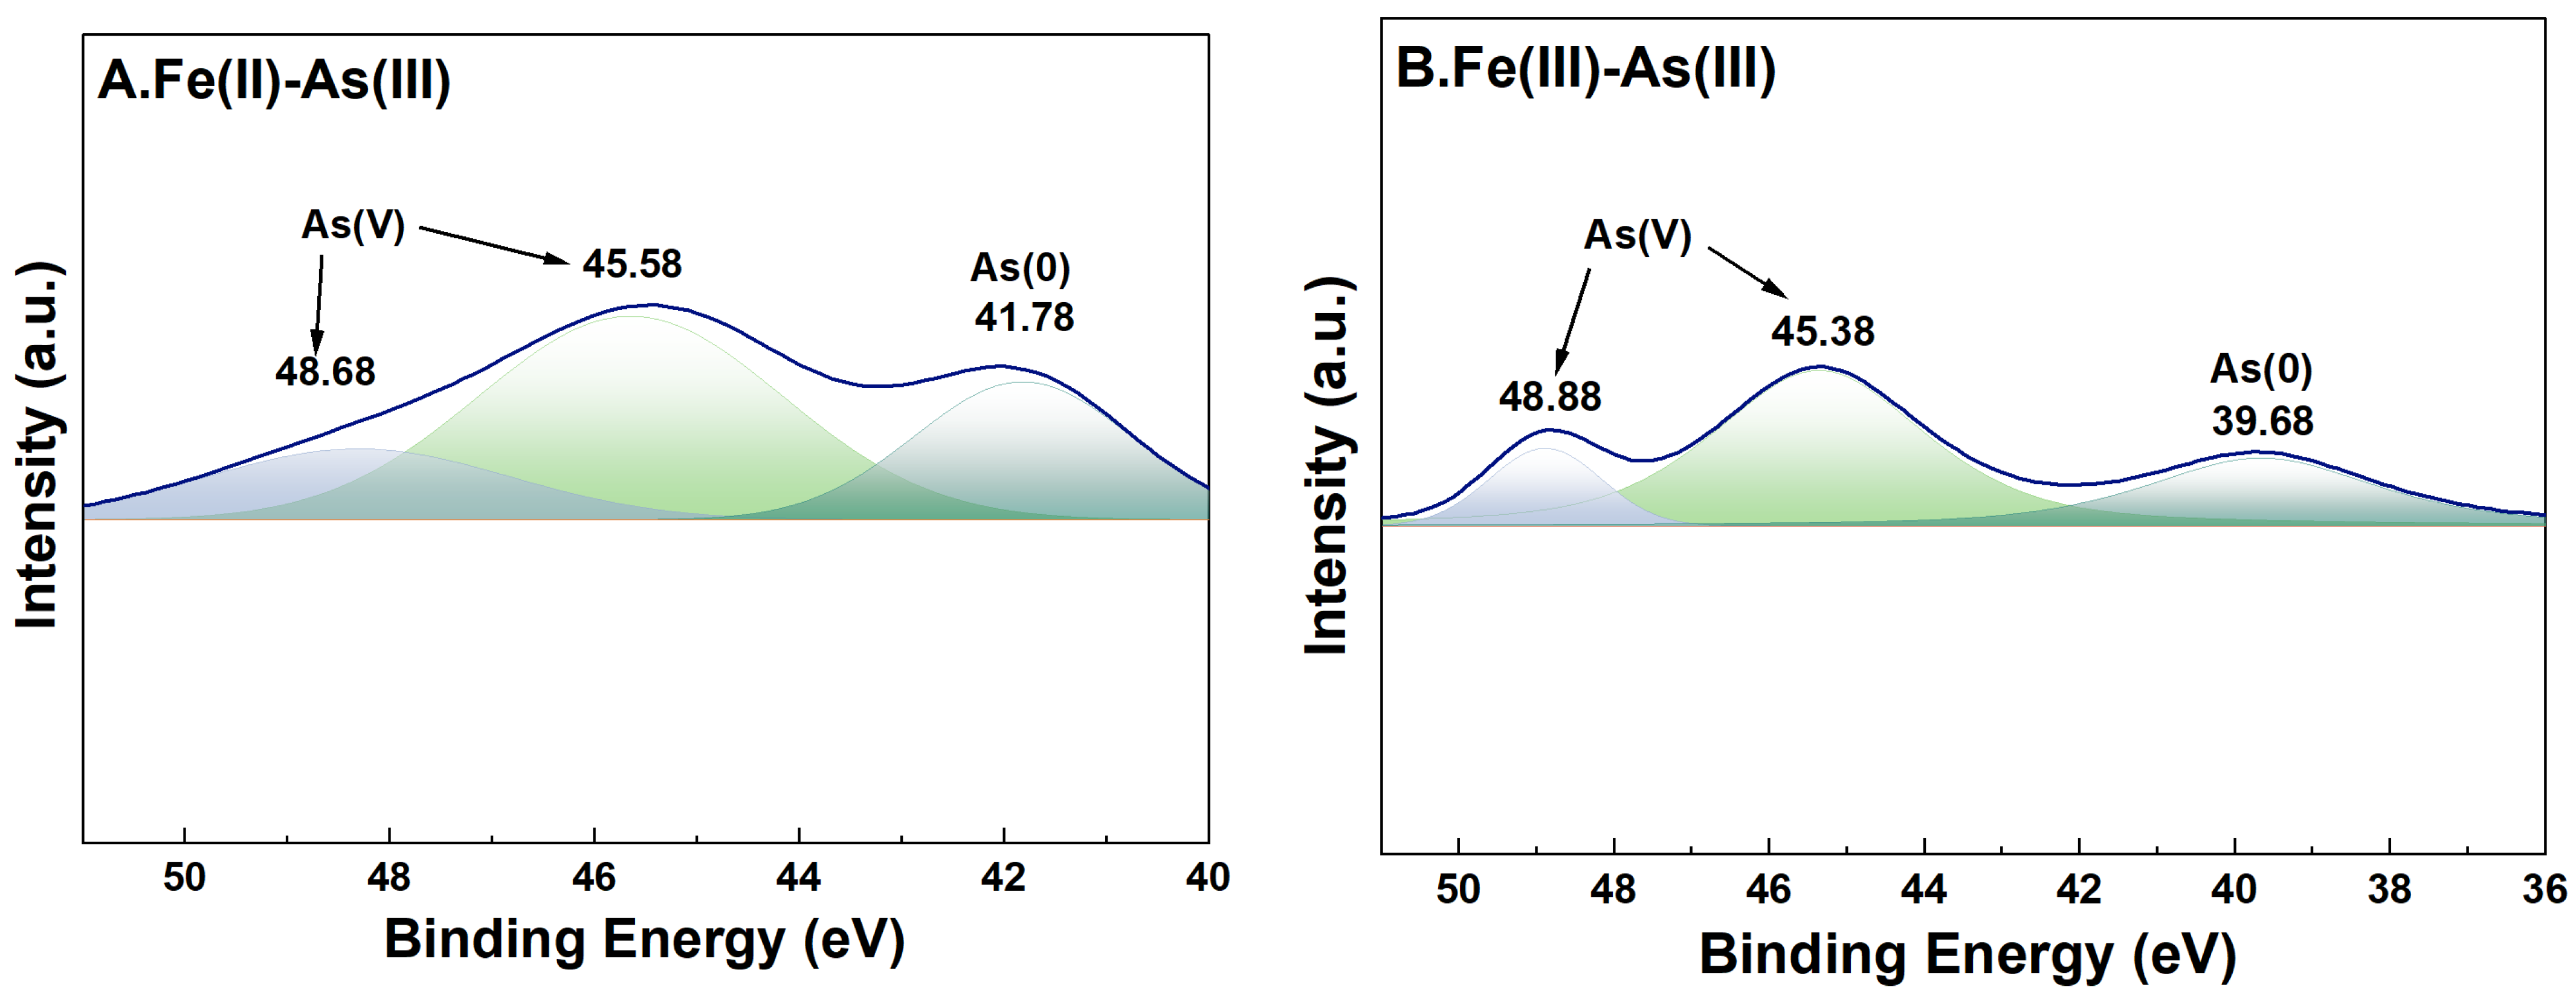
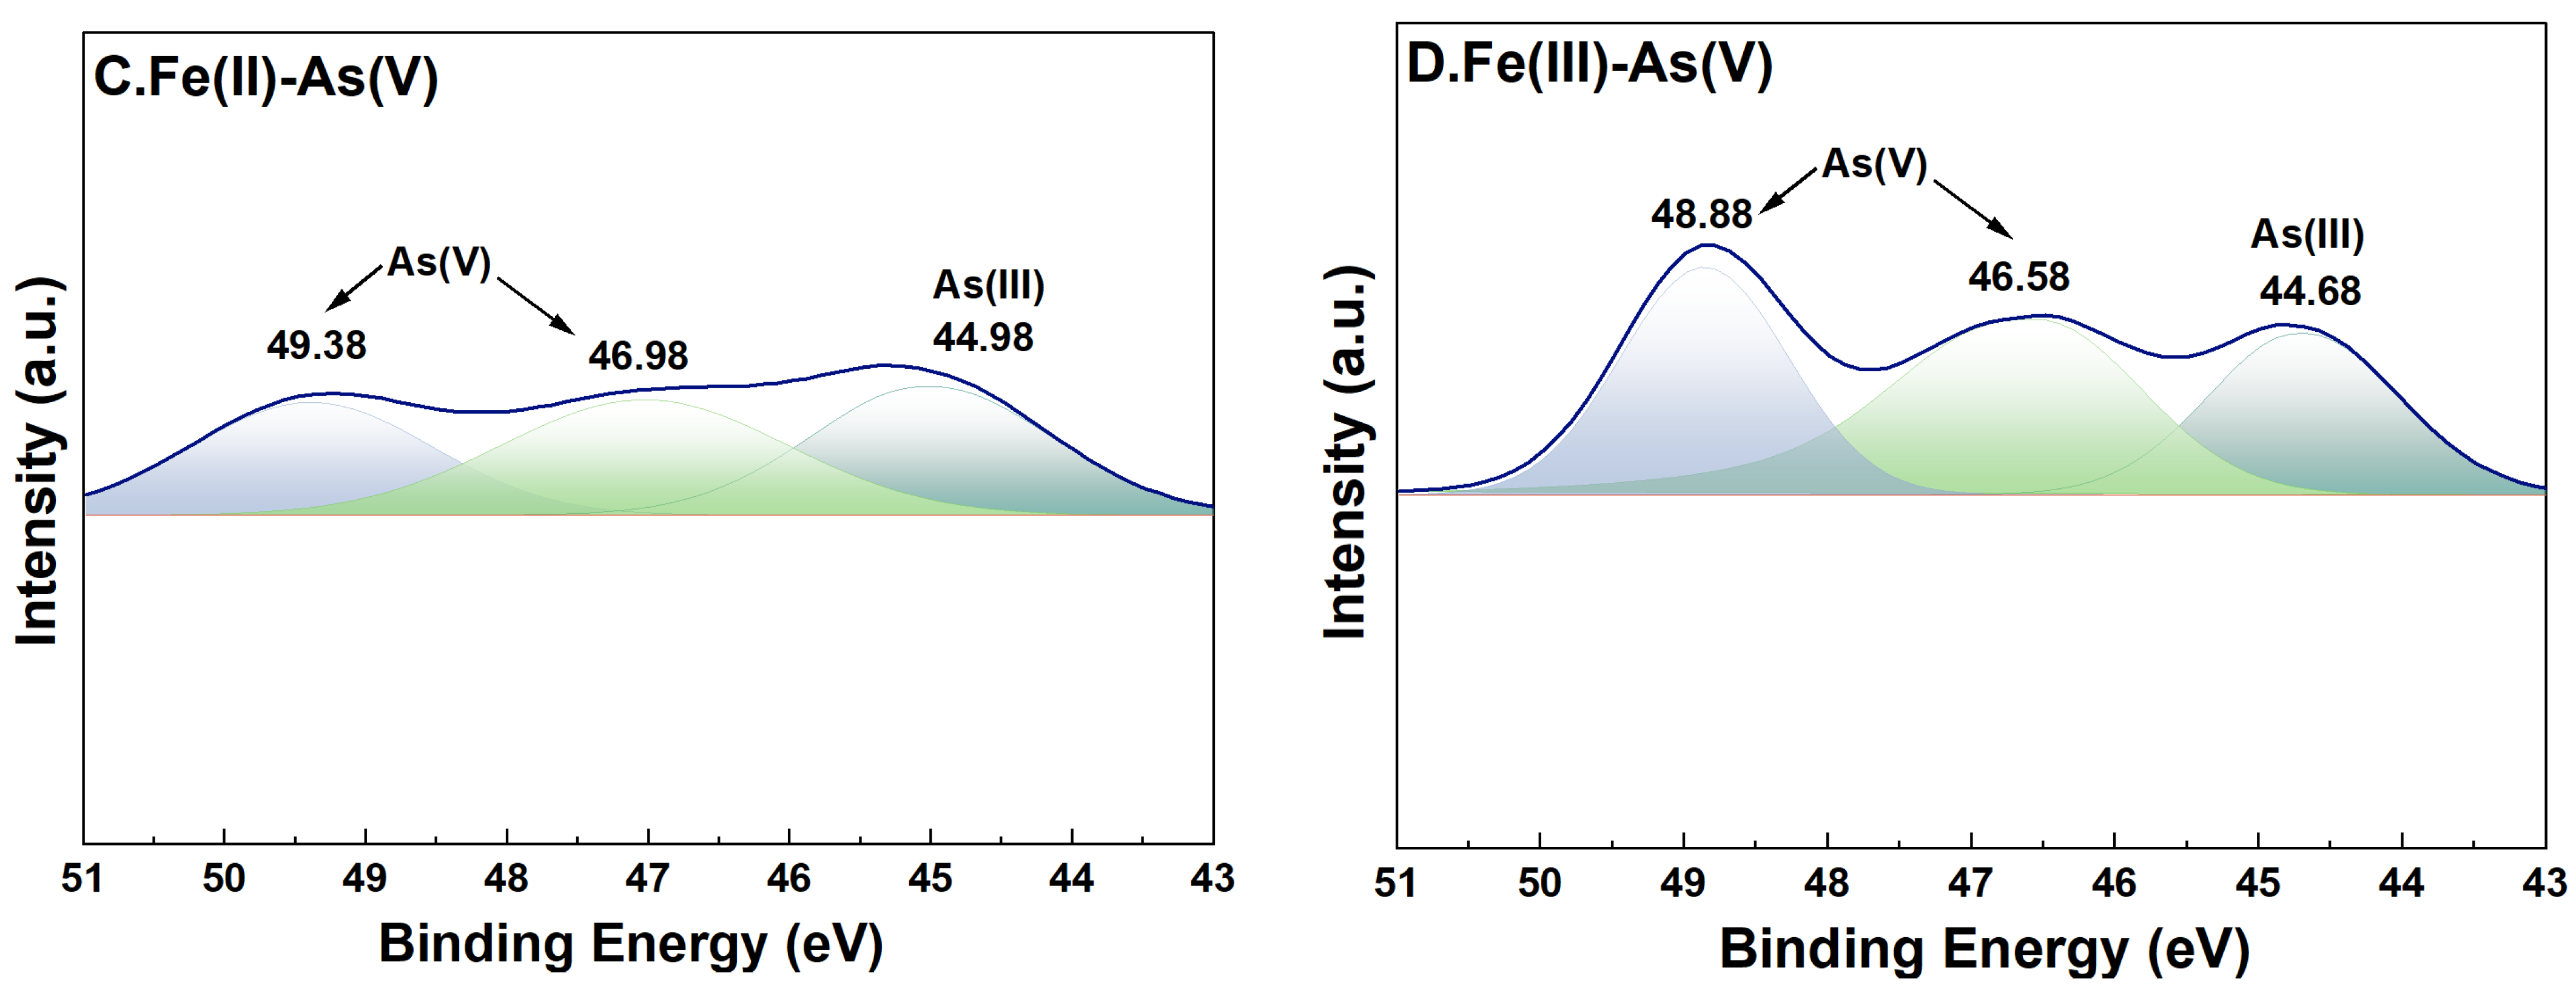
For adsorption systems under a high-Fe(aq) condition, the fine XPS spectra of As on the surface of river sand after adsorption of As and its peak fitting results are shown in Figure 8. In the As(III) adsorption groups, the characteristic peaks of both As(0) (39.68 eV and 41.78 eV) [35] and As(V) (45.38–45.58 eV and 48.68–48.88 eV) [36] were detected on the surface of river sand after adsorption, indicating that As(V) was the dominant form on the surface after adsorption. This implied that during the adsorption of As(III) by river sand under the influence of Fe(II) or Fe(III), portions of As(III) were transformed into As(V). In the As(V) adsorption groups, characteristic peaks of both As(III) (44.68 eV and 44.98 eV) [37] and As(V) (46.5846.98 eV, 48.8849.38 eV) [36] were detected on the surface after adsorption, suggesting that the As(V) adsorbed by river sand was partially reduced to As(III).
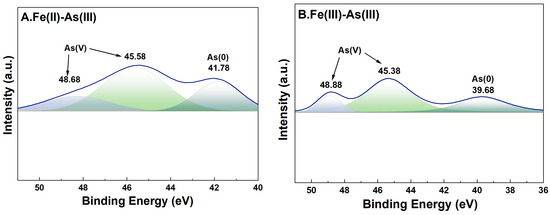
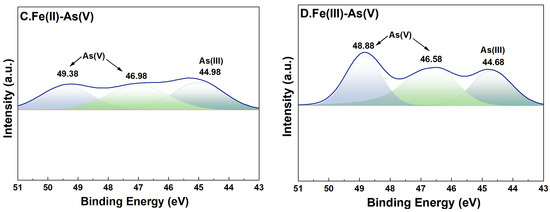
Figure 8.
High-resolution XPS spectra of As after adsorption. River sand surface As(III) transformations under the influence of Fe(II) (A) and Fe(III) (B). River sand surface As(V) transformations under the influence of Fe(II) (C) and Fe(III) (D). The colors serve merely to distinguish between different peaks, without any additional implications.
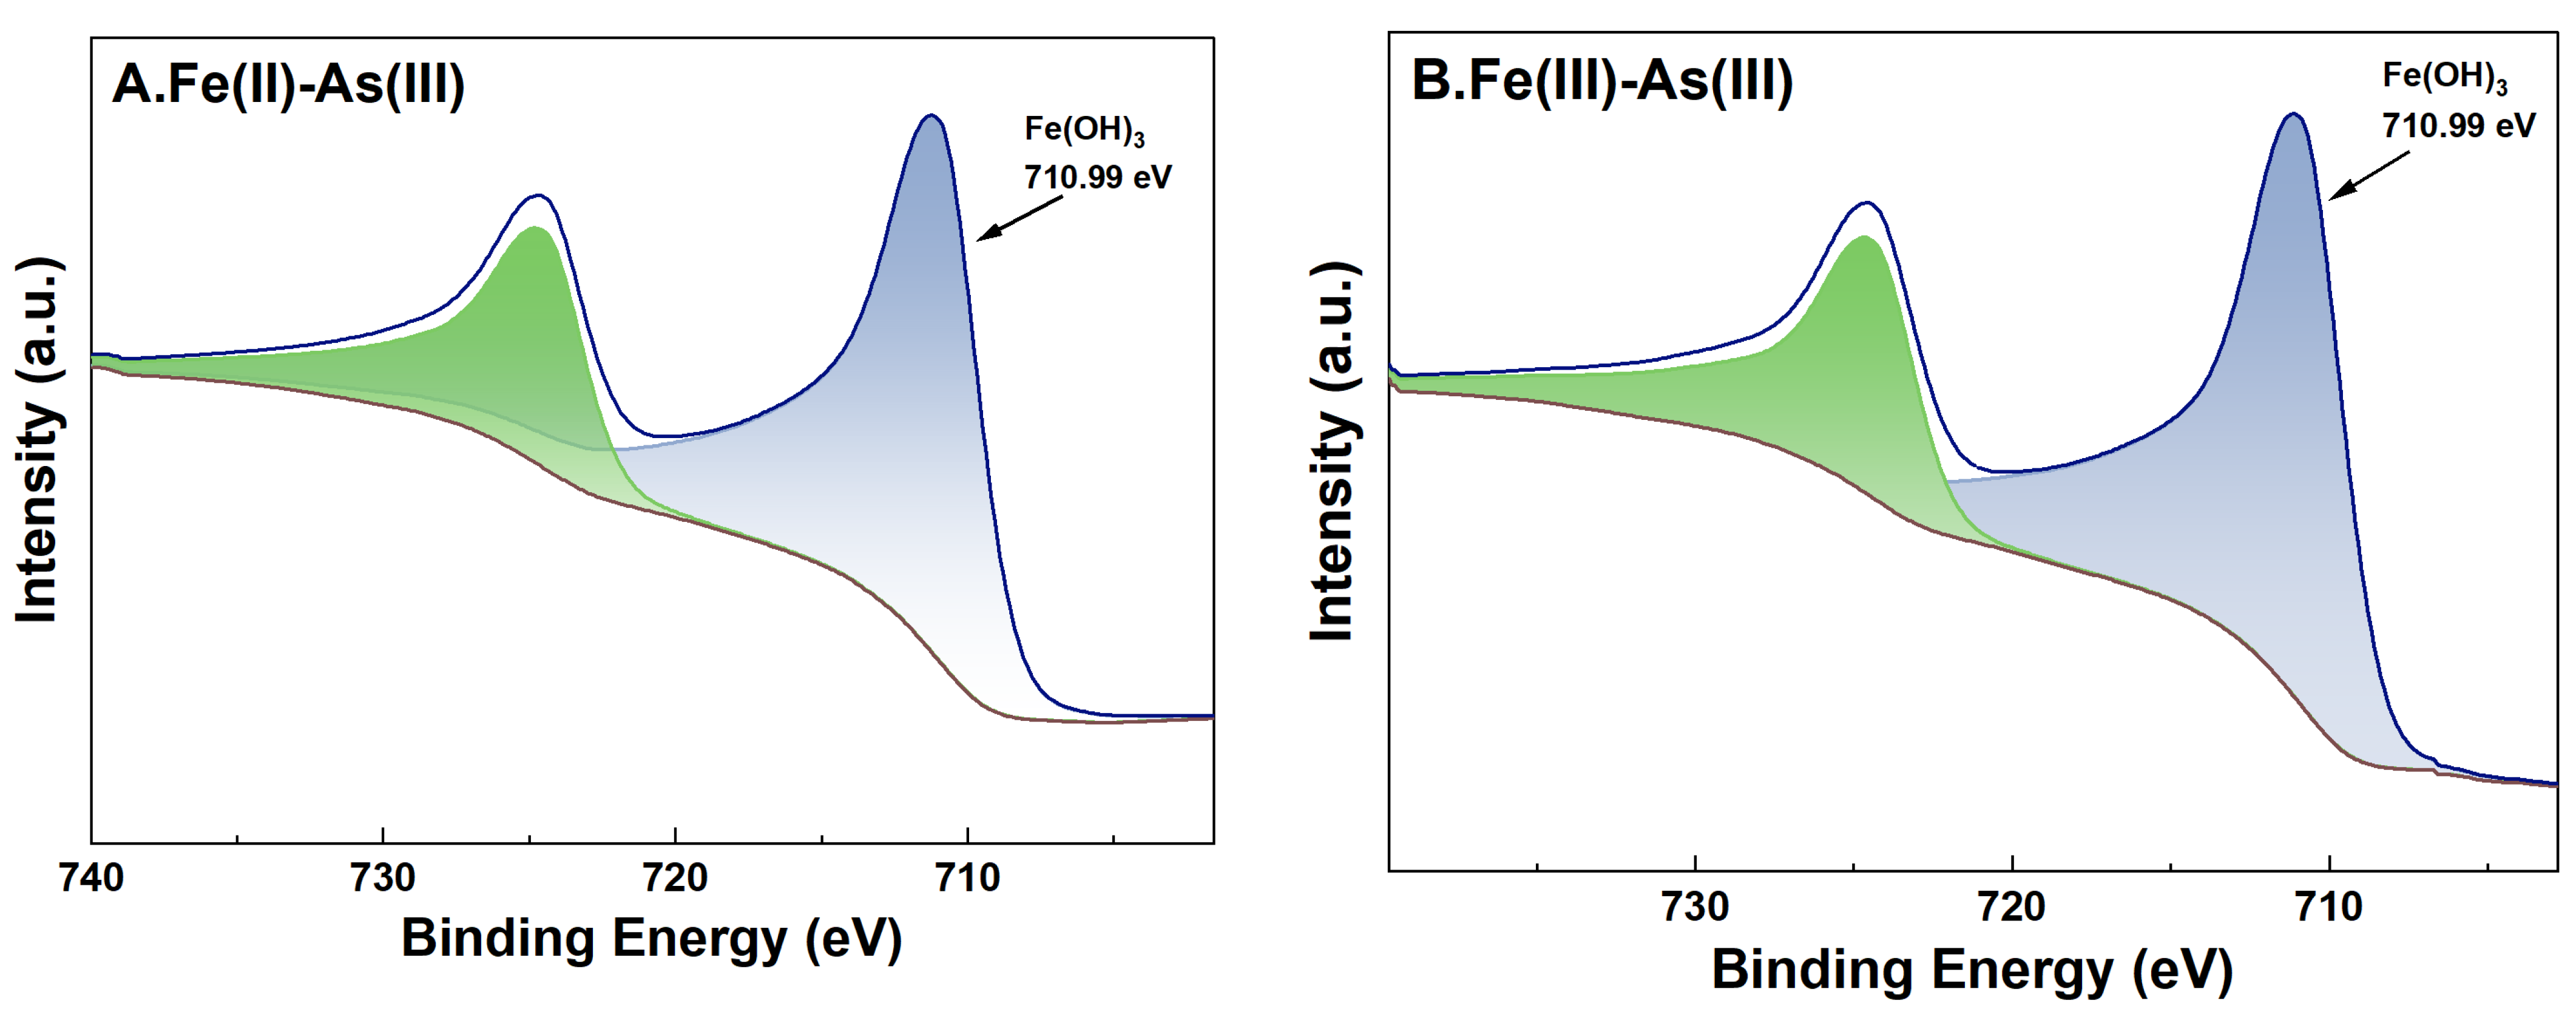
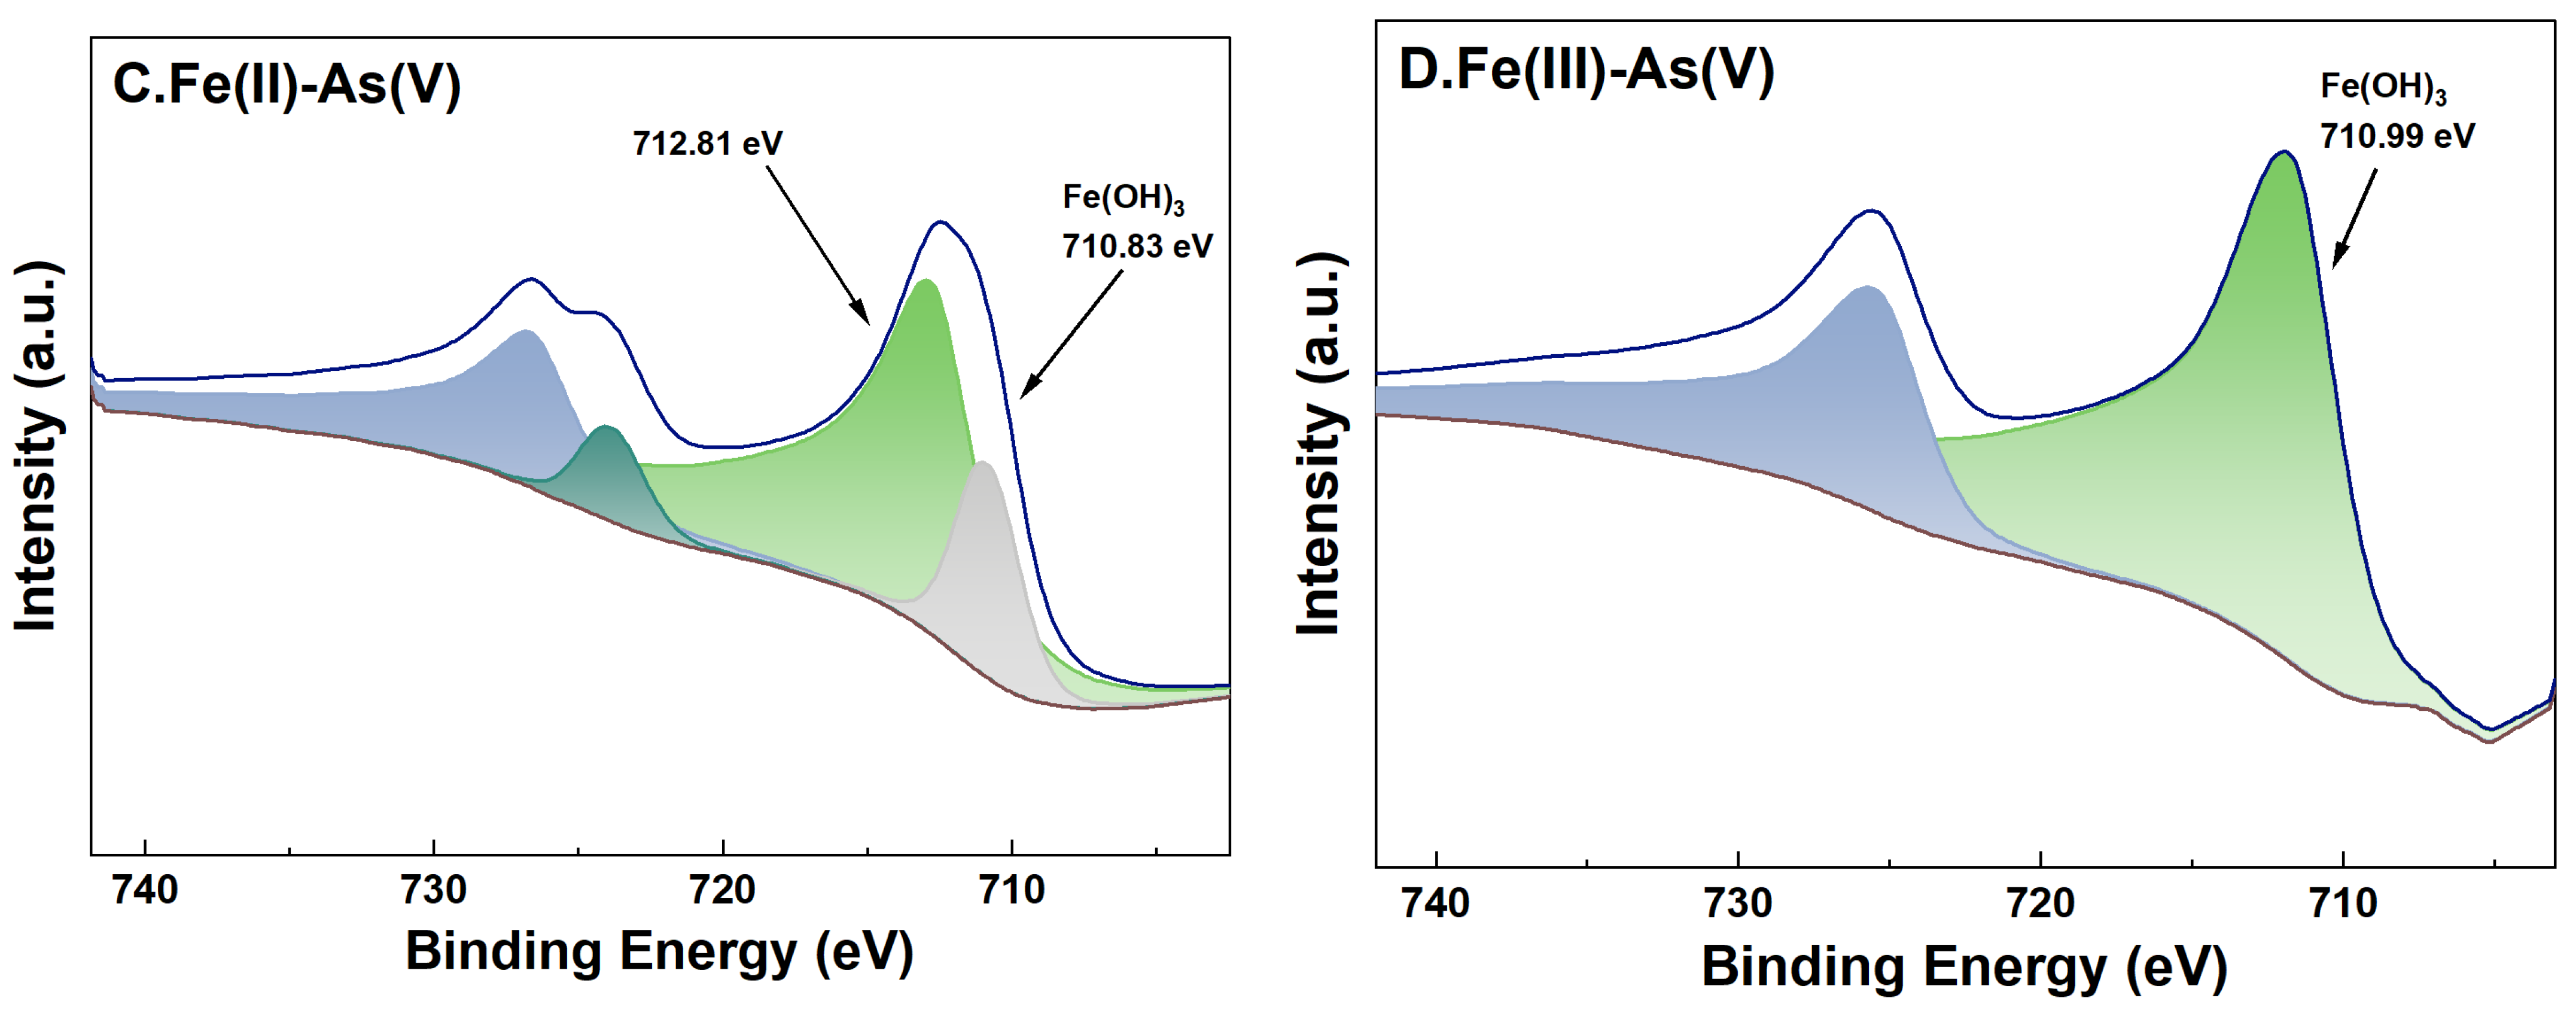
For adsorption systems under a high-Fe(aq) condition, the fine XPS spectra of Fe on the surface of river sand after the adsorption of As and its peak fitting results are shown in Figure 9. For adsorption systems initially containing Fe(II) or Fe(III) as the Fe(aq) species, the binding energies of Fe2p3/2 of the river sand samples after the adsorption experiments were determined as 710.99 eV and 710.90 eV, respectively. This indicated the presence of Fe(OH)3 on the river sand surface [38], which was consistent with the previous analysis results in this study. Specifically, for adsorption systems with Fe(II) as the Fe(aq) species, two characteristic peaks appeared at 710.83 eV and 712.81 eV [39] after the adsorption of As(V) by the river sand, suggesting that Fe(OH)3 and possibly other Fe oxides formed on the surface. For As(V) adsorption systems initially containing Fe(II) as the Fe(aq) species, Fe2p3/2 in the post-adsorption river sand samples demonstrated only one binding energy at 711.76 eV [40], which was possibly due to the Fe oxides inherently present in the river sand. For adsorption systems under a low-Fe(aq) condition (0.1 mg/L), characteristic peaks of Fe2p and As3d were not detected on the sample surface; thus, related data were omitted in this work.

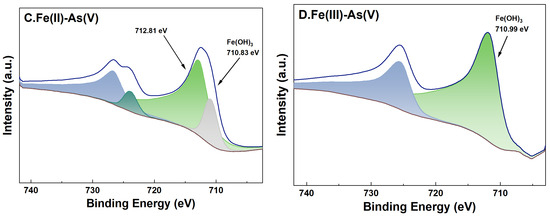
Figure 9.
High-resolution XPS spectra of Fe after adsorption under 20 mg/L Fe(aq). River sand surface Fe(II) transformations under the influence of As(III) (A) and As(V) (C). River sand surface Fe(III) transformations under the influence of As(III) (B) and As(V) (D).
3.7. Mechanism Analysis
Batch experiments indicated that under the same conditions, the formation of stable Fe (hydro) oxides from Fe(II) involved more processes compared to Fe(III) [23,41], implying that Fe(III) had a stronger promotion effect on the adsorption of As by river sand than Fe(II). Because the pH of the adsorption solution decreased after adsorption, as observed in this study, the reactions in Equations (4)–(6) were possibly involved in the adsorption system:
Fe2+(aq) + 2OH−(aq) → Fe(OH)2(s),
4Fe2+(aq) + 4H+(aq) + O2(aq) → 4Fe3+(aq) + 2H2O(l),
Fe3+(aq) + 3OH−(aq) → Fe(OH)3(s).
When Fe(aq) ≥ 5 mg/L, the adsorption values of both As(III) and As(V) by river sand significantly increased with the increasing concentration of added Fe(II) and Fe(III), likely because these conditions favored the reactions in Equations (4)–(6), leading to the formation of more Fe (hydro) oxides to promote the adsorption of As. The redox reaction between Fe(II) and As(V) is thermodynamically feasible, indicating that it occurs spontaneously. Through field surveys and statistical analysis, some studies observed a positive correlation between the total concentration of As and the total concentration of Fe in groundwater, where the concentration of Fe(aq) exceeded 1 mg·L−1 [42,43].
Furthermore, in groups under low-Fe(aq) conditions (0.1–1 mg/L), the adsorbed amount of As(III) was higher than in control groups B-1 and B-2, but the adsorbed amount of As(V) was significantly lower, suggesting that Fe(aq) inhibited the adsorption of As(V). This was consistent with some field surveys in high-As areas, i.e., a negative correlation between the total concentration of As and the total concentration of Fe in groundwater where the concentration of Fe(aq) was below 1 mg/L [42,43]. The reaction in Equation (7) was one of the important factors inhibiting the adsorption of As:
As(V) + 2Fe(II) → As(III) + 2Fe(III).
XPS analysis showed that for As(V) adsorption systems containing Fe(aq), the characteristic peaks of both As(III) and As(V) were observed in the post-adsorption river sand samples, indicating the partial transformation of As(V) to As(III). In addition, kinetics experiments showed that the adsorption capacity of river sand for As(III) was significantly lower compared to As(V). This suggested that in the As(V) adsorption systems, As(V) underwent partial transformation to As(III), leading to a reduced adsorption capacity for total As species. Notably, the post-adsorption river sand samples of the Fe(II)-As(V) systems exhibited characteristic Fe2p peaks of both Fe(II) and Fe(III), as well as the characteristic As3d peaks of both As(III) and As(V), indicating that Fe(II) was partially oxidized to Fe(III), likely through reaction (5) [23]. For the Fe(III)-As(V) adsorption systems, the presence of both As(V) and As(III) on the surface of post-adsorption river sand indicated the involvement of more complex chemical processes in converting As(V) to As(III). Moreover, although the adsorbed amounts of As(V) were higher than As(III) in the Fe(aq)-absent adsorption systems, portions of As(V) were transformed to As(III) in the presence of Fe(aq), leading to lower adsorbed amounts of As(V) compared to control groups B-1 and B-2. This indicated that Fe(aq) at low concentrations could control the transformation of As species, limiting the adsorption of As(V) by river sand.
4. Conclusions
To explore the previously overlooked impact of dissolved Fe on the behavior of As in aquatic environments, this study used river sand, a primary aquifer medium in riparian zones—a typical region featuring groundwater and surface water interaction—as the reaction medium to conduct adsorption batch experiments. We then explored the adsorption characteristics of As by river sand under different initial concentrations of Fe(aq) (Fe(II) or Fe(III)). Moreover, river sand samples before and after adsorption experiments were characterized by various techniques to obtain further insights into Fe(aq) species’ transformation and its impact on the interactions between river sand and As. The main conclusions were as follows.
- (1)
- When the initial concentration of Fe(aq) was below 1 mg/L, the adsorption of As(III) by river sand was promoted, while the adsorption of As(V) was inhibited. When the initial concentration of Fe(aq) exceeded 5 mg/L, the adsorption of both As(III) and As(V) was promoted. Hence, Fe(aq) promoted the adsorption of As(III) by river sand, while low-concentration Fe(aq) inhibited the adsorption of As(V) and high-concentration Fe(aq) promoted the adsorption of As(V).
- (2)
- Adsorption kinetics analysis and adsorbent characterization revealed that in the As(V) adsorption systems under low-Fe(aq) conditions (0.1–1 mg/L), Fe(II) reduced As(V) to As(III), with the latter As species demonstrated a lower adsorbed amount at its adsorption equilibrium, thus lessening the removal of dissolved As from the solution. Under the same low-Fe(aq) conditions, Fe(III) transformed As(V) into As(III) through more complex reactions, restricting the adsorption of As(V) by river sand. Conversely, under high-Fe(aq) conditions (5–20 mg/L), Fe(aq) promoted the adsorption of As by river sand through the formation of Fe(OH)3.
This study indeed provides an important reference for groundwater pollution control by elucidating the relationship between different concentrations of Fe(aq) and high-arsenic groundwater. In practical applications, our findings contribute to optimizing management strategies for iron and arsenic during the groundwater purification process.
Author Contributions
Conceptualization, Z.L. and H.S.; methodology, Z.L. and S.P.; validation, Z.L., S.P. and H.S.; resources, Q.L. and H.Z.; data curation, Z.Z.; writing—original draft preparation, Z.L.; writing—review and editing, Z.L., S.P. and H.S.; visualization, Z.L. and Z.Z.; funding acquisition, H.S. All authors have read and agreed to the published version of the manuscript.
Funding
This research was funded by the National Natural Science Foundation Project (42167026, 41877194); the Guangxi Natural Science Foundation Project (2022GXNSFBA035600); and “the Technical Innovation Center Project of Mine Geological Environmental Restoration Engineering in Southern Karst Area (NFSS2023014)”.
Data Availability Statement
The raw data supporting the conclusions of this article will be made available by the corresponding author on request.
Acknowledgments
I would like to express my sincere gratitude to my mentors for their invaluable guidance and support throughout the course of this research. Firstly, I am immensely thankful to Sanxi Peng and Huimei Shan for their expert advice on the experimental design, which was crucial to the success of this study. Their deep insights and constructive feedback have profoundly shaped the direction and execution of my work. Additionally, profound thanks go to Liao Qian and Zhou Hai for their exceptional guidance on data analysis. Their expertise in statistical methods and analytical techniques greatly enhanced the quality and depth of my analysis, allowing me to draw meaningful conclusions from the data collected. Special thanks to Zhao Zhi-cheng for his assistance with data processing. His meticulous attention to detail and dedication were instrumental in managing and organizing the dataset effectively, enabling a smooth analysis process. This research would not have been possible without the collective wisdom, support, and dedication of these individuals. I am truly thankful for their contributions and feel privileged to have had the opportunity to learn from each of them.
Conflicts of Interest
The authors declare no conflicts of interest.
References
- Guo, J.; Cao, W.; Lang, G.; Sun, Q.; Nan, T.; Li, X.; Ren, Y.; Li, Z. Worldwide distribution, health risk, treatment technology, and development tendency of geogenic high-arsenic groundwater. Water 2024, 16, 478. [Google Scholar] [CrossRef]
- Sinha, D.; Prasad, P. Health effects inflicted by chronic low-level arsenic contamination in groundwater: A global public health challenge. J. Appl. Toxicol. 2020, 40, 87–131. [Google Scholar] [CrossRef] [PubMed]
- Sharma, V.K.; Sohn, M. Aquatic arsenic: Toxicity, speciation, transformations, and remediation. Environ. Int. 2009, 35, 743–759. [Google Scholar] [CrossRef] [PubMed]
- Chen, S.-L.; Dzeng, S.R.; Yang, M.-H.; Chiu, K.-H.; Shieh, G.-M.; Wai, C.M. Arsenic species in groundwaters of the blackfoot disease Area, Taiwan. Environ. Sci. Technol. 1994, 28, 877–881. [Google Scholar] [CrossRef] [PubMed]
- Palma-Lara, I.; Martínez-Castillo, M.; Quintana-Pérez, J.C.; Arellano-Mendoza, M.G.; Tamay-Cach, F.; Valenzuela-Limón, O.L.; García-Montalvo, E.A.; Hernández-Zavala, A. Arsenic exposure: A public health problem leading to several cancers. Regul. Toxicol. Pharmacol. 2020, 110, 104539. [Google Scholar] [CrossRef] [PubMed]
- Deng, Y.; Wang, Y.; Li, H.; Li, H.; Guo, W.; Duan, Y.; Dong, C.; Gan, Y.; Liu, N.; Ding, X. Seasonal variation of arsenic speciation in shallow groundwater from endemic arsenicosis area in Jianghan Plain. Earth Sci. J. China Univ. Geosci. 2015, 40, 1876–1886. [Google Scholar]
- Yan, Y.; Xie, X.; Xiao, Z.; Li, J. Influence of irrigation practices on arsenic mobilization and transformation in the unsaturated zone. Geol. Sci. Technol. Inf. 2018, 37, 206–214. [Google Scholar] [CrossRef]
- Yang, C.; Li, S.; Liu, R.; Sun, P.; Liu, K. Effect of reductive dissolution of iron (hydr)oxides on arsenic behavior in a water–sediment system: First release, then adsorption. Ecol. Eng. 2015, 83, 176–183. [Google Scholar] [CrossRef]
- Bauer, M.; Blodau, C. Mobilization of arsenic by dissolved organic matter from iron oxides, soils and sediments. Sci. Total Environ. 2006, 354, 179–190. [Google Scholar] [CrossRef]
- Winde, F.; Jacobus van der Walt, I. The significance of groundwater–stream interactions and fluctuating stream chemistry on waterborne uranium contamination of streams—A case study from a gold mining site in South Africa. J. Hydrol. 2004, 287, 178–196. [Google Scholar] [CrossRef]
- Zhou, L.; Wu, F.; Meng, Y.; Byrne, P.; Ghomshei, M.; Abbaspour, K.C. Modeling transport and fate of heavy metals at the watershed scale: State-of-the-art and future directions. Sci. Total Environ. 2023, 878, 163087. [Google Scholar] [CrossRef] [PubMed]
- Horne, J.D.; Brikowski, T.H.; Johannesson, K.H. Natural arsenic-rich spring waters discharging from the Austin Chalk, North-Central Texas, USA: Mineral and chemical evidence of pyrite oxidation followed by reductive dissolution of neo-formed Fe (III) oxides/oxyhydroxides. Appl. Geochem. 2023, 150, 105547. [Google Scholar] [CrossRef]
- Bretzler, A.; Nikiema, J.; Lalanne, F.; Hoffmann, L.; Biswakarma, J.; Siebenaller, L.; Demange, D.; Schirmer, M.; Hug, S.J. Arsenic removal with zero-valent iron filters in Burkina Faso: Field and laboratory insights. Sci. Total Environ. 2020, 737, 139466. [Google Scholar] [CrossRef] [PubMed]
- Stolze, L.; Zhang, D.; Guo, H.; Rolle, M. Surface complexation modeling of arsenic mobilization from goethite: Interpretation of an in-situ experiment. Geochim. Cosmochim. Acta 2019, 248, 274–288. [Google Scholar] [CrossRef]
- Mejia-Santillan, M.E.; Pariona, N.; Bravo-C, J.; Herrera-Trejo, M.; Montejo-Alvaro, F.; Zarate, A.; Perry, D.L.; Mtz-Enriquez, A.I. Physical and arsenic adsorption properties of maghemite and magnetite sub-microparticles. J. Magn. Magn. Mater. 2018, 451, 594–601. [Google Scholar] [CrossRef]
- Navarathna, C.M.; Karunanayake, A.G.; Gunatilake, S.R.; Pittman, C.U., Jr.; Perez, F.; Mohan, D.; Mlsna, T. Removal of Arsenic (III) from water using magnetite precipitated onto Douglas fir biochar. J. Environ. Manag. 2019, 250, 109429. [Google Scholar] [CrossRef] [PubMed]
- Dickson, D.; Liu, G.; Cai, Y. Adsorption kinetics and isotherms of arsenite and arsenate on hematite nanoparticles and aggregates. J. Environ. Manag. 2017, 186, 261–267. [Google Scholar] [CrossRef] [PubMed]
- Ona-Nguema, G.; Morin, G.; Wang, Y.; Foster, A.L.; Juillot, F.; Calas, G.; Brown, G.E. XANES evidence for rapid arsenic(III) oxidation at magnetite and ferrihydrite surfaces by dissolved O2 via Fe2+-mediated reactions. Environ. Sci. Technol. 2010, 44, 5416–5422. [Google Scholar] [CrossRef] [PubMed]
- Liang, M.; Guo, H.; Xiu, W. Arsenite oxidation and arsenic adsorption on birnessite in the absence and the presence of citrate or EDTA. Environ. Sci. Pollut. Res. 2020, 27, 43769–43785. [Google Scholar] [CrossRef]
- Jiang, X.; Peng, C.; Fu, D.; Chen, Z.; Shen, L.; Li, Q.; Ouyang, T.; Wang, Y. Removal of arsenate by ferrihydrite via surface complexation and surface precipitation. Appl. Surf. Sci. 2015, 353, 1087–1094. [Google Scholar] [CrossRef]
- Jain, A.; Loeppert, R.H. Effect of competing anions on the adsorption of arsenate and arsenite by ferrihydrite. J. Environ. Qual. 2000, 29, 1422–1430. [Google Scholar] [CrossRef]
- Sun, S.; Zeng, H.; Xu, H.; Zhao, W.; Qi, W.; Hao, R.; Zhang, J.; Li, D. Adsorption of As(V) and P(V) by magnetic iron-based alginate-chitosan beads: Competitive adsorption and reduction mechanism of As(V) induced by Fe(II). Colloids Surf. A 2023, 675, 132068. [Google Scholar] [CrossRef]
- Cornell, R.M.; Giovanoli, R.; Schneider, W. Review of the hydrolysis of iron(III) and the crystallization of amorphous iron(III) hydroxide hydrate. J. Chem. Technol. Biotechnol. 1989, 46, 115–134. [Google Scholar] [CrossRef]
- Ji, Y.; Luo, W.; Lu, G.; Fan, C.; Tao, X.; Ye, H.; Xie, Y.; Shi, Z.; Yi, X.; Dang, Z. Effect of phosphate on amorphous iron mineral generation and arsenic behavior in paddy soils. Sci. Total Environ. 2019, 657, 644–656. [Google Scholar] [CrossRef] [PubMed]
- Du, H.; Shan, H.; Huang, J.; Zeng, C.; Zhang, J.; Liu, Y. Experiment on the influence of flow velocity and medium particle size on As migration. Earth Sci. 2022, 1–14. Available online: http://kns.cnki.net/kcms/detail/42.1874.P.20220907.1732.004.html (accessed on 14 March 2024).
- Chen, H.; Shan, H.; Peng, S.; Huang, J.; Liao, D.; Yan, Z. Hydrochemical influences on arsenic adsorption by river sand. Acta Sci. Circumstantiae 2021, 41, 2727–2739. [Google Scholar] [CrossRef]
- Zhang, T.; Zhao, Y.; Kang, S.; Li, Y.; Zhang, Q. Formation of active Fe(OH)3 in situ for enhancing arsenic removal from water by the oxidation of Fe (II) in air with the presence of CaCO3. J. Clean. Prod. 2019, 227, 1–9. [Google Scholar] [CrossRef]
- Wajda, A.; Goldmann, W.H.; Detsch, R.; Boccaccini, A.R.; Sitarz, M. Influence of zinc ions on structure, bioactivity, biocompatibility and antibacterial potential of melt-derived and gel-derived glasses from CaO-SiO2 system. J. Non Cryst. Solids 2019, 511, 86–99. [Google Scholar] [CrossRef]
- Sun, S.; Wen, K.; Yang, B.; Zhou, Q.; Dong, F.; Nie, X.; Liu, L.; Fan, S. The preparation and adsorption properties of novel active carbon/diatomite. Acta Petrol. Mineral. 2013, 32, 941–946. [Google Scholar]
- Wang, Y.; Yu, W.; Chang, Z.; Gao, C.; Yang, Y.; Zhang, B.; Wang, Y.; Xing, B. Effects of dissolved organic matter on the adsorption of norfloxacin on a sandy soil (fraction) from the Yellow River of Northern China. Sci. Total Environ. 2022, 848, 157495. [Google Scholar] [CrossRef]
- Zhang, L.; Song, L.; Zheng, X.; Teng, Y.; Wang, J. The remobilization of heavy metals influenced by interaction of DOM and iron oxides. Chin. J. Ecol. 2014, 33, 2193–2198. [Google Scholar] [CrossRef]
- Wang, H.; Ma, Y.; Chen, X.; Xu, S.; Chen, J.; Zhang, Q.; Zhao, B.; Ning, P. Promoting effect of SO42- functionalization on the performance of Fe2O3 catalyst in the selective catalytic reduction of NOx with NH3. J. Fuel Chem. Technol. 2020, 48, 584–593. [Google Scholar] [CrossRef]
- Xie, Q.; Ma, X.; Hadiya, A.; Nurmamat, X.; Zhao, Z. Effect of humic acid on the adsorption of dimethylarsinic acid by magnetite. Environ. Chem. 2023, 42, 658–670. [Google Scholar]
- Zhu, Y.; Peng, L.; Chen, S.; Feng, Y.; Xia, J.; Wang, W.; Chen, L.; Yin, H.; Zhou, M.; Hou, Z. Constructing all-in-one graphene-based supercapacitors for electrochemical energy storage via interface integration strategy. Carbon Lett. 2023, 33, 873–882. [Google Scholar] [CrossRef]
- Xi, Y.; Liao, T.; Li, J.; Zhang, L. Mechanism of zero-valent lead reduction for removing high concentration of arsenic from waste acid of lead smelting system. Process Saf. Environ. Prot. 2021, 156, 244–255. [Google Scholar] [CrossRef]
- Sudhakar, C.; Mukherjee, S.; Kumar, A.A.; Paramasivam, G.; Meena, P.K.; Nonappa; Pradeep, T. Interference of phosphate in adsorption of arsenate and arsenite over confined metastable two-line ferrihydrite and magnetite. J. Phys. Chem. C 2021, 125, 22502–22512. [Google Scholar] [CrossRef]
- Zhang, W.; Zhang, G.; Liu, C.; Li, J.; Zheng, T.; Ma, J.; Wang, L.; Jiang, J.; Zhai, X. Enhanced removal of arsenite and arsenate by a multifunctional Fe-Ti-Mn composite oxide: Photooxidation, oxidation and adsorption. Water Res. 2018, 147, 264–275. [Google Scholar] [CrossRef]
- Jiang, K.; Liu, J.; Han, Y.; Li, Y.; Zhu, Y. Effect of natural oxidation on floatability of pyrite and its mechanism. Met. Mine 2019, 111–114. Available online: http://dx.chinadoi.cn/10.19614/j.cnki.jsks.201902021 (accessed on 15 March 2024).
- Tong, J.; Luo, Y.; Liu, C. Effect of sulfide on arsenic-bearing ferrihydrite and arsenic-bearing alumina. Environ. Sci. Technol. 2022, 45, 99–105. [Google Scholar]
- Liu, Z.; Zhang, Q.; Ma, H.; Liu, J. Spectral characteristics of Hangjin2# clay and its mechanism in heterogeneous fenton reaction. Spectrosc. Spectr. Anal. 2021, 41, 3512–3517. [Google Scholar]
- Liu, H.; Wei, Y.; Sun, Y. The Formation of hematite from ferrihydrite using Fe(II) as a catalyst. J. Mol. Catal. A Chem. 2005, 226, 135–140. [Google Scholar] [CrossRef]
- Li, Y.; Gao, X.; Zhang, X.; Luo, W.; Hu, Q. Geochemistry of arsenic in sediments and groundwater in areas with arsenic polluted groundwater in Yuncheng Basin. Saf. Environ. Eng. 2017, 24, 68–74. [Google Scholar]
- Li, Y.; Gao, X.; Zhang, X.; Luo, W.; Hu, Q. Arsenic enrichment mechanism of groundwater in the western Hetao Plain. Bull. Mineral. Petrol. Geochem. 2023, 42, 289–297. [Google Scholar] [CrossRef]
Disclaimer/Publisher’s Note: The statements, opinions and data contained in all publications are solely those of the individual author(s) and contributor(s) and not of MDPI and/or the editor(s). MDPI and/or the editor(s) disclaim responsibility for any injury to people or property resulting from any ideas, methods, instructions or products referred to in the content. |
© 2024 by the authors. Licensee MDPI, Basel, Switzerland. This article is an open access article distributed under the terms and conditions of the Creative Commons Attribution (CC BY) license (https://creativecommons.org/licenses/by/4.0/).