Article

China’s Water Footprint on Urban and Rural Food Consumption: A Spatial–Temporal Evolution and Its Driving Factors Analysis from 2000 to 2020

1
School of Environment and Natural Resources, Renmin University of China, Beijing 100872, China
2
Institute of Ecological Civilization, Zhejiang Agriculture and Forestry University, Hangzhou 311300, China
3
Rural Energy & Environment Agency, Ministry of Agriculture and Rural Affairs of the People’s Republic of China, Beijing 100125, China
*
Author to whom correspondence should be addressed.
Water 2024, 16(2), 247; https://doi.org/10.3390/w16020247
Submission received: 27 November 2023 / Revised: 5 January 2024 / Accepted: 9 January 2024 / Published: 11 January 2024

Abstract

:
To comprehend the intricate interaction between water resources and food security, it is critical to examine the hidden water footprint (WF) of food consumption and its underlying causes within specific nations or areas. This study investigates the changes in the quality and structure of food consumption in China’s urban and rural areas from 2000 to 2020. Following the calculation of the WF associated with food consumption for both urban and rural populations, this study uses ArcGIS 10.6 software to map the spatial configuration of the provincial per capita WF. Moreover, the random forest model is utilized to uncover the salient determinants influencing the WF of food consumption in urban and rural contexts. Quantitatively, rural populations have witnessed a more pronounced acceleration in their per capita food WF compared with urban entities, with a notable upswing in the proportion of meat and poultry consumption. Spatially, regions exhibiting elevated WF for urban populations have transitioned from the western zones toward the southeast and northeast, whereas a marked east–west dichotomy is evident in rural areas. In terms of drivers, for urban demographics, economic variables emerge as paramount determinants for food WF, while rural areas underscore the prominence of natural and technological parameters. The insights garnered from this investigation bear profound implications for facilitating balanced nutritional intake among China’s urban and rural populations, alleviating food-related water resource pressures, and optimizing water resource utilization.

1. Introduction

The global food situation is becoming increasingly precarious, with the world’s population expected to reach 9 billion by 2050, necessitating a 70% increase in food production [1]. Concurrently, water, the lifeblood of agriculture, is under unprecedented stress. Global freshwater resources are dwindling, with over 2 billion people living in countries experiencing high water stress [2]. The changes in precipitation, evaporation capacity, and surface runoff capability due to global warming significantly impact the total water resources [3]. Directing focus toward China, a densely populated nation, it serves as a noteworthy example of these global challenges. As the second-most populous country, China exhibits substantial food consumption levels, rendering food-related issues a consistent focal point in Chinese government policies. Due to the inherent nature of agricultural products, their production and consumption demand a significant amount of water resources. Given China’s water scarcity and the uneven regional distribution of its water resources, this poses a dual challenge to China’s food and water security. In 2020, China’s total water consumption was 581.29 billion m3, of which agricultural water consumption accounted for 361.24 billion m3, equaling approximately 62.1% of the total water consumption [4]. Agricultural production is often driven by residents’ food demand [5]. China has seen a surge in food consumption, accompanied by a dramatic shift toward water-intensive animal-based dietary habits [6,7,8,9,10]. The confluence of escalating food consumption and evolving dietary patterns is projected to exert additional strain on the water supply system, thereby aggravating water scarcity issues within China. This imbalance underscores the urgency of understanding the water footprint of China’s food consumption. At the same time, there is a dual urban–rural structural difference in the primary food consumption of urban and rural residents. Looking at China’s situation, in 2020, the per capita annual consumption of eggs and dairy products for urban residents was 30.8 kg, while for rural residents, it was only 19.2 kg. This is approximately 62% of the urban residents’ per capita consumption. With the rapid economic development in both the urban and rural areas of China, the food consumption capabilities and perceptions of residents are gradually changing. They are increasingly pursuing a rich and nutritious diet. This change in food consumption has led to a greater demand for water resources, posing a greater challenge to China’s water resources. Given the multifaceted challenges mentioned above, the balance between food and water resources has garnered attention and interest from the academic community.
When attempting to establish the connection between food consumption and water resource use, the metric of the water footprint (WF) is gradually gaining attention [11,12]. It is extensively utilized to assess both the direct and indirect water usage associated with food consumption [13]. Previous research has investigated the relationship between different dietary patterns and water resource consumption from the perspective of nutritional dietary structure [14]. Some studies demonstrate that diets combining plant-based foods with a limited number of low trophic level animals (such as bait fish and bivalves) exhibit smaller water footprints [15,16,17]. At the same time, people live in different urban or rural areas, resulting in significant differences in food consumption and contained water footprints [18]. Relevant studies show that urban residents consume more meat, poultry, eggs, and dairy food than rural residents but consume less grain than rural residents. They then deduce that the water footprint consumption of animal food is higher in urban areas than in rural areas [19]. Exploring diverse factors contributing to food consumption WF is another focus of previous studies. There is a consensus that population density, per capita GDP, and urbanization rate influence the water footprint of food [20]. Some scholars believe that crop yield and investment in agricultural production technology influence residents’ food consumption [21]. Additionally, the abundance or scarcity of water resources directly impacts agricultural production. There are arguments suggesting a correlation between the level of education of residents and their water conservation awareness [22]. In terms of research methods for the driving factors of the food water footprint, the STIRPAT (Stochastic Impacts by Regression on Population, Affluence, and Technology) model and the method of structural decomposition analysis (SDA), and Life Cycle Assessment (LCA) are widely used [23,24]. These methods provide an integrated framework to analyze the role of multiple factors, such as population, wealth, and technology, in environmental impacts, facilitating validation and comparison. However, this necessitates substantial data and sophisticated modeling support. Due to the flexibility of the methodology, the modeling may impact result accuracy.
Taken together, the existing literature on the water footprint of food consumption is relatively rich, but there are still limitations in the following three aspects. Firstly, the distinct urban–rural disparity in China is reflected in the different food consumption structures of urban and rural residents, resulting in a differentiated water footprint of food consumption. However, scattered studies separately discuss urban and rural residents and conduct a comparative analysis of their drivers. Secondly, China’s vast territory and large spatial scale lead to differences in economic, social, cultural, and food consumption between regions. Existing studies on the food and water footprints of residents at the national scale are relatively comprehensive, but studies on different regions and provinces need to be strengthened. Finally, while commonly used methods provide a solid methodological basis for the study of food consumption WF, most of them primarily establish linear correlations between the water footprint and its influencing factors, thus lacking an importance ranking of the drivers.
To address these gaps, this study focuses on the regional heterogeneity in the water footprint of food consumption and its potential drivers in urban and rural China. Specifically, this study investigates the spatial and temporal variations in food consumption patterns and associated water footprints in the urban and rural areas of China over the period of 2000 to 2020. Based on these water footprint datasets, a random forest model is used to further investigate the key drivers of the food water footprint changes in urban and rural areas. In addition, the study uses partial dependency analysis to reveal the intricate non-linear linkages between these factors and the water footprint of food consumption. This study is expected to remedy the limitations of the existing studies and provide targeted recommendations for enhancing water and food security in urban and rural areas of China.

2. Materials and Methods

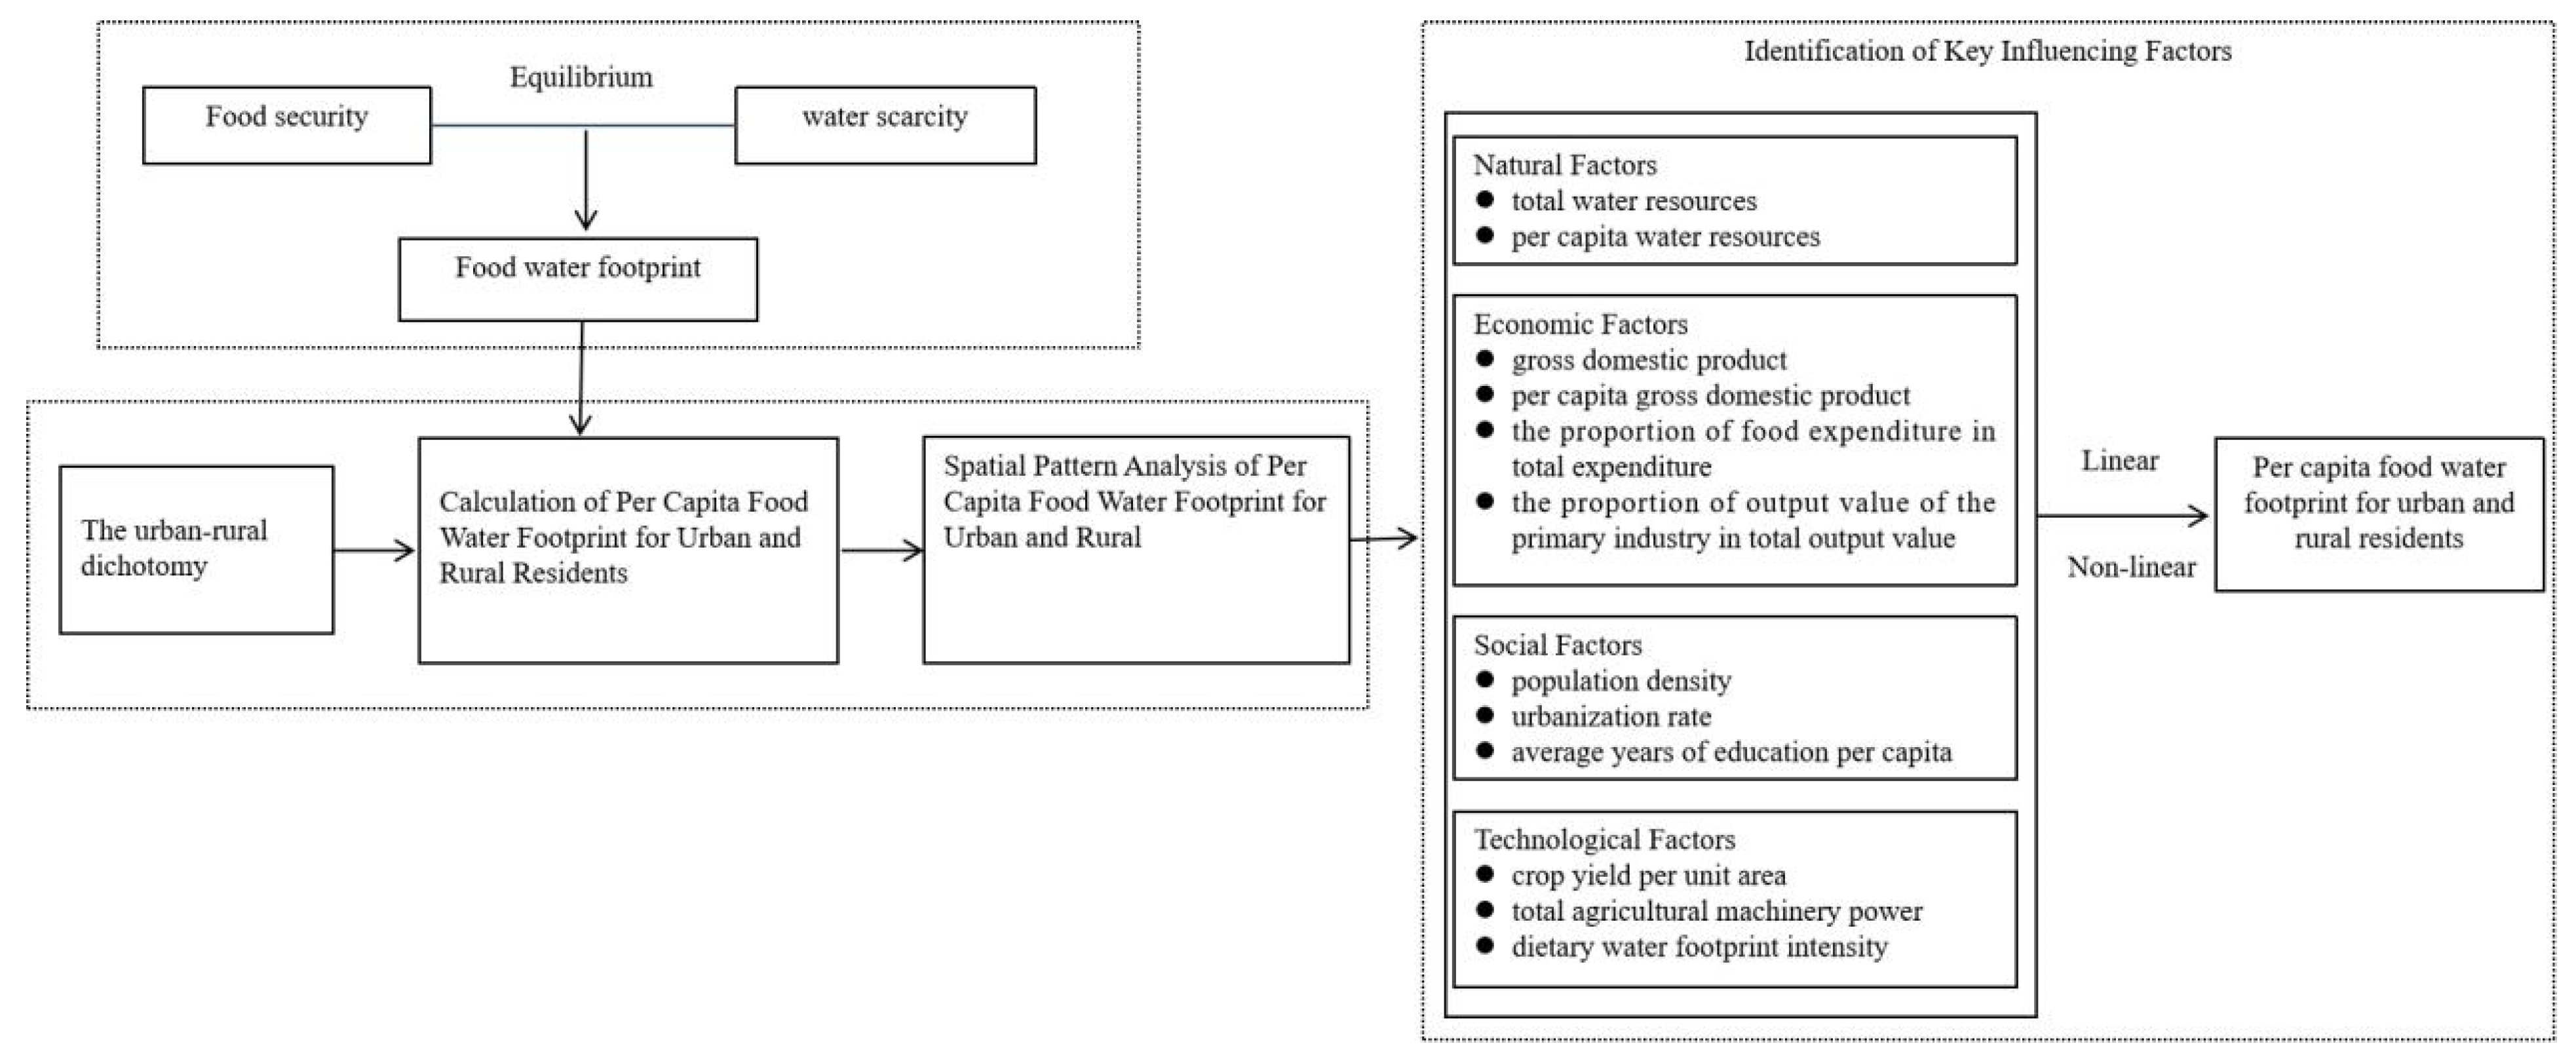
2.1. Analytical Framework

The total per capita food water footprint is a vital index for evaluating the virtual water content of residents’ food consumption. Due to the heterogeneity in socio-economic factors [25,26], resource endowments [27], and technological levels among provinces [28], there might be spatial disparities in the per capita food WF, which can evolve over time into different spatial patterns. At the same time, due to the differences in these factors, a dual structure of the food WF might emerge among urban and rural residents [29,30].
To reveal the spatiotemporal evolution patterns and key influencing factors of per capita food WF for urban and rural residents across provinces in China, this study first gathers statistics on the consumption of seven primary food categories by urban and rural residents in China’s 31 provinces (including municipalities) and calculates their per capita food WF. Subsequently, the spatiotemporal evolution is analyzed using geographical statistical methods. Finally, using a random forest model, this study further identifies the key factors influencing the per capita food WF of urban and rural residents, examining the linear or nonlinear response relationships between each factor and the per capita food WF of urban and rural residents (Figure 1).

2.2. Research Methodology

2.2.1. Calculation Method for the per Capita Food Water Footprint

To obtain the total per capita water footprint of food consumption, we sum the water footprints corresponding to the per capita consumption of various types of food. The water footprint of a single type of food can be obtained by multiplying the virtual water content per unit weight of the food by the per capita consumption of the food. The formula is as follows:
M D W F p e r u r b a n = i = 1 n V W C i × P C C i u r b a n
M D W F p e r r u r a l = i = 1 n V W C i × P C C i r u r a l
where M D W F p e r u r b a n and M D W F p e r r u r a l represent the per capita main dietary water footprint for urban and rural residents (m3/a), respectively; V W C denotes the virtual water content per unit weight of the i food type (m3/kg); P C C i u r b a n and P C C i r u r a l represent the per capita consumption of the i food type for urban and rural residents (kg/a); and n stands for the number of food types.

2.2.2. Model for Analyzing Key Influencing Factors

The random forest (RF) algorithm, as proposed by Bierman [31] and further developed, represents a significant advancement in machine learning, particularly for its application in areas such as water resource management. This method, based on classification trees, effectively addresses issues like collinearity and overfitting. RF is distinguished by its ease of implementation, robust interpretability, and ability to assess the importance of individual variables, along with its exceptional predictive capabilities [32,33,34]. Key parameters like ‘ntree’ and ‘mtry’ are instrumental in enhancing the model’s accuracy. In RF, ‘ntree’ denotes the number of trees within the forest. A larger ‘ntree’ generally results in improved model accuracy but at the cost of increased computational load. ‘mtry’ specifies the number of variables considered for splitting at each node, playing a pivotal role in introducing randomness and reducing model bias [35]. Overall, RF’s adaptability and effectiveness across various analytical contexts establish it as a vital tool in predictive modeling and analysis. The calculation formula of the model is as follows:
i m i = 1 n t v S x i G a i n X i , v
where i m i represents the contribution of X i to the model, expressed as I n c M S E , and the higher the I n c M S E , the higher the importance; S x i denotes the set of nodes in the random forest of n t regression trees that are split by X i ; and Gain ( X i , v ) is the Gini information gain in X i at the split node v , used to identify the predictor variable with the maximum information gain. In this study, random forest regression was performed using R-studio software (R-4.3.2) with the following parameters: ntree = 500, mtry = 3, and other default settings.

2.3. Data Source and Variable Description

Given the reliability and completeness of the data, this study selects 7 main food categories: grains (corn, wheat, rice, and potatoes), vegetable oil, meat (pork, beef, and lamb), poultry, eggs, dairy, and vegetables. This study utilizes data spanning from 2000 to 2020 on the food consumption and population of urban and rural residents across 31 provinces and municipalities in China. The sources for these data include a range of authoritative publications: the ‘China Statistical Yearbook’, ‘China Rural Household Survey Yearbook’, ‘China Household Survey Yearbook’, ‘China Urban (Town) Living and Price Yearbook’, and ‘China Price and Urban Household Income and Expenditure Survey Statistical Yearbook’. Additionally, statistical yearbooks from various provinces, autonomous regions, and municipalities, published between 2001 and 2021, were also consulted to ensure a comprehensive and accurate dataset. The virtual water content data are derived from the study results of Hoekstra and Mekonnen on the water footprint in China [36,37]. The consumption proportions of meat and poultry reference the research of Li Zheming [19].
In the variable selection for the key impact factor analysis model, this paper uses provinces (municipalities directly under the central government) as samples, considering the urban and rural per capita food WF measured using Formulas (1) and (2) as the dependent variables. The explanatory variables are selected according to prior studies [27,28]. Considering that the differences in natural resource endowments can affect the production of crops, “total water resources (wr)” and “per capita water resources (wr_p)” are chosen to represent natural conditions. The level of economic development closely correlates to the food consumption of residents, justifying the selection of “Gross Domestic Product (GDP)” and “Per Capita GDP (GDP_P)” as indicators to represent the impact of economic factors on the total amount of per capita food WF. According to the Engel coefficient, as the economic level of a country or region develops, the proportion of people’s expenditure on food decreases [38,39,40]. Therefore, the “proportion of food expenditure in total expenditure” is selected as a representation of economic elements. Simultaneously, this indicator can also intuitively express the changes in residents’ food consumption and consumption structure. “The proportion of the value of the primary industry in the total output value (agri)” aids in comprehending the level of agricultural development by examining the value of agriculture. Considering the impact of population size on food consumption, “population density (pop)” and “urbanization rate (urb)” are chosen as proxies for social factors (the mention of “urbanization rate” here refers to the impact of the urbanization rate of a particular region on the food water footprint of its urban or rural residents). At the same time, the selection of social factors considers the impact of the education level of individuals (edu) on the water footprint. In terms of technical factors, crop yield per unit area (yield), total agricultural machinery power (power), and dietary water footprint intensity (intensity) are chosen as proxies. Dietary water footprint intensity (intensity) is the ratio of the total dietary water footprint to GDP. The smaller the water footprint intensity, the less virtual water is consumed per CNY 10,000 of GDP, and the higher the water resource utilization efficiency (Table 1).
The data for the driving factors comes from the “China Statistical Yearbook” and the provincial statistical yearbooks. Ultimately, we obtained the consumption amounts of seven types of food, per capita food WF, and values of driving factors for urban and rural residents of 31 provinces (and municipalities) in China from 2000 to 2020.

3. Results

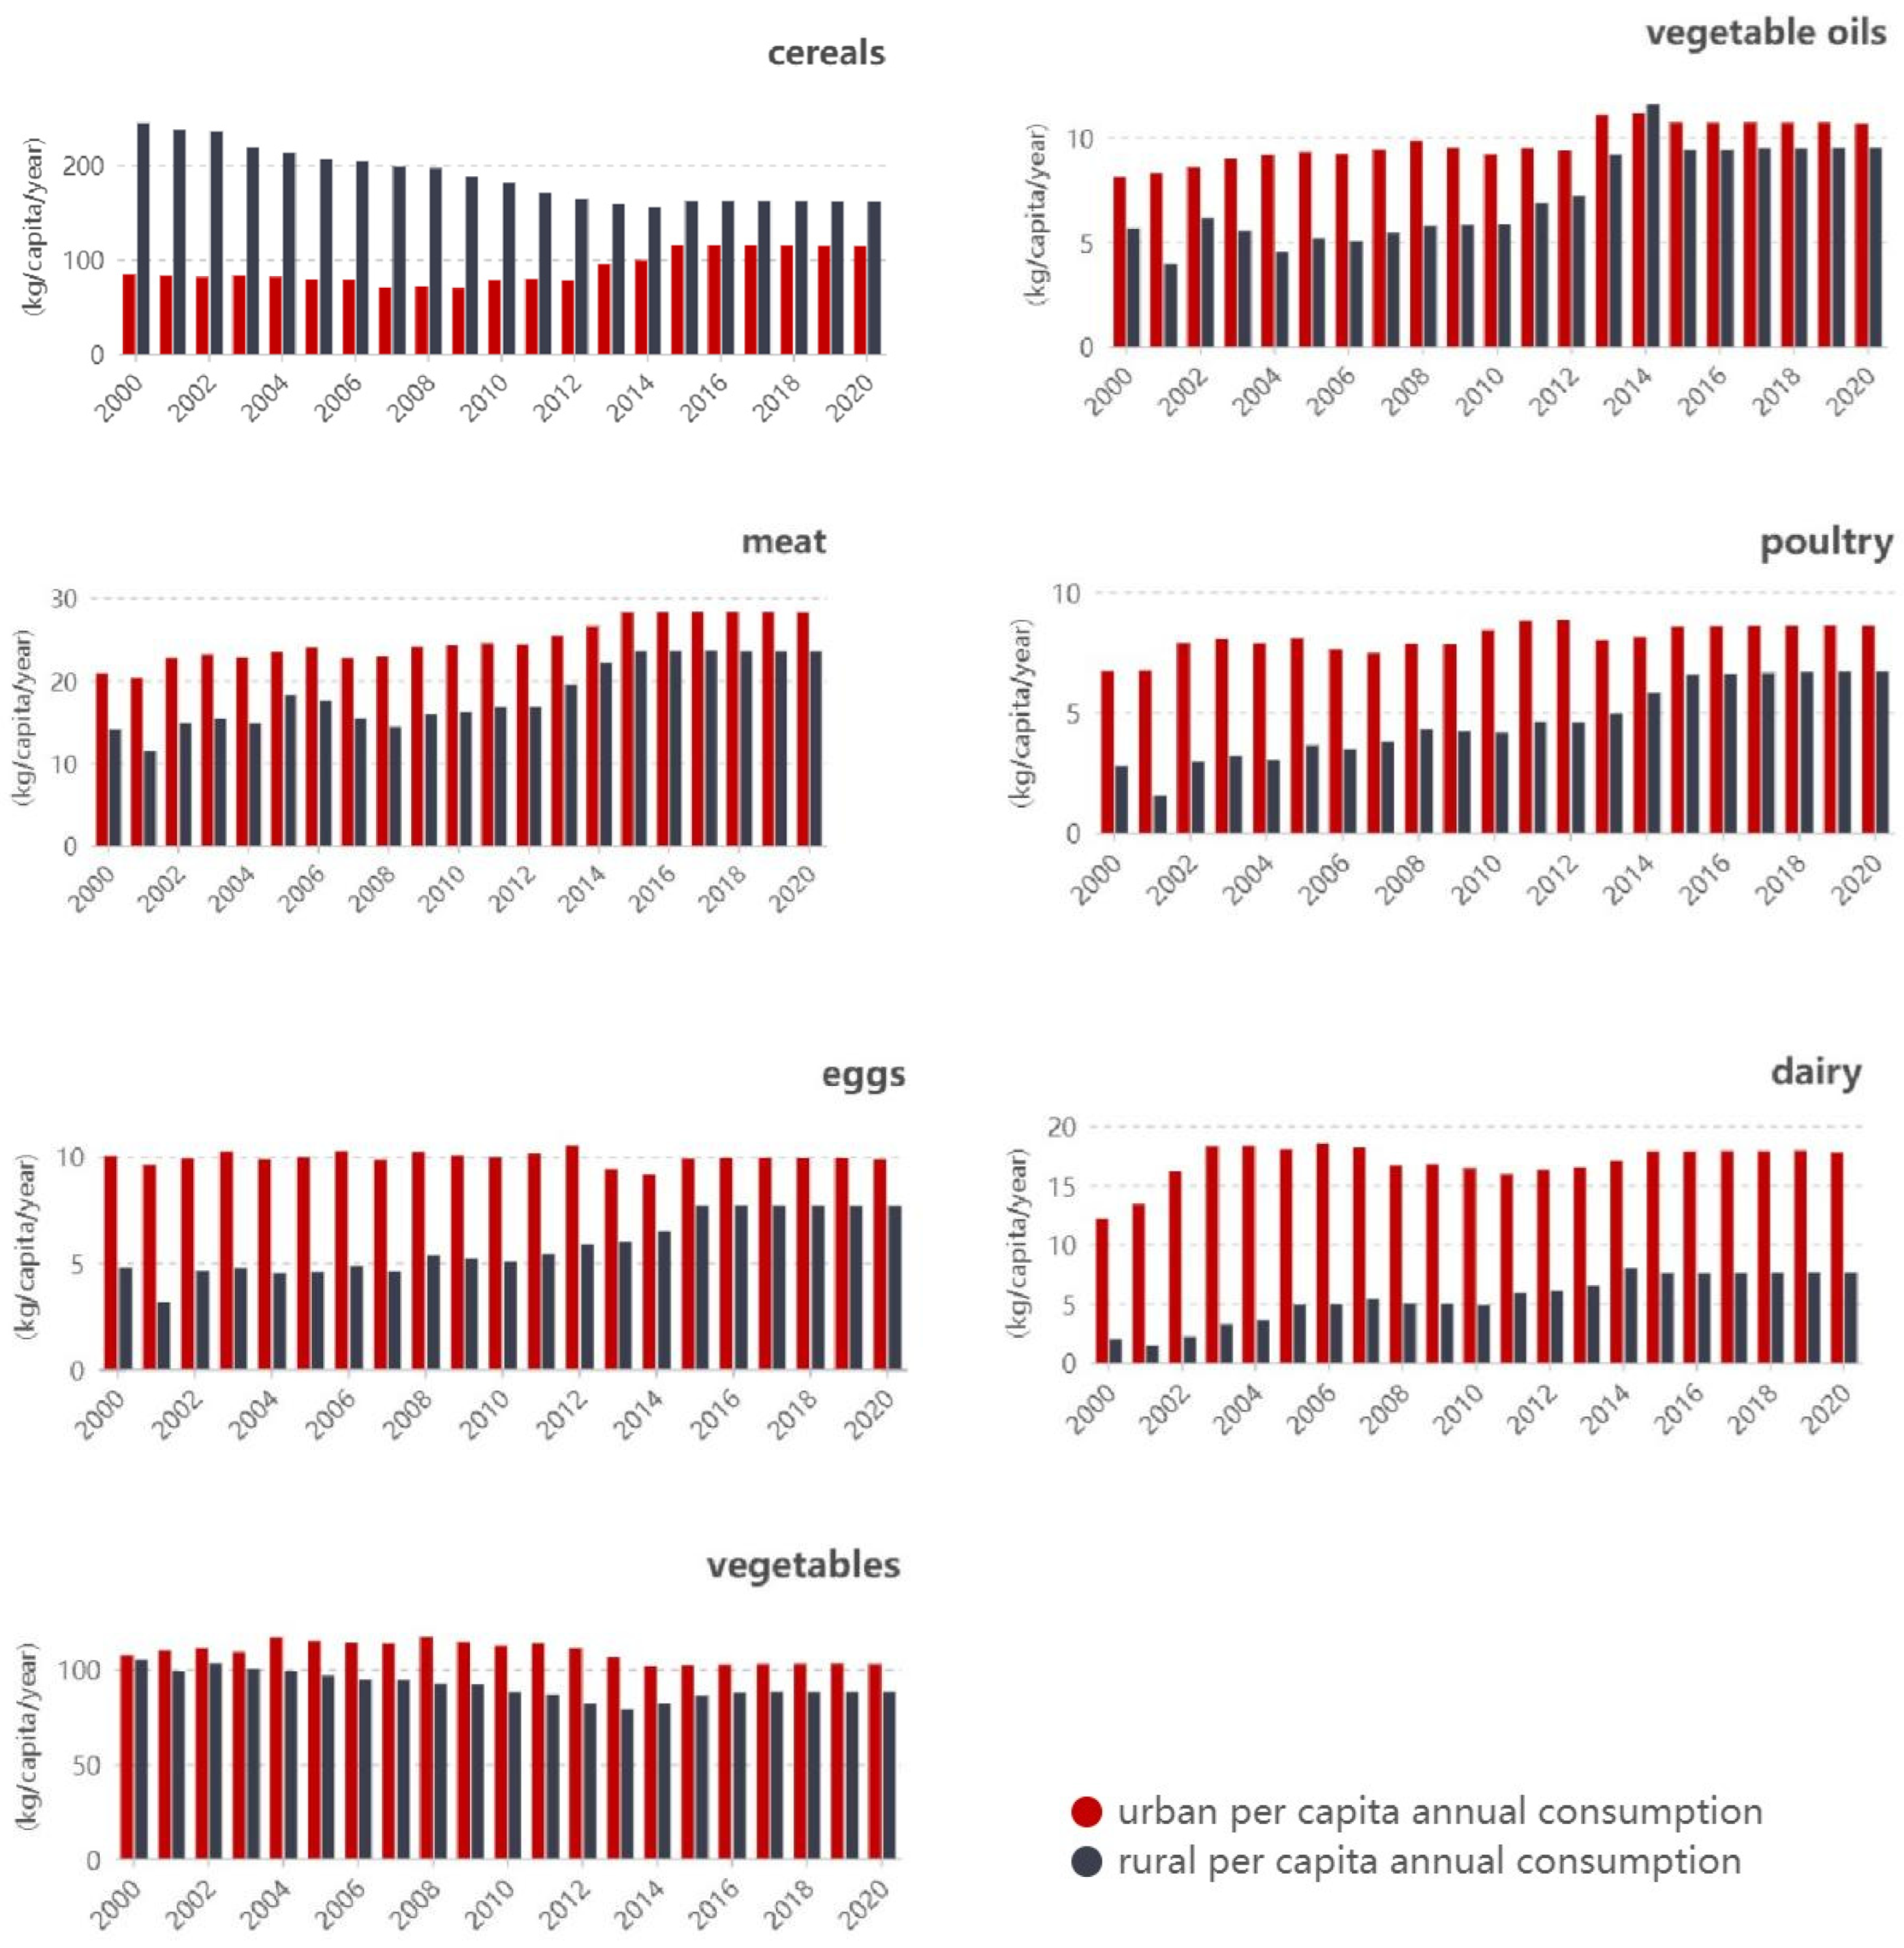
3.1. Urban and Rural Residents’ per Capita Food Consumption

From 2000 to 2020, the per capita food consumption and its structure among urban and rural residents in China gradually changed. Among urban residents, the consumption of grains, vegetable oils, meats, poultry, and dairy fluctuated upward to a stable state, with growth rates of 35.42%, 31.50%, 35.52%, 28.56%, and 45.96%, respectively. The consumption of grains by rural residents decreased annually, with a drop of up to 34.16%, while the consumption of vegetable oils, meats, poultry, eggs, and dairy all fluctuated upward. Dairy consumption in rural areas remained low, accounting for only 42.85% of that in urban areas. Overall, the per capita food consumption gap between urban and rural areas steadily decreased, and there was a shift toward a more unified food consumption pattern (Figure 2).

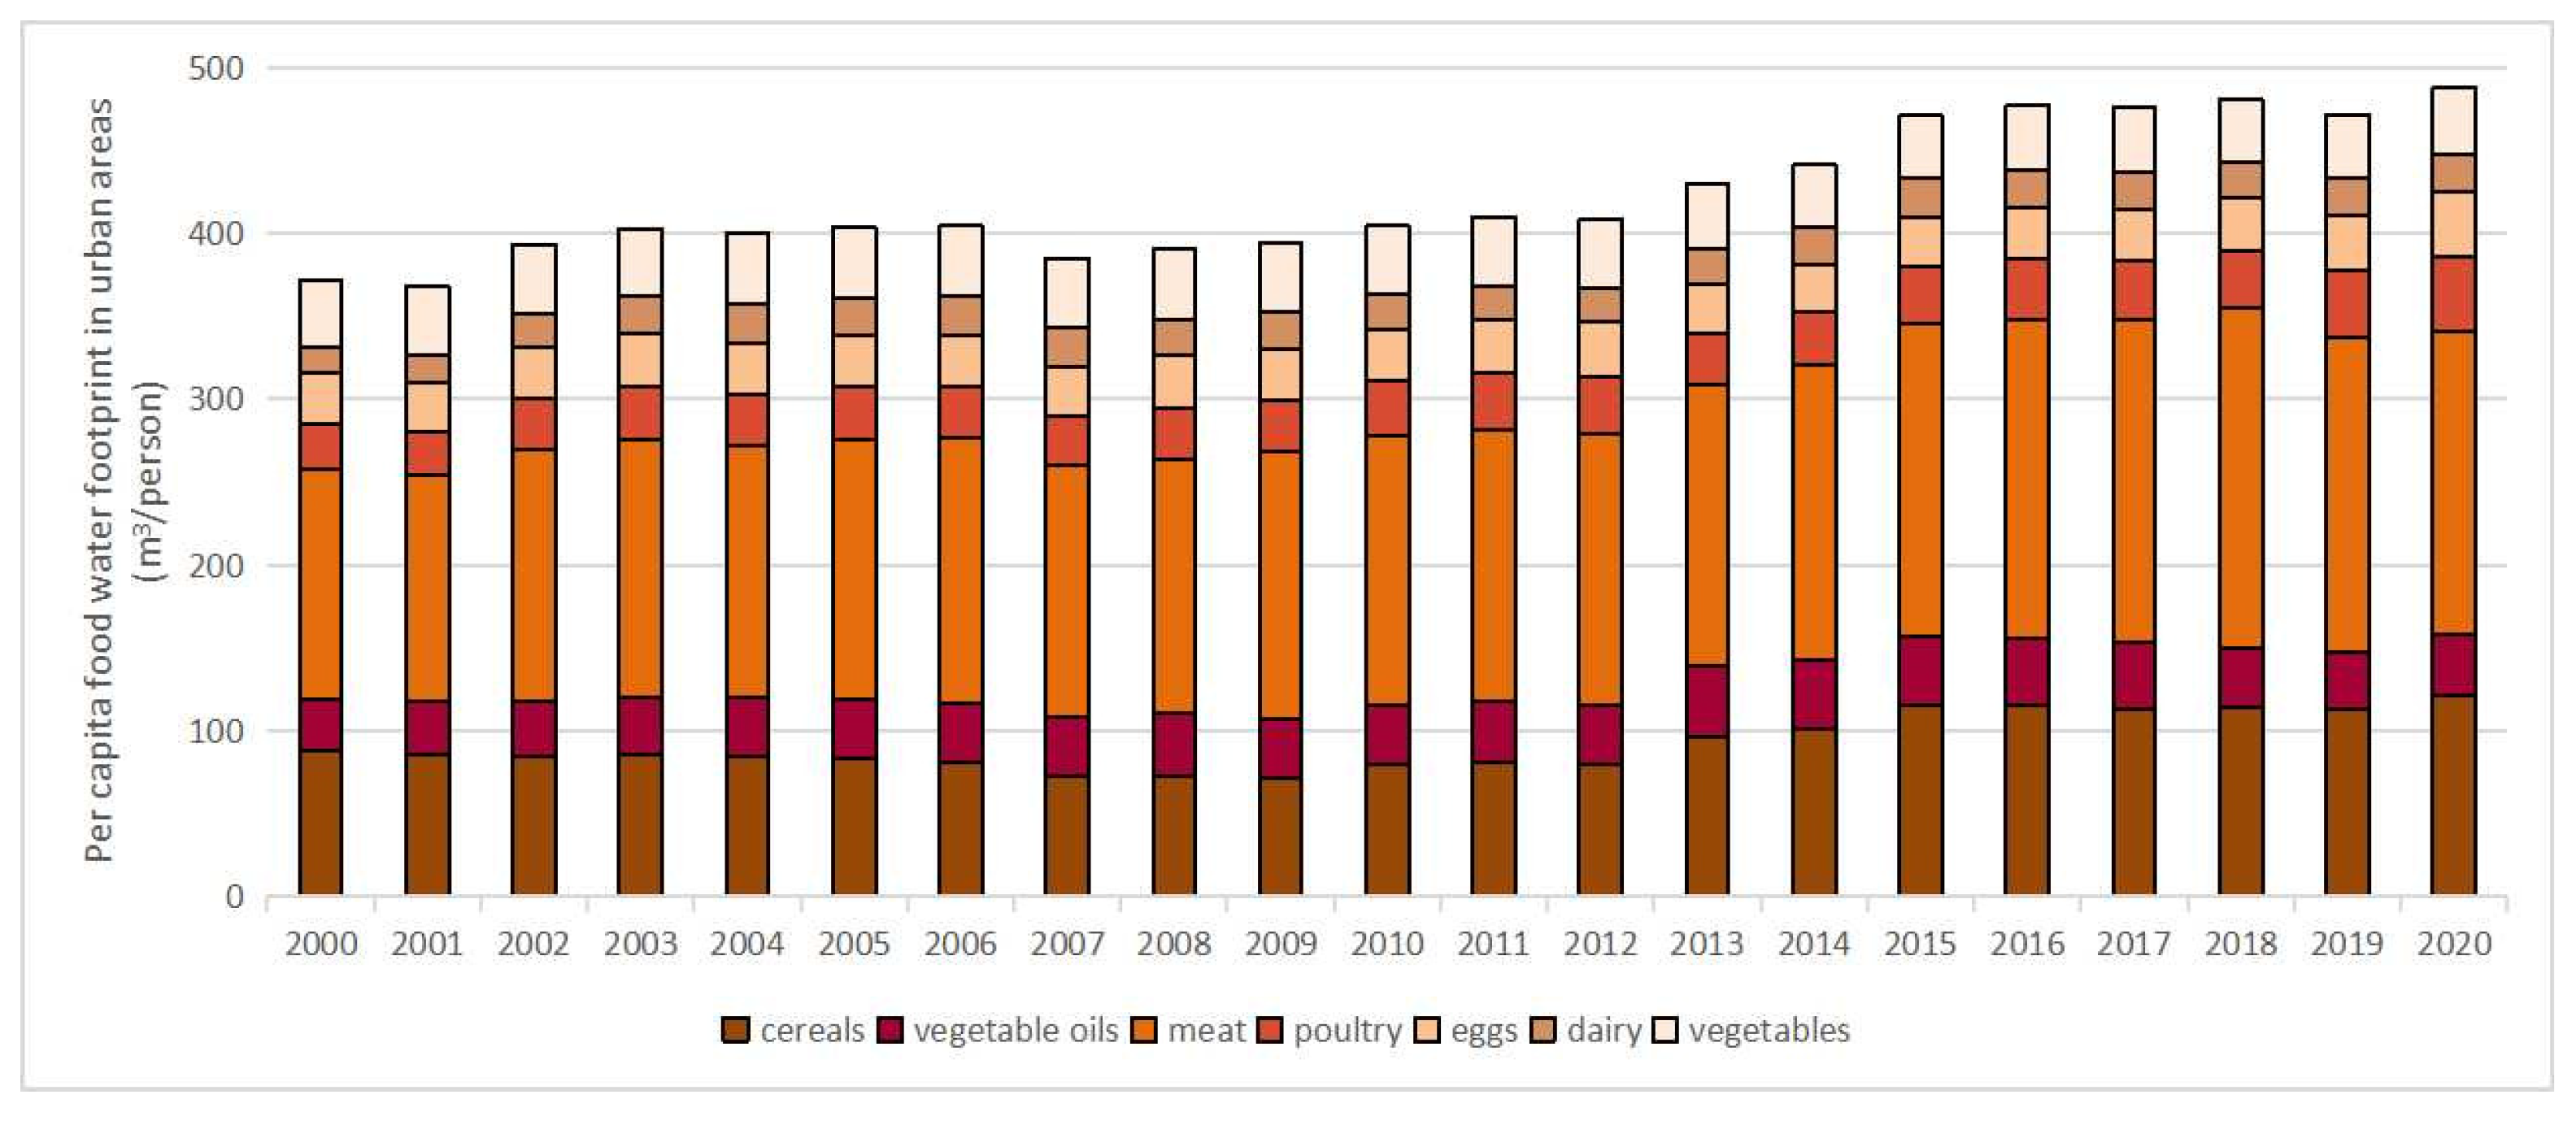
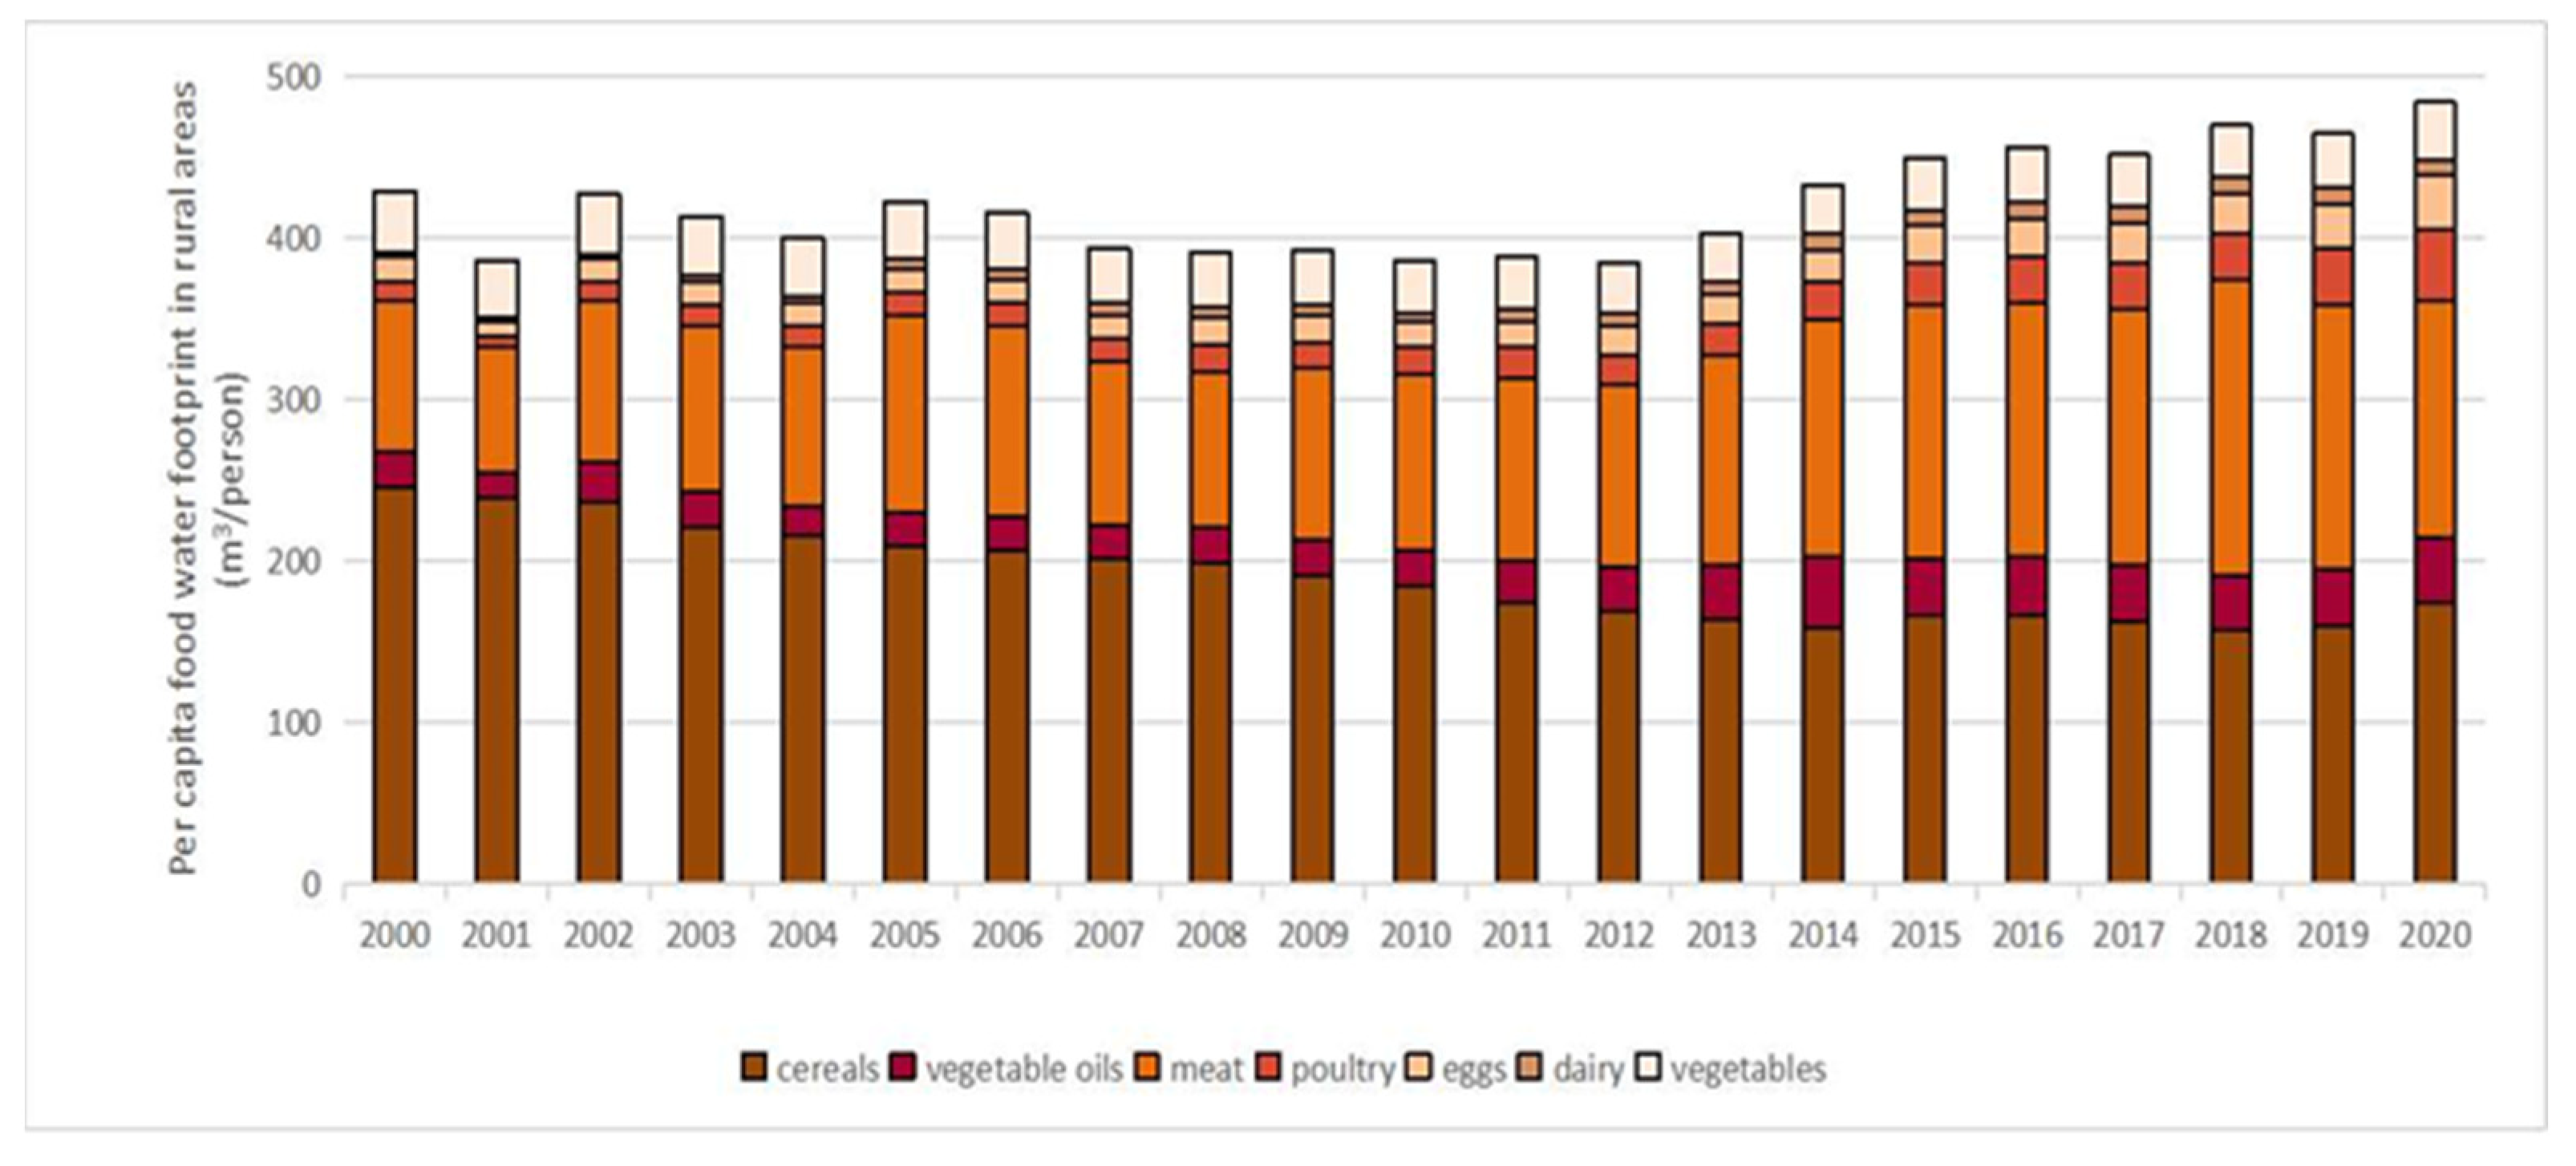
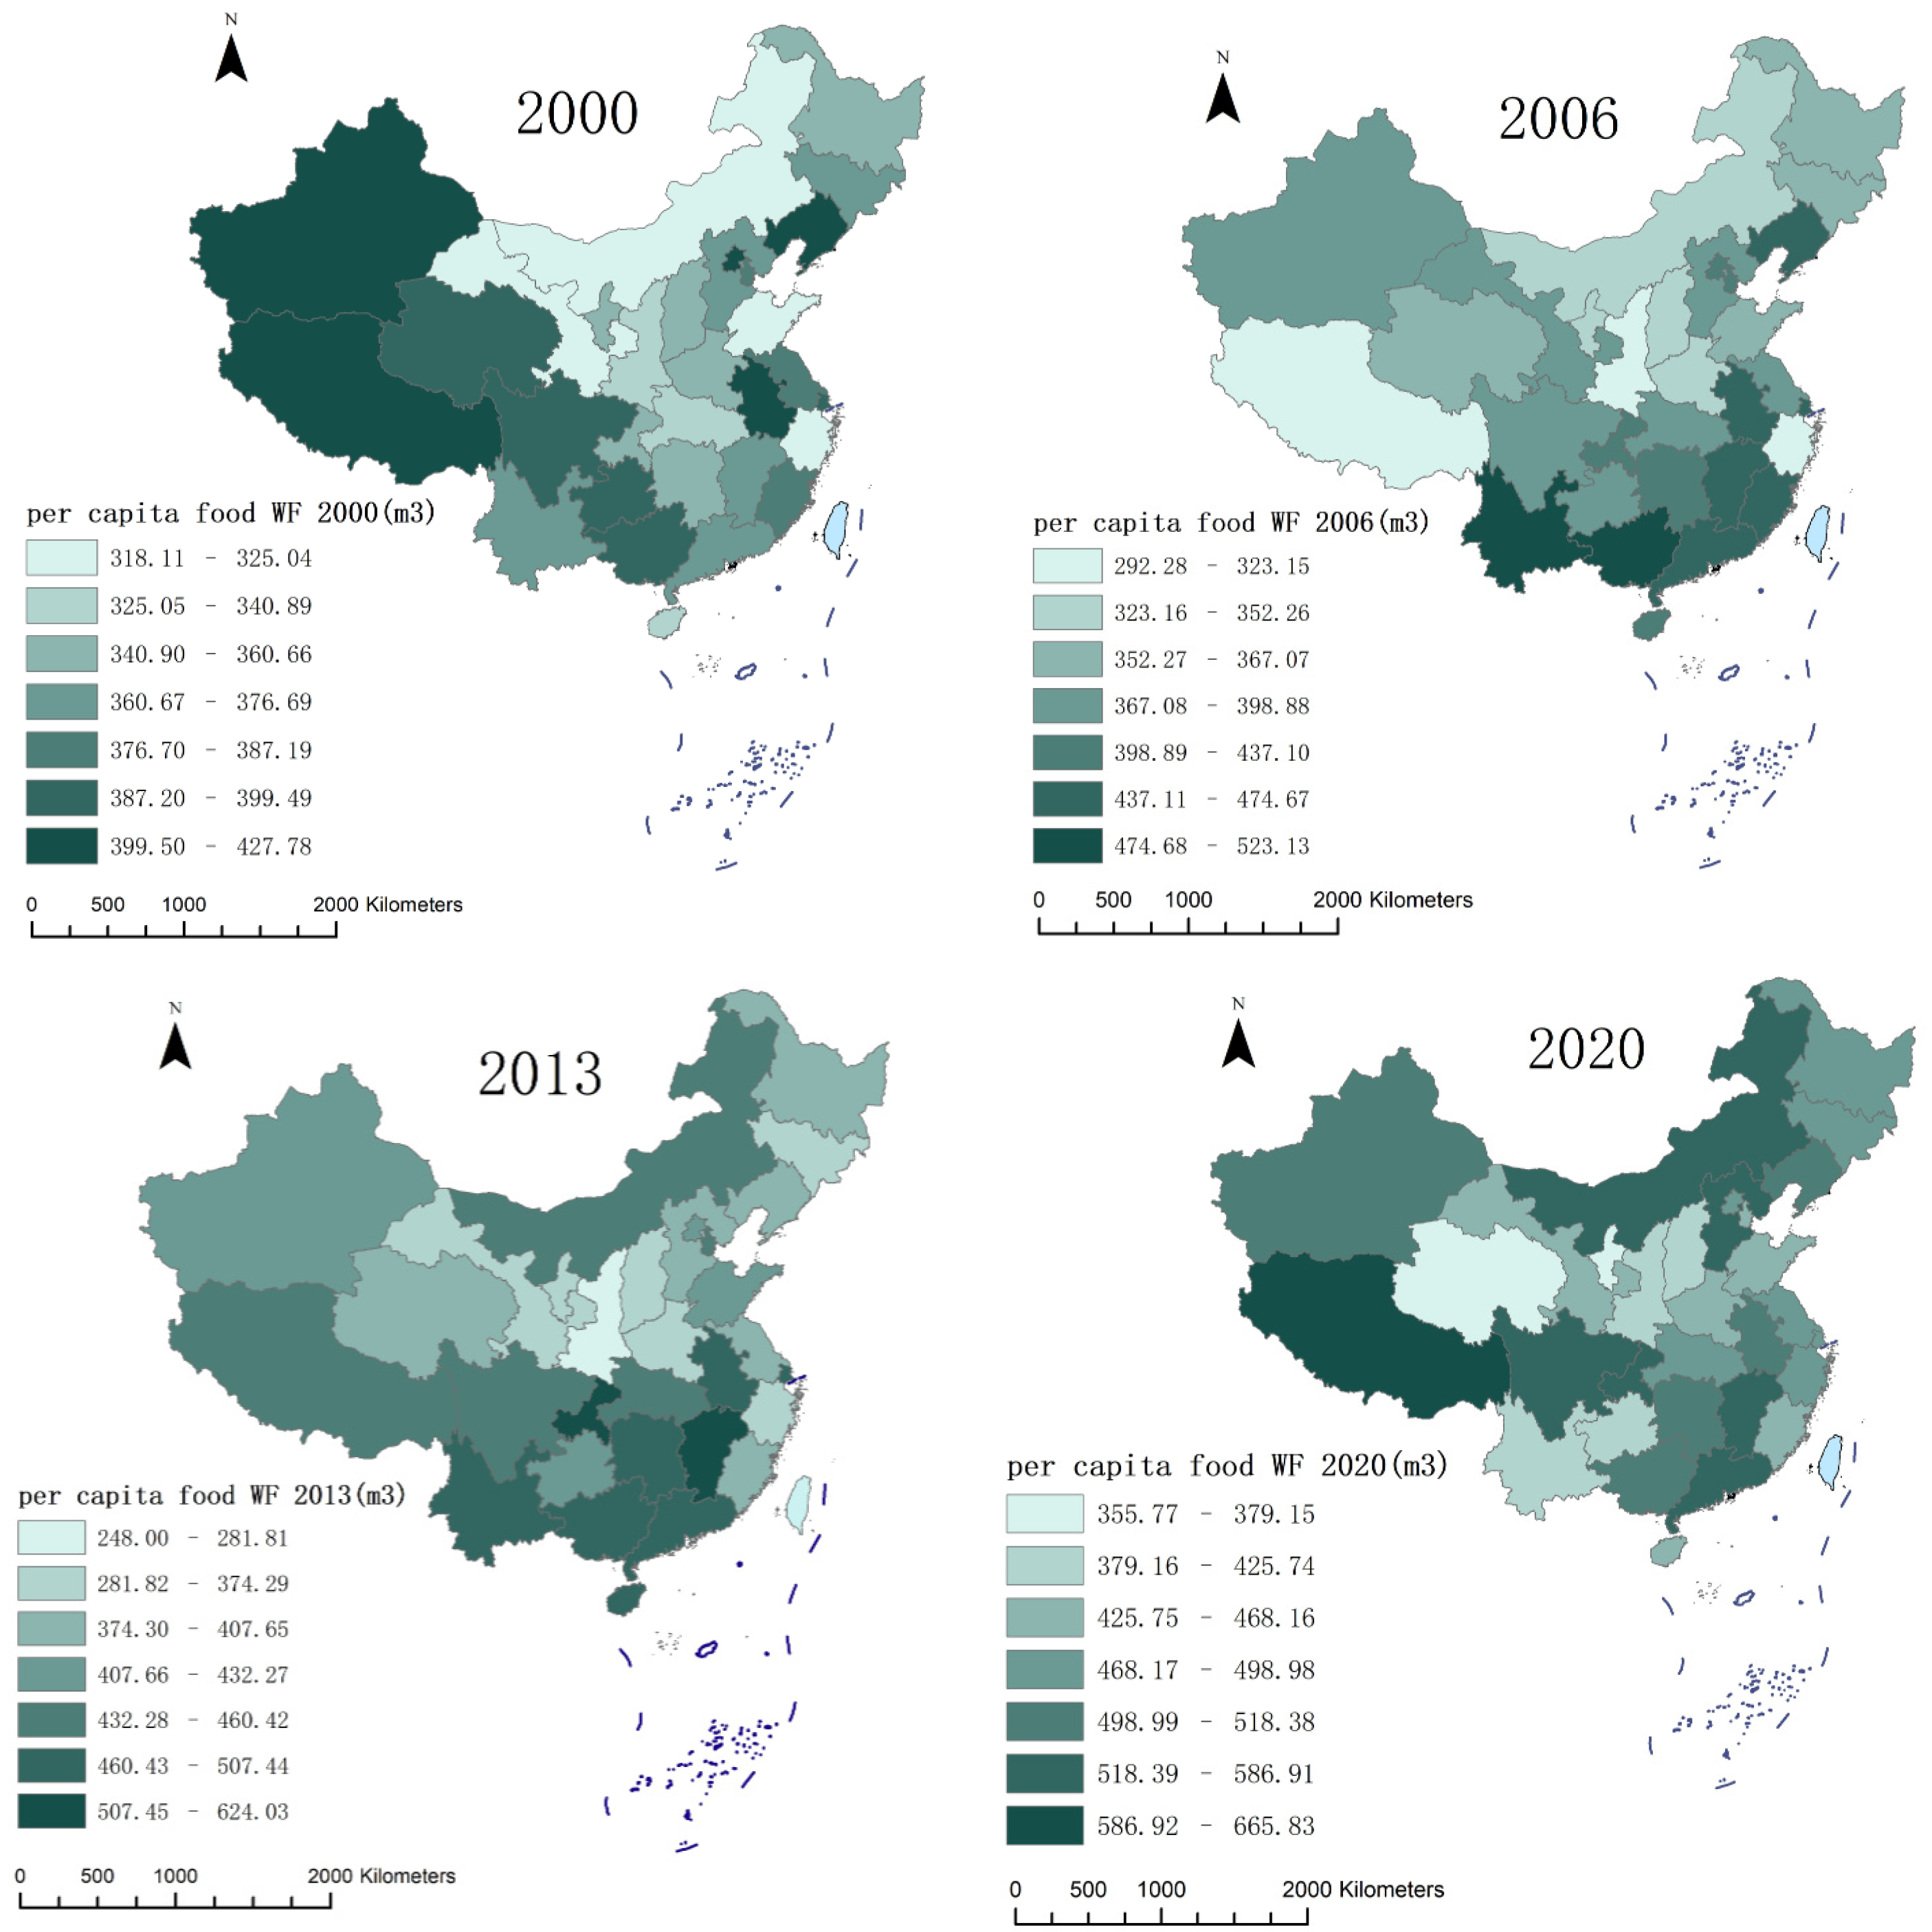
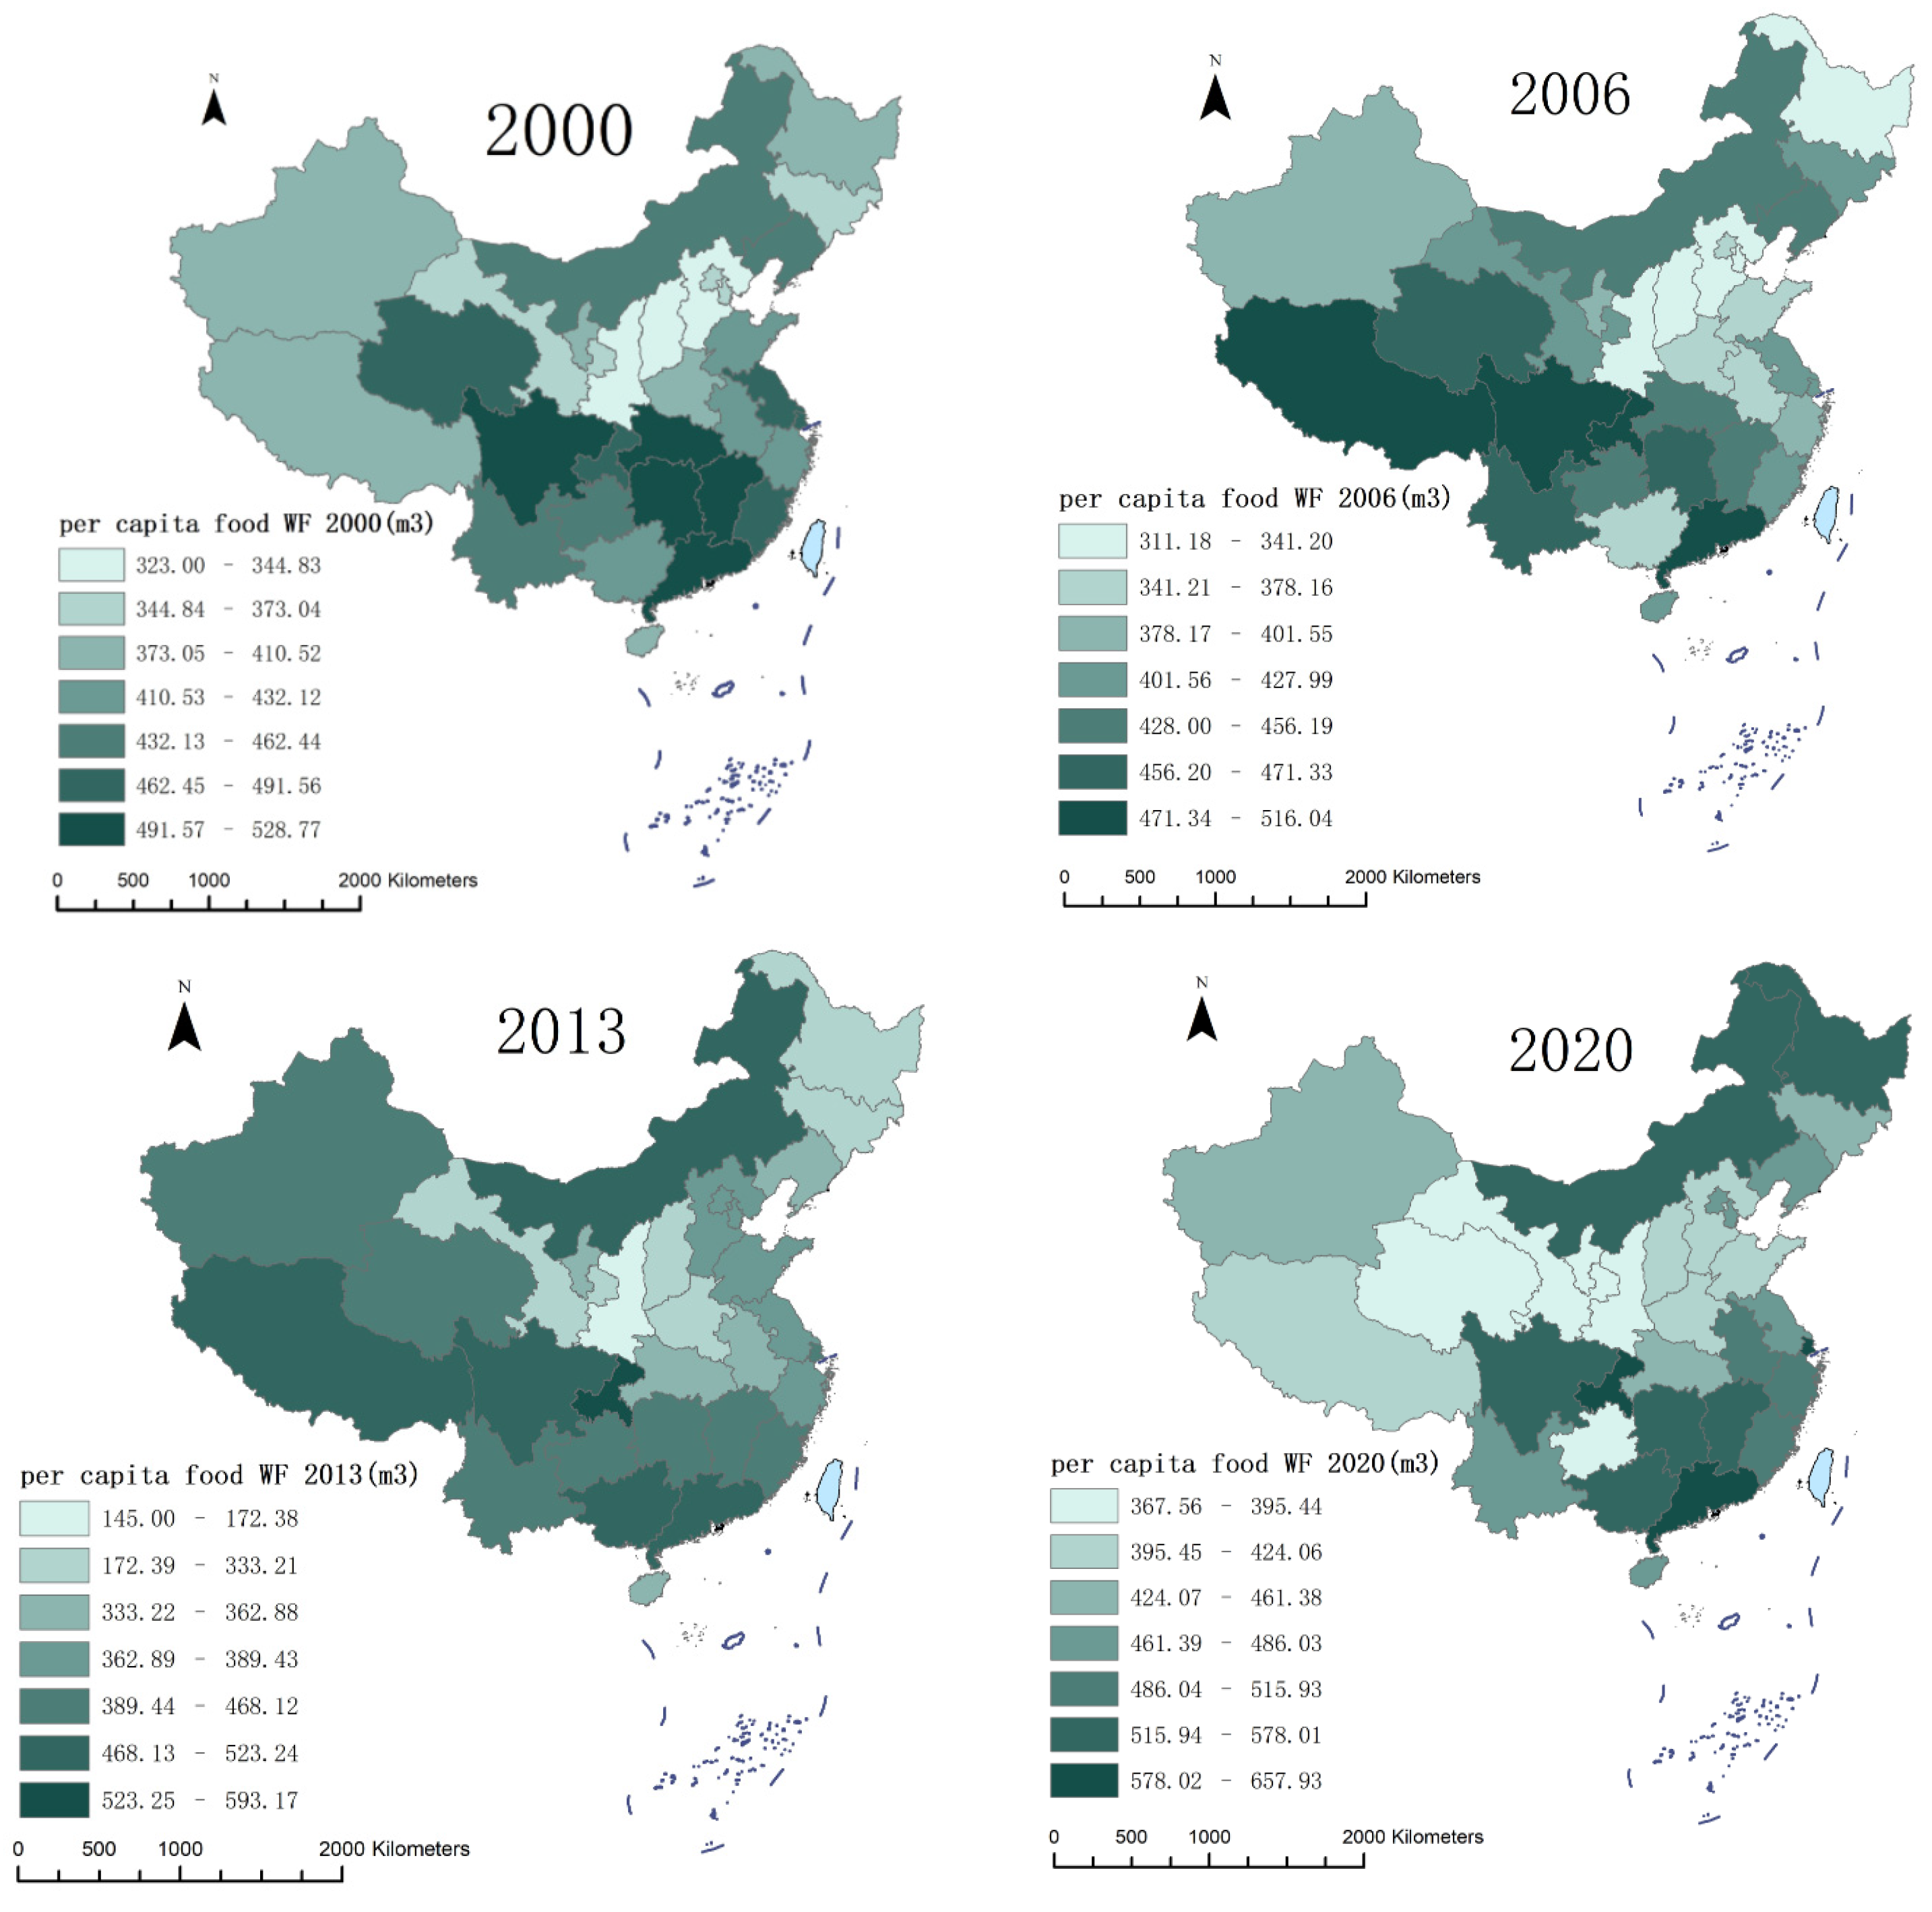
3.2. Analysis of the Spatiotemporal Evolution of Urban and Rural Residents’ per Capita Food Consumption WF

From 2000 to 2020, a fluctuating upward trend was observed in the per capita food consumption of urban residents. Among various food types, the water footprints of grains, vegetable oils, meats, poultry, and dairy products notably increased, while the water footprint of eggs and vegetables exhibited minimal changes (Figure 3). Particularly noteworthy is the significant increase in the water footprint associated with cereals, which increased by 38.39% between 2000 and 2020.
From 2000 to 2020, the food consumption WF of rural residents went through a process from a fluctuating decline to a fluctuating increase. Among the seven major food categories, the decline in grains was the largest, and compared with the year 2000, there was a 29.23% decrease in 2020. The WF of the other six food types increased to varying degrees, with the most significant increase of 4.03% observed in the WF of meat consumption (Figure 4).
Spatially, from 2000 to 2020, the variations in food consumption WF among urban residents in different provinces exhibited heterogeneous trends (Figure 5). Provinces situated in the central region, such as Gansu, Ningxia, Shaanxi, and Shanxi, exhibited limited growth in per capita food consumption WF. Their WF maintained a relatively lower level among all provinces (Figure 5). Concurrently, provinces characterized by higher WF underwent a notable shift from being predominantly concentrated in the western regions to being more prominently distributed in the southeastern areas. The southeastern provinces exhibited the most substantial escalation in per capita food consumption water footprints, rapidly ascending in rankings among all 31 provinces. Particularly, the provinces including Hunan, Jiangxi, and Guangdong emerged as frontrunners in per capita food consumption water footprints by 2020. Conversely, provinces in the western regions experienced relatively slower increases in per capita WF, resulting in a notable drop in rankings among the 31 provinces by 2020. In the northeastern region, provinces like Heilongjiang, Jilin, and northern Inner Mongolia gradually observed an elevation in the per capita food consumption WF. These provinces formed a cluster with Hebei and Liaoning, where elevated levels of per capita WF were noted. From the spatial distribution map, it can also be observed that areas with either high or low per capita WF exhibit spatial clustering rather than being dispersed randomly.
The changes in food consumption WF in rural areas varied across different regions during this period. The central region provinces, such as Gansu, Ningxia, Shaanxi, Shanxi, and Hebei, maintained a relatively lower WF with minimal changes over time (Figure 6). At the same time, provinces with higher WF were continuously concentrated in the southwestern and southern regions. By 2020, provinces like Hunan, Jiangxi, Guangdong, and Guangxi ranked high in per capita food consumption WF. In contrast, the western provinces experienced slower growth in WF, such as Qinghai and Xinjiang, causing their national rankings to drop. In the northeastern region, provinces like Heilongjiang saw an increase in the per capita food WF.
Similar to the urban scenario, the northern and southern regions had a higher per capita WF, while the central region had a lower per capita WF. Simultaneously, regions with either a high or low per capita WF both exhibited spatial clustering in their distribution (Wang, 2022). The difference is that in the western regions, such as Tibet and Xinjiang, the per capita food water footprint of urban residents was significantly higher than that of rural residents. The spatial distribution of the per capita food water footprint of rural residents gradually showed a more pronounced difference between the east and west, while the urban areas did not show a significant difference in this aspect.

3.3. Analysis of Key Factors Influencing Urban and Rural Residents’ Food WF

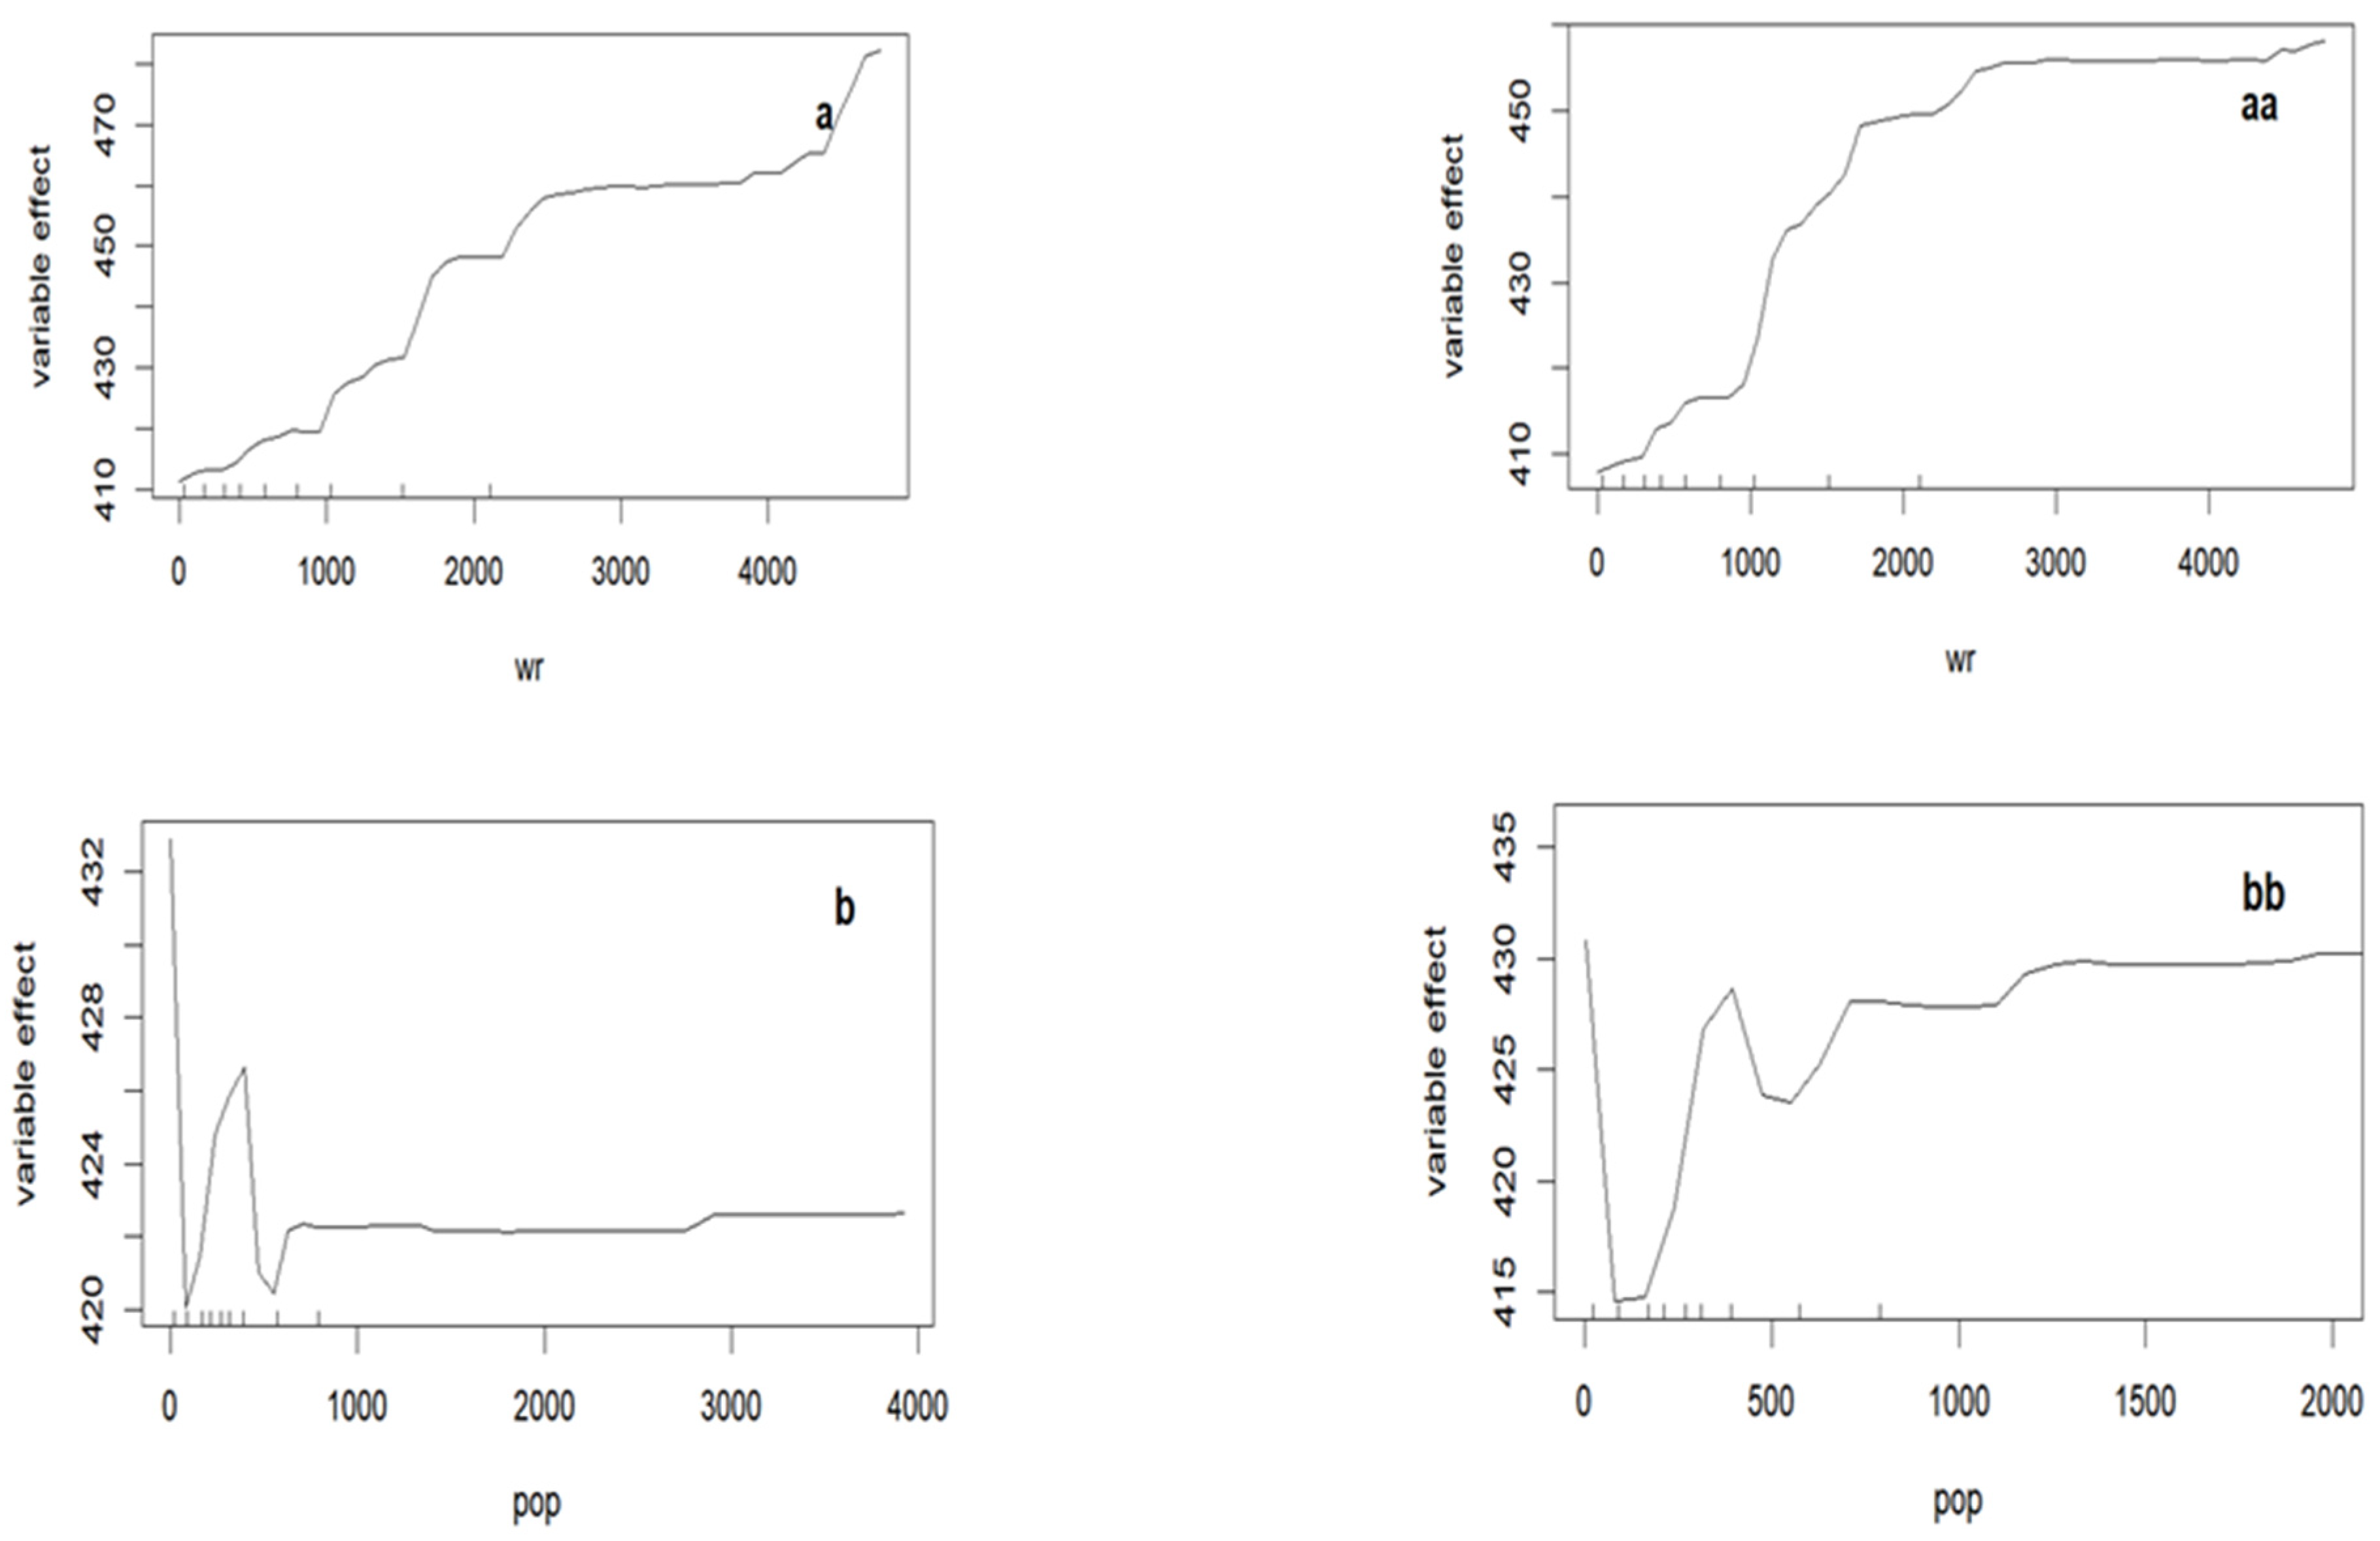
3.3.1. Identification of Key Factors Impacting Urban and Rural Residents’ per Capita Food WF

Based on the random forest model, the feature importance of factors influencing urban and rural residents’ per capita food WF is ranked. Here, IncMSE is used to quantify the average decrease in model accuracy when considering each factor. A higher value of this indicator means greater importance of this variable to the model. For UWF (urban residents’ per capita food WF), the factors with higher importance rankings include total water resources (wr), the proportion of food expenditure in total expenditure (food), per capita gross domestic product (GDP_p), population density (pop), dietary water footprint intensity (intensity), and crop yield per unit area (yield) (Figure 7). For RWF (rural residents’ per capita food WF), the leading factors in importance are population density (pop), total water resources (wr), crop yield per unit area (yield), per capita water resources (wr_p), dietary water footprint intensity (intensity), and urbanization rate (urb) (Figure 7).
Among them, certain common factors impact per capita food WF in rural and urban areas. Population density, total water resources, crop yield per unit area, and water footprint intensity are observed among the top six important factors in both areas. However, there are differences in the influencing factors between urban and rural areas. In urban areas, natural and economic factors play a major role, with the top three factors being total water resources, food expenditure proportion, and per capita GDP. Contrarily, technological, and natural factors play a more important role in the per capita food WF of rural areas. Population density and total water resources rank the highest in this area, with not even a single economic factor ranking among the top six determining factors. Such disparities in influencing factors are likely related to the food consumption pattern. For urban residents, they rely on products from the market. Therefore, their per capita food WF is suggested to be influenced by factors related to the production, processing, and transportation of these commercial food items. In contrast, rural residents have a mix of commercial and self-sufficient consumption. As a result, their per capita food WF is influenced by both natural factors (related to local agricultural practices and environmental conditions) and technological factors (related to farming techniques and technologies).

3.3.2. Analysis of the Key Influencing Factors of per Capita Food WF of Urban and Rural Residents

In this section, a partial dependence plot is constructed to further delve into the relationship between WF and various factors. The plot visualizes the marginal effect of each influencing factor on the model output, to some extent reflecting the correlation between the variable and the target variable.
(1) As total water resources (wr) increase, the per capita food WF of urban and rural areas gradually increases and then stabilizes (Figure 8a,aa). The inflection point appears around 250 billion m3. When total water resources (wr) reach around 440 billion m3, the urban per capita food WF increases. This is because the amount of total water resources (wr) affects the water consumption in the food production and consumption process, thereby influencing the per capita food WF. Residents in water-rich areas tend to consume more food with higher virtual water content, and those in areas with abundant water resources may have a relatively weak awareness of water conservation [22]. When total water resources (wr) reach around 250 billion m3, residents’ food consumption and food structure essentially stabilize, leading the per capita food WF to stabilize as well. The increase in urban residents’ per capita food WF when total water resources (wr) are near 440 billion m3 is due to the fact that among all provinces and municipalities directly under the central government in China, only Tibet has total water resources (wr) around this mark. Urban per capita food consumption in Tibet is significantly higher than in other provinces, mainly due to higher consumption of cereals and meats. In comparison with urban areas, there is no noticeable increase in food consumption trends among rural residents in Tibet.
(2) The impact of population density (pop) on urban per capita food WF shows a trend of decreasing–increasing–decreasing–stabilizing. It stabilizes when the population exceeds 700 people/km2 (Figure 8b). The aggregation effect of the population is beneficial for reducing per capita food WF. However, a continuous increase in population density (pop) may lead to a slight rebound in per capita WF. Population aggregation has a suppressive effect on urban per capita food WF. This is because, as population density (pop) increases, the scale effects of per capita energy consumption and economic development gradually emerge, leading to a decrease in per capita WF [41]. The changes in the rural per capita food water footprint are similar to those in urban areas. The decline is because, in areas with a lower population density (pop), rural residents have a higher demand for food with a greater WF, such as beef and mutton. As population density (pop) grows, residents’ dietary habits start to change. When population density (pop) hits 100 people/km2, the per capita WF begins to rise and then stabilizes once population density (pop) reaches 700 people/km2.
(3) The impact of dietary water footprint intensity (intensity) on urban per capita WF first rises and then gradually stabilizes (Figure 8c). Dietary water footprint intensity (intensity) reflects water use efficiency; thus, the smaller the water footprint intensity, the higher the water use efficiency [24]. As intensity increases, water resource utilization efficiency decreases, leading to a gradual rise in residents’ per capita food WF. The influence of dietary water footprint intensity (intensity) on rural per capita WF mirrors the trends observed in urban areas. (Figure 8c,cc).
(4) The impact of the proportion of food expenditure in total expenditure (food) on UWF goes through a process of slow rise–fall–rise and then gradually stabilizes. It begins to decline when the proportion exceeds 28%, rises after 36%, and gradually stabilizes at 426 m3 after 43% (Figure 8d). This indicates that the initial increase in the proportion of food consumption by urban residents plays a role in promoting the increase in urban per capita WF. However, when the proportion of food consumption by urban residents is in the range of 28–43%, adjustments in the food consumption structure will occur, causing a trough in per capita food WF. The impact of food on rural residents differs from its impact on urban residents. Once the proportion of food consumed by rural residents exceeds 38%, the per capita food WF significantly increases. This driving effect weakens when the proportion reaches 52%. The reason is that as the proportion of food consumption by rural residents increases, the volume of food consumption also increases. Along with changes in consumption structure, such as a decrease in grain consumption and an increase in meat and poultry consumption, the per capita food WF gradually grows. As the consumption volume reaches a saturation point and the consumption pattern becomes stable, this driving effect gradually weakens.
(5) The impact of per capita gross domestic product (GDP_p) on urban per capita food WF first rises and then stabilizes (Figure 8e). When the per capita gross domestic product (GDP_p) of urban residents reaches CNY 60000, the per capita food WF then basically stabilizes at around 460 m3. Per capita gross domestic product (GDP_p) has a positive driving effect on per capita food WF, causing regions with higher per capita food WF to gradually shift to the eastern and southern areas. However, as per capita gross domestic product (GDP_p) increases, residents’ food consumption gradually saturates, and the consumption structure becomes more stable, resulting in little change in per capita food WF. In contrast to its impact on urban areas, the influence of per capita gross domestic product (GDP_p) on rural per capita food WF fluctuates and increases, continuously driving it upward. This indicates that the food consumption of rural residents is still in a process of continuous increase, and the food consumption structure is unstable, so the rural per capita food WF increases with the rise in per capita gross domestic product (GDP_p).
(6) The driving effect of per capita water resources (wr_p) on the UWF ranks eighth in the order of influencing factors, which is lower than its driving effect on the RWF. However, the impact of per capita water resources (wr_p) on both the urban and rural residents’ per capita food WF follows the same trend, showing an initial increase followed by a stabilizing trend, with a turning point at around 10,000 m3. This indicates that an increase in per capita water resources (wr_p) plays a role in driving the increase in per capita food WF. As the residents’ food consumption reaches saturation and the consumption structure remains stable, the driving effect of per capita water resources (wr_p) gradually weakens; hence, the WF trends toward stability. As the primary producers of agricultural products, the amount of per capita water resources (wr_p) has a greater impact on food production and consumption for rural residents.
(7) The impact of crop yield per unit area (yield) on the RWF is greater than its impact on UWF. However, the overall impact trend shows that as crop yield per unit area (yield) increases, WF first increases and then stabilizes. This indicates that the increase in crop yield per unit area (yield) plays a role in driving the increase in per capita food WF. As the primary producers of agricultural products, the level of crop yield per unit area (yield) has a greater impact on the food consumption and income of rural residents, thereby making its driving effect on the per capita food consumption WF of rural residents more evident.
(8) The impact of the urbanization rate (urb) on both the urban and rural per capita food WF is consistent, both showing fluctuating growth followed by a stabilizing trend (Figure 8h,hh). The urbanization rate (urb) represents the migration of the rural population to urban areas and is also an important indicator of regional economic development, coupled with the economic development process [42,43,44]. When the urbanization rate (urb) reaches around 53%, there is a significant increase in the per capita food WF. This suggests that although the urbanization process generates economies of scale by aggregating factors and promotes conditions such as technological advancement to improve water resource utilization efficiency, this effect can be offset or even surpassed by the increase in per capita food consumption and the transformation of consumption structures brought about by the rise in economic levels during urbanization. Therefore, an increase in the urbanization rate (urb) will result in an increase in the per capita food WF.

4. Discussion

4.1. Changes in the per Capita Food WF of Urban and Rural Residents

Food is one of the most basic material resources for human survival. With economic development, the residents’ food consumption and consumption patterns have changed. This change has gradually intensified the strain on water resources through the transmission of WF. The per capita food WF of China’s urban and rural residents has seen a steady rise, notably in meat consumption, while the growth rate of grains and vegetables has been smaller or even shown negative growth. Differences in food consumption and structure between urban and rural residents have led to distinct variations in the per capita food WF [24]. Urban residents’ food WF is generally higher than rural residents, but this gap is gradually narrowing with the improvement in economic development and urbanization rates [21].

4.2. Temporal and Spatial Changes in the per Capita Food WF of Urban and Rural Residents

The per capita food WF of urban residents in various regions showed a fluctuating upward trend during the study years. The residents in the western regions primarily consume beef and mutton, both of which are associated with high water footprints. Influenced by such dietary habits, the per capita food WF in Tibet, Xinjiang, and Qinghai in 2000 was relatively high. With economic development and the change in residents’ dietary consumption concepts, the southeastern and northeastern regions gradually became areas with higher per capita food WFs. The central regions, such as Gansu, Ningxia, Shaanxi, and Shanxi, continuously had a lower national level of per capita food WF during the study years, which is related to the relatively scarce local water resources and lagging economic development.
The per capita food WF of rural residents was similar to that of residents in urban areas, which also showed a fluctuating increase. Regions with a higher per capita food WF mainly concentrated gradually in the southern part of China. Similarly, the central regions had a lower level of per capita food water footprint, which was likely significantly influenced by local resource endowments such as per capita water availability.

4.3. Primary Driving Factors for the per Capita Food WF of Urban and Rural Residents

The top three primary factors driving the per capita food WF of urban residents are total water resources (wr), the proportion of food expenditure in total expenditure (food), and per capita gross domestic product (GDP_p). This result highlights the significant influence of economic factors on the per capita food WF of urban residents, with less influential roles of social and technological factors. The driving role of factors such as the urbanization rate, which some scholars pay more attention to [45], is relatively weak, ranking third from the bottom with a contribution of only 15.38%. Urbanization is more indicative of the population migration from rural to urban areas than reflecting regional economic development. Thus, as an economic indicator, its significance in driving the per capita food consumption WF remains relatively modest. Comparatively, the proportion of food expenditure in total expenditure (food) and per capita gross domestic product (GDP_p) can better represent regional economic development and more intuitively demonstrate their driving effects on the per capita food WF of urban residents.
The top three factors driving the per capita food WF of rural residents are population density (pop), total and per capita water resources (wr), and crop yield per unit area (yield). It is evident that social elements, technological elements, and natural resource endowments play a more significant role in the per capita food WF of rural residents, while the driving role of economic factors is weaker. Farmers’ daily diets come from two sources: self-sufficient and commercial types. Commercial-type food is mostly purchased in local markets, and the type of food consumed remains stable. Therefore, the per capita food WF in rural areas is greatly influenced by local natural factors and technological factors. Similarly, the impact of the urbanization rate on the per capita food WF in rural areas is weak, but it is stronger than its influence on urban areas. At this point, the importance of the urbanization rate ranks sixth, with a contribution effect of 22.22%. This might be due to the increasing urbanization rate and ongoing economic advancements, which alter the residents’ food consumption quantity and structure and consequently raise the per capita food WF.

5. Conclusions

This study calculates the per capita food WF by statistically analyzing the consumption of seven major types of food by urban and rural residents in 31 provinces (and municipalities) of China. This study separately examines the spatiotemporal evolution of the per capita food WF in urban and rural areas and explores the linear and non-linear relationships between various factors and the per capita food WF of urban and rural residents. Several conclusions were drawn separately.
The per capita food consumption of urban and rural residents in China is increasing annually. The gap in food consumption between urban and rural residents is narrowing gradually, and the food consumption structures are becoming more consistent.
From a quantitative perspective, the per capita food WF of Chinese urban and rural residents is showing a year-on-year increasing trend, with the growth rate of the rural residents’ per capita food WF being greater than that of urban residents. In terms of spatial distribution, areas with a higher per capita food WF among urban residents have shifted from the western regions to the southeastern and northeastern regions, while the total per capita food water footprint in the central region is generally lower. The per capita food WF of rural residents exhibits a clear east–west differentiation: the southeastern and northeastern regions have seen a gradual increase in the per capita food WF to a higher national level, while the total per capita water footprint in the central region remains relatively low.
Among the key factors, total water resources (wr) and population density (pop) have a significant driving influence on the overall per capita food water footprint of both urban and rural residents. Economic elements like the proportion of food expenditure in total expenditure (food) and per capita gross domestic product (GDP_p) have a stronger driving impact on the total per capita water footprint of urban residents. In contrast, the increase in the per capita food WF of rural residents relies more heavily on natural resource endowments and technical factors, such as per capita water resources (wr_p) and crop yield per unit area (yield). Factors like the proportion of food expenditure in total expenditure (food), population density (pop), and crop yield per unit area (yield) exhibit a clear non-linear response with the average food WF for both urban and rural populations. The aggregation effect of the population, delayed technical utility, saturation of food consumption, and stability of food consumption structures are crucial reasons for this non-linear relationship.

6. Recommendations

(1) The quantity and structure of residents’ food consumption are closely related to the water footprint of food. Efforts should be made to optimize the dietary structure of urban and rural residents based on ensuring their nutritional needs. It is advisable to appropriately increase the consumption of eggs, dairy products, and vegetables while reducing the intake of meat and poultry. This can balance nutritional intake and reduce the likelihood of diseases caused by unhealthy diets. At the same time, it contributes to the optimization of water resource utilization, leading to a reduction in water consumption to a certain extent. Relevant authorities should actively promote correct nutritional knowledge and health concepts, empowering residents to make informed decisions about food consumption. By encouraging consumers to choose products with a lower water footprint and enhancing the understanding of the preciousness of water resources and the differences in water footprints among various products, a shift toward a consumption pattern with a lower water footprint may be facilitated.
(2) To address the challenges of the water footprint (WF) in urban and rural settings, it is crucial to integrate policies targeting both economic awareness and agricultural efficiency. In urban areas, the focus should be on raising awareness among residents about the economic factors that influence the per capita food WF, encouraging them to make water-efficient dietary choices. Simultaneously, in rural regions, the emphasis should be on enhancing water efficiency in agriculture to reduce the intensity of the dietary WF. This dual approach combines consumer guidance in urban areas with technological and practice improvements in rural agriculture, aligning with sustainable water management and food consumption goals.
(3) Considering the carrying capacity of natural resources, effective water-saving policies should be introduced, and advanced water-saving technologies tailored to local conditions should be developed to reduce the food WF. In summary, efforts should always be made to further improve the water use efficiency in the production chain and encourage water-saving and low-WF lifestyles to achieve sustainable water consumption.

7. Research Contribution, Deficiencies, and Prospects

This article investigates the disparities in the water footprint associated with urban and rural food consumption patterns in China from 2000 to 2020. This research utilized ArcGIS and random forest modeling to elucidate the spatial–temporal evolution of the water footprint and its driving factors. It identifies key factors affecting water resource consumption in urban and rural areas, contributing to the understanding of water resource management amid changing dietary habits. This study is significant for formulating strategies to optimize water resource use efficiency and ensure food security under dynamic environmental and socioeconomic conditions.
While this study made efforts to quantify the water footprint of food and analyze its driving factors, it falls short in researching the relationship between changes in the food water footprint and total water resources, particularly in the context of global warming. Future research should focus on observing and predicting the impact of changes in water consumption for food on total water resources, particularly in the context of evolving global climate change patterns. This refined focus will substantially augment the understanding of the interplay between changing dietary habits and water resources amidst environmental shifts, thereby contributing to a more comprehensive framework for resource management and sustainability.

Author Contributions

Conceptualization, D.S.; data curation, Z.S.; formal analysis, Z.S.; methodology, Z.S.; software, T.Z.; supervision, W.Y. and D.S.; visualization, W.W.; writing—original draft, Z.S.; writing—review and editing, D.S. All authors have read and agreed to the published version of the manuscript.

Funding

This research was supported by the Fundamental Research Funds for the Central Universities and the Research Funds of Renmin University of China (grant number: 22XNH064).

Data Availability Statement

The data presented in this study are available on request from the corresponding author. The data are not publicly available due to future research or publication.

Acknowledgments

We would like to acknowledge all open-source data providers (the providers mentioned appear in this article).

Conflicts of Interest

The authors declare no conflicts of interest.

References

  1. FAO; IFAD; UNICEF; WFP; WHO. The State of Food Security and Nutrition in the World 2018: Building Climate Resilience for Food Security and Nutrition; FAO: Rome, Italy, 2018. [Google Scholar]
  2. United Nations. World Urbanization Prospects: The 2018 Revision; United Nations: New York, NY, USA, 2018. [Google Scholar]
  3. He, K.D.; Duan, C.Q.; Yang, S.M.; Ji, K. Overview of Hydrological and Water Resources Responses to Land Use/Cover Change. J. Water Resour. Res. 2015, 4, 9. [Google Scholar] [CrossRef]
  4. Ministry of Water Resources of the People’s Republic of China. China Water Resources Bulletin; China Water & Power Press: Beijing, China, 2020.
  5. Jiang, W.Q.; Li, X.Y.; Liu, C.J.; Sun, Q. Impact of Changes in Urban and Rural Residents’ Dietary Structure on China’s Water Resources Demand: From the Perspective of Nutrient Balance. Resour. Sci. 2021, 43, 1662–1674. [Google Scholar]
  6. National Bureau of Statistics of China. China Statistical Yearbook; China Statistics Press: Beijing, China, 2021.
  7. Guo, Y.; He, P.; Searchinger, T.D.; Chen, Y.; Springmann, M.; Zhou, M.; Zhang, X.; Zhang, L.; Mauzerall, D.L. Environmental and Human Health Trade-Offs in Potential Chinese Dietary Shifts. One Earth 2022, 5, 268–282. [Google Scholar] [CrossRef]
  8. Liu, X.; Tai, A.P.K.; Chen, Y.; Zhang, L.; Shaddick, G.; Yan, X.; Lam, H.-M. Dietary Shifts Can Reduce Premature Deaths Related to Particulate Matter Pollution in China. Nat. Food 2021, 2, 997–1004. [Google Scholar] [CrossRef] [PubMed]
  9. Shi, C.; Wu, C.; Zhang, J.; Zhang, C.; Xiao, Q. Impact of Urban and Rural Food Consumption on Water Demand in China—From the Perspective of Water Footprint. Sustain. Prod. Consum. 2022, 34, 148–162. [Google Scholar] [CrossRef]
  10. Zhu, Y.; Zhang, Y.; Zhu, X. The Evolution Process, Characteristics and Adjustment of Chinese Dietary Guidelines: A Global Perspective. Resour. Conserv. Recycl. 2023, 193, 106964. [Google Scholar] [CrossRef]
  11. Blas, A.; Garrido, A.; Willaarts, B.A. Food Consumption and Waste in Spanish Households: Water Implications Within and Beyond National Borders. Ecol. Indic. 2018, 89, 290–300. [Google Scholar] [CrossRef]
  12. Wang, L.; Gao, B.; Hu, Y.; Huang, W.; Cui, S. Environmental Effects of Sustainability-Oriented Diet Transition in China. Resour. Conserv. Recycl. 2020, 158, 104802. [Google Scholar] [CrossRef]
  13. Zhang, Y.; Tian, Q.; Hu, H.; Yu, M. Water Footprint of Food Consumption by Chinese Residents. Int. J. Environ. Res. Public Health 2019, 16, 3979. [Google Scholar] [CrossRef]
  14. Long, Y.; Hu, R.; Yin, T.; Wang, P.; Liu, J.; Muhammad, T.; Chen, X.; Li, Y. Spatial-Temporal Footprints Assessment and Driving Mechanism of China Household Diet Based on CHNS. Foods 2021, 10, 1858. [Google Scholar] [CrossRef]
  15. Kim, B.F.; Santo, R.E.; Scatterday, A.P.; Fry, J.P.; Synk, C.M.; Cebron, S.R.; Mekonnen, M.M.; Hoekstra, A.Y.; de Pee, S.; Bloem, M.W. Country-Specific Dietary Shifts to Mitigate Climate and Water Crises. Glob. Environ. Chang. 2020, 62, 101926. [Google Scholar] [CrossRef]
  16. Fan, J.L.; Feng, X.W.; Dong, Y.Y.; Zhang, X. A Global Comparison of Carbon-Water-Food Nexus Based on Dietary Consumption. Glob. Environ. Chang. 2022, 73, 102489. [Google Scholar] [CrossRef]
  17. Marlow, H.J.; Hayes, W.K.; Soret, S.; Carter, R.L.; Schwab, E.R.; Sabate, J. Diet and the Environment: Does What You Eat Matter? Am. J. Clin. Nutr. 2009, 89, 1699–1703. [Google Scholar] [CrossRef]
  18. Su, B.; Zhang, C.; Martens, P.; Cao, X. A Comparative Study on the Dietary Ecological Footprint in Contemporary China. Sci. Total Environ. 2022, 851, 158289. [Google Scholar] [CrossRef] [PubMed]
  19. Li, Z.M. Study on the Development of Food Consumption and Nutrition between Urban and Rural Residents in China. Ph.D. Thesis, Chinese Academy of Agricultural Sciences, Beijing, China, 2007. [Google Scholar]
  20. Liu, M.; Fang, C.; Bai, Y.; Sun, B.; Liao, X.; Liu, Z. Regional Inequality and Urban-Rural Difference of Dietary Water Footprint in China. Resour. Conserv. Recycl. 2023, 199, 107236. [Google Scholar] [CrossRef]
  21. Wang, F. Study on Water Footprint of Food Consumption for Rural Residents in China and Its Influencing Factors. Master’s Thesis, Guizhou University, Guiyang, China, 2022. [Google Scholar]
  22. Zhang, X. Factors Analysis of Water Consumption in China Based on the Random Forest Model—Perspectives of Physical Water, Production Water Footprint, and Consumption Water Footprint. Ph.D. Thesis, Renmin University of China, Beijing, China, 2023. [Google Scholar]
  23. Sun, C.Z.; Liu, S.B. Impacts of driving factors and the regional difference of dietary water footprint in China. Yellow River 2017, 39, 9. [Google Scholar]
  24. Zheng, X.; Sun, S.; Bao, C. Changes in water footprint of food consumption and influencing factors for urban and rural residents in China. J. Arid Land Resour. Environ. 2019, 33, 17–22. [Google Scholar]
  25. Yan, D.; Wu, S.; Tang, Y.; Zhu, J.; Zhou, S.; Xu, Z. Arable land and water footprints for food consumption in China: From the perspective of urban and rural dietary change. Sci. Total Environ. 2022, 838, 155749. [Google Scholar] [CrossRef]
  26. Savelli, E.; Mazzoleni, M.; Di Baldassarre, G.; Cloke, H.; Rusca, M. Urban water crises driven by elites’ unsustainable consumption. Nat. Sustain. 2023, 6, 929–940. [Google Scholar] [CrossRef]
  27. Feng, B.B.; Liu, X.F.; Zhao, Y.G.; Li, K. Study on water footprint of main grain crops production in Shanxi Province. J. Arid Land Resour. Environ. 2018, 32, 135–136. [Google Scholar]
  28. Sun, C.Z.; Liu, S.B. Analysis of regional differences and driving factors of dietary water footprint in China. Yellow River 2017, 39, 39–40. [Google Scholar]
  29. He, G.; Geng, C.; Zhai, J.; Zhao, Y.; Wang, Q.; Jiang, S.; Zhu, Y.; Wang, L. Impact of food consumption patterns change on agricultural water requirements: An urban-rural comparison in China. Agric. Water Manag. 2021, 243, 106504. [Google Scholar] [CrossRef]
  30. Wu, H.; MacDonald, G.K.; Galloway, J.N.; Geng, Y.; Liu, X.; Zhang, L.; Jiang, S. A new dietary guideline balancing sustainability and nutrition for China’s rural and urban residents. iScience 2022, 25, 105048. [Google Scholar] [CrossRef] [PubMed]
  31. Breiman, L. Random forests. Mach. Learn. 2001, 45, 5–32. [Google Scholar] [CrossRef]
  32. Fang, K.; Wu, J.; Zhu, J.; Bang-Changa, S. A review of technologies on random forests. Stat. Inf. Forum 2011, 26, 32–38. [Google Scholar]
  33. Wang, C.; Kan, A.; Zeng, Y.; Li, G.; Wang, M.; Ciren. Spatial distribution pattern and influencing factors of Tibet’s population based on the random forest model. Acta Geogr. Sin. 2019, 74, 664–680. [Google Scholar]
  34. Liu, W.; Tang, Z.; Xia, Y.; Han, M.; Jiang, W. Identification and evolution of key influencing factors of China’s carbon intensity based on machine learning. Acta Geogr. Sin. 2019, 74, 2592–2603. [Google Scholar]
  35. Tyralis, H.; Papacharalampous, G.; Langousis, A. A Brief Review of Random Forests for Water Scientists and Practitioners and Their Recent History in Water Resources. Water 2019, 11, 910. [Google Scholar] [CrossRef]
  36. Hoekstra, M.A.Y. A global assessment of the water footprint of farm animal products. Ecosystems 2012, 15, 401–415. [Google Scholar]
  37. Hoekstra, A.Y. Virtual Water Trade: Proceedings of the International Expert Meeting on Virtual Water Trade. 2003. Available online: https://ihedelftrepository.contentdm.oclc.org/digital/collection/p21063coll3/id/10351/ (accessed on 18 May 2022).
  38. Aryal, A.; Aryal, B. Income Distribution and Its Effect on Food Expenditure, Non-Food Expenses and Savings in Households of a Developing Economy. J. Econ. Financ. Account. Stud. 2023, 5, 1–15. [Google Scholar] [CrossRef]
  39. Verba, D.; Kudinova, A.; Tkachenko, O.; Samiilenko, A. Plotting Engel curves for commodities “food” and “education” in the context of Ukrainian households’ well-being evaluation. Financ. Credit Act. Probl. Theory Pract. 2023, 2, 3974. [Google Scholar]
  40. Xie, Q.; Yi, F.; Tian, X. Disparate changes of living standard in China: Perspective from Engel’s coefficient. China Agric. Econ. Rev. 2022, 15, 481–505. [Google Scholar] [CrossRef]
  41. Tiffen, M. Population density, economic growth and societies in transition: Boserup reconsidered in a Kenyan case-study. Dev. Chang. 2010, 26, 31–66. [Google Scholar] [CrossRef]
  42. Yao, S.M.; Zhang, P.Y.; Yu, C.; Li, G.Y.; Wang, C.X. Theoretical and practical issues of China’s new urbanization. Scientia Geogr. Sin. 2014, 34, 641–647. [Google Scholar]
  43. Liu, Y.B.; Li, R.D.; Song, X.F. Correlation analysis of regional urbanization and ecological environment coupling in China. Acta Geogr. Sin. 2005, 237–247. [Google Scholar] [CrossRef]
  44. Liu, Y.B.; Li, R.D.; Song, X.F. Analysis of coupling degree between urbanization and ecological environment in China. J. Nat. Resour. 2005, 105–112. [Google Scholar] [CrossRef]
  45. Sun, S. Water footprints in Beijing, Tianjin and Hebei: A perspective from comparisons between urban and rural consumptions in different regions. Sci. Total Environ. 2019, 647, 507–515. [Google Scholar] [CrossRef]
Figure 1. Analysis framework of the spatial pattern and influencing factors of the per capita food water footprint for urban and rural residents in China.
Water 16 00247 g001
Figure 2. Per capita consumption of various types of food among urban and rural residents from 2000 to 2020.
Water 16 00247 g002
Figure 3. Per capita food water footprint for urban residents from 2000 to 2020.
Water 16 00247 g003
Figure 4. Per capita food water footprint for rural residents from 2000 to 2020.
Water 16 00247 g004
Figure 5. Spatial–temporal evolution of per capita food water footprint for urban residents from 2000 to 2020 (Base map approval number GS (2019) 1822).
Water 16 00247 g005
Figure 6. The spatiotemporal evolution of per capita food water footprint for rural residents from 2000 to 2020 (Base map approval number GS (2019) 1822).
Water 16 00247 g006
Figure 7. Key factor rankings for per capita food water footprint of urban–rural residents from 2000 to 2020.
Water 16 00247 g007
Figure 8. Impact intensity of various factors on the per capita food WF of urban and rural residents from 2000 to 2020. Note: (ah) represents the impact intensity of various factors on the per capita water footprint of urban residents, while (aahh) represents the impact intensity of various factors on the per capita water footprint of rural residents.
Water 16 00247 g008aWater 16 00247 g008bWater 16 00247 g008c
Table 1. Explanation of the Driving Factors for Per Capita Food WF of Urban and Rural Residents.
Variable TypeVariable NameSymbolUnit
natural factorstotal water resourceswr100 million cubic meters
per capita water resourceswr_pcubic meters
economic factorsgross domestic product (GDP)GDPtrillion
per capita gross domestic productGDP_pCNY ten thousand
the proportion of food expenditure in total expenditurefoodpercentage
the proportion of output value of the primary industry in total output valueagripercentage
social factorspopulation densitypoppersons per square kilometer
urbanization rateurbpercentage
average years of education per capitaeduyear
technological factorscrop yield per unit areayieldkilograms per hectare
total agricultural machinery powerpowerten thousand kilowatts
dietary water footprint intensityintensitypercentage
Disclaimer/Publisher’s Note: The statements, opinions and data contained in all publications are solely those of the individual author(s) and contributor(s) and not of MDPI and/or the editor(s). MDPI and/or the editor(s) disclaim responsibility for any injury to people or property resulting from any ideas, methods, instructions or products referred to in the content.

