Article

Assessing the Benthic Ecological Quality in the Intertidal Zone of Cheonsu Bay, Korea, Using Multiple Biotic Indices

1
Department of Life Science and Biotechnology, Soonchunhyang University, Asan 31538, Republic of Korea
2
Marine Co., Ltd., Anyang 14059, Republic of Korea
*
Author to whom correspondence should be addressed.
Water 2024, 16(2), 272; https://doi.org/10.3390/w16020272
Submission received: 20 November 2023 / Revised: 9 January 2024 / Accepted: 10 January 2024 / Published: 12 January 2024

Abstract

:
With the growing global focus on marine environmental conservation and management, it is imperative to evaluate the ecological quality of marine ecosystems accurately. In this study, we employed seven biotic indices, namely the AZTI marine biotic index (AMBI), BENTIX, benthic opportunistic polychaetes amphipods index (BOPA), benthic pollution index (BPI), multivariate AZTI marine biotic index (M-AMBI), abundance biomass comparison (W-value), and Shannon diversity index (H’), to assess the benthic ecological quality in the intertidal zone of Cheonsu Bay, South Korea. Except for the H’ and W-value, the indices (AMBI, BENTIX, BOPA, BPI, and M-AMBI) suggest that the ecological quality at most stations in the intertidal zone of Cheonsu Bay was acceptable. Furthermore, the influx of a large amount of eutrophic freshwater has impacted the intertidal zone of Cheonsu Bay, but the applicability of the seven biotic indices requires further investigation.

1. Introduction

The intertidal zone, the interface between terrestrial and marine environments, represents one of the most dynamic and ecologically multifaceted ecosystems globally. However, escalating human activities have led to increasing utilisation and development of coastal resources, consequently contributing to the degradation of this fragile ecosystem. Such degradation is manifested in the rapid loss of biodiversity, which poses a significant threat to the ecosystem’s products and services [1,2]. In South Korea, economic growth and prosperity have increased its coastal development and activity, resulting in extensive environmental damage and ecosystem degradation during the past half-century [3]. Hence, it is urgent to accurately evaluate the ecological quality of coastal ecosystems in South Korea.
Macrobenthos stands out among the myriad organisms in marine ecosystems as one of the most sensitive groups. Its presence and activities play a crucial role in shaping and maintaining the structure and functioning of the intertidal zone [4]. Macrobenthos have weak mobility and as abiotic conditions change, or humans intervene, macrobenthic communities tend to shift in terms of species composition [5]. Consequently, macrobenthos are widely used to assess the ecological quality of marine ecosystems [6,7].
Numerous indices based on macrobenthos have been created and used to evaluate the ecological quality status of bays, estuaries, and coastal areas. Examples include the AZTI marine biotic index (AMBI) [8], BENTIX [9], benthic opportunistic polychaetes amphipods index (BOPA) [10], benthic pollution index (BPI) [11], multivariate AZTI marine biotic index (M-AMBI) [12], and abundance biomass comparison (W-value) [13]. Traditionally, the Shannon diversity index (H’) has been employed as a gauge for species diversity within ecological systems [14]; however, recent studies have expanded its application to assess ecological quality status as well [15,16,17]. Collectively, these indices serve as vital tools for monitoring and evaluating marine ecosystem quality.
Although there are numerous biotic indices for assessing marine ecological environments, each has unique development and characteristics. For example, AMBI and M-AMBI apply to eutrophic estuaries, whereas BOPA is unsuitable [18]. Compared to AMBI, BOPA, and W-value, the H’ and M-AMBI indices are ideal for assessing the ecological quality of intertidal zones [19]. AMBI, M-AMBI, and BENTIX do not apply to semi-enclosed marine environments [20]. AMBI, M-AMBI, and BOPA are all unable to respond to high-intensity anthropogenic pressures [21]. BPI appears to be the most tolerant index compared to H′, AMBI, and M-AMBI [22]. In sum, due to the complexity of marine ecosystems, the applicability of different indices may vary within the same region [23]. Therefore, employing multiple indices can provide a more accurate assessment of marine ecological quality than relying on a single index [22,24].
Cheonsu Bay is a semi-closed bay in the middle of the Yellow Sea. It measures 35 km long from north to south and 10 km wide from east to west, with an average water depth of 10 m. This bay is an important aquaculture area and migratory bird habitat in South Korea. However, from 1985 to 2000, four seawalls were built in its north and west to expand its agricultural land, which reduced its area from 380 km2 to 180 km2 [25]. Since the seawalls were constructed, its marine environment has been disturbed, which includes a decrease in phytoplankton, demersal fish species replacing its pelagic fish species, and benthic opportunistic species becoming dominant [26]. We understand that the research of the intertidal zone in Cheonsu Bay is insufficient, especially concerning using the biotic indices to assess the ecological quality of the intertidal zone in Cheonsu Bay.
This study used seven biotic indices (AMBI, M-AMBI, BENTIX, BOPA, BPI, H’, and W-value) to assess the benthic ecological quality status of the intertidal zone in Cheonsu Bay, South Korea. This study aims to (1) evaluate the benthic ecological quality of the intertidal zone in Cheonsu Bay and compare its applicability to the seven biotic indices and (2) provide references for the environmental conservation and management of the intertidal zone in Cheonsu Bay.

2. Materials and Methods
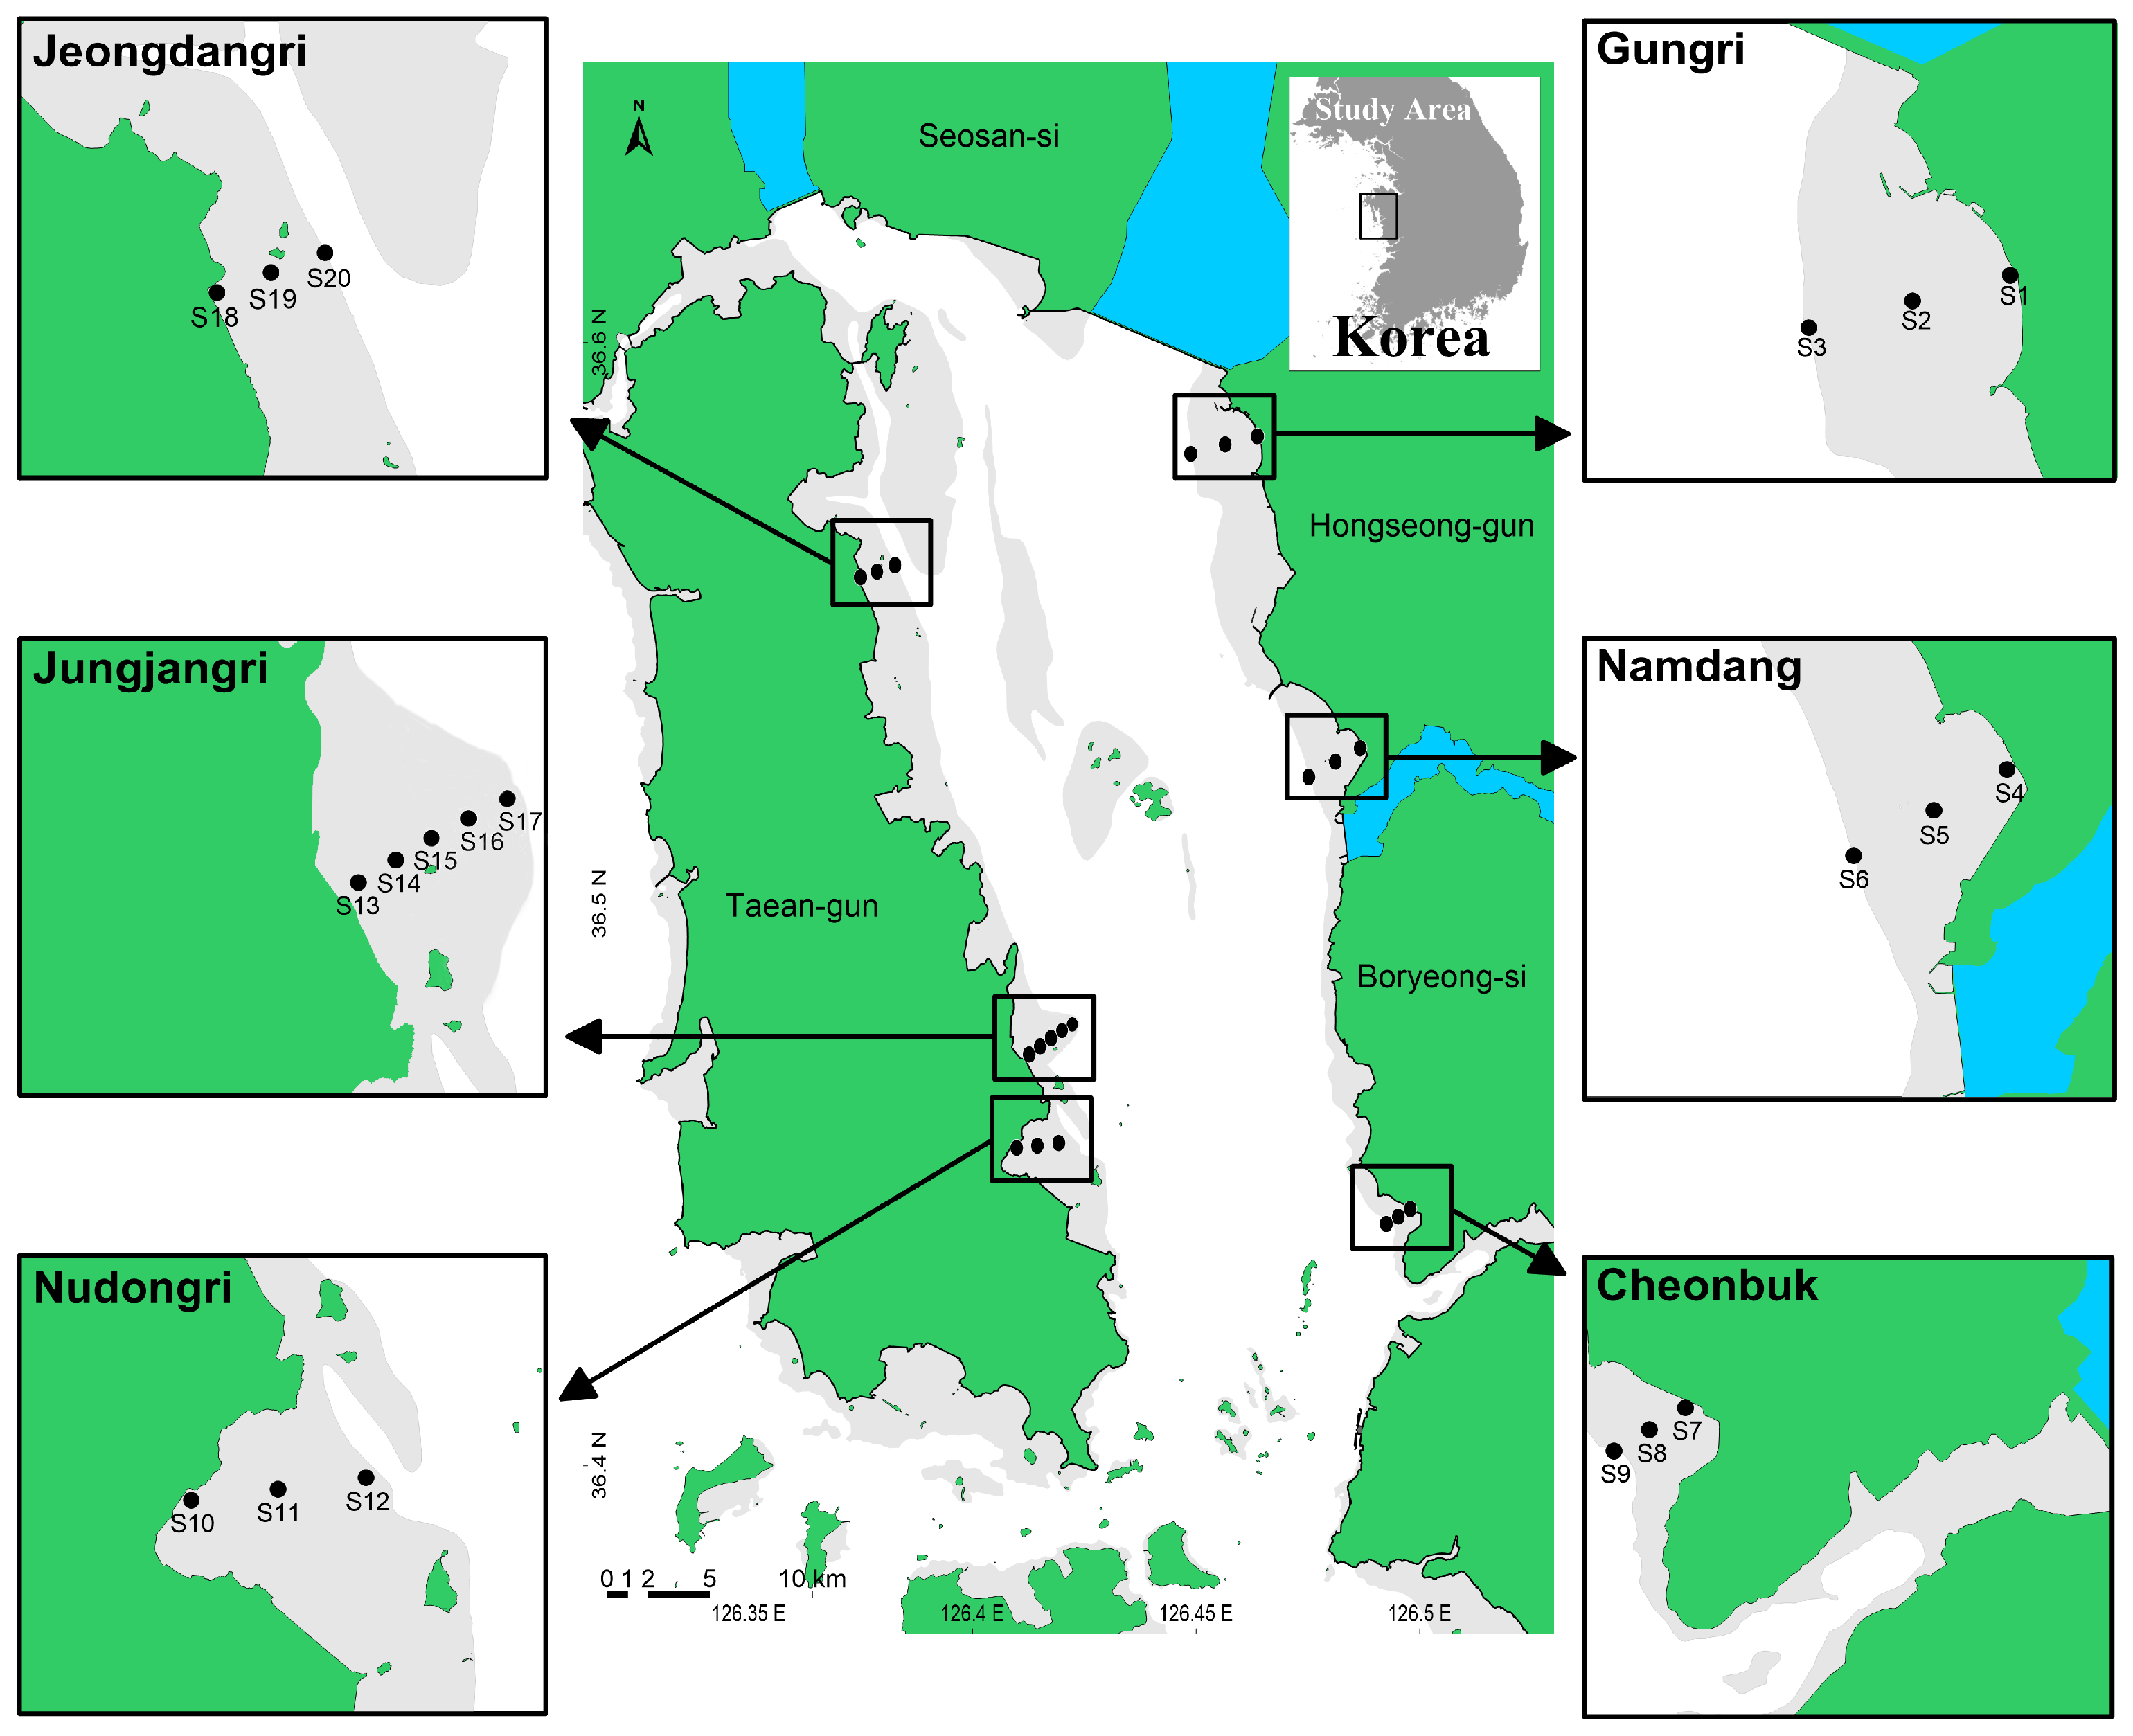
2.1. Study Area

Cheonsu Bay, situated along the western coast of South Korea, spans from latitude 36°23′ to 36°37′N and longitude 126°20′ to 126°30′E. The mean depth is 10 m in the bay. In the southern region of the bay, tidal current velocities range between 2 and 4 m/s. Conversely, tidal current velocities markedly decrease in the northern part, registering at approximately 0.5 m/s [27]. Furthermore, the influx of a substantial amount of eutrophic freshwater from artificial lakes in the north part of the bay has further led to the accumulation of organic matter in the bay [28].

2.2. Sample Collection and Analysis

Survey stations were situated within the eastern and western intertidal zones of Cheonsu Bay, as delineated in Figure 1. Field surveys were executed on a temporal scale from 2017 to 2019. Specifically, the eastern zone was surveyed in 2017 at locations Gungri (S1–S3), Namdang (S4–S6), and Cheobuk (S7–S9), while the western zone was assessed in 2018 at Jeongdangri (S18–S20) and Nudongri (S10–S12), followed by a survey in 2019 at Jungjangri (S13–S17). Sampling endeavours were concentrated during the summer and autumn (August and October).
Macrobenthos were sampled using a 1 mm mesh size sieve with a sample frame of 0.5 m × 0.5 m to a depth of 0.3 m two times (0.5 m2). Macrobenthos were fixed in 4% formalin and then preserved in 70% ethanol. In the lab, every macrobenthos was enumerated and identified to the most specific taxonomic level achievable using a stereomicroscope (Olympus SZX-10, Olympus Co., Ltd., Tokyo, Japan). All macrobenthos were enumerated and weighed (wet weight) on a 0.1 mg analytical balance (Sartorius CP-64, Sartorius AG., Göttingen, Germany).
Additionally, during each sampling event, approximately 300 g of surface sediment samples was collected using a plastic spoon and subsequently stored at −20 °C for analysis of grain size, ignition loss (IL), chemical oxygen demand (COD), and acid volatile sulphide (AVS). In grain size analysis, we initially analysed the particle size distribution of the samples using wet sieving analysis. For particles with a size greater than 4∅, we employed the X-Ray Particle Size Analyzer (SediGraph 5100, Micromeritics Instrument Co., Ltd., Norcross, GA, USA) for further analysis. To determine the organic matter content in the sediment, we heated 10 g of dried sediment samples at 550 °C for 2 h and measured the weight loss. Acid volatile sulphide (AVS) and chemical oxygen demand (COD) were evaluated according to the Marine Environmental Process Test Method [29].

2.3. Biotic Data Analysis

2.3.1. Dominance Index

A dominance index (Y) was used to determine the dominant species in the sampling area. When the value is greater than or equal to 0.02, the species is regarded as the dominant species. This index is calculated as follows:
Y = n i / N × f i
where N is the number of individuals of all species, n i is the number of individuals of the ith species, and f i is the frequency of the ith species [30].

2.3.2. Biotic Indices

We used seven biotic indices to accurately evaluate the benthic ecological quality of the intertidal zone in Cheonsu Bay. We selected three indices based on the relative susceptibility of macrobenthos assemblages to organic matter enrichment, one that considers type of feeding and life history, one index based on the relative abundance of amphipods and opportunistic polychaetes, one index based on the relative abundance of species, and one index based on the species abundances and biomass (Table 1). At each station, ecological quality was assessed and classified using indices.
For the AMBI and BENTIX indices, macrobenthos are divided into different ecological groups based on tolerance to organic matter. However, AMBI has five ecological groups, and BENTIX has only three ecological groups (Table 1). The classification of ecological communities was based on the reference provided by the AMBI software (version 6.0) (https://ambi.azti.es) accessed on 1 May 2023; most of the species collected were assigned to ecological groups, and species not recorded in the AMBI software (version 6.0) database were referred to ecological groups of species of the same genus or expert opinions were consulted [31].
The M-AMBI is an extension of the AMBI, which incorporates additional species richness and Shannon diversity values [12]. It was impossible to use the Shannon–Wiener diversity and richness of all sampling stations as a point of reference since they may be disturbed or polluted. To calculate M-AMBI, Borja et al. (2011) established the following condition: Increase the diversity and richness of the highest species by 15 per cent [32].
KORDI (1995) developed the BPI by modifying the Infaunal Trophic Index (ITI). This divides macrobenthos into four ecological groups that add opportunity species or pollution indicators (N4) compared to the Infaunal Trophic Index (ITI). The other three ecological groups were filter feeders and carnivores (N1), surface deposit feeders (N2), and subterranean deposit feeders (N3) [33] (Table 1).
For the BOPA index, we used the abundance of species of amphipods and species of opportunistic polychaetes [10]; we used relative abundances of species to calculate the Shannon–Wiener diversity (H’). Finally, we calculated the ABC (Abundance\Biomass) comparison curve based on the abundances of species and biomass of species (Table 1).
Seven biotic indices can be categorised into five ecological quality states based on their values (Table 1). In addition, to intuitively evaluate ecological quality, we divided the seven indices (AMBI, BENTIX, BOPA, BPI, M-AMBI, W-value, and H’) into acceptable and unacceptable levels based on their values [34] (Table 1).
Table 1. Summary of assessed benthic indices, including applied methodology, calculation formula, ecological quality status classification thresholds, and acceptable or unacceptable for evaluating ecological quality.
IndicesAlgorithmMethodIndex ValuesEcoQsAcceptable or UnacceptableReferenceNote
AMBI = [ ( 0 × % E G I ) + ( 1.5 × %   E G I I ) + ( 3 × % E G I I I ) + ( 4.5 × %   E G I V ) ( 6 × %   E G V ) ] / 100 Relative susceptibility of macrobenthic assemblages to pollution0.0–1.2
1.2–3.3
3.3–5.0
5.0–6.0
>6.0
High
Good
Moderate
Poor
Bad
Acceptable
Acceptable
Unacceptable
Unacceptable
Unacceptable
[8]EGI: disturbance-sensitive species; EGII: disturbance-indifferent species; EGIII: disturbance-tolerant species; EGIV: second-order opportunistic species; EGV: first-order opportunistic species.
BENTIX = [ 6 × %   GI   + 2 ( %   G I I + %   GIII ) ] / 100 Relative susceptibility of macrobenthic assemblages to pollution6–4.5
4.5–3.5
3.5–2.5
2.5–2.0
0.0
High
Good
Moderate
Poor
Bad
Acceptable
Acceptable
Unacceptable
Unacceptable
Unacceptable
[9]GI = EGI + EGII; GII = EGIII + EGIV; GIII = EGV.
BOPA = l o g [ ( f P ) / ( f A + 1 ) + 1 ) ] Relative abundance of amphipods and opportunistic polychaetes0–0.045
0.045–0.139
0.139–0.193
0.193–0.267
0.267–0.301
High
Good
Moderate
Poor
Bad
Acceptable
Acceptable
Unacceptable
Unacceptable
Unacceptable
[10]fp: opportunistic polychaetes frequency; fa: amphipods frequency
BPI = [ 1 ( a × N 1 + b × N 2 + c × N 3 + d × N 4 ) / ( N 1 + N 2 + N 3 + N 4 ) / d ] × 100 Consider type of feeding and life history60–100
40–60
30–40
20–30
0–20
High
Good
Moderate
Poor
Bad
Acceptable
Acceptable
Unacceptable
Unacceptable
Unacceptable
[33]N1: filter feeders or large carnivores; N2: surface deposit feeders or small carnivores; N3: subterranean deposit feeders; N4: opportunistic species
M-AMBI = K + ( a × A M B I ) + b × H + ( c × S ) Relative susceptibility of macrobenthic assemblages to pollution; richness and diversity(H’)>0.77
0.53–0.77
0.38–0.53
0.20–0.38
≤0.2
High
Good
Moderate
Poor
Bad
Acceptable
Acceptable
Unacceptable
Unacceptable
Unacceptable
[12]H’: Shannon diversity index; S: number of species
W-values = i = 1 S B i A i / [ 50 ( S 1 ) ] Abundances of species and biomass of species>0.50
0.15–0.49
−0.14–0.14
−0.49–−0.15
−1–−0.5
High
Good
Moderate
Poor
Bad
Acceptable
Acceptable
Unacceptable
Unacceptable
Unacceptable
[35]S: The number of species; Bi: the biomass of the species i; Ai: the abundance of the species i
H’(log2) = n i N l o g 2 n i N Relative abundances of species>4
4–3
3–2
2–1
<1
High
Good
Moderate
Poor
Bad
Acceptable
Acceptable
Unacceptable
Unacceptable
Unacceptable
[15]Ni: Number of individuals belonging to the ith species; N: Total number of individuals.

2.4. Statistical Analysis

We aim to explore the interrelationships among the selected biotic indices and their correlations with environmental variables. Spearman’s rank correlation coefficient analysis analysed the biotic indices values and environment factors values. Additionally, a Kappa analysis was conducted to evaluate the level of agreement among the indices, with reference levels of agreement based on previous studies [36]. All statistical analyses were performed using SPSS software, Version 29.0 (SPSS Inc., Chicago, IL, USA).

3. Results

3.1. Environment Factors

The environmental factors in the intertidal zone of Cheonsu Bay are shown in Table 2. Generally, some environmental factors showed considerable fluctuations. The sand values ranged from 0 to 77.4%, averaging 31.88 ± 26.22. The silt values ranged from 14.5 to 88.93%, averaging 49.47 ± 27.35.

3.2. Macrobenthic Structure Characteristics and Dominant Species

A total of 130 species of macrobenthos belonging to 6 phyla were identified (Figure 2). The mean macrobenthos abundance and biomass values were 196.55 ± 270.69 ind./m2 and 50.5 ± 71.88 g./m2, respectively. There were 54 species (41.54%) of Polychaeta, which was the most abundant taxon, followed by Arthropoda with 39 species (30%), Mollusca with 34 species (26.15%), Echinodermata with 1 species (0.77%), Brachiopoda with 1 species (0.77%), and Nemertea with 1 species (0.77%). In summer season, there were three dominant species with a dominant index greater than 0.02. In the autumn season, there were four dominant species with a dominant index greater than 0.02. Table 3 refers to the dominant species and dominant values.

3.3. Biotic Indices Values and Ecological Quality

The AMBI values ranged from 0.068 to 4.015. The maximum value was found at S7 in the summer, and the minimum was at S4 in the summer. The mean AMBI value was 1.62. In summer, the ecological quality was high for eight stations (40%), good for ten stations (50%), and moderate for two stations (10%), and in autumn, the ecological quality was high for six stations (30%) and good for fourteen stations (70%). The ecological quality was recorded as acceptable at 18 stations (90%) in summer and 20 stations (100%) in autumn. The ecological quality was recorded as unacceptable at two stations (10%) in summer.
The BENTIX values ranged from 2.45 to 5.96. The maximum value was found at S4 in the summer, and the minimum was at S7 in the summer. The mean of the BENTIX value was 4.67. In summer, the ecological quality was high for fourteen stations (70%), good for two stations (10%), moderate for three stations (15%), and poor for one station (5%), and in autumn, the ecological quality was high for eleven stations (55%), good for eight stations (40%), and moderate for one station (5%). The ecological quality was recorded as acceptable at 16 stations (80%) in summer and 19 stations (95%) in autumn. The ecological quality was recorded as unacceptable at two stations (10%) in summer and one station (5%) in autumn.
The BOPA values ranged from 0 to 0.266. The maximum value was found at S7 in summer. The mean of the BOPA value was 0.051. In summer, the ecological quality was high for twelve stations (60%), good for five stations (25%), moderate for one station (5%), and poor for two stations (10%), and in autumn, the ecological quality was high for twelves stations (60%) and good for eight stations (40%). The ecological quality was recorded as acceptable at 17 stations (85%) in summer and 20 stations (100%) in autumn. The ecological quality was recorded as unacceptable at three stations (15%) in summer.
The BPI values ranged from 38.4 to 91. The maximum value was found at S18 in autumn, and the minimum was at S7 in summer. The mean of the BENTIX value was 67.3. In summer, the ecological quality was high for sixteen stations (80%), good for three stations (15%), and moderate for one station (5%), and in autumn, the ecological quality was high for sixteen stations (80%) and good for four stations (20%). The ecological quality was recorded as acceptable at 19 stations (95%) in summer and 20 stations (100%) in autumn. The ecological quality was recorded as unacceptable at one station (5%) in summer.
The M-AMBI values ranged from 0.279 to 0.796. The maximum value was found at S9 in the summer, and the minimum was at S8 in the summer. The mean of the M-AMBI value was 0.598. In summer, the ecological quality was high for one station (5%), good for fifteen stations (75%), moderate for one station (5%), and poor for three stations (15%), and in autumn, the ecological quality was high for one station (5%), good for sixteen stations (80%), and moderate for three stations (15%). The ecological quality was recorded as acceptable at 14 stations (70%) in summer and 17 stations (85%) in autumn. The ecological quality was recorded as unacceptable at six stations (30%) in summer and three stations (15%) in autumn.
The W-values ranged from −0.185 to 0.656. The maximum value was found at S15 in autumn, and the minimum was at S15 in summer. The mean W value was 0.218. In summer, the ecological quality was high for one station (5%), good for eleven stations (55%), moderate for seven stations (35%), and poor for one station (5%), and in autumn, the ecological quality was high for two stations (10%), good for twelves stations (60%), and moderate for six stations (30%). The ecological quality was recorded as acceptable at 11 stations (55%) in summer and 14 stations (70%) in autumn. The ecological quality was recorded as unacceptable at nine stations (45%) in summer and six stations (30%) in autumn.
The H’(Log2) values ranged from 0.53 to 3.97. The maximum value was found at S11 in the summer, and the minimum was found at S8 in the summer. The mean of H’(Log2) value was 2.64. In summer, the ecological quality was good for six stations (30%), moderate for seven stations (35%), poor for five stations (25%), and bad for two stations (10%), and in autumn, the ecological quality was good for nine stations (45%), moderate for ten stations (50%), and poor for one station (5%). The ecological quality was recorded as acceptable at six stations (30%) in summer and nine stations (45%) in autumn. The ecological quality was recorded as unacceptable at 14 stations (70%) in summer and 11 stations (55%) in autumn.
For the values of all indices, the status of ecological quality, the percentage of ecological quality status, and the ecological quality for acceptable and unacceptable, refer to Figure 3a,b and Figure 4.

3.4. Correlation Analysis

The correlation analysis results of all biotic index and environmental factors showed that BOPA had a significant positive correlation with clay. BENTIX had a significant negative correlation with COD, and BPI had a highly significant negative correlation with AVS and clay. In this study, the other biotic indices did not have any significance with the environmental factors (Figure 5).
The correlation analysis results between the seven indices showed that AMBI and H’, M-AMBI and W-value had a significant positive correlation; AMBI and BOPA, M-AMBI and H’, and W-value and H’ had a highly significant positive correlation. AMBI had a highly negative correlation with BENTIX and BPI. BOPA had a highly negative correlation with BENTIX and BPI (Figure 5). Overall, AMBI had the highest correlation with the other indices.

3.5. Kappa Analysis

The results of the weighted kappa analysis of the seven indices are shown in Table 4. BOPA had the worst level of agreement with the W-value, and the level of agreement was null (60% matched); AMBI and BOPA had the highest level of agreement, which was very good (97.5% matched). BOPA and BPI had the higher match (95% matched) but not the higher level of agreement, indicating that high matches do not necessarily have a high level of agreement.

4. Discussion

In this study, we used seven biotic indices (AMBI, M-AMBI, BENTIX, BOPA, BPI, H’, and W-value) to assess the benthic ecological quality status of the intertidal zone in Cheonsu Bay, South Korea. Except for AMBI, BPI, and W-value, the other indices were first applied for the intertidal zone of Cheonsu Bay. Despite variations observed among the indices in the evaluation results, the ecological quality status of Cheonsu Bay was predominantly assessed as “high” or “good”. However, a small fraction of the ecological quality status was assessed as “moderate”, “poor”, or “bad”. Apart from the H’ and W-value indices, the other indices (AMBI, BENTIX, BOPA, BPI, and M-AMBI) suggest that the ecological quality at most stations in the intertidal zone of Cheonsu Bay was acceptable.
Owing to the inherent complexity of marine ecosystems and the variability in reference benchmarks across diverse evaluation indices, it is common for different indices to produce inconsistent results within identical geographic regions [37]. As a result, the objectivity of assessments concerning marine ecological quality is heavily influenced by the choice of benthic indices deployed [38]. Therefore, when undertaking an environmental appraisal of a specific locale, it is imperative to evaluate and calibrate the suitability of the selected indices. The aim of such calibration extends beyond merely identifying the most appropriate index; it also enhances the comparability of assessments conducted via disparate indices and bolsters the reliability of the generated findings [39].
At stations S9 and S15 during the summer, the seven evaluated benthic indices yielded disparate classifications of ecological quality status. Specifically, AMBI, M-AMBI, BENTIX, BOPA, and BPI classified the ecological quality of S9 as “high”. In contrast, the W-value indicated it as “moderate”, and the H’ index rated it as “poor”. For station S15, AMBI, BOPA, and BPI designated the ecological quality as “good”, BENTIX classified it as “moderate”, while M-AMBI, W-value, and H’ rated it as “poor”. It should be noted that the number of individuals of Upogebia major at station S9 exceeded 80%, and the count of Sternaspis scutata at station S15 surpassed 60% during the summer. The calculation methodologies for H’ and W-value, which incorporate species abundance and, in the latter case, biomass, were impacted by the disproportionate presence of these specific species, resulting in an underestimation of ecological quality at both stations. The BENTIX index, which utilises three ecological groups for its calculation, is less reliable when few species manifest in high densities [40]. M-AMBI, derived from AMBI, species richness, and Shannon–Wiener diversity, is similarly affected by a low H’ value, leading to its underestimation of ecological quality at station S15.
The results from the seven biotic indices (AMBI, BENTIX, BOPA, BPI, M-AMBI, H’, and W-value) showed that acceptable ecological quality was 30–90% in summer and 45–100% in autumn. The acceptable ecological quality in autumn is higher than in summer. In summer, a substantial amount of eutrophic freshwater flows into Cheonsu Bay from artificial lakes in the north [41]. The influx of a large amount of eutrophic freshwater leads to the enrichment of organic matter. This directly impacts the ecological quality of the intertidal zone in Cheonsu Bay. Compared to other biotic indices, the H’ and W-value demonstrate a lower acceptance of ecological quality, and the H’ and W-value showed lower kappa values in kappa analysis. We believe that the H’ and W-value underestimated the ecological quality status of the intertidal zone in Cheonsu Bay. In addition, when using the W-value and H’ indices in the intertidal zone, it becomes necessary to recalibrate their ecological quality status classification thresholds if the abundance of a single species is excessively high.
The AMBI exhibited significant correlations with BENTIX, BOPA, BPI, and H’ in the correlation analysis. In the kappa analysis, AMBI showed a very good and good level of agreement with BOPA and BPI. This suggests that AMBI may produce results with relatively high consistency with BOPA and BPI. However, it is perplexing that AMBI and M-AMBI showed no correlation and a low kappa value, which may be attributed to the inappropriate setting of reference values in M-AMBI.
In this study, the calculation of BENTIX, BOPA, and M-AMBI references the ecological groups of AMBI. However, the AMBI software (version 6.0)was originally designed for EU coastal waters, but the ecological group classification of the same species may vary in different geographical regions [42]. For example, the ecological group of the dominant species, Heteromastus filiformis, was divided into second-order opportunistic species (EGIV) in AMBI. However, BPI divided this species into subterranean deposit feeders (N3). This seems to have led to a poor correlation between AMBI, BENTIX, BOPA, and M-AMBI and environmental factors. In addition, semi-enclosed ecosystems with excess organic matter and silted sediment, such as Cheonsu Bay, AMBI, BENTIX, and M-AMBI, are not optimal tools for ecological quality assessment [20]. BOPA values are calculated based on the relative abundance of opportunistic polychaetes and amphipods, which makes the interpretation problematic in their absence [18,43]. Before utilising the AMBI, we believe adjusting certain macrobenthic ecological groups according to the local ecological environment is necessary. This adjustment can enhance the accuracy of the assessment results and improve the response to environmental factors.
In Korean coastal waters, AMBI and BPI are the predominant indices for assessing ecological quality status, as evidenced by multiple studies [44,45,46,47]. However, most of these investigations have not rigorously evaluated the applicability of AMBI and BPI for such assessments. In contrast, using BENTIX, BOPA, W-value, and H’ indices remains limited, particularly when compared to AMBI and BPI. Notably, BPI has seen extensive application in evaluating the ecological status of the intertidal zones in Cheonsu Bay [48,49]. Nonetheless, BPI is not without its shortcomings. Specifically, the index faces challenges in identifying the feeding types and life histories of benthic organisms. Additionally, when only a few species exist and belong to either NI or NII categories, this can artificially inflate the BPI value. Finally, the ecological interpretation of BPI values remains problematic [50]. The survival strategies of benthic organisms can differ substantially across ecosystems, which introduces uncertainty when employing various biotic indices for environmental assessment. Accordingly, a comprehensive understanding of the local ecosystem and the attributes of indigenous species is imperative for accurate evaluations of ecological quality.
In the past four decades, constructing artificial lakes in the northern and eastern regions has led to a drastic reduction in the area of Cheonsu Bay. In summer, the influx of large volumes of eutrophic freshwater constitutes a significant environmental pressure for Cheonsu Bay. Existing research has demonstrated that the influx of substantial amounts of eutrophic freshwater adversely affects the ecological conditions of the subtidal zone in the bay [26,28]. In this study, the average density of Heteromastus filiformis is 25.7 ind./m2 in summer, which decreases to 7.4 ind./m2 in autumn. At the same time, the average density of Upogebia major in summer reaches up to 147 ind./m2. Therefore, compared to autumn, the overall ecological quality of the intertidal zone in summer is lower. As a subterranean deposit feeder, the abundance of Heteromastus filiformis increases with organic matter accumulation. Concurrently, the abundance of Upogebia major is significantly correlated with the concentration of dissolved inorganic nitrogen (DIN) [51]. The abundance of these two species indicates that the influx of eutrophic freshwater has impacted the ecological environment of the intertidal zone in Cheonsu Bay. Still, due to the differing principles underlying various biotic indices, different indices exhibit distinct performances in response to various human pressures [42,52]. In this study, the absence of critical human pressure data (DIN and DIP) precluded a definitive assessment of the applicability of seven indices in the intertidal zone of Cheonsu Bay. Furthermore, utilising data on human pressures can aid in determining the appropriateness of the boundaries set by the indices. We recommend that a comprehensive understanding of the human pressures in a region is essential when using biotic indices to evaluate the benthic ecological quality of that area. In subsequent research, it is necessary to explore the response of seven indices to human pressures in Cheonsu Bay further.

5. Conclusions

On 5 July 2022, the South Korean government formally enacted the Framework Act on Sustainable Development, which stipulates that national and local governmental entities must address maritime pollution and protect marine ecosystems. In this context, the demand for the precise evaluation of marine habitat quality is increasing, as ecological quality is intricately linked to the development and execution of marine environmental policies. In this study, we used seven biotic indices, AMBI, BENTIX, BOPA, BPI, M-AMBI, H’, and W-value, to assess the benthic ecological quality in the intertidal zone of Cheonsu Bay. In this study, apart from the H’ and W-value indices, the other indices (AMBI, BENTIX, BOPA, BPI, and M-AMBI) suggest that the ecological quality was acceptable at most stations in the intertidal zone of Cheonsu Bay. The influx of a large amount of eutrophic freshwater has impacted the intertidal zone of the bay, but the applicability of the seven indices requires further investigation. Overall, this study investigated the ecological quality in the intertidal zone of Cheonsu Bay and provided valuable information for conserving the benthic macrofauna in the intertidal zone of Cheonsu Bay.

Supplementary Materials

The following supporting information can be downloaded at: https://www.mdpi.com/article/10.3390/w16020272/s1, Table S1: the ecological group categorisation of macrobenthos; Table S2: gravel, sand, silt, clay, and mean grain size of surface sediments at each station of Cheonsu Bay in the study; Table S3: acid volatile sulphide (AVS), chemical oxygen demand (COD), and ignition loss (IL) of surface sediments at each station of Cheonsu Bay in the study; Table S4: the composition and number of macrobenthos species at each station of Cheonsu Bay in the study.

Author Contributions

Conceptualisation, J.L. and C.-W.M.; methodology, J.L.; software, J.L.; validation, J.L. and S.-K.K.; formal analysis, J.L. and S.-K.K.; investigation, S.-H.P.; resources, S.-H.P.; data curation, S.-H.P.; writing—original draft preparation, J.L.; writing—review and editing, J.L.; visualisation, J.L.; supervision, C.-W.M.; project administration, C.-W.M.; funding acquisition, C.-W.M. All authors have read and agreed to the published version of the manuscript.

Funding

This work was supported by Soonchunhyang University Research Fund.

Data Availability Statement

Data are contained within the Supplementary Materials.

Conflicts of Interest

Author Sang-Hyeok Park was employed by the company Marine. The remaining authors declare that the research was conducted in the absence of any commercial or financial relationships that could be construed as a potential conflict of interest.

References

  1. Liao, J.; Feng, H.; Yan, S.; Cui, X.; Tang, S.; Liu, X. Comprehensive Distribution Characteristics and Risks of Heavy Metals in Typical Intertidal Zones and Their Relationship with Urban Economic Indicators. Ecol. Indic. 2023, 148, 110112. [Google Scholar] [CrossRef]
  2. Nordlund, L.M.; De La Torre-Castro, M.; Erlandsson, J.; Conand, C.; Muthiga, N.; Jiddawi, N.; Gullström, M. Intertidal Zone Management in the Western Indian Ocean: Assessing Current Status and Future Possibilities Using Expert Opinions. Ambio J. Environ. Soc. 2014, 43, 1006–1019. [Google Scholar] [CrossRef] [PubMed]
  3. Hong, S.; Yoon, S.J.; Kim, T.; Ryu, J.; Kang, S.-G.; Khim, J.S. Response to Oiled Wildlife in the Management and Evaluation of Marine Oil Spills in South Korea: A Review. Reg. Stud. Mar. Sci. 2020, 40, 101542. [Google Scholar] [CrossRef]
  4. Nazeer, Z.; Khan, S.A.; Manikandan, K.; Manokaran, S.; Hsu, H.H.; Joydas, T.; Lyla, P.S. Macrofaunal Assemblage in the Intertidal Area of Saudi Arabian Gulf Coast. Reg. Stud. Mar. Sci. 2021, 47, 101954. [Google Scholar] [CrossRef]
  5. Pearson, T.H.; Rosenberg, R. Macrobenthic Succession in Relation to Organic Enrichment and Pollution of the Marine Environment. Oceanogr. Mar. Biol. Ann. Rev. 1978, 16, 229–311. [Google Scholar]
  6. Luo, X.; Lin, S.; Yang, J.; Shen, J.; Fan, Y.; Zhang, L. Benthic Habitat Quality Assessment Based on Biological Indices in Xiaoqing River Estuary and Its Adjacent Sea of Laizhou Bay, China. J. Ocean. Univ. China 2017, 16, 537–546. [Google Scholar] [CrossRef]
  7. Liu, L.; Li, A.; Zhu, L.; Xue, S.; Li, J.; Zhang, C.; Yu, W.; Ma, Z.; Zhuang, H.; Jiang, Z.; et al. The Application of the Generalized Additive Model to Represent Macrobenthos near Xiaoqing Estuary, Laizhou Bay. Biology 2023, 12, 1146. [Google Scholar] [CrossRef]
  8. Borja, A.; Franco, J.; Pérez, V. A Marine Biotic Index to Establish the Ecological Quality of Soft-Bottom Benthos Within European Estuarine and Coastal Environments. Mar. Pollut. Bull. 2000, 40, 1100–1114. [Google Scholar] [CrossRef]
  9. Simboura, N.; Zenetos, A. Benthic Indicators to Use in Ecological Quality Classification of Mediterranean Soft Bottom Marine Ecosystems, Including a New Biotic Index. Medit. Mar. Sci. 2002, 3, 77–111. [Google Scholar] [CrossRef]
  10. Dauvin, J.C.; Ruellet, T. Polychaete/Amphipod Ratio Revisited. Mar. Pollut. Bull. 2007, 55, 215–224. [Google Scholar] [CrossRef]
  11. KORDI (Korea Ocean Research and Development Institute). Marine Environmental Assessment Based on the Benthic Faunal Communities; Report of Management Technique for Marine Environmental Protection Last Year; KORDI: Ansan, Republic of Korea, 1995. [Google Scholar]
  12. Muxika, I.; Borja, Á.; Bald, J. Using Historical Data, Expert Judgement and Multivariate Analysis in Assessing Reference Conditions and Benthic Ecological Status, According to the European Water Framework Directive. Mar. Pollut. Bull. 2007, 55, 16–29. [Google Scholar] [CrossRef]
  13. Warwick, R.M.; Clarke, K.R. Relearning the ABC: Taxonomic Changes and Abundance/Biomass Relationships in Disturbed Benthic Communities. Mar. Biol. 1994, 118, 739–744. [Google Scholar] [CrossRef]
  14. Shannon, C.E.; Weaver, W. The Mathematical Theory of Communication, 1st ed.; The University of Illinois Press: Urbana, IL, USA, 1964; pp. 1–131. [Google Scholar]
  15. Reiss, H.; Kröncke, I. Seasonal Variability of Benthic Indices: An Approach to Test the Applicability of Different Indices for Ecosystem Quality Assessment. Mar. Pollut. Bull. 2005, 50, 1490–1499. [Google Scholar] [CrossRef] [PubMed]
  16. Zettler, M.L.; Schiedek, D.; Bobertz, B. Benthic Biodiversity Indices versus Salinity Gradient in the Southern Baltic Sea. Mar. Pollut. Bull. 2007, 55, 258–270. [Google Scholar] [CrossRef]
  17. Magni, P.; Vesal, S.E.; Giampaoletti, J.; Como, S.; Gravina, M.F. Joint Use of Biological Traits, Diversity and Biotic Indices to Assess the Ecological Quality Status of a Mediterranean Transitional System. Ecol. Indic. 2023, 147, 109939. [Google Scholar] [CrossRef]
  18. Yan, J.; Sui, J.; Xu, Y.; Li, X.; Wang, H.; Zhang, B. Assessment of the Benthic Ecological Status in Adjacent Areas of the Yangtze River Estuary, China, Using AMBI, M-AMBI and BOPA Biotic Indices. Mar. Pollut. Bull. 2020, 153, 111020. [Google Scholar] [CrossRef] [PubMed]
  19. Liu, Z.; Fan, B.; Huang, Y.; Yu, P.; Li, Y.; Chen, M.; Cai, M.; Lv, W.; Jiang, Q.; Zhao, Y. Assessing the Ecological Health of the Chongming Dongtan Nature Reserve, China, Using Different Benthic Biotic Indices. Mar. Pollut. Bull. 2019, 146, 76–84. [Google Scholar] [CrossRef] [PubMed]
  20. Khedhri, I.; Afli, A.; Aleya, L. Structuring Factors of the Spatio-Temporal Variability of Macrozoobenthos Assemblages in a Southern Mediterranean Lagoon: How Useful for Bioindication Is a Multi-Biotic Indices Approach? Mar. Pollut. Bull. 2017, 114, 515–527. [Google Scholar] [CrossRef]
  21. D’Alessandro, M.; Esposito, V.; Giacobbe, S.; Renzi, M.; Mangano, M.C.; Vivona, P.; Consoli, P.; Scotti, G.; Andaloro, F.; Romeo, T. Ecological Assessment of a Heavily Human-Stressed Area in the Gulf of Milazzo, Central Mediterranean Sea: An Integrated Study of Biological, Physical and Chemical Indicators. Mar. Pollut. Bull. 2016, 106, 260–273. [Google Scholar] [CrossRef]
  22. Ryu, J.; Hong, S.; Chang, W.K.; Khim, J.S. Performance Evaluation and Validation of Ecological Indices toward Site-Specific Application for Varying Benthic Conditions in Korean Coasts. Sci. Total Environ. 2016, 541, 1161–1171. [Google Scholar] [CrossRef]
  23. Yao, K.-S.; He, Y.-J.; Van Den Brink, P.J.; Dai, Y.-N.; Yang, Y.; Cui, Y.-D. Multivariate Approaches to Assess the Drivers of Benthic Macroinvertebrate Communities and Biotic Indices in a Highly Urbanized Fluvial-Estuarine System. Ecol. Indic. 2022, 139, 108956. [Google Scholar] [CrossRef]
  24. Dong, J.-Y.; Wang, X.; Bidegain, G.; Sun, X.; Bian, X.; Zhang, X. Assessment of the Benthic Ecological Quality Status (EcoQs) of Laizhou Bay (China) with an Integrated AMBI, M−AMBI, BENTIX, BO2A and Feeding Evenness Index. Ecol. Indic. 2023, 153, 110456. [Google Scholar] [CrossRef]
  25. Jung, R.-H.; Seo, I.-S.; Lee, W.-C.; Kim, H.-C.; Park, S.-R.; Kim, J.-B.; Oh, C.-W.; Choi, B.-M. Community Structure and Health Assessment of Macrobenthic Assemblages at Spring and Summer in Cheonsu Bay, West Coast of Korea. Sea J. Korean Soc. Oceanogr. 2014, 19, 272–286. [Google Scholar] [CrossRef]
  26. Lee, J.S.; Kim, K.H.; Shim, J.; Han, J.H.; Choi, Y.H.; Khang, B.-J. Massive Sedimentation of Fine Sediment with Organic Matter and Enhanced Benthic–Pelagic Coupling by an Artificial Dyke in Semi-Enclosed Chonsu Bay, Korea. Mar. Pollut. Bull. 2012, 64, 153–163. [Google Scholar] [CrossRef] [PubMed]
  27. Lee, T.W.; Choi, M.S.; Yang, S.L.; Ma, C.W.; Park, S.C. Final Report on the Environmental Survey and Fishery Utilization Study of Cheonsu Bay. Hongseong, Republic of Korea, 2011; p. 95. [Google Scholar]
  28. Kim, S.K. Assessment of Long-Term Variation in Macrobenthic Community and Ecological Quality Status in the Sutbital Zone of Cheonsu Bay. Master’s Thesis, Soonchunhyang University, Asan, Republic of Korea, 2023. [Google Scholar]
  29. National Institute of Fisheries Science. National Institute of Fisheries Science Notification of Marine Environmental Process Test Standards 2010; National Institute of Fisheries Science: Busan, Republic of Korea, 2010; Available online: https://www.nifs.go.kr/board/actionBoard0052List.do?BBS_CL_CD=ALL (accessed on 19 November 2023).
  30. Xu, Z.L.; Cheng, Y.Y. Aggregated Intensity of Dominant Species of Zooplankton in Autumn in the East China Sea and Yellow Sea. J. Ecol. 1989, 8, 13–15. [Google Scholar]
  31. Borja, A.; Dauer, D.M.; Díaz, R.; Llansó, R.J.; Muxika, I.; Rodríguez, J.G.; Schaffner, L. Assessing Estuarine Benthic Quality Conditions in Chesapeake Bay: A Comparison of Three Indices. Ecol. Indic. 2008, 8, 395–403. [Google Scholar] [CrossRef]
  32. Borja, A.; Tunberg, B.G. Assessing Benthic Health in Stressed Subtropical Estuaries, Eastern Florida, USA Using AMBI and M-AMBI. Ecol. Indic. 2011, 11, 295–303. [Google Scholar] [CrossRef]
  33. Seo, J.-Y.; Lim, H.-S.; Choi, J.-W. Threshold Value of Benthic Pollution Index (BPI) for a Muddy Healthy Benthic Faunal Community and Its Application to Jinhae Bay in the Southern Coast of Korea. Ocean Sci. J. 2014, 49, 313–328. [Google Scholar] [CrossRef]
  34. Blanchet, H.; Lavesque, N.; Ruellet, T.; Dauvin, J.C.; Sauriau, P.G.; Desroy, N.; Desclaux, C.; Leconte, M.; Bachelet, G.; Janson, A.-L.; et al. Use of Biotic Indices in Semi-Enclosed Coastal Ecosystems and Transitional Waters Habitats—Implications for the Implementation of the European Water Framework Directive. Ecol. Indic. 2008, 8, 360–372. [Google Scholar] [CrossRef]
  35. Marín-Guirao, L.; Cesar, A.; Marín, A.; Lloret, J.; Vita, R. Establishing the Ecological Quality Status of Soft-Bottom Mining-Impacted Coastal Water Bodies in the Scope of the Water Framework Directive. Mar. Pollut. Bull. 2005, 50, 374–387. [Google Scholar] [CrossRef]
  36. Monserud, R.A.; Leemans, R. Comparing Global Vegetation Maps with the Kappa Statistic. Ecol. Modell. 1992, 62, 275–293. [Google Scholar] [CrossRef]
  37. Medeiros, J.P.; Chaves, M.L.; Silva, G.; Azeda, C.; Costa, J.L.; Marques, J.C.; Costa, M.J.; Chainho, P. Benthic Condition in Low Salinity Areas of the Mira Estuary (Portugal): Lessons Learnt from Freshwater and Marine Assessment Tools. Ecol. Indic. 2012, 19, 79–88. [Google Scholar] [CrossRef]
  38. Luo, X.X.; Yang, J.Q. Progress in Researches on Benthic Indices of Assessing Marine Ecosystem Health. Mari. Sci. Bull. 2009, 28, 106–112. [Google Scholar]
  39. Simboura, N.; Reizopoulou, S. An Intercalibration of Classification Metrics of Benthic Macroinvertebrates in Coastal and Transitional Ecosystems of the Eastern Mediterranean Ecoregion (Greece). Mar. Pollut. Bull. 2008, 56, 116–126. [Google Scholar] [CrossRef] [PubMed]
  40. Simboura, N.; Papathanassiou, E.; Sakellariou, D. The Use of a Biotic Index (Bentix) in Assessing Long-Term Effects of Dumping Coarse Metalliferous Waste on Soft Bottom Benthic Communities. Ecol. Indic. 2007, 7, 164–180. [Google Scholar] [CrossRef]
  41. Lee, J.Y. Changes in the Water Quality (Nutrients, Organic Materials and Trace Metals) by Freshwater Discharge from Artificial Lake in Cheonsu Bay. Master’s Thesis, Chungnam National University, Daejeon, Republic of Korea, 2020. [Google Scholar]
  42. Wu, H.-Y.; Fu, S.-F.; Hu, W.-J.; Chen, F.-G.; Cai, X.-Q.; Chen, Q.-H.; Wu, Y.-B. Response of Different Benthic Biotic Indices to Eutrophication and Sediment Heavy Metal Pollution, in Fujian Coastal Water, East China Sea. Chemosphere 2022, 307, 135653. [Google Scholar] [CrossRef] [PubMed]
  43. Mulik, J.; Sukumaran, S.; Dias, H.Q. Can the Ecological Status of Three Differentially Impacted Monsoonal Tropical Estuaries in NW India, Be Adequately Assessed by a Common Estuarine Benthic Index? Ecol. Indic. 2020, 119, 106807. [Google Scholar] [CrossRef]
  44. Kim, J.H. Spatiotemporal Distribution of Benthic Polychaetous Community in Gwangyng Bay, Southern Coast of Korea Late-2000′s -Focused on Investigated Data from December 2007 and April 2008. Master’s Thesis, Chonnam National University, Gwangju, Republic of Korea, 2010. [Google Scholar]
  45. Park, S.W. Seasonal and Spatial Distribution of Benthic Polychaetous Community on the South-Eastern Coastal Region, Korea. Master’s Thesis, Chonnam National University, Gwangju, Republic of Korea, 2014. [Google Scholar]
  46. Jo, J.G. Spatial Distribution of Benthic Polychaetous Communities on the South-Eastern Continental Shelf, South Sea of Korea. Master’s Thesis, Chonnam National University, Gwangju, Republic of Korea, 2016. [Google Scholar]
  47. Son, C.R. Spatio-Temporal Variation of Macrobenthic Community on Muchangpo Tidal Flat of the West Coast of Korea. Master’s Thesis, Chonnam National University, Gwangju, Republic of Korea, 2023. [Google Scholar]
  48. Kim, J.C. Benthic Environment and Community Structure of Macrobenthos at the Tidal Flats in Chungnam, Korea. Ph.D. Thesis, Soonchunhyang University, Asan, Republic of Korea, 2010. [Google Scholar]
  49. Park, S.H. Macrobenthic Community of Tidal Flat in Cheonsu Bay, South Korea. Master’s Thesis, Soonchunhyang University, Asan, Republic of Korea, 2021. [Google Scholar]
  50. Seo, J.Y. A Study on the Determination of Threshold Value of Benthic Community Health and Application of Benthic Pollution Index (BPI) to Special Management Areas the Southern Coasts of Korea. Ph.D. Thesis, Pusan National University, Pusan, Republic of Korea, 2016. [Google Scholar]
  51. Jeon, S.R.; Ong, G.; Koo, J.-H.; Park, J.-W.; Kim, Y.C.; Jeung, H.D.; Cho, J.K. Comparison of the Seawater-Sediment Environment and Habitat Properties with Variable Mud Shrimp Upogebia major Burrow Hole Density and Its Influence on Recruitment and Settlement in the Cheonsu Bay Tidal Flats. Korean J. Fish. Aquat. Sci. 2022, 55, 171–182. [Google Scholar] [CrossRef]
  52. Borja, Á.; Marín, S.L.; Muxika, I.; Pino, L.; Rodríguez, J.G. Is there a possibility of ranking benthic quality assessment indices to select the most responsive to different human pressures? Mar. Pollut. Bull. 2015, 97, 85–94. [Google Scholar] [CrossRef]
Figure 1. Survey stations for macrobenthos and sediments in the intertidal zone of Cheonsu Bay. Note: green indicates the land areas; grey indicates the intertidal zone areas; white indicates the marine areas; blue indicates the lake areas.
Water 16 00272 g001
Figure 2. Composition and number of macrobenthos species by phylum at each station in the intertidal zone of Cheonsu Bay. Note: “A” is autumn; “S” is summer.
Water 16 00272 g002
Figure 3. Biotic indices values and ecological quality status in summer (a) and autumn (b) in the intertidal zone of Cheonsu Bay.
Water 16 00272 g003aWater 16 00272 g003b
Figure 4. The per cent of ecological quality status and ecological quality for acceptable and unacceptable of biotic indices in summer and autumn.
Water 16 00272 g004
Figure 5. Correlation analysis between AMBI, BENTIX, BOPA, M-AMBI, W-value, and H’, with environment factors in the intertidal zone of Cheonsu Bay. Note: AMBI, BENTIX, BOPA, BPI, W-value, and H’ indicate the AZTI marine biotic index, benthic index, benthic opportunistic polychaetes amphipods index, benthic pollution index, multivariate AZTI marine biotic index, and abundance biomass comparison and Shannon diversity index, respectively; AVS, COD, and IL indicate the acid volatile sulphide, chemical oxygen demand, and ignition loss, respectively.
Water 16 00272 g005
Table 2. Environment factors in the intertidal zone of Cheonsu Bay.
Environmental FactorsMaxMinMeanSD
AVS, mg/g0.1100.0220.03
COD, mg/g17.753.779.303.74
IL, %4.841.512.840.90
Gravel, %2.1800.220.53
Sand, %77.4031.8826.22
Silt, %14.588.9349.4727.35
Clay, %42.237.6618.429.28
Mean grain, ∅7.372.535.381.24
Note(s): SD, standard deviation; AVS, acid volatile sulphide; COD, chemical oxygen demand; IL, ignition loss.
Table 3. Dominant species and dominant values of macrobenthos in summer and autumn in the intertidal zone of Cheonsu Bay.
SeasonTaxaSpecieDominant Value
SummerEumalacostracaUpogebia major0.185
SedentariaHeteromastus filiformis0.078
EumalacostracaMacrophthalmus japonicus0.023
AutumnEumalacostracaMacrophthalmus japonicus0.096
SedentariaHeteromastus filiformis0.042
NemerteaNemertea0.032
CaenogastropodaNassarius sp. 0.021
Table 4. Kappa values, levels of agreement, and percentages of match for the ecological status for all combinations of biotic indices used in this study.
IndicesKappa Value%MatchLevel of Agreement
AMBI/M-AMBI0.30782.5Low
AMBI/BENTIX0.53892.5Moderate
AMBI/BOPA0.78797.5Very good
AMBI/BPI0.65565.5Good
AMBI/H’0.06142.5Very Low
AMBI/W-value0.03265Null
M-AMBI/BENTIX0.48985Moderate
M-AMBI/BOPA0.43785Moderate
M-AMBI/BPI0.16280Very Low
M-AMBI/H’0.29760Low
M-AMBI/W-value0.30470Low
BENTIX/BOPA0.73495Very good
BENTIX/BPI0.30490Low
BENTIX/H’0.15850Very low
BENTIX/W-value0.01560Null
BOPA/BPI0.48195Moderate
BOPA/H’0.09345Very low
BOPA/W-value−0.01660Null
BPI/H’0.0340Null
BPI/W-value0.08265Very low
H’/W-value0.43570Moderate
Disclaimer/Publisher’s Note: The statements, opinions and data contained in all publications are solely those of the individual author(s) and contributor(s) and not of MDPI and/or the editor(s). MDPI and/or the editor(s) disclaim responsibility for any injury to people or property resulting from any ideas, methods, instructions or products referred to in the content.

