Article

A New Chemiluminescence Assay for Hypochlorite Detection in Water: A Synergistic Combination of WS2 Quantum Dots and Luminol

by
Madina M. Sozarukova
1,
Elena V. Proskurnina
1,2,
Ekaterina M. Kochneva
3,
Andrey K. Barinov
4,
Alexander E. Baranchikov
1,* and
Vladimir K. Ivanov
1
1
Kurnakov Institute of General and Inorganic Chemistry of the Russian Academy of Sciences, 119991 Moscow, Russia
2
Research Centre for Medical Genetics, 115522 Moscow, Russia
3
OOO Globalhimfarm, 143405 Krasnogorsk, Russia
4
Institute for African Studies, Russian Academy of Sciences, 123001 Moscow, Russia
*
Author to whom correspondence should be addressed.
Water 2024, 16(21), 3044; https://doi.org/10.3390/w16213044
Submission received: 25 September 2024 / Revised: 16 October 2024 / Accepted: 18 October 2024 / Published: 24 October 2024

Abstract

:
The issue of the qualitative and quantitative analysis of the concentration of oxidising species in aquatic environments is crucial for a wide range of biological and environmental tasks. In particular, reactive chlorine species, specifically hypochlorite (ClO), play a significant biochemical role in the operation of the immune system. There is also the challenge of determining the presence of ClO in purified drinking water that is supplied by water treatment systems. Traditional chemical analytical methods often lack the required selectivity and sensitivity to detect oxidising compounds, and chemiluminescence-based techniques offer an alternative solution. In this study, we propose a simple and selective approach for the chemiluminescent detection of hypochlorite in aqueous media under neutral conditions. The technique is based on measuring a chemiluminescent signal generated in the presence of hypochlorite by a combined probe comprising commercially available WS2 quantum dots and luminol. The oxidation of WS2 with hypochlorite followed by a reaction with luminol results in an intense luminescent signal that enables the selective determination of hypochlorite under neutral conditions. The greatest sensitivity with this method was achieved when combining WS2 quantum dots with L-012, a highly sensitive analogue of luminol. Additionally, the use of L-012 improved the detection limit for hypochlorite to 2 × 10⁻⁶ M. Due to its selectivity in determining hypochlorite in the presence of reactive oxygen species (hydrogen peroxide) under neutral conditions with high sensitivity and with a wide linear range, the proposed approach provides an attractive analytical tool for the analysis of water samples and biological liquids.

1. Introduction

The qualitative and quantitative analysis of oxidising species in aquatic environments is of great importance for various biological and environmental tasks [1,2,3]. This issue is very relevant to the development of environmentally sound and efficient methods of water treatment, where technologies based on deep oxidation processes, also known as advanced oxidation processes (AOPs), have emerged as a promising approach [4,5,6,7,8,9].
Oxidising species include radicals bearing unpaired electrons as well as highly reactive molecules or ions [10]. These agents can be divided into different categories based on their chemical composition, such as reactive oxygen species, ROS (•O2, •OH, H2O2, 1O2, O3, etc.); reactive nitrogen species, RNS (ONOO, NO, etc.); reactive chlorine species, RCS (ClO, Cl, ClO); lipid radicals (alkyl, alkoxyl, peroxyl), and others [11,12,13,14,15,16]. Oxidising species play distinctly different roles in living systems; they contribute to the regulation of normal physiological processes but at abnormal levels, they are responsible for various toxic effects and contribute to the development of various diseases, including cardiovascular, neurodegenerative and autoimmune conditions, and even cancer [17,18,19,20,21]. In this context, it is of the utmost importance to provide reliable and accurate measurement tools for the analysis of oxidising species in various water sources, particularly in tap water, which is the primary source of drinking water for humans in the modern world.
Traditional chemical methods for the analysis of oxidising species often have low sensitivity and a limited information capacity, and they require time-consuming sample preparation procedures [22,23,24]. Chemiluminescent analyses are the most striking alternative [23,25,26]. This group of analytical techniques involves the use of probe molecules that react with oxidants followed by the formation of intermediates in an excitation state that emit light during the relaxation process. The most commonly used probe molecules include luminol, L-012 luminol analogue (8-amino-5-chloro-7-phenylpyrido[3,4-d]pyridazine-1,4(2H,3H)dione), and lucigenin [27,28,29,30,31,32,33].
Recently, the potential use of quantum dots in chemiluminescent analysis has been demonstrated and chemiluminescence resonance energy transfer (CRET) by quantum dots has been shown to efficiently enhance the sensitivity and specificity of the chemiluminescent technique [34,35,36]. For analytical purposes, transition metal dichalcogenide quantum dots, particularly tungsten disulphide quantum dots (WS2 QDs), have attracted a great deal of attention due to their unique optical characteristics, excellent catalytic performance, high reactivity, and biocompatibility [36,37,38,39,40,41,42]. WS2 QDs have been shown to be used successfully as a co-catalyst in the Fe(II)-S(IV) chemiluminescent reaction, resulting in the formation of hydroxyl radicals, and for the development of a hydrogen peroxide–luminol–haemin chemiluminescent platform for biomolecule sensing applications [7,43]. WS2 QDs have also been described as a component of a test system for detecting hydrogen peroxide and their benefits have been shown in the context of the development of advanced oxidation processes aimed at decomposing organic pollutants in water [44,45]. Thus, to date, it has been demonstrated that WS2 QDs are efficient when analysing reactive oxygen species, but their potential for detecting other oxidising species, particularly reactive chlorine species, has not yet been established.
The best known and most stable reactive chlorine species (RCS) is hypochlorite (HClO/ClO). It is essential that RCS are always present in the human body, e.g., endogenous hypochlorite is produced by white blood cells (neutrophils) and plays a crucial role in the functioning of the immune system [46,47,48]. An excessive concentration of hypochlorite, however, can cause nonspecific damage in cells’ protein–lipid complexes (lipoproteins) due to halogenative stress [47,49,50].
At the same time, hypochlorite-based reagents are widely used for tap water disinfection due to their low cost and high oxidative potential, as well as their relative stability in water [51,52,53,54]. Despite the versatility and accessibility of this method of water purification, hypochlorite can cause a variety of severe toxic effects, while the organic molecules oxidised by RCS may have a high carcinogenic potential [55]. Significant efforts are currently being made to monitor water quality, and the quantitative analysis of RCS is an important analytical task [56,57,58,59,60]. Importantly, RCS contamination of water is particularly prevalent in developing and transitional countries [61,62,63,64]. The countries in the Global South are confronted with the significant challenge of enhancing access to clean water for their populations as well as for economical needs. The most pressing issues are observed in African countries, and scientific and technological collaboration in the field of water treatment and purification for the countries in the continent is of urgent importance and serves as a reliable foundation for extended international collaboration.
It is important to note that most methods for measuring the chlorine content in water require measurements in an alkaline medium (pH of 8–10) or in mixed solvents, while the ratio between hypochlorous acid, hypochlorite, and dissolved chlorine varies significantly in terms of pH and the composition of the aqueous medium [58,65,66,67,68,69]. In turn, the analysis of RCS using chemiluminescent techniques is challenging, as they exhibit high chemical reactivity and quickly destroy traditional molecular probes (e.g., luminol) [70]. To successfully implement a chemiluminescent assay for the detection of RCS, the current paper suggests using a two-component probe system. This system includes WS2 QDs which are known to react with RCS, resulting in the formation of fewer ROS [44,45]. These ROS can then be detected due to their interaction with a second component, a traditional molecular probe.
The current work is focused on the development of a novel technique for the quantitative analysis of hypochlorite in aqueous solutions. For this, the use of a combined probe, consisting of WS2 QDs and luminol, is suggested. In the presence of hypochlorite, this probe has exhibited a stable linear chemiluminescent response at physiological pH (7.4) over a wide range of concentrations, which is believed to be promising for the detection and quantification of hypochlorite. To further enhance the sensitivity of the method, the use of an analogue of luminol, L-012, is proposed as an alternative second component of the probe. The proposed approach for analysing reactive chlorine species has promise not only for water quality monitoring but also for biological studies, particularly in assessing halogenative stress.

2. Materials and Methods

2.1. Materials and Instruments

For the experiments, commercially available WS2 quantum dots were used (#914290, Sigma, Aldrich, St. Louis, MO, USA), which are supplied in the form of an aqueous colloid solution with a concentration of 0.5 mg/mL. Potassium phosphate monobasic (#P5655, Sigma-Aldrich, St. Louis, MO, USA), sodium hypochlorite (#1.05614, Merck KGaA, Darmstadt, Germany), luminol (#123072, Sigma-Aldrich, St. Louis, MO, USA), 8-amino-5-chloro-7-phenyl-pyrido [3,4-d]pyridazine-1,4(2H,3H)dione sodium salt (L-012, #SML2236, Sigma-Aldrich, St. Louis, MO, USA), hydrogen peroxide (#8.22287, Merck KGaA, Darmstadt, Germany), ammonium iron(II) sulphate hexahydrate (#215406, Sigma-Aldrich, St. Louis, MO, USA), and sodium ascorbate (#PHR1279, Merck KGaA, Darmstadt, Germany) were used. All the reagents were of analytical reagent grade and used without further purification.
UV–vis absorption spectra of WS2 QDs were recorded using a UV–vis spectrophotometer (Cary 4000, Varian, Mulgrave, Australia) in 1.0 cm quartz cuvettes. Chemiluminescent analysis was performed on a 12-channel Lum-1200 chemiluminometer (DISoft, Moscow, Russia). All measurements were performed at room temperature.

2.2. Chemiluminescence Analysis

Chemiluminescent signals from WS2, luminol, and L-012 were registered in aqueous media containing various oxidising species, including hypochlorite (0.05–3.00 mM), hydrogen peroxide (1.5 mM), or hydrogen peroxide (1.5 mM), in the presence of ferrous ions (Mohr’s salt). The kinetic curves were integrated over a specified time period of 10 min. The chemiluminometer recorded an analytical signal each second (signal recording rate of 1 Hz).

2.2.1. Reactive Chlorine Species: Hypochlorite

Chemiluminescent analysis was performed in a phosphate buffer solution (PBS) at pH 7.4. In a measurement cuvette containing PBS (940 µL, 100 mM, pH 7.4), the WS2 QDs aqueous sol was added (20 µL, 40 µM). Then, after 60 s, a NaClO solution was added (20 µL, 1.5 mM). The mixed solution containing WS2 QDs and NaClO was kept for 2 min and the aliquot (20 µL) of luminol (20 µM) or L-012 (20 µM) was added [29,30,31]. The chemiluminescent signal was registered continuously throughout the experiment. The overall duration of the analysis was 15–20 min.

2.2.2. Reactive Oxygen Species: Hydrogen Peroxide

In a measurement cuvette containing PBS (940 µL, 100 mM, pH 7.4), the WS2 QDs aqueous sol was added (20 µL, 40 µM). Then, after 60 s, a hydrogen peroxide solution (20 µL, 1.5 mM) was introduced; the chemiluminescent signal was registered for 60 s and the luminol solution (20 µL, 20 µM) was added [71]. The overall duration of the analysis was 60 min.

2.2.3. Reactive Oxygen Species: Hydrogen Peroxide and Fe(II)

In a measurement cuvette containing PBS (940 µL, 100 mM, pH 7.4), solutions of hydrogen peroxide (20 µL, 100 µM) and luminol (20 µL, 20 µM) were added. After 60 s of measuring the chemiluminescent signal, an ammonium ferrous sulphate solution was added (20 µL, 100 µM). For the experiments with WS2 QDs (H2O2/WS2 QDs/Fe(II)), a 1.5 mM solution of hydrogen peroxide was used. The overall duration of the analysis was 10 min.

2.3. Statistics

The experiments were performed in triplicate; the numerical data hereafter are presented as the mean and standard deviation. The integration of chemiluminescent curves was conducted using PowerGraph software (version 3.3).

3. Results and Discussion

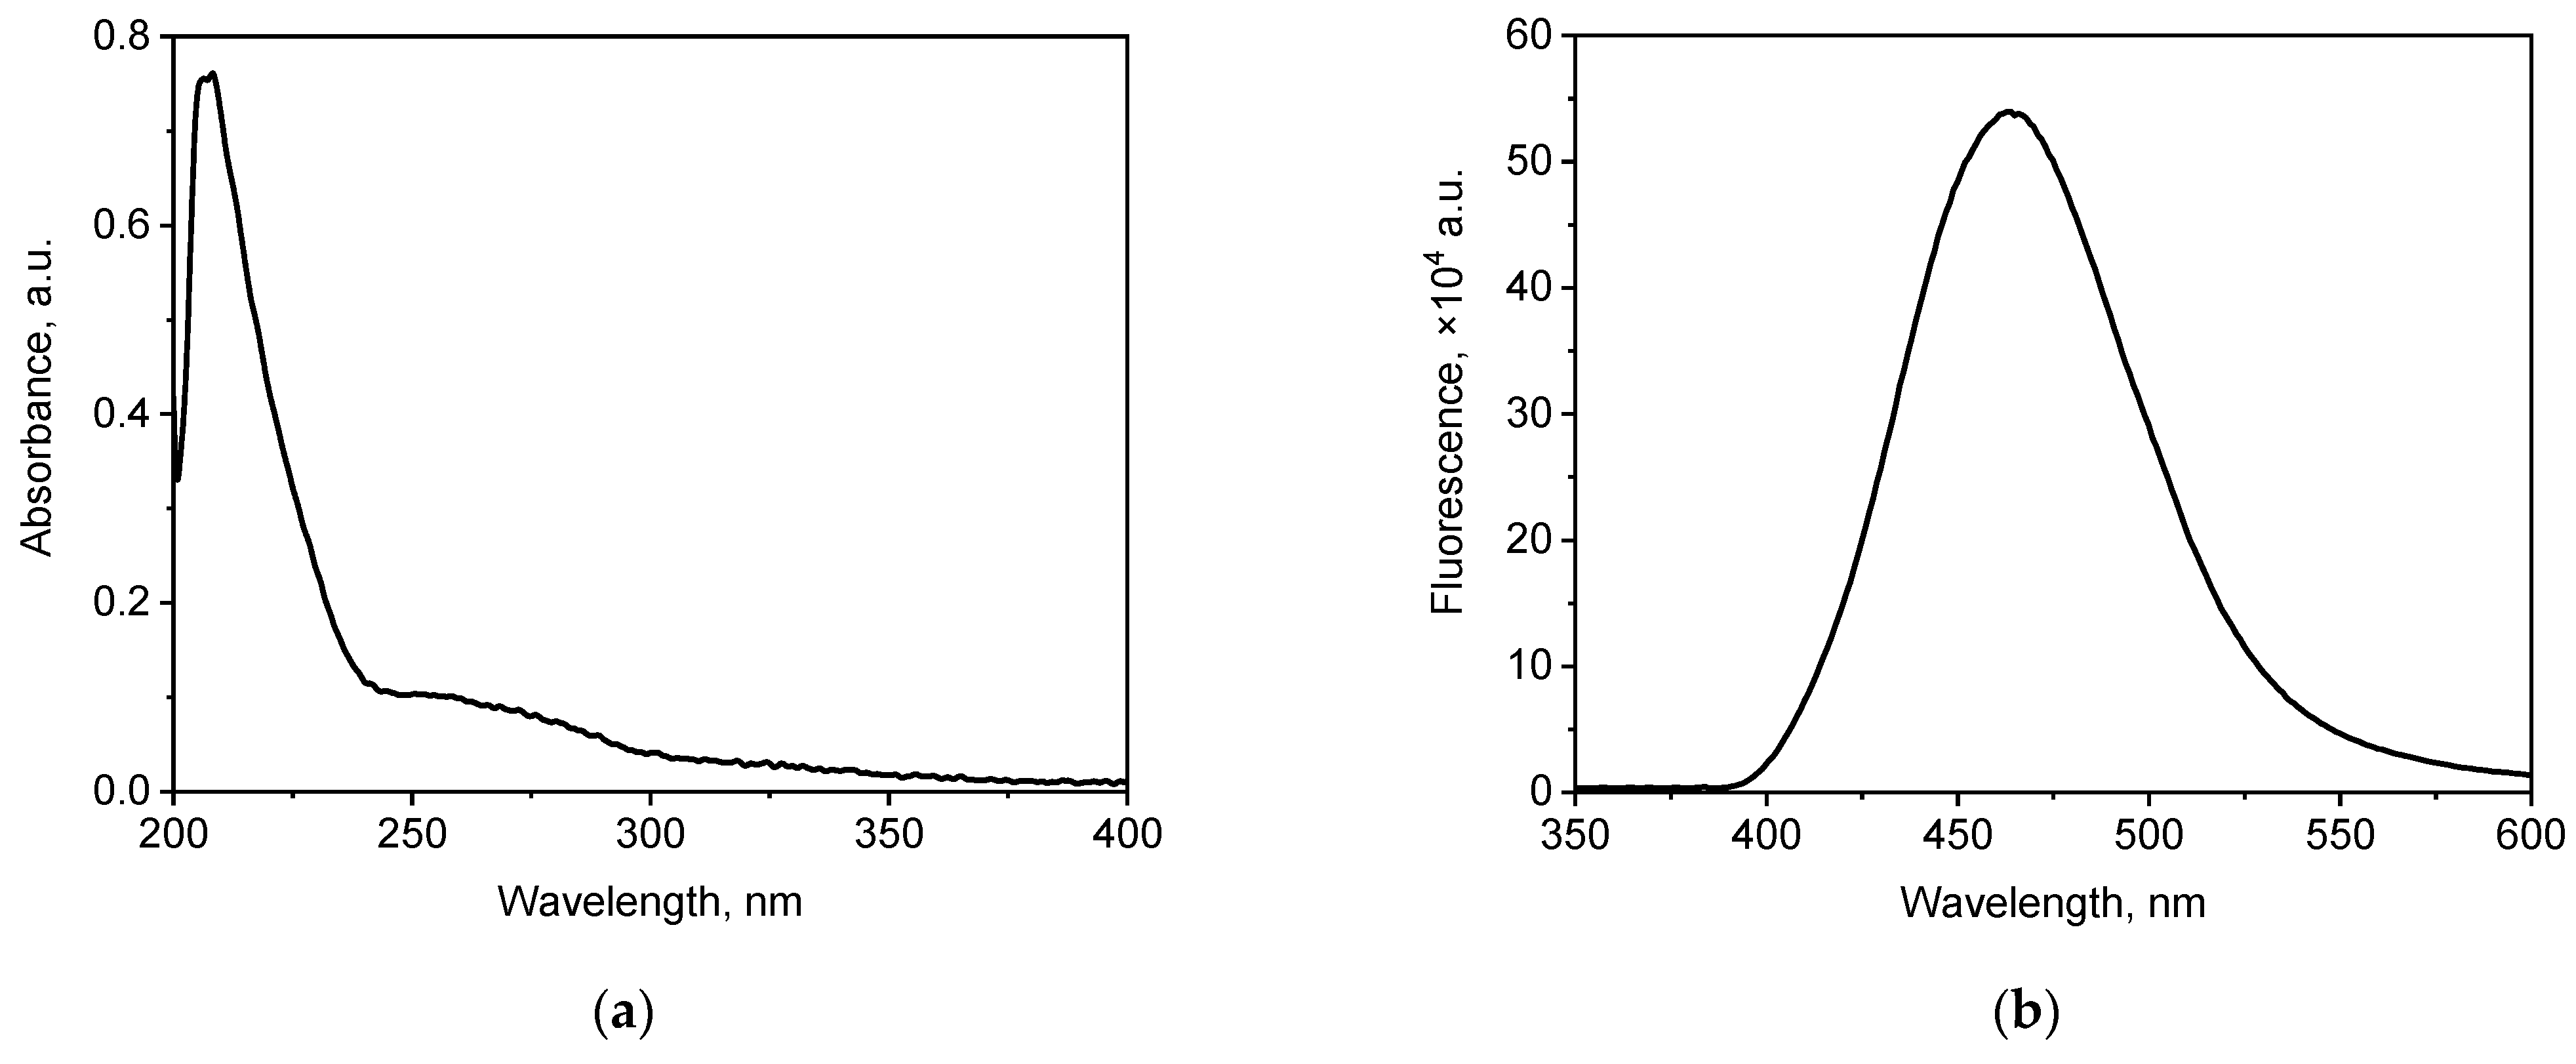
3.1. Characterisation of WS2 QDs

In this study, commercially available WS2 QDs were used. Figure 1 shows the electronic absorption spectrum and the fluorescence spectrum of an aqueous dispersion of WS2 QDs.
WS2 QDs showed UV–vis absorption properties characteristic of this material; the absorption spectrum of an aqueous dispersion of WS2 QDs shows a characteristic band at 270 nm [72]. In addition, the fluorescence spectrum of the aqueous dispersion of WS2 QDs shows a characteristic maximum at 465 nm [73].

3.2. WS2 QDs as a Chemiluminescence Probe for the Detection of Hypochlorite

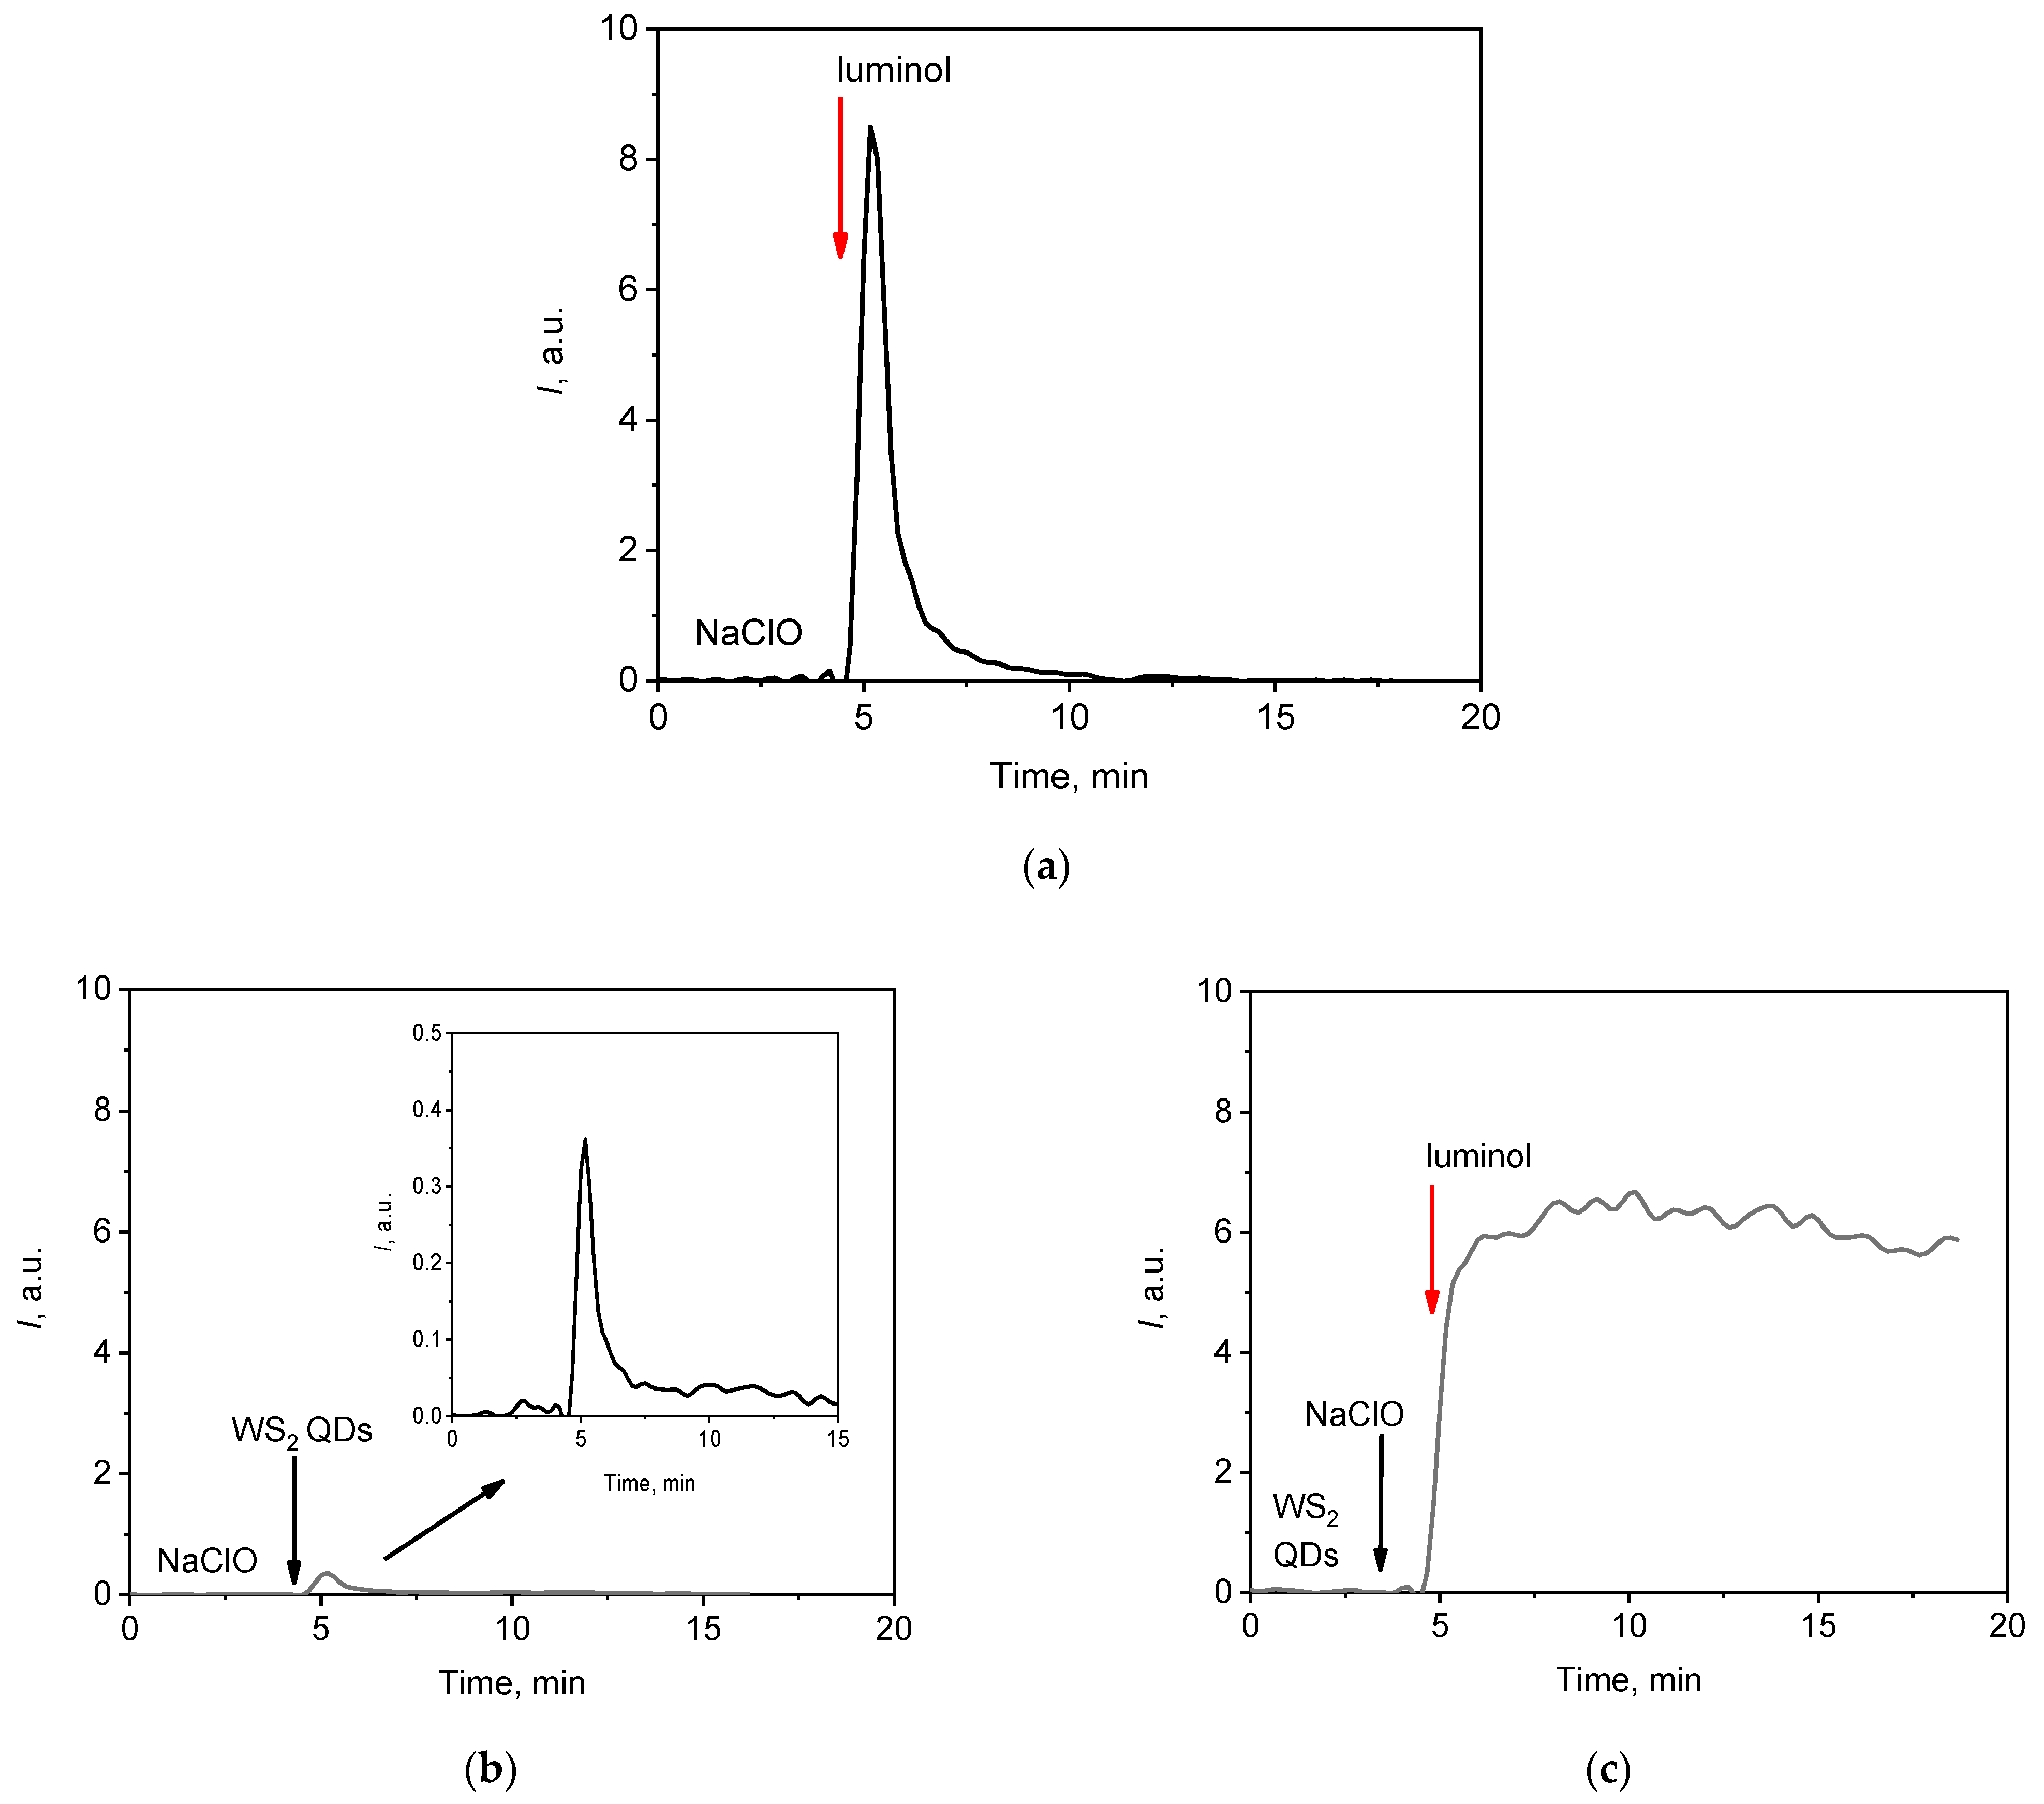
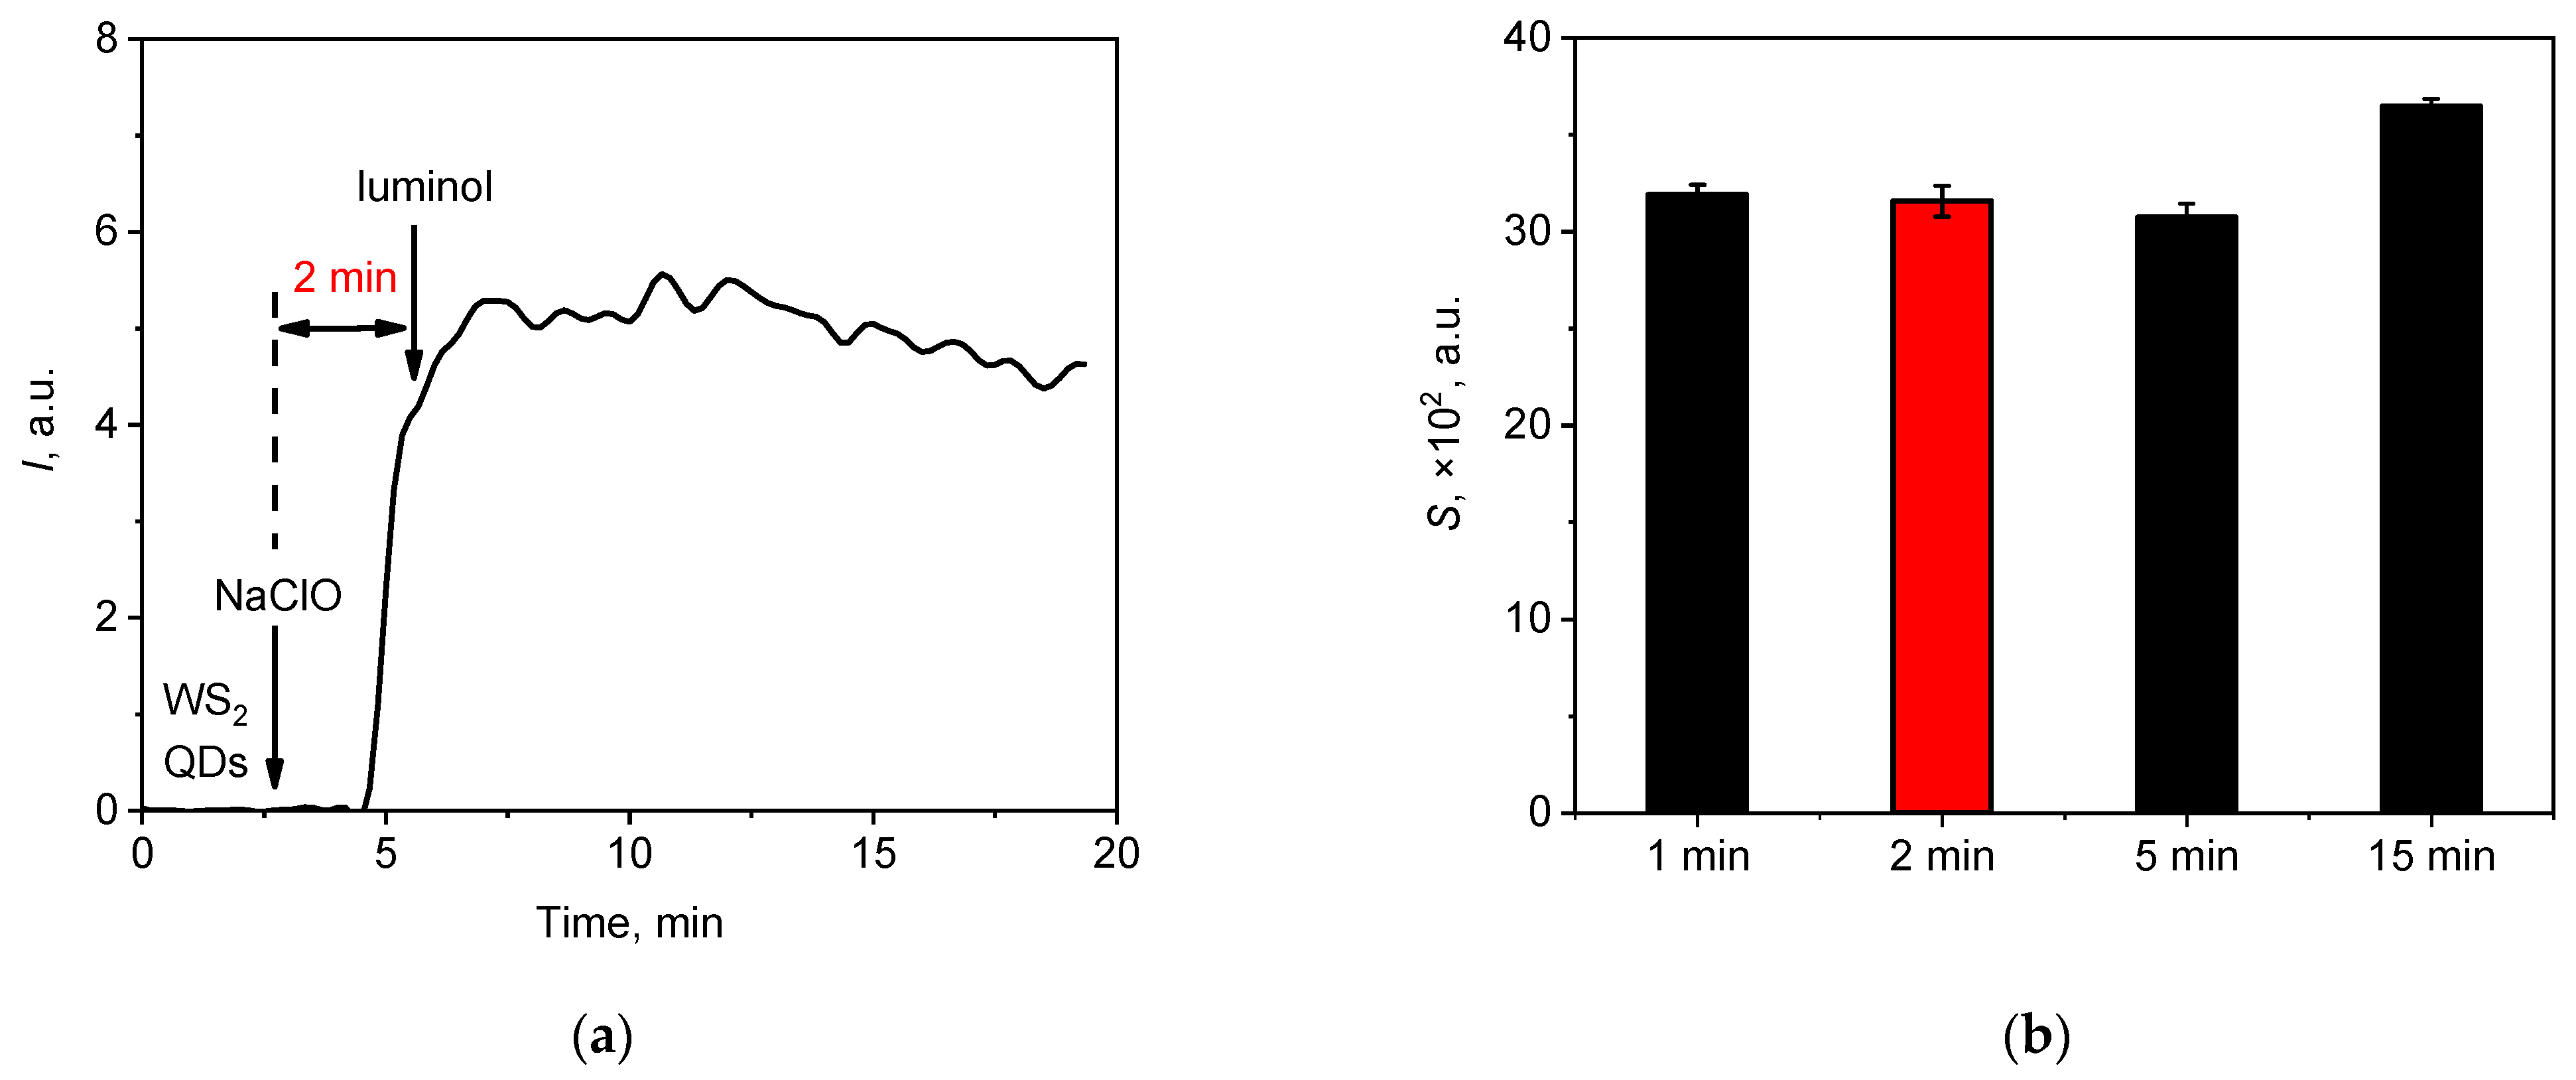
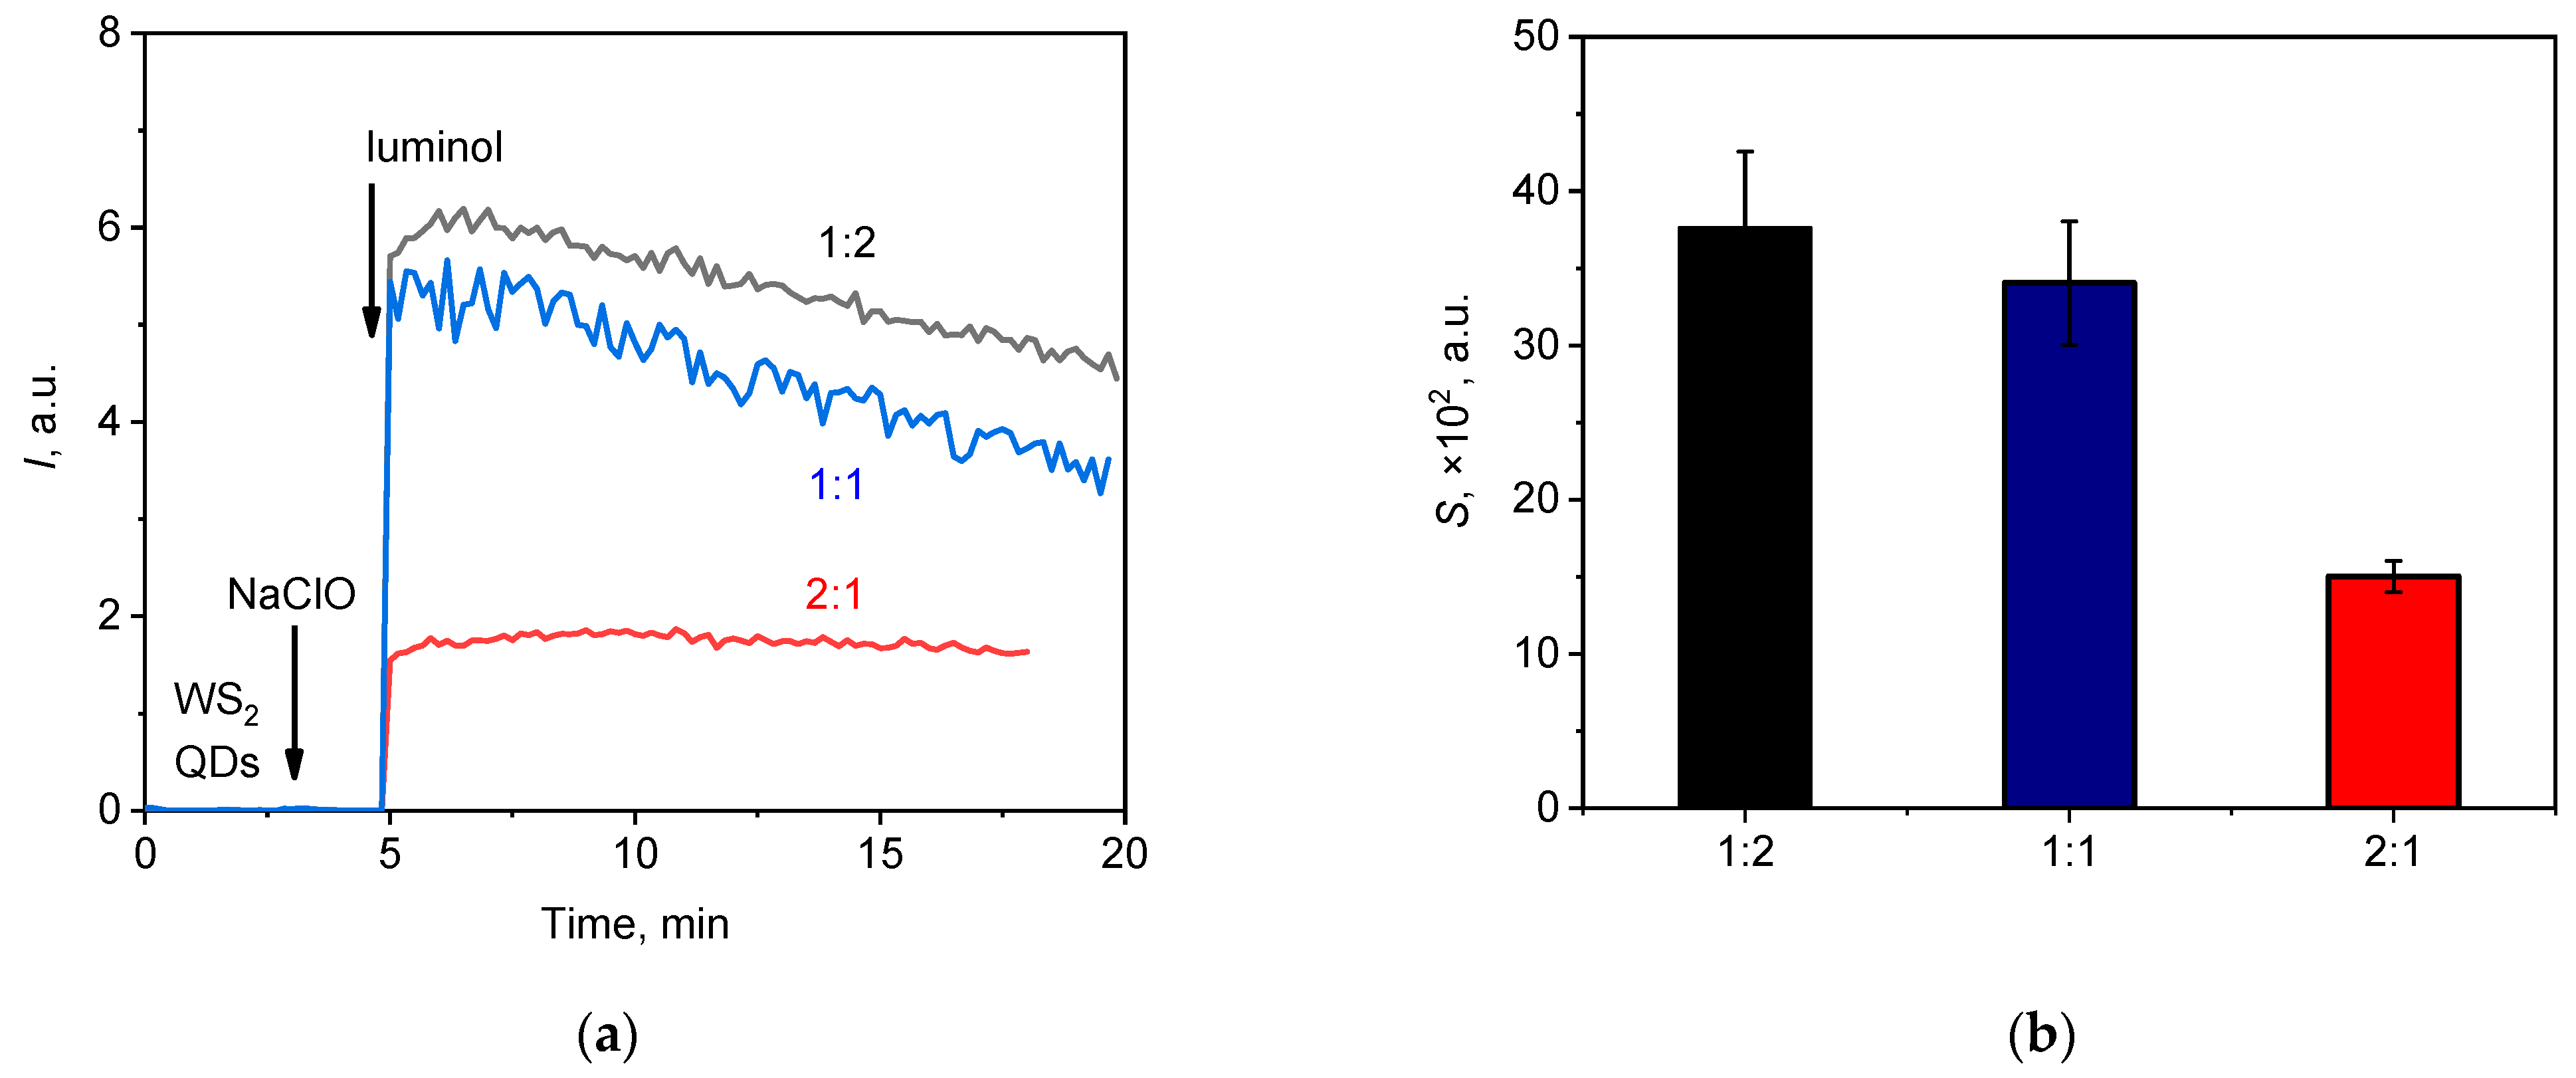
3.2.1. The Kinetic Profile of Chemiluminescence: Effects of Variables

When the sodium hypochlorite (NaClO) solution was mixed with luminol, a rapid chemical reaction occurred, accompanied by the emission of light (chemiluminescence). Figure 2a shows that the intensity of the light emission reached a maximum value within the first second after the mixing of the oxidising agent and the molecular probe. Fast chemiluminescent reactions are inconvenient for analytical applications, as a fast emission offers poor reproducibility. It is important to emphasise that this disadvantage limits the application of fast chemiluminescence analysis primarily in the field to environmental problems. In clinical studies, the analysis of fast chemiluminescence often serves as an essential tool for obtaining informative data. This is especially true for lipid peroxidation processes, which are integral to the development of various cell death mechanisms, including apoptosis, oxytosis, and ferroptosis.
On the other hand, the intensity of the chemiluminescent signal during the interaction between NaClO and bare WS2 QDs was too weak for analytical purposes (Figure 2b), but when WS2 QDs were used in conjunction with luminol, the chemiluminescence signal increased by a factor of 15 compared with that obtained with WS2 QDs alone. The profile of the chemiluminescent curve also changed dramatically (Figure 2c). After a rapid initial increase in intensity, the luminescent signal reached a nearly steady level, which was advantageous for analytical purposes. The area under the curve (lightsum, S) for a specific time period (e.g., 10 min) is proportional to the number of generated radicals, and this value can be used for the analysis [74].
An analysis of the order of the addition of reagents to the hypochlorite solution revealed that the most intense chemiluminescent emission was observed when luminol was added after the mixing of WS2 QDs and NaClO. In view of this, the optimal time was analysed for this preliminary mixing before the addition of luminol; the results of the corresponding experiments are presented in Figure 3.
Varying the duration of the pre-interaction of WS2 QDs with hypochlorite had no significant effect on the shape of the chemiluminescence kinetic curves (Figure 3a). Only minor differences were observed in the integral intensity of the light emission; the 15 min pre-interaction resulted in a lightsum increase of 15 ± 1%, as shown in Figure 3b. Such an increase may have been due to the more complete oxidation of WS2 with hypochlorite (see below) and some secondary chemical reactions in the mixture. To facilitate analysis in all subsequent experiments, a 2 min pre-interaction time was included for the reaction of WS2 QDs with hypochlorite.
As a two-component probe was used for the analysis of hypochlorite, an investigation of the impact of the concentration of each component of the probe on the chemiluminescent signal was carried out. Figure 4 shows the chemiluminograms of hypochlorite solutions upon the addition of WS2 QDs and luminol at various concentrations.
The effect of the concentration of WS2 QDs on chemiluminescence was found to be more complex than the effect of luminol concentration. Figure 4a shows the difference in chemiluminescence behaviour when the concentration of WS2 QDs is changed. In the low concentration range (0–15 µM) of WS2 QDs, the rapid chemiluminescence response can be attributed to the fact that a significant amount of hypochlorite is available for direct interaction with luminol, as observed in the NaClO–luminol system (Figure 2a).
As the concentration of WS2 QDs increases (20–140 µM), the system transitions to exhibit long-term and stable chemiluminescence. This switching indicates that the interaction between hypochlorite and WS2 QDs may promote the formation of less reactive ROS, thereby slowing down the rate of interaction with luminol compared to the direct NaClO–luminol reaction observed at lower concentrations of WS2 QDs.
Thus, the switching of chemiluminescent behaviour at different WS2 QD concentrations appear to be due to the relative availability of hypochlorite for interactions with luminol, which is significantly influenced by the presence of WS2 QDs and its ability to modulate the formation of ROS in the solution.
Interestingly, with an increase in the concentration of WS2 QDs up to 70 µM, the lightsum increased in a dose-dependent manner and then decreased. This effect is similar to the recently reported concentration-dependent behaviour of WS2 QDs in the presence of hypochlorite and H2O2 at pH 9.0 [44]. From Figure 4, it follows that an increase in the analytical signal (lightsum) occurs until the WS2 QD concentration reaches approx. 40 µM. Therefore, a working concentration of 40 µM for the WS2 QDs was selected for subsequent measurements. Conversely, an increase in luminol concentration resulted in an almost linear increase in lightsum values. The intensity of the signal alone is, however, not a single factor governing the applicability of an analytical technique. The shape of the chemiluminescent curve should also be taken into consideration. From an analytical perspective, a chemiluminogram that reaches a plateau (e.g., see Figure 4b) is preferable, since the integration of such a profile results in the linear dependence of a lightsum for the duration of the measurement.
To determine the optimal luminol concentration and the optimal WS2 QDs-to-luminol ratio, further measurements were conducted with the WS2 QD concentration fixed at 40 µM. Figure 5a presents the corresponding experimental data.
The results obtained indicate that the greatest integral luminescence intensity was registered when the ratio of WS2 QDs-to-luminol was 1:2 (Figure 5a), while the reproducibility of the data was significantly higher when the 2:1 ratio was used (Figure 5b). Moreover, in the latter case, the kinetic curve reached a constant value (a plateau). Therefore, the 2:1 WS2 QDs-to-luminol ratio and the luminol concentration of 20 µM were chosen as the optimal values for subsequent measurements. Thus, using a two-component probe comprising WS2 QDs and luminol, a highly reproducible analytical signal with satisfactory sensitivity could be obtained for the quantitative analysis of hypochlorite in a neutral aqueous medium.

3.2.2. The Possible Mechanism of Chemiluminescent Reactions Between NaClO and Luminol/WS2 QDs

In chemiluminescence analyses, either chemical or physical chemiluminescence enhancers can be applied; these have different mechanisms of action [15,75,76]. Semiconductor quantum dots are generally regarded as being physical enhancers [76,77,78]. Their chemiluminescence enhancement mechanism is based on the energy transfer from the product of the reaction (e.g., the product of oxidation by reactive oxygen species) to the quantum dot, which emits a photon. Such a mechanism is typical of the AIIBVI QD family, e.g., CdSe, CdTe, ZnS [79,80,81], etc. Conversely, WS2 QDs can act as both chemical and physical enhancers [44,45,82].
The data obtained show that the interaction between WS2 QDs, luminol, and hypochlorite proceeds in a manner different from that observed for the interaction of luminol and hypochlorite only. Considering the previously reported findings, in order to obtain a deeper insight into the chemical processes underlying chemiluminescence in the presence of WS2 QDs, additional experiments were conducted using sodium ascorbate [44,45]. This reagent was selected due to its ability to capture any radical species that may be involved in a chemiluminescent reaction. Chemiluminescence data recorded when sodium ascorbate was added to a mixture of NaClO, luminol, and WS2 QDs are presented in Figure 6a.
Figure 6 demonstrates that the addition of sodium ascorbate resulted in the quenching of chemiluminescence (Figure 6a) and that this effect was dose-dependent (Figure 6b). Such results suggest that the generation of the chemiluminescent signal was due to the presence of the reactive radical species. Note that the area above the chemiluminescence inhibition range linearly correlates with the amount of sodium ascorbate added (Figure 6b), which enables the use of the WS2 QDs/luminol two-component assay for the quantification of the radical scavenging property of various substances. For example, this assay can be of interest for the study of the antioxidant capacity of advanced organic antioxidants (e.g., resveratrol, glutathione, alpha-lipoic acid, etc.) or inorganic nanomaterials (nanozymes), which are regarded as being effective ROS regulators in living systems (e.g., CeO2, Au, etc.) [83,84,85,86,87,88,89].
Recently, the interaction of WS2 nanosheets with NaClO was thoroughly investigated and the following mechanism was proposed to explain the chemiluminescent signal from WS2 QDs [45]:
ClO/HClO + S2− → Cl + SO42−
ClO/HClO + W4+ → W6+ + 1O2 + •OH + Cl
ClO + •OH → •ClO + OH
ClO + OH → H+ + Cl + •O2
1O2 + 1O2 → (1O2)2*
(1O2)2* + WS2 → WS2* + 2O2
According to this mechanism, at the first stage of the interaction (1), the oxidation of S2− ions located at the edges of WS2 nanosheets by hypochlorite occurs, resulting in the formation of active W(IV) sites that become sterically available for further reactions. The interaction of these active sites with hypochlorite (2)–(5) generates reactive oxygen species, including singlet oxygen (1O2), hydroxyl radicals (•OH), and unstable intermediate dimers of singlet oxygen (1O2)2*. The excessive free energy of the dimer is transferred to WS2 nanosheets (6) to generate an excited electronic state in semiconducting WS2 nanosheets (6). Finally, WS2* returns to its ground state through the emission of light, which is detected as a chemiluminescent signal [45]. Thus, in a chemiluminescent analysis, WS2 plays a dual role of both a sacrificial chemical probe, which transforms RCS into ROS, and a physical chemiluminescent enhancer. According to recent studies, the interaction between WS2 and hypochlorite in the presence of hydrogen peroxide at pH 9.0 has a similar mechanism [44].
Based on the above, it can be hypothesised that at pH 7.4, the interaction between WS2 QDs and hypochlorite also proceeds through the formation of ROS. This process is accompanied by the emission of weak light from the WS2 QDs, as shown in Figure 2b. When luminol, which is directly and rapidly oxidised by radical species, is added to the mixture, the quantum yield of chemiluminescence significantly increases. The chemiluminescent signal can thus be used for analytical purposes, as demonstrated in Figure 2c. Based on these results and the mechanism discussed above, it can be concluded that when luminol is used as a luminescent probe in the chemiluminescent analysis of hypochlorite, WS2 QDs act as chemical activators, but their role as a physical chemiluminescence enhancer is almost negligible. This conclusion is supported by the tests conducted using a radical scavenger (sodium ascorbate), which inhibits the chemiluminescent reaction (Figure 6).

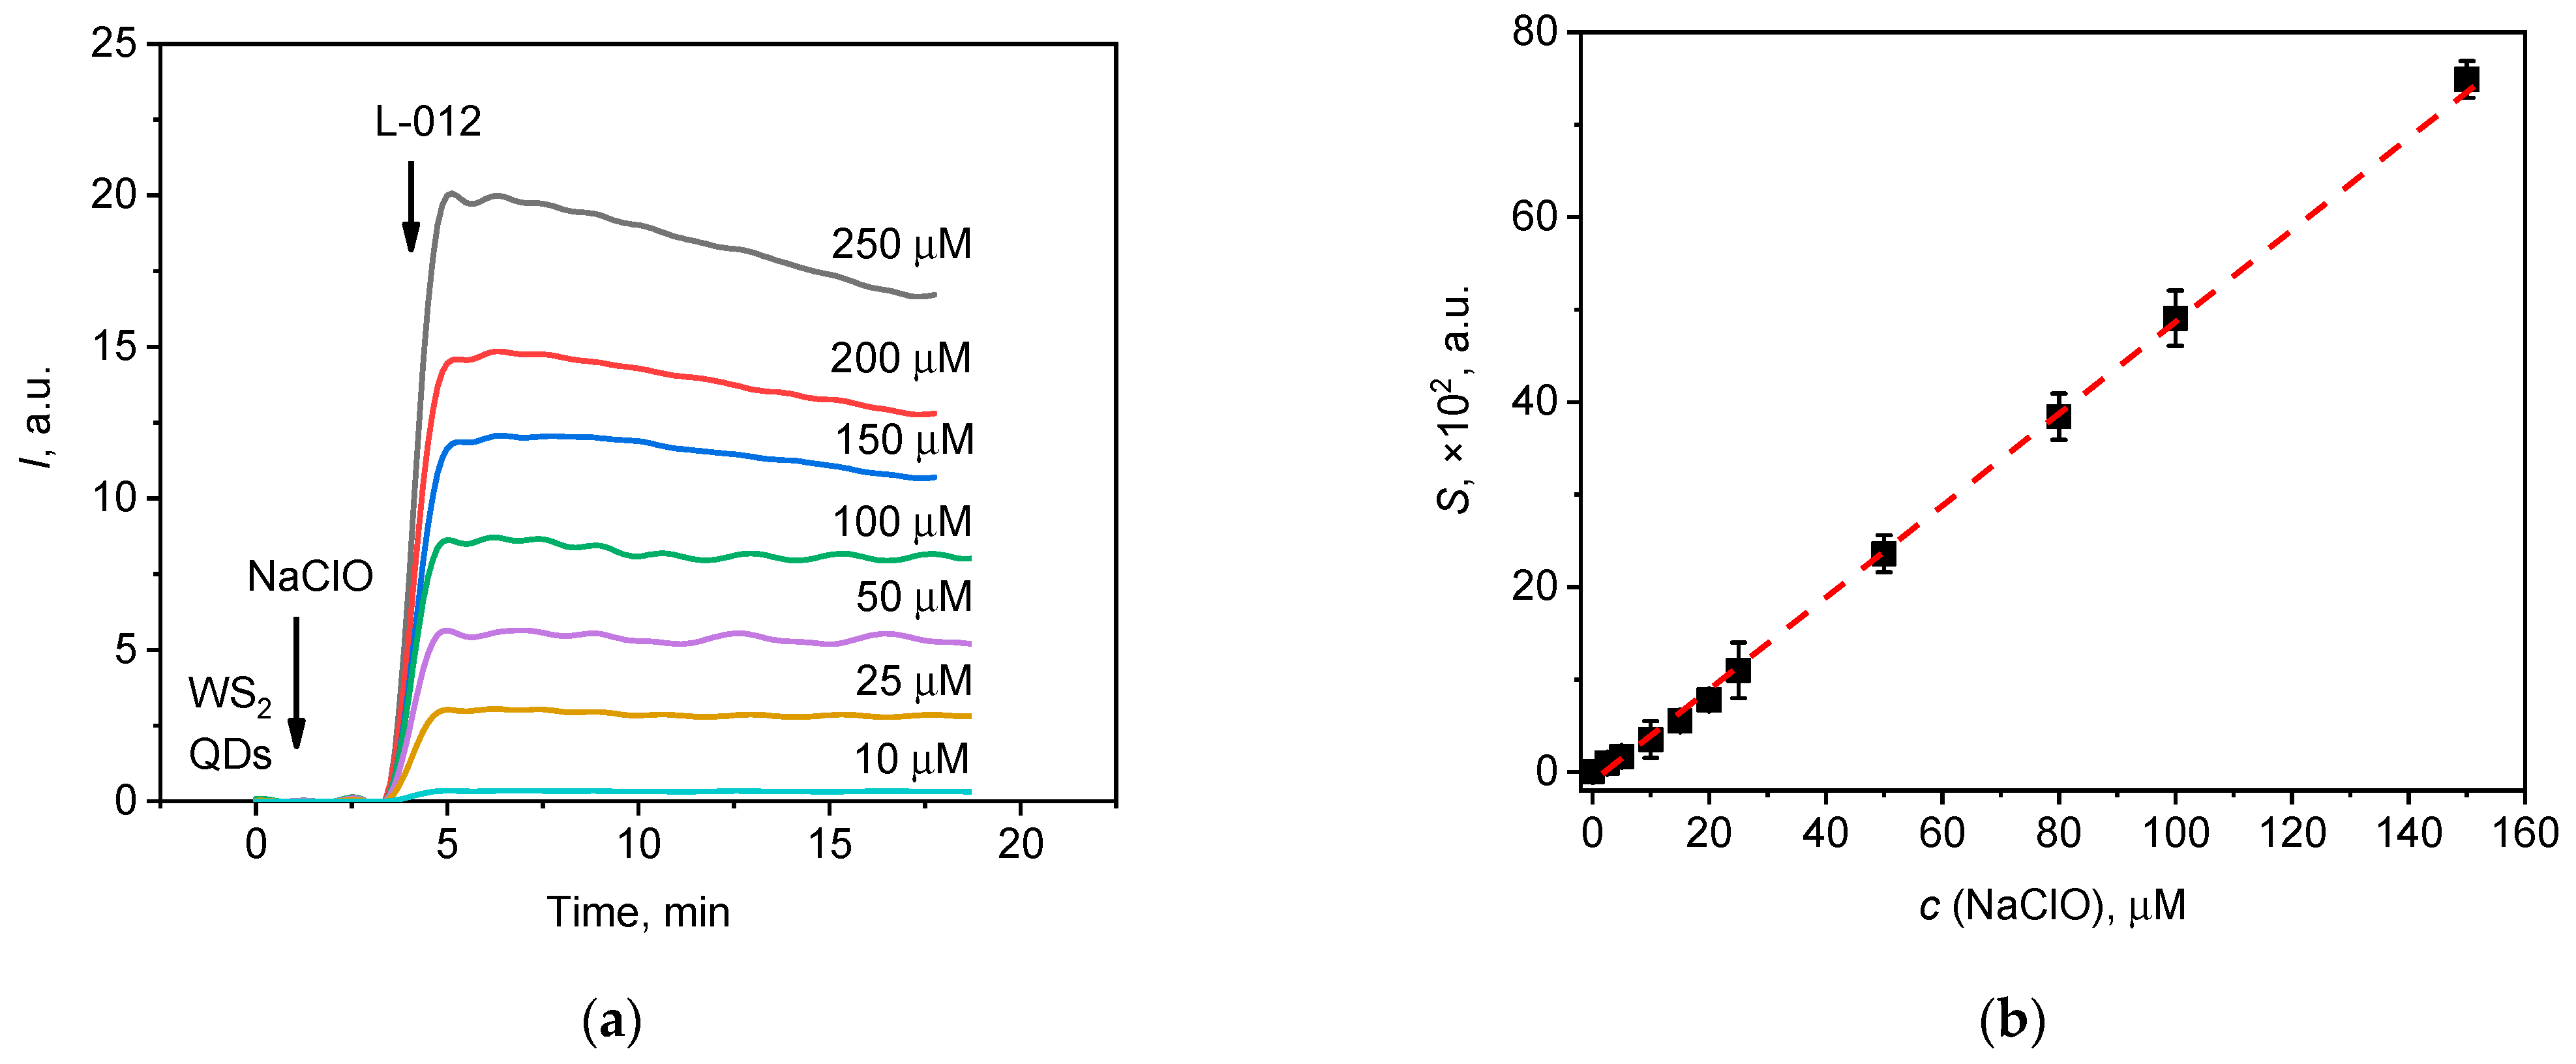
3.2.3. Analytical Performance of NaClO/WS2 QDs/Luminol and NaClO/WS2 QDs/L-012 Probes

After selecting the optimal experimental conditions for the registration of the chemiluminescence kinetic profile, the analytical performance of the probe was assessed. Chemiluminescence profiles for the solutions with various concentrations of hypochlorite, recorded in the presence of WS2 QDs and luminol, are presented in Figure 7. To assess the metrological properties of the method, the measurements were also carried out using a highly sensitive analogue of luminol, L-012 (Figure 7 and Figure 8).
An increase in sodium hypochlorite concentration resulted in an increase in chemiluminescence intensity up to a maximum value at a concentration of 1.80 mM. At higher concentrations, the signal was of lower intensity. The experimental relationship between the lightsum of the chemiluminescent reaction and the concentration of hypochlorite is plotted in Figure 7b; a linear relationship can be observed over a range of hypochlorite concentrations from 0.25 to 1.8 mM (Figure 7c). The lightsum value (S) was found to depend on hypochlorite concentration (c) according to the following equation:
S × 102 = (9.8 ± 0.2) × 103 × c(NaClO, M) − (1.7 ± 0.1), (r = 0.999, P = 0.95; n = 8)
From this fit, a detection limit for hypochlorite was calculated as 0.08 mM, according to the common 3σ criterion. Table 1 compares the analytical performance of the method based on the use of a two-component WS2 QDs/luminol probe with several other quantitative methods for hypochlorite determination.
The method proposed in the current work, which is based on the use of a WS2 QDs/luminol probe, enables hypochlorite quantification under neutral (physiological) conditions in a broad linear concentration range. It is applicable for determining high levels of hypochlorite (at millimolar levels), which is essential for biomedical research, as it enables the assessment of halogenative stress and the analysis of ClO in environmental water (such as seawater and surface waters).
To enhance the sensitivity of the method, a highly sensitive analogue of luminol, 8-amino-5-chloro-7-phenyl-pyrido[3,4-d]pyridazine-1,4(2H,3H)-dione (L-012 probe), was also tested as a luminescent probe [29,30,31]. The chemiluminescence kinetic curves for hypochlorite solutions with various concentrations, recorded in the presence of WS2 QDs and L-012, are presented in Figure 8a.
From Figure 8a, it follows that when using the L-012 probe, a dose-dependent increase in chemiluminescence was also observed with an increase in hypochlorite concentration. The shape of the kinetic curves suggests the intervention of a similar mechanism underlying chemiluminescence in the reaction mixtures comprising luminol (Figure 7a) and L-012 (Figure 8a). The lightsum value (S) was found to depend on the hypochlorite concentration (c) according to the following equation:
S × 102 = (0.50 ± 0.03) × 106 × c(NaClO, M) − (1.24 ± 0.06), (r = 0.999, P = 0.95, n = 10)
The linear range of the fit was between 2.5 × 10⁻⁶ M and 1.5 × 10⁻⁴ M (Figure 8b) with a 3σ detection limit of 2 × 10⁻⁶ M. The sensitivity of the L-012-dependent chemiluminescence test was approx. 40-fold greater than the sensitivity of the luminol-enhanced chemiluminescence test.
It should be noted that most of the reported methods for the determination of hypochlorite in drinking water are highly sensitive to pH [58,65,66,68,69]. The optimal pH values for the greatest sensitivity of the reported methods are generally in the range of 8–10. The use of WS2 QDs in conjunction with L-012 enables the determination of hypochlorite under neutral conditions, with a sensitivity that is higher than or equivalent to that of the other methods (see Table 1).

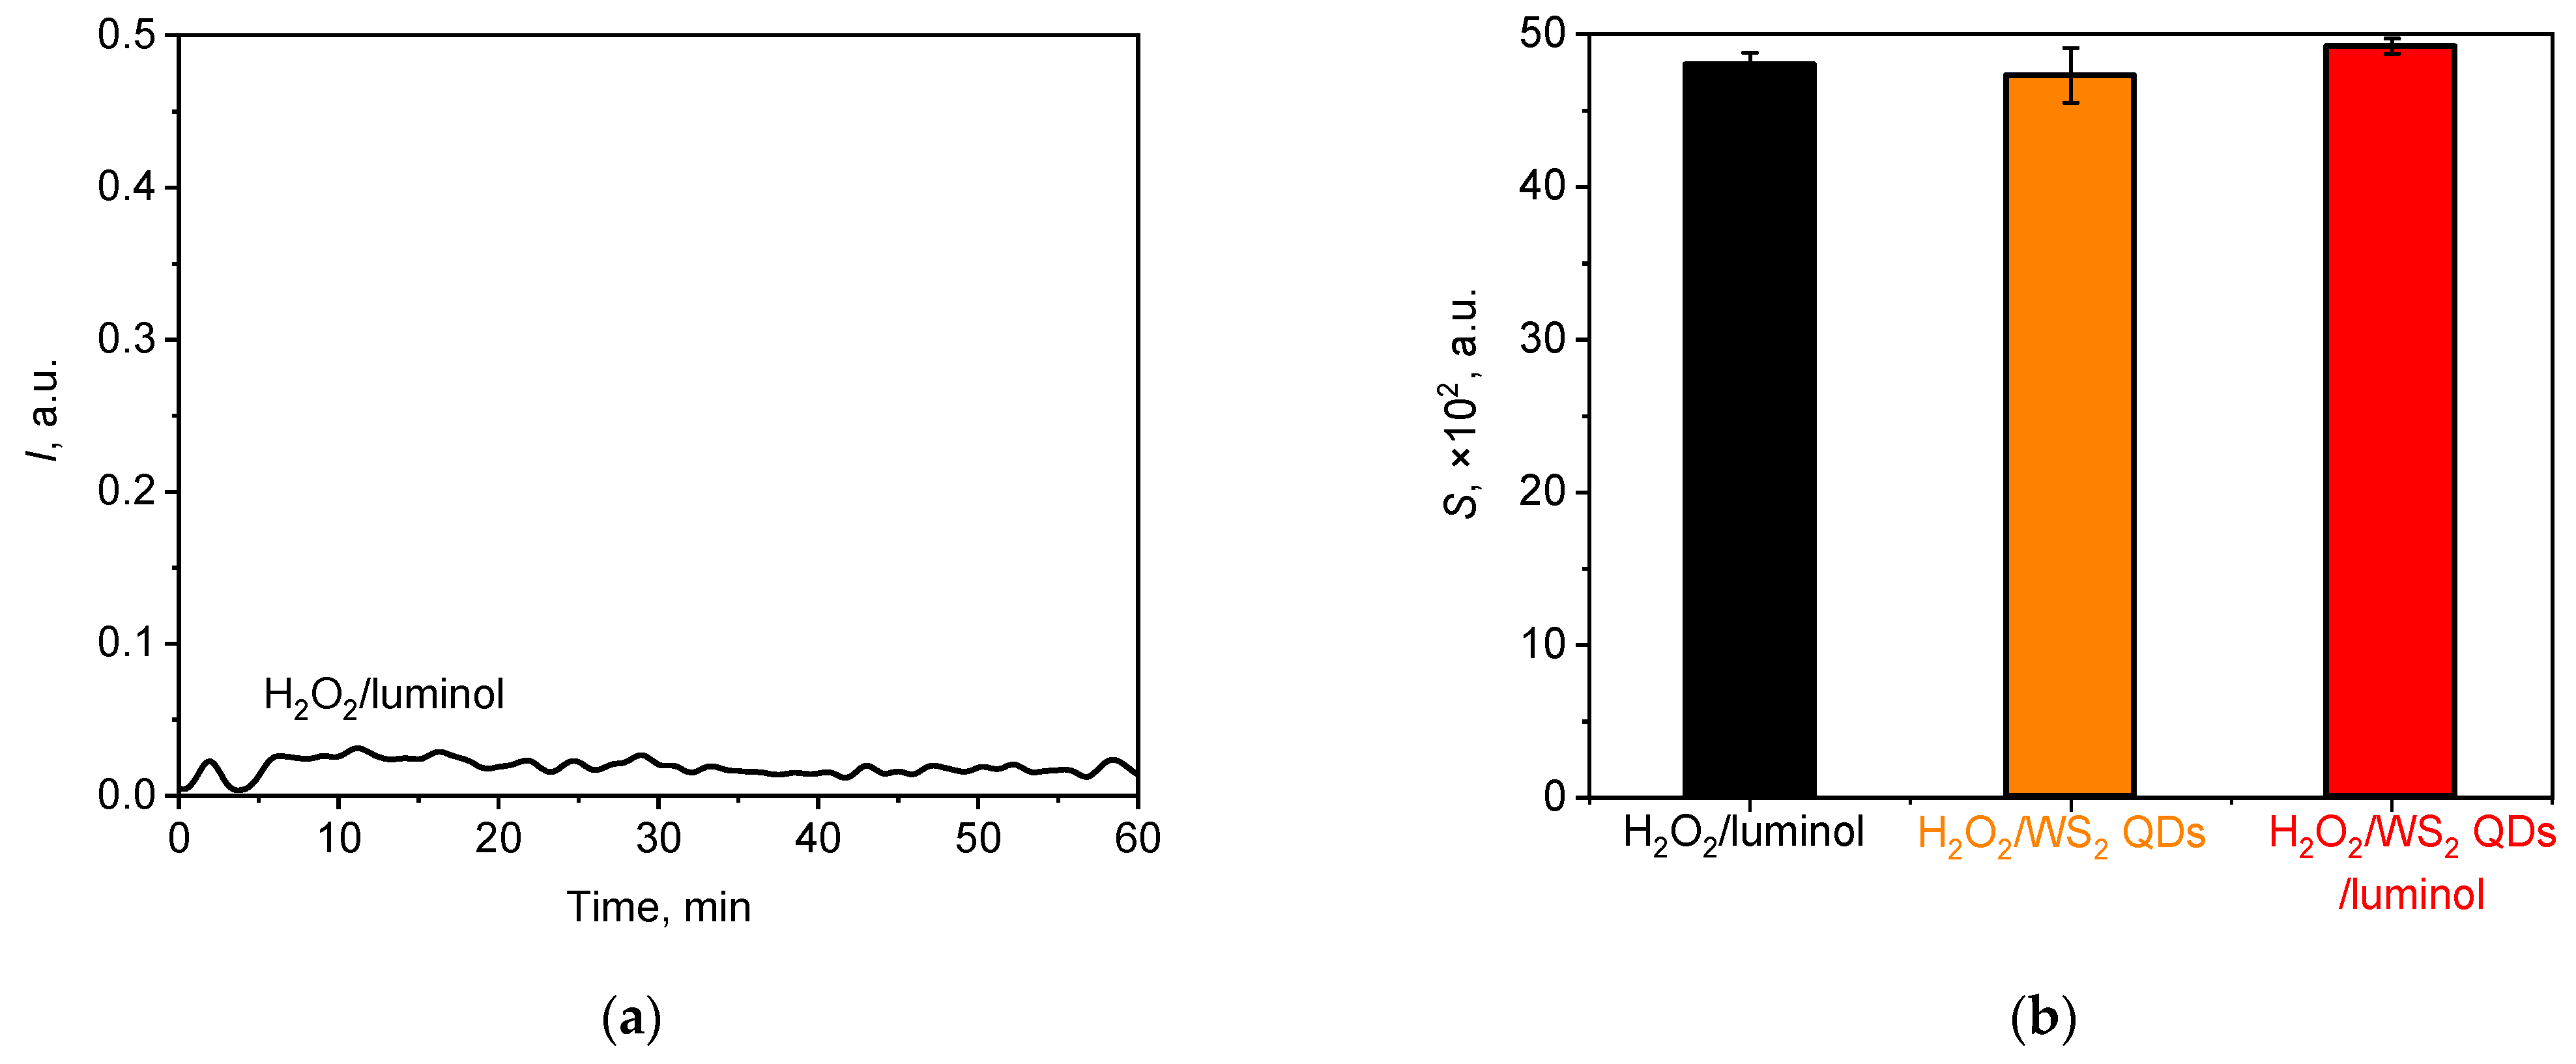
3.3. Analysis of the Interference of Hydrogen Peroxide

The main advantage of the use of luminol as a chemiluminescence probe is that the quantum efficiency of the reaction between hydrogen peroxide and luminol in an alkaline medium is close to one, thus yielding an intense light emission [27,91,92]. An increase in the absolute intensity of chemiluminescence during the interaction between H2O2 and luminol can occur in the presence of catalysts, e.g., metal ions with variable valence, particularly Fe(II) [93,94]. In view of this, to assess the selectivity of the proposed protocol, an investigation was conducted on the effect of the major interfering species, hydrogen peroxide, and this included when ferrous ions were present in the solution.

3.3.1. Hydrogen Peroxide

Figure 9a shows the kinetic profile of the chemiluminescent signal recorded during the reaction between H2O2 and luminol at a pH of 7.4.
From Figure 9, it follows that upon its addition to the hydrogen peroxide solution at pH 7.4, luminol yielded an extremely low-intensity chemiluminescent signal which was comparable with the background signal level. This can be attributed to the low quantum yield of the reaction under neutral conditions, as reported previously [27,91,92]. In contrast, a solution containing NaOCl/luminol exhibited a significantly higher luminol luminescence intensity at comparable concentrations (Figure 2a), with a difference in luminol intensity of approximately nine-fold between these two solutions. Figure 9b illustrates the lightsum values derived from chemiluminograms for the H2O2 solutions after the addition of bare luminol or WS2 QDs and their combination. The addition of WS2 QDs, either in the absence or presence of luminol, did not result in an enhancement of chemiluminescence, indicating that under neutral conditions at the selected concentrations, H2O2 is not capable of directly generating a chemiluminescence signal from WS2 QDs. This finding is consistent with recent reports and is likely to be due to the lower oxidising capacity of hydrogen peroxide compared with that of hypochlorite [44,95].

3.3.2. Hydrogen Peroxide in the Presence of Ferrous Ions

With references to chemistry, the co-existence of ferrous species and hypochlorite in aqueous solutions is very unlikely, as being a strong oxidant, hypochlorite readily oxidises Fe2+ ions, which is followed by the formation of readily sedimenting solid species, iron oxides, or hydroxides [96,97]. Nevertheless, an analysis was undertaken of the possible interference effect of the Fenton reaction, which is a standard source of hydroxyl radicals (•OH) [98,99,100], on the chemiluminescent signal in the presence of WS2 QDs. The kinetic profile obtained for the chemiluminescent signal from the H2O2/luminol/Fe(II) solution is presented in Figure 10.
Figure 10 shows that the chemiluminescent reaction between hydrogen peroxide and luminol occurred rapidly and that the intensity of luminescence reached its maximum within 5–10 s after the addition of a catalyst, i.e., ferrous ions. The addition of WS2 QDs instead of luminol did not enhance chemiluminescence, with the luminescence intensity remaining at background levels. When WS2 QDs were added simultaneously with luminol, however, the chemiluminescence in solutions containing H2O2 and Fe(II) species increased by approximately two-fold (Figure 10). This was presumably due to the excellent catalytic performance of transition metal dichalcogenides [36,37]. In particular, WS2 has demonstrated great potential for being used in AOP-based water purification technologies that involve the oxidation of impurities by hydroxyl radicals [6,7,8,45,101]. More specifically, it has been reported that WS2 has been used successfully to catalyse photo-assisted Fenton reactions [7]. In the same work, WS2 demonstrated a pronounced co-catalytic effect, which accelerated the reverse transformation of ferric to ferrous species and thus increased the efficiency of hydroxyl radical formation [7].
Therefore, for the analytical protocol under consideration, the interference effect of hydrogen peroxide together with ferrous species is presumably almost negligible, as the addition of WS2 to the solution containing hydrogen peroxide and ferrous ions will boost H2O2 decomposition through the co-catalysed Fenton process. The authors also expect negligible interference effects from ferric species present in aquatic environments [58,68]. However, the possible interference effects of other ROS or metal ions should be investigated to safeguard the successful implementation of the protocol.
Importantly, the countries in the Global South are confronted with the challenge of guaranteeing extensive access to clean water, particularly the states on the African continent. This is asserted in the pertinent sections of both the UN declarations, namely in the “Millennium Development Goals” and in the “Sustainable Development Goals”, as well as in certain sections of the African Union’s development strategies, specifically those outlined in “Agenda 2063: The Africa We Want”.
For the systemic development of access to clean water in Africa, the extensive application of the relevant technological issues is needed, as well as a strong partnership of the worldwide scientific community. For the first instance, Burkina Faso, Niger, Egypt, Sudan, Algeria, and Zimbabwe face significant challenges for the implementation of clean water-related innovations [102].

4. Conclusions

In this study, a new method was proposed for the quantitative analysis of hypochlorite in aqueous solutions. To detect hypochlorite, a two-component chemiluminescence probe was used; this comprised tungsten disulfide (WS2) quantum dots and luminol. The use of this two-component probe under neutral conditions ensured the specificity of the analysis and provided a wide linear dynamic range for the analytical signal. By replacing luminol with its highly sensitive analogue L-012, a sensitivity was achieved that is either better or comparable with other analytical methods for hypochlorite detection. The combined WS2 QD/luminol probe enabled the detection of hypochlorite at concentrations ranging from 2.5 × 10⁻⁴ M to 1.8 × 10⁻³ M with a detection limit of 8 × 10⁻⁵ M. The similar analytical parameters for the combined WS2 QD/L-012 probe were 2.5 × 10⁻⁶ M–1.5 × 10⁻⁴ M with 2 × 10⁻⁶ M, respectively. The proposed method can presumably be applied for analysing not only aquatic samples but also biological samples. Furthermore, the protocol can be used to analyse the radical-scavenging ability of various organic substances or even inorganic nanomaterials. Therefore, the findings of this research complement existing methods for analysing hypochlorite and expand the range of potential applications of WS2 QDs.

Author Contributions

Conceptualization, M.M.S., E.V.P. and A.K.B.; data curation, E.V.P.; investigation, M.M.S. and E.M.K.; methodology, M.M.S.; project administration, A.K.B., A.E.B. and V.K.I.; supervision, E.V.P., A.E.B. and V.K.I.; validation, M.M.S. and E.M.K.; writing—original draft, M.M.S.; writing—review and editing, M.M.S., E.V.P., A.E.B. and V.K.I. All authors have read and agreed to the published version of the manuscript.

Funding

The article was prepared within “The ‘Clean Water’ project as the most important component of cooperation between the Russian Federation and the countries of the Global South: socio-economic and technological dimensions”, which is supported by a grant from the Ministry of Science and Higher Education of the Russian Federation programme for research projects in priority areas of scientific and technological development (agreement 075-15-2024-546).

Data Availability Statement

Data is contained within the article.

Conflicts of Interest

Author Elena V. Proskurnina was employed by the company Research Centre for Medical Genetics. The remaining authors declare that the research was conducted in the absence of any commercial or financial relationships that could be construed as a potential conflict of interest.

References

  1. Dong, C.; Fang, W.; Yi, Q.; Zhang, J. A comprehensive review on reactive oxygen species (ROS) in advanced oxidation processes (AOPs). Chemosphere 2022, 308, 136205. [Google Scholar] [CrossRef]
  2. Wang, J.; Wang, S. Reactive species in advanced oxidation processes: Formation, identification and reaction mechanism. Chem. Eng. J. 2020, 401, 126158. [Google Scholar] [CrossRef]
  3. Zhu, L.; Luo, M.; Zhang, Y.; Fang, F.; Li, M.; An, F.; Zhao, D.; Zhang, J. Free radical as a double-edged sword in disease: Deriving strategic opportunities for nanotherapeutics. Coord. Chem. Rev. 2023, 475, 214875. [Google Scholar] [CrossRef]
  4. Miklos, D.B.; Remy, C.; Jekel, M.; Linden, K.G.; Drewes, J.E.; Hübner, U. Evaluation of advanced oxidation processes for water and wastewater treatment—A critical review. Water Res. 2018, 139, 118–131. [Google Scholar] [CrossRef] [PubMed]
  5. Cuerda-Correa, E.M.; Alexandre-Franco, M.F.; Fernández-González, C. Advanced oxidation processes for the removal of antibiotics from water. An overview. Water 2019, 12, 102. [Google Scholar] [CrossRef]
  6. Dong, H.; Chen, J.; Feng, L.; Zhang, W.; Guan, X.; Strathmann, T.J. Degradation of organic contaminants through activating bisulfite by cerium (IV): A sulfate radical-predominant oxidation process. Chem. Eng. J. 2019, 357, 328–336. [Google Scholar] [CrossRef]
  7. Dong, C.; Ji, J.; Shen, B.; Xing, M.; Zhang, J. Enhancement of H2O2 decomposition by the co-catalytic effect of WS2 on the Fenton reaction for the synchronous reduction of Cr(VI) and remediation of phenol. Environ. Sci. Technol. 2018, 52, 11297–11308. [Google Scholar] [CrossRef]
  8. Zhu, L.; Ji, J.; Liu, J.; Mine, S.; Matsuoka, M.; Zhang, J.; Xing, M. Designing 3D-MoS2 sponge as excellent cocatalysts in advanced oxidation processes for pollutant control. Angew. Chem. 2020, 132, 14072–14080. [Google Scholar] [CrossRef]
  9. Abramov, V.O.; Abramova, A.V.; Cravotto, G.; Nikonov, R.V.; Fedulov, I.S.; Ivanov, V.K. Flow-mode water treatment under simultaneous hydrodynamic cavitation and plasma. Ultrason. Sonochem. 2021, 70, 105323. [Google Scholar] [CrossRef]
  10. Halliwell, B.; Gutteridge, J.M. Free Radicals in Biology and Medicine; Oxford University Press: New York, NY, USA, 2015. [Google Scholar]
  11. Liou, G.-Y.; Storz, P. Reactive oxygen species in cancer. Free Radic. Res. 2010, 44, 479–496. [Google Scholar] [CrossRef]
  12. Martinez, M.C.; Andriantsitohaina, R. Reactive nitrogen species: Molecular mechanisms and potential significance in health and disease. Antioxid. Redox Signal. 2009, 11, 669–702. [Google Scholar] [CrossRef] [PubMed]
  13. Yin, H.; Xu, L.; Porter, N.A. Free radical lipid peroxidation: Mechanisms and analysis. Chem. Rev. 2011, 111, 5944–5972. [Google Scholar] [CrossRef] [PubMed]
  14. Vladimirov, Y.A.; Proskurnina, E.V.; Izmajlov, D.Y. Kinetic chemiluminescence as a method for study of free radical reactions. Biophysics 2011, 56, 1055–1062. [Google Scholar] [CrossRef]
  15. Vladimirov, Y.A.; Proskurnina, E.V. Free radicals and cell chemiluminescence. Biochemistry 2009, 74, 1545–1566. [Google Scholar] [CrossRef]
  16. Halliwell, B. Oxygen and nitrogen are pro-carcinogens. Damage to DNA by reactive oxygen, chlorine and nitrogen species: Measurement, mechanism and the effects of nutrition. Mutat. Res. Genet. Toxicol. Environ. Mutagen. 1999, 443, 37–52. [Google Scholar] [CrossRef]
  17. Jomova, K.; Raptova, R.; Alomar, S.Y.; Alwasel, S.H.; Nepovimova, E.; Kuca, K.; Valko, M. Reactive oxygen species, toxicity, oxidative stress, and antioxidants: Chronic diseases and aging. Arch. Toxicol. 2023, 97, 2499–2574. [Google Scholar]
  18. Zhao, Z. Iron and oxidizing species in oxidative stress and Alzheimer’s disease. Aging Med. 2019, 2, 82–87. [Google Scholar] [CrossRef]
  19. Irazabal, M.V.; Torres, V.E. Reactive oxygen species and redox signaling in chronic kidney disease. Cells 2020, 9, 1342. [Google Scholar] [CrossRef] [PubMed]
  20. Forman, H.J.; Zhang, H. Targeting oxidative stress in disease: Promise and limitations of antioxidant therapy. Nat. Rev. Drug Discov. 2021, 20, 689–709. [Google Scholar] [CrossRef]
  21. Di Meo, S.; Venditti, P. Evolution of the knowledge of free radicals and other oxidants. Oxid. Med. Cell. Longev. 2020, 2020, 9829176. [Google Scholar] [CrossRef]
  22. Ma, L.; Sun, S.; Wang, Y.; Jiang, K.; Zhu, J.; Li, J.; Lin, H. A graphene quantum dot-based fluorescent nanoprobe for hypochlorite detection in water and in living cells. Microchim. Acta 2017, 184, 3833–3840. [Google Scholar] [CrossRef]
  23. Zhang, Y.; Dai, M.; Yuan, Z. Methods for the detection of reactive oxygen species. Anal. Methods 2018, 10, 4625–4638. [Google Scholar] [CrossRef]
  24. Dikalov, S.I.; Harrison, D.G. Methods for detection of mitochondrial and cellular reactive oxygen species. Antioxid. Redox Signal. 2014, 20, 372–382. [Google Scholar] [CrossRef] [PubMed]
  25. Kobayashi, H.; Gil-Guzman, E.; Mahran, A.M.; Sharma, R.K.; Nelson, D.R.; Agarwa, A. Quality control of reactive oxygen species measurement by luminol-dependent chemiluminescence assay. J. Androl. 2001, 22, 568–574. [Google Scholar] [CrossRef] [PubMed]
  26. Yamaguchi, S.; Kishikawa, N.; Ohyama, K.; Ohba, Y.; Kohno, M.; Masuda, T.; Takadate, A.; Nakashima, K.; Kuroda, N. Evaluation of chemiluminescence reagents for selective detection of reactive oxygen species. Anal. Chim. Acta 2010, 665, 74–78. [Google Scholar] [CrossRef] [PubMed]
  27. Khan, P.; Idrees, D.; Moxley, M.A.; Corbett, J.A.; Ahmad, F.; von Figura, G.; Sly, W.S.; Waheed, A.; Hassan, M.I. Luminol-based chemiluminescent signals: Clinical and non-clinical application and future uses. Appl. Biochem. Biotechnol. 2014, 173, 333–355. [Google Scholar] [CrossRef]
  28. Marquette, C.A.; Blum, L.J. Applications of the luminol chemiluminescent reaction in analytical chemistry. Anal. Bioanal. Chem. 2006, 385, 546–554. [Google Scholar] [CrossRef]
  29. Zhang, W.; Hao, L.; Huang, J.; Xia, L.; Cui, M.; Zhang, X.; Gu, Y.; Wang, P. Chemiluminescence chitosan hydrogels based on the luminol analog L-012 for highly sensitive detection of ROS. Talanta 2019, 201, 455–459. [Google Scholar] [CrossRef]
  30. Daiber, A.; August, M.; Baldus, S.; Wendt, M.; Oelze, M.; Sydow, K.; Kleschyov, A.L.; Munzel, T. Measurement of NAD(P)H oxidase-derived superoxide with the luminol analogue L-012. Free Radic. Biol. Med. 2004, 36, 101–111. [Google Scholar] [CrossRef]
  31. Zielonka, J.; Lambeth, J.D.; Kalyanaraman, B. On the use of L-012, a luminol-based chemiluminescent probe, for detecting superoxide and identifying inhibitors of NADPH oxidase: A reevaluation. Free Radic. Biol. Med. 2013, 65, 1310–1314. [Google Scholar] [CrossRef]
  32. Chang, T.; Wu, L. Methylglyoxal, oxidative stress, and hypertension. Can. J. Physiol. Pharmacol. 2006, 84, 1229–1238. [Google Scholar] [CrossRef] [PubMed]
  33. Guerrini, L.; Aliaga, A.; Carcamo, J.; Gómez-Jeria, J.S.; Sanchez-Cortes, S.; Campos-Vallette, M.; Garcia-Ramos, J. Functionalization of Ag nanoparticles with the bis-acridinium lucigenin as a chemical assembler in the detection of persistent organic pollutants by surface-enhanced Raman scattering. Anal. Chim. Acta 2008, 624, 286–293. [Google Scholar] [CrossRef] [PubMed]
  34. Yan, Y.; Wang, X.-y.; Hai, X.; Song, W.; Ding, C.; Cao, J.; Bi, S. Chemiluminescence resonance energy transfer: From mechanisms to analytical applications. TrAC Trends Anal. Chem. 2020, 123, 115755. [Google Scholar] [CrossRef]
  35. Bera, D.; Qian, L.; Tseng, T.-K.; Holloway, P.H. Quantum dots and their multimodal applications: A review. Materials 2010, 3, 2260–2345. [Google Scholar] [CrossRef]
  36. Chowdhury, T.; Sadler, E.C.; Kempa, T.J. Progress and prospects in transition-metal dichalcogenide research beyond 2D. Chem. Rev. 2020, 120, 12563–12591. [Google Scholar] [CrossRef]
  37. Wang, X.; Zhang, Y.; Wu, J.; Zhang, Z.; Liao, Q.; Kang, Z.; Zhang, Y. Single-atom engineering to ignite 2D transition metal dichalcogenide based catalysis: Fundamentals, progress, and beyond. Chem. Rev. 2021, 122, 1273–1348. [Google Scholar] [CrossRef]
  38. Niknam, S.; Dehdast, S.A.; Pourdakan, O.; Shabani, M.; Koohi, M.K. Tungsten disulfide nanomaterials (WS2 NM) application in biosensors and nanomedicine: A review. Nanomed. Res. J. 2022, 7, 214–226. [Google Scholar]
  39. Ding, J.; Feng, A.; Li, X.; Ding, S.; Liu, L.; Ren, W. Properties, preparation, and application of tungsten disulfide: A review. J. Phys. D Appl. Phys. 2021, 54, 173002. [Google Scholar] [CrossRef]
  40. Yong, Y.; Cheng, X.; Bao, T.; Zu, M.; Yan, L.; Yin, W.; Ge, C.; Wang, D.; Gu, Z.; Zhao, Y. Tungsten sulfide quantum dots as multifunctional nanotheranostics for in vivo dual-modal image-guided photothermal/radiotherapy synergistic therapy. ACS Nano 2015, 9, 12451–12463. [Google Scholar] [CrossRef]
  41. He, Z.; Sheng, Y.; Rong, Y.; Lee, G.-D.; Li, J.; Warner, J.H. Layer-dependent modulation of tungsten disulfide photoluminescence by lateral electric fields. ACS Nano 2015, 9, 2740–2748. [Google Scholar] [CrossRef]
  42. Yan, Z.; Poh, E.T.; Zhang, Z.; Chua, S.T.; Wang, X.; Wu, X.; Chen, Z.; Yang, J.; Xu, Q.-H.; Goh, K.E.J. Band Nesting Bypass in WS2 Monolayers via Forster Resonance Energy Transfer. ACS Nano 2020, 14, 5946–5955. [Google Scholar] [CrossRef] [PubMed]
  43. Zhao, J.; Jin, X.; Vdovenko, M.; Zhang, L.; Sakharov, I.Y.; Zhao, S. A WS2 nanosheet based chemiluminescence resonance energy transfer platform for sensing biomolecules. Chem. Commun. 2015, 51, 11092–11095. [Google Scholar] [CrossRef] [PubMed]
  44. Sun, T.; Su, Y.; Sun, M.; Lv, Y. Homologous chemiluminescence resonance energy transfer on the interface of WS2 quantum dots for monitoring photocatalytic H2O2 evaluation. Microchem. J. 2021, 168, 106344. [Google Scholar] [CrossRef]
  45. Sun, T.; Su, Y.; Song, H.; Lv, Y. New advanced oxidation progress with chemiluminescence behavior based on NaClO triggered by WS2 nanosheets. J. Hazard. Mater. 2022, 429, 128329. [Google Scholar] [CrossRef] [PubMed]
  46. Ulfig, A.; Leichert, L.I. The effects of neutrophil-generated hypochlorous acid and other hypohalous acids on host and pathogens. Cell. Mol. Life Sci. 2021, 78, 385–414. [Google Scholar] [CrossRef]
  47. Winterbourn, C.C.; Kettle, A.J. Biomarkers of myeloperoxidase-derived hypochlorous acid. Free Radic. Biol. Med. 2000, 29, 403–409. [Google Scholar] [CrossRef]
  48. Winterbourn, C.C.; Kettle, A.J.; Hampton, M.B. Reactive oxygen species and neutrophil function. Annu. Rev. Biochem. 2016, 85, 765–792. [Google Scholar] [CrossRef]
  49. Spickett, C.; Jerlich, A.; Panasenko, O.; Arnhold, J.; Pitt, A.; Stelmaszyńska, T.; Schaur, R. The reactions of hypochlorous acid, the reactive oxygen species produced by myeloperoxidase, with lipids. Acta Biochim. Pol. 2000, 47, 889–899. [Google Scholar] [CrossRef]
  50. Winterbourn, C.C.; Vissers, M.C.; Kettle, A.J. Myeloperoxidase. Curr. Opin. Hematol. 2000, 7, 53–58. [Google Scholar] [CrossRef]
  51. Khor, Y.; Chong, S.S.; Raman, A.A.A. Recent developments and sustainability in monitoring chlorine residuals for water quality control: A critical review. RSC Sustain. 2024, 2, 2468–2485. [Google Scholar] [CrossRef]
  52. Cheng, X.; Wang, S.; Huang, W.; Wang, F.; Fang, S.; Ge, R.; Zhang, Q.; Zhang, L.; Du, W.; Fang, F. Current status of hypochlorite technology on the wastewater treatment and sludge disposal: Performance, principals and prospects. Sci. Total Environ. 2022, 803, 150085. [Google Scholar] [CrossRef] [PubMed]
  53. Song, Z.-G.; Yuan, Q.; Lv, P.; Chen, K. Research progress of small molecule fluorescent probes for detecting hypochlorite. Sensors 2021, 21, 6326. [Google Scholar] [CrossRef]
  54. Guo, Y.; Ma, Q.; Cao, F.; Zhao, Q.; Ji, X. Colorimetric detection of hypochlorite in tap water based on the oxidation of 3, 3′, 5, 5′-tetramethyl benzidine. Anal. Methods 2015, 7, 4055–4058. [Google Scholar] [CrossRef]
  55. How, Z.T.; Linge, K.L.; Busetti, F.; Joll, C.A. Organic chloramines in drinking water: An assessment of formation, stability, reactivity and risk. Water Res. 2016, 93, 65–73. [Google Scholar] [CrossRef] [PubMed]
  56. Zhang, J.; Wang, X.; Yang, X. Colorimetric determination of hypochlorite with unmodified gold nanoparticles through the oxidation of a stabilizer thiol compound. Analyst 2012, 137, 2806–2812. [Google Scholar] [CrossRef] [PubMed]
  57. Senthilkumar, K.; Zen, J.-M. Free chlorine detection based on EC’mechanism at an electroactive polymelamine-modified electrode. Electrochem. Commun. 2014, 46, 87–90. [Google Scholar] [CrossRef]
  58. Hallaj, T.; Amjadi, M.; Manzoori, J.L.; Shokri, R. Chemiluminescence reaction of glucose-derived graphene quantum dots with hypochlorite, and its application to the determination of free chlorine. Microchim. Acta 2015, 182, 789–796. [Google Scholar] [CrossRef]
  59. Ding, Y.; Ling, J.; Cai, J.; Wang, S.; Li, X.; Yang, M.; Zha, L.; Yan, J. A carbon dot-based hybrid fluorescent sensor for detecting free chlorine in water medium. Anal. Methods 2016, 8, 1157–1161. [Google Scholar] [CrossRef]
  60. Ashton, T.D.; Jolliffe, K.A.; Pfeffer, F.M. Luminescent probes for the bioimaging of small anionic species in vitro and in vivo. Chem. Soc. Rev. 2015, 44, 4547–4595. [Google Scholar] [CrossRef]
  61. Gadgil, A. Drinking water in developing countries. Annu. Rev. Energy 1998, 23, 253–286. [Google Scholar] [CrossRef]
  62. Montgomery, M.A.; Elimelech, M. Water and sanitation in developing countries: Including health in the equation. Environ. Sci. Technol. 2007, 41, 17–24. [Google Scholar] [CrossRef] [PubMed]
  63. Arnold, B.F.; Colford Jr, J.M. Treating water with chlorine at point-of-use to improve water quality and reduce child diarrhea in developing countries: A systematic review and meta-analysis. Am. J. Trop. Med. Hyg. 2007, 76, 354–364. [Google Scholar] [CrossRef]
  64. Sobsey, M.; Handzel, T.; Venczel, L. Chlorination and safe storage of household drinking water in developing countries to reduce waterborne disease. Water Sci. Technol. 2003, 47, 221–228. [Google Scholar] [CrossRef] [PubMed]
  65. Szili, M.; Kasik, I.; Matejec, V.; Nagy, G.; Kovacs, B. Poly (luminol) based sensor array for determination of dissolved chlorine in water. Sens. Actuators B Chem. 2014, 192, 92–98. [Google Scholar] [CrossRef]
  66. Irons, G.P.; Greenway, G.M. Investigation into the detection of chlorine species by Rhodamine 6G chemiluminescence with electrochemical modification. Analyst 1995, 120, 477–483. [Google Scholar] [CrossRef]
  67. Claver, J.B.; Mirón, M.V.; Capitán-Vallvey, L. Determination of hypochlorite in water using a chemiluminescent test strip. Anal. Chim. Acta 2004, 522, 267–273. [Google Scholar] [CrossRef]
  68. Ishimaru, N.; Lin, J.-M.; Yamada, M. Luminol-free chlorine chemiluminescence in an oil-in-water microemulsion medium. Anal. Commun. 1998, 35, 67–69. [Google Scholar] [CrossRef]
  69. Nakamura, M.M.; Coichev, N.; Lin, J.-M.; Yamada, M. Flow-injection investigation of the chemiluminescent reaction of bis (2, 4, 6-(trichlorophenyl) oxalate) with free chlorine. Anal. Chim. Acta 2003, 484, 101–109. [Google Scholar] [CrossRef]
  70. Francis, P.S.; Barnett, N.W.; Lewis, S.W.; Lim, K.F. Hypohalites and related oxidants as chemiluminescence reagents: A review. Luminescence 2004, 19, 94–115. [Google Scholar] [CrossRef]
  71. Sozarukova, M.M.; Proskurnina, E.V.; Ivanov, V.K. Prooxidant potential of CeO2 nanoparticles towards hydrogen peroxide. Nanosyst. Phys. Chem. Math. 2021, 12, 283–290. [Google Scholar] [CrossRef]
  72. Irani-nezhad, M.H.; Khataee, A.; Hassanzadeh, J.; Orooji, Y. A chemiluminescent method for the detection of H2O2 and glucose based on intrinsic peroxidase-like activity of WS2 quantum dots. Molecules 2019, 24, 689. [Google Scholar] [CrossRef] [PubMed]
  73. Duan, X.; Liu, Q.; Su, X. Fluorometric determination of the activity of alkaline phosphatase based on a system composed of WS2 quantum dots and MnO2 nanosheets. Microchim. Acta 2019, 186, 839. [Google Scholar] [CrossRef] [PubMed]
  74. Proskurnina, E.V.; Izmailov, D.Y.; Sozarukova, M.M.; Zhuravleva, T.A.; Leneva, I.A.; Poromov, A.A. Antioxidant potential of antiviral drug umifenovir. Molecules 2020, 25, 1577. [Google Scholar] [CrossRef] [PubMed]
  75. Chen, G.; Jin, M.; Du, P.; Zhang, C.; Cui, X.; Zhang, Y.; Wang, J.; Jin, F.; She, Y.; Shao, H. A review of enhancers for chemiluminescence enzyme immunoassay. Food Agr. Immunol. 2017, 28, 315–327. [Google Scholar] [CrossRef]
  76. Kaczmarek, M. Types of enhancers of chemiluminescent reaction systems in the liquid phase. Recent advances, perspectives, mechanisms and analytical application; a review. J. Lumin. 2024, 275, 120800. [Google Scholar] [CrossRef]
  77. Kandi, D.; Martha, S.; Parida, K. Quantum dots as enhancer in photocatalytic hydrogen evolution: A review. Int. J. Hydrogen Energy 2017, 42, 9467–9481. [Google Scholar] [CrossRef]
  78. Chen, H.; Lin, L.; Li, H.; Lin, J.-M. Quantum dots-enhanced chemiluminescence: Mechanism and application. Coord. Chem. Rev. 2014, 263, 86–100. [Google Scholar] [CrossRef]
  79. Vahid, B.; Hassanzadeh, J.; Khodakarami, B. CdSe quantum dots-sensitized chemiluminescence system and quenching effect of gold nanoclusters for cyanide detection. Spectrochim. Acta A Mol. Biomol. Spectrosc. 2019, 212, 322–329. [Google Scholar] [CrossRef] [PubMed]
  80. Li, Z.; Wang, Y.; Zhang, G.; Xu, W.; Han, Y. Chemiluminescence resonance energy transfer in the luminol–CdTe quantum dots conjugates. J. Lumin. 2010, 130, 995–999. [Google Scholar] [CrossRef]
  81. Shah, S.N.A.; Zheng, Y.; Li, H.; Lin, J.-M. Chemiluminescence character of ZnS quantum dots with bisulphite-hydrogen peroxide system in acidic medium. J. Phys. Chem. C 2016, 120, 9308–9316. [Google Scholar] [CrossRef]
  82. Zou, C.; Chen, M.; Luo, X.; Zhou, H.; Yu, T.; Yuan, C. Enhanced photoluminescence of WS2/WO3 heterostructural QDs. J. Alloys Compd. 2020, 834, 155066. [Google Scholar] [CrossRef]
  83. Ren, B.; Kwah, M.X.-Y.; Liu, C.; Ma, Z.; Shanmugam, M.K.; Ding, L.; Xiang, X.; Ho, P.C.-L.; Wang, L.; Ong, P.S. Resveratrol for cancer therapy: Challenges and future perspectives. Cancer Lett. 2021, 515, 63–72. [Google Scholar] [CrossRef] [PubMed]
  84. Averill-Bates, D.A. The antioxidant glutathione. In Vitamins and Hormones; Elsevier: Amsterdam, The Netherlands, 2023; Volume 121, pp. 109–141. [Google Scholar]
  85. Tripathi, A.K.; Ray, A.K.; Mishra, S.K.; Bishen, S.M.; Mishra, H.; Khurana, A. Molecular and therapeutic insights of alpha-lipoic acid as a potential molecule for disease prevention. Rev. Bras. Farmacogn. 2023, 33, 272–287. [Google Scholar] [CrossRef] [PubMed]
  86. Ivanov, V.K.; Polezhaeva, O.S.; Tret’yakov, Y.D. Nanocrystalline ceria: Synthesis, structure-sensitive properties, and promising applications. Russ. J. Gen. Chem. 2010, 80, 604–617. [Google Scholar] [CrossRef]
  87. Zholobak, N.M.; Ivanov, V.K.; Shcherbakov, A.B. Interaction of nanoceria with microorganisms. In Nanobiomaterials in Antimicrobial Therapy; Elsevier: Amsterdam, The Netherlands, 2016; pp. 419–450. [Google Scholar]
  88. Ou, X.; Karmakar, B.; Awwad, N.S.; Ibrahium, H.A.; Osman, H.-E.H.; El-Kott, A.F.; Abdel-Daim, M.M. Au nanoparticles adorned chitosan-modified magnetic nanocomposite: An investigation towards its antioxidant and anti-hepatocarcinoma activity in vitro. Inorg. Chem. Commun. 2022, 137, 109221. [Google Scholar] [CrossRef]
  89. Boomi, P.; Ganesan, R.; Prabu Poorani, G.; Jegatheeswaran, S.; Balakumar, C.; Gurumallesh Prabu, H.; Anand, K.; Marimuthu Prabhu, N.; Jeyakanthan, J.; Saravanan, M. Phyto-engineered gold nanoparticles (AuNPs) with potential antibacterial, antioxidant, and wound healing activities under in vitro and in vivo conditions. Int. J. Nanomed. 2020, 2020, 7553–7568. [Google Scholar] [CrossRef]
  90. Nakagama, T.; Yamada, M.; Hobo, T. Chemiluminescence sensor with uranine immobilized on an anion-exchange resin for monitoring free chlorine in tap water. Anal. Chim. Acta 1990, 231, 7–12. [Google Scholar] [CrossRef]
  91. Deepa, S.; Venkatesan, R.; Jayalakshmi, S.; Priya, M.; Kim, S.-C. Recent advances in catalyst-enhanced luminol chemiluminescence system and its environmental and chemical applications. J. Environ. Chem. Eng. 2023, 11, 109853. [Google Scholar] [CrossRef]
  92. Lee, J.; Seliger, H. Quantum yields of the luminol chemiluminescence reaction in aqueous and aprotic solvents. Photochem. Photobiol. 1972, 15, 227–237. [Google Scholar] [CrossRef]
  93. Guo, J.-Z.; Cui, H.; Zhou, W.; Wang, W. Ag nanoparticle-catalyzed chemiluminescent reaction between luminol and hydrogen peroxide. J. Photochem. Photobiol. A Chem. 2008, 193, 89–96. [Google Scholar] [CrossRef]
  94. Klopf, L.L.; Nieman, T.A. Effect of iron(II), cobalt(II), copper(II), and manganese(II) on the chemiluminescence of luminol in the absence of hydrogen peroxide. Anal. Chem. 1983, 55, 1080–1083. [Google Scholar] [CrossRef]
  95. Held, A.; Halko, D.; Hurst, J. Mechanisms of chlorine oxidation of hydrogen peroxide. J. Am. Chem. Soc. 1978, 100, 5732–5740. [Google Scholar] [CrossRef]
  96. Qin, X.; Zhuang, Y.; Shi, B.; Li, Y.; Shi, Y. Effect of residual chlorine on iron particle formation considering drinking water conditions. J. Environ. Chem. Eng. 2021, 9, 106377. [Google Scholar] [CrossRef]
  97. Huang, J.; Jones, A.; Waite, T.D.; Chen, Y.; Huang, X.; Rosso, K.M.; Kappler, A.; Mansor, M.; Tratnyek, P.G.; Zhang, H. Fe(II) redox chemistry in the environment. Chem. Rev. 2021, 121, 8161–8233. [Google Scholar] [CrossRef]
  98. Lloyd, R.V.; Hanna, P.M.; Mason, R.P. The origin of the hydroxyl radical oxygen in the Fenton reaction. Free Radic. Biol. Med. 1997, 22, 885–888. [Google Scholar] [CrossRef] [PubMed]
  99. Lindsey, M.E.; Tarr, M.A. Quantitation of hydroxyl radical during Fenton oxidation following a single addition of iron and peroxide. Chemosphere 2000, 41, 409–417. [Google Scholar] [CrossRef]
  100. He, J.; Yang, X.; Men, B.; Wang, D. Interfacial mechanisms of heterogeneous Fenton reactions catalyzed by iron-based materials: A review. J. Environ. Sci. 2016, 39, 97–109. [Google Scholar] [CrossRef]
  101. Huang, M.; Wang, X.; Liu, C.; Fang, G.; Gao, J.; Wang, Y.; Zhou, D. Mechanism of metal sulfides accelerating Fe(II)/Fe(III) redox cycling to enhance pollutant degradation by persulfate: Metallic active sites vs. reducing sulfur species. J. Hazard. Mater. 2021, 404, 124175. [Google Scholar] [CrossRef]
  102. Barinov, A.K.; Sugakov, G.K. Access to clean water in Africa. Herald. Russ. Acad. Sci. 2024, 94, 550–559. [Google Scholar] [CrossRef]
Figure 1. (a) UV absorption and (b) fluorescence spectra (λex = 350 nm) of WS2 QDs.
Water 16 03044 g001
Figure 2. Chemiluminescent kinetic curves for the NaClO solution (1.5 mM) after the addition of different probes: (a) luminol (60 µM); (b) WS2 QDs (60 µM); and (c) luminol (30 µM) and WS2 QDs (60 µM). The aliquot volume of each component is 20 µL. In the figures, red arrows indicate the injection of the luminol solution.
Water 16 03044 g002
Figure 3. (a) Typical chemiluminescent signal of the WS2 QDs aqueous colloid solution (20 µL, 60 µM) upon the sequential addition of the sodium hypochlorite solution (20 µL, 1.5 mM) and luminol (20 µL, 30 µM)—the time of interaction between WS2 QDs and hypochlorite was 2 min. (b) The areas under the chemiluminescence curves (lightsums) for various times of interaction between NaClO with WS2 QDs before the addition of luminol.
Water 16 03044 g003
Figure 4. Chemiluminescent kinetic curves for the NaClO (20 µL, 1.5 mM) solution upon the addition of (a) WS2 QDs and (b) luminol at various concentrations. The areas under the corresponding chemiluminescence curves (lightsums) are as a function of the concentration of (c) WS2 QDs and (d) luminol.
Water 16 03044 g004
Figure 5. (a) Chemiluminescent kinetic curves for the NaClO (20 µL, 1.5 mM) solution upon the addition of WS2 QDs and luminol with WS2 QDs-to-luminol molar ratios of 1:1, 1:2, and 2:1; (b) the areas under the corresponding chemiluminescence curves (lightsums).
Water 16 03044 g005
Figure 6. (a) Chemiluminescence kinetic curves for the NaClO solution (20 µL, 1.5 mM) upon the addition of the WS2 QDs (20 µL, 40 µM) /luminol (20 µL, 20 µM) probe followed by the addition of various quantities of sodium ascorbate; (b) chemiluminescence suppression (SCL, a.u.) on sodium ascorbate concentration.
Water 16 03044 g006
Figure 7. (a) Chemiluminescent kinetic curves for the solutions of NaClO with various concentrations; (b) the area under the corresponding chemiluminescence curve (lightsums, S) as a function of hypochlorite concentration; (c) the linear relationship between the analytical signal (lightsum) and the concentration of hypochlorite in the range of 0.25–1.80 mM.
Water 16 03044 g007
Figure 8. (a) Chemiluminescent kinetic curves for solutions of NaClO with various concentrations; (b) the linear relationship between the analytical signal (lightsum) and the concentration of hypochlorite in the range of 2.5–150 µM.
Water 16 03044 g008
Figure 9. (a) A typical chemiluminescent kinetic curve for the solution of H2O2 (1.5 mM) in the presence of luminol (20 µM); (b) histogram of the lightsum values for H2O2 solutions after the addition of different chemiluminescent probes, namely luminol (20 µM), WS2 QDs (40 µM), and luminol (20 µM)/WS2 QDs (40 µM). The aliquot volume of each component is 20 µL.
Water 16 03044 g009
Figure 10. A typical chemiluminescent kinetic curve for the solution of H2O2 (1.5 mM)/Fe(II) (100 µM) upon the addition of luminol (20 µM); WS2 QDs (40 µM); and luminol (20 µM) and WS2 QDs (40 µM). The aliquot volume of each component is 20 µL.
Water 16 03044 g010
Table 1. Comparison of linearity ranges and detection limits of alternative methods for the quantification of hypochlorite content in water.
Reaction MixtureDetection Limit (M)Linear Range (M)pHReference
Graphene quantum dots/ClO3 × 10−75.0 × 10⁻⁷–1 × 10−38.0[58]
Poly(luminol)/ClO/H2O25 × 10−75 × 10−7–4 × 10−38.0[65]
Rhodamine 6G/ClO1.2 × 10−68.7[66]
bis(2,4,6(trichlorophenyl)oxalate)/ClO2 × 10−62 × 10−6–3 × 10−56.5[69]
Uranine/ClO3 × 10−62 × 10−6–1 × 10−36.0[90]
Fluoresceinate/ClO5.3 × 10−61.5 × 10⁻⁴–6.9 × 10−49.5[67]
WS2 QDs/luminol/ClO8 × 10−52.5 × 10⁻⁴–1.8 × 10−37.4This work
WS2 QDs/L-012/ClO2 × 10−62.5 × 10⁻⁶–1.5 × 10−47.4This work
Disclaimer/Publisher’s Note: The statements, opinions and data contained in all publications are solely those of the individual author(s) and contributor(s) and not of MDPI and/or the editor(s). MDPI and/or the editor(s) disclaim responsibility for any injury to people or property resulting from any ideas, methods, instructions or products referred to in the content.

