Article

Spatio-Temporal Analysis of Net Anthropogenic Phosphorus Inputs (NAPIs) and Their Impacts in Ningxia Hui Autonomous Region Using Monte Carlo Simulations and Sensitivity Analysis

by
Hua Ma
1,†,
Xiaotong Liu
2,†,
Qiuliang Lei
1,*,
Jiafa Luo
3,
Hongjie Di
4,
Xinzhong Du
1,
Ying Zhao
2,*,
Xuejun Zhang
2 and
Hongbin Liu
1
1
State Key Laboratory of Efficient Utilization of Arid and Semi-Arid Arable Land in Northern China, Key Laboratory of Nonpoint Source Pollution Control, Ministry of Agriculture, Institute of Agricultural Resources and Regional Planning, Chinese Academy of Agricultural Sciences, Beijing 100081, China
2
Institute of Agricultural Resources and Environment, Ningxia Academy of Agriculture and Forestry Sciences, Yinchuan 750002, China
3
AgResearch Limited, Ruakura Research Centre, Hamilton 3240, New Zealand
4
Centre for Soil and Environmental Research, Lincoln University, Lincoln, Christchurch 7647, New Zealand
*
Authors to whom correspondence should be addressed.
These authors contributed equally to this work.
Water 2024, 16(22), 3160; https://doi.org/10.3390/w16223160
Submission received: 14 October 2024 / Revised: 31 October 2024 / Accepted: 4 November 2024 / Published: 5 November 2024
(This article belongs to the Section Water, Agriculture and Aquaculture)

Abstract

:
This study employed the Net Anthropogenic Phosphorus Inputs (NAPI) model to assess the impact of human activities on phosphorus input in a watershed, analyzing county-level statistical data and NAPI model parameters from 1991 to 2020. The Monte Carlo method was used for a quantitative analysis of the model parameters’ effects on each NAPI component and the overall simulation results. The sensitivity index method identified each component’s sensitive parameters. The study found that the lowest NAPI value was 454 kg/(km2·a) in 1991 and the highest was 1336 kg/(km2·a) in 2003. NAPI in Ningxia showed an overall upward trend from 1991 to 1999, a slight decrease from 1999 to 2003, and a slight increase from 2003 to 2020, with fertilizer being the main contributing factor, accounting for 77.4% of the total input. On a spatial scale, NAPI in Ningxia was significantly correlated with land use patterns, showing higher values in the northern and southern regions compared to the central part. The NAPI values derived from Monte Carlo simulations with appropriate parameters ranged from −24.83% to 31.49%. The study highlighted the net food and feed imports component as having the highest uncertainty, impacting simulation results within a range of −23.89% to 53.98%. It was observed that the larger a component’s proportion in the NAPI model, the more sensitive its parameters, with the phosphorus fertilizer (Pfer) component’s parameters being notably more sensitive than those of the food/feed phosphorus input and the non-food phosphorus input (Pnf) components. These findings can inform phosphorus pollution control policies in Northwest China, while the selection of sensitive parameters provides a useful reference for future NAPI research in other regions.

1. Introduction

Non-point source pollution is currently the main source of water pollution [1], with phosphorus being the primary contributor to eutrophication in water bodies [2]. Globally, human activities have caused a rapid increase in phosphorus input [3,4,5,6]. Therefore, to effectively manage phosphorus and reduce the risk of phosphorus pollution, it is imperative to analyze the risk characteristics of anthropogenic phosphorus inputs.
Previous studies have used various methods to assess the risk of phosphorus loss, including experimental monitoring [2,7], the phosphorus index model [8], the land use dynamic change model [9], ecological risk evaluation [9], and the anthropogenic net phosphorus input (NAPI) model. Experimental monitoring is often expensive and time-consuming due to the requirement of control areas, while the phosphorus index is relatively simple and more suitable for farm-scale evaluations. The land use dynamic change model and the ecological risk evaluation method both use indirect characteristics to determine the risk of phosphorus loss, lacking a single quantitative function to determine phosphorus pollution.
The NAPI model has emerged as a tool for calculating phosphorus inputs and outputs within a watershed, providing a net nutrient balance to evaluate potential pollution risks [10,11,12]. This model has been widely applied across numerous global regions, including the Chesapeake Bay, Lake Erie, the California Central Valley [13,14,15,16,17,18,19], and various watersheds in China such as the Poyang Lake basin, the Yangtze River, and the Qiandao Lake [20,21,22,23,24,25,26]. However, significant uncertainties remain in NAPI model applications due to variability in input data, model structure, and parameter selection, often derived from the literature-based assumptions [27,28,29]. These choices introduce subjectivity, potentially undermining the reliability of simulation outcomes.
This study addresses existing uncertainties by integrating the Monte Carlo method and sensitivity index to quantify the uncertainty and sensitivity of key NAPI model parameters. In contrast to prior NAPI research, which often relies on broader geographic units and lacks parameter sensitivity analyses, this study utilizes refined parameter sampling and statistical analysis over smaller study units (20 counties and cities within Ningxia) to enhance model precision. Additionally, through a longitudinal analysis spanning 1991 to 2020, this study identifies high-risk areas for phosphorus pollution, explores the primary factors influencing NAPI variations, and elucidates spatial and temporal distribution patterns. This refined approach offers a more detailed assessment of phosphorus pollution risks, supporting targeted phosphorus management strategies in Northwest China and providing a reference framework for similar studies in other regions.
The objectives of this study were: (i) to identify high-risk areas for phosphorus pollution in Ningxia using smaller study units and long-term statistical data; (ii) to explore the effect of model parameters and input components on NAPI using the Monte Carlo method; and (iii) to identify the most sensitive parameters in the NAPI model using a sensitivity index. The results of this study can be used as a reference for phosphorus control in Northwest China, and the selection of sensitivity parameters can also serve as a reference for NAPI research conducted in other regions.

2. Materials and Methods

2.1. Study Area

The Ningxia Hui Autonomous Region is situated in northwestern China, in the middle and upper reaches of the Yellow River, spanning the transition zone between the Loess Plateau and the Inner Mongolia Plateau (35°14′–39°23′ N, 104°17′–107°39′ E), as shown in Figure 1. The region enjoys a favorable climate with 3000 h of sunshine and 150 frost-free days per year. Covering an area of 66,400 km2, Ningxia extends 456 km from north to south and 250 km from east to west, presenting an olive-shaped, narrow landmass [30]. The region is geographically divided into four parts: the Helan Mountains, the Liupan Mountains, the Ningxia Plain, and the southeastern plateau. The plateau and mountains account for about 75% of the region’s total area, while the plain comprises the remaining 25%.
Due to the region’s diverse topography, economy, living standards, landforms, and climate, it is essential to consider the county-level administrative regions of Ningxia to accurately explore the uncertainty of the parameters generated in the NAPI model.

2.2. Data Collection and Analysis

The Ningxia Hui Autonomous Region comprises 22 county-level administrative regions under the jurisdiction of 5 prefecture-level cities. The data indicators used in this study include population size, major livestock and poultry breeding, production and sown area of major agricultural products, and the application of phosphate and compound fertilizer in each county and city. These data were collected from the Ningxia Statistical Yearbooks, the public literature, and public statistics available on the official government website. https://www.nx.gov.cn/zwgk/zfxxgk/fdzdgknr/tjxx_40901/tjnj/, accessed on 13 June 2023.
To create study units, Xingqing District, Xixia District, and Jinfeng District of Yinchuan City were combined, resulting in a total of 20 study units in this study. Using the above data, the net anthropogenic phosphorus input (NAPI) in Ningxia from 1991 to 2020 was calculated. Additionally, the parameters of the main indicators of the NAPI model were collected and organized through a literature search. After sorting the obtained parameter samples, the parameter ranges of each indicator were summarized.

2.3. Estimation of the Net Anthropogenic Phosphorus Inputs

The calculation of NAPI involved three components of P input that represented external sources of P resulting from human activities. These components were the net food and feed imports, phosphorus fertilizer applications, and non-food inputs. Mathematically, NAPI was represented by the sum of these three components as follows:
NAPI = P im + P fer + P nf
where Pim represents the P input from food and feed, Pfer represents the net P input from fertilizer, Pnf represents the non-food input, which includes phosphorus-containing detergent.

2.3.1. Calculation of Pim

To calculate the Pim component of NAPI, the following formula was used:
P im = P hc + P lc P lp P cp
Phc represents phosphorus consumption from human food, which is determined by the population and phosphorus consumption of humans. The phosphorus content of various crops used in human food is shown in Table 1, along with the appropriate parameter values. Estimated livestock phosphorus intake and excretion rate and the edible proportion of livestock is shown in Table 2.
Plc represents phosphorus consumption in animals feed, which is determined by the type, amount and phosphorus consumption of animals.
Plp refers to phosphorus in animal products, which is determined by the amount, phosphorus requirements and phosphorus excretion levels of animals.
Pcp refers to phosphorus in crops, which is determined by yield and phosphorus content of crops.
P hc = ( Pop 1 × 973.2 + Pop 2 × 981.0 ) × 365 10 9
where Pop1 and Pop2 refer to the urban and rural populations in each study unit, respectively.
P lc = i = 1 n ( AN i × API i × 10 3 )
where AN refers to the quantity of livestock and poultry in each study unit. API refers to the levels of phosphorus intake.
P lp = i = 1 n AN i × ( AN i APO i ) × r edi × 10 3
where APO refers to Phosphorus excretion levels in livestock and poultry and redi refers to the proportion of edible parts of livestock and poultry.
P cp = v = 1 m C P V × PC V
where m refers to the quantity of crop types. v refers to the type of crops and CP and PC refer to the yield and phosphorus content of crop, respectively.

2.3.2. Calculation of Pfer

Pfer refers to the net phosphorus input from fertilizer, including the phosphorus content in phosphate fertilizer and compound fertilizer. Organic fertilizer is considered part of the internal cycle and does not participate in the calculation of net phosphorus input from human activities. In China, the main nutrient content ratio of compound fertilizer is N:P2O5:K2O = 15:15:15. Although in recent years, due to increased demand and process improvement, the ratio of N:P:K nutrient content of compound fertilizers has even reached 17% [31,32].
P fer = PF + CF × C o m p o u n d   f e r t i l i z e r   f o l d e d   p u r e   v o l u m e
where PF refers to fertilizer phosphorus refraction and CF refers to amount of compound fertilizer.

2.3.3. Calculation of Pnf

Non-food phosphorus mainly comes from detergents used in daily life. In China, the average daily sewage discharge per person is 150 L [33]. According to studies, the total phosphorus concentration of household sewage in mainland China is 21 mg/L [34], which means that the phosphorus discharged from domestic sewage is approximately 1.15 kg per person per year. Since the phosphorus discharged from domestic sewage is about 0.52 kg per person per year, the remaining non-food phosphorus is estimated to be 0.63 kg per person per year.

2.4. Effects of Parameter Values on NAPI

The fluctuation ranges of the NAPI input components influenced by the model parameters, along with the calculation results for the conventional parameters, are presented in Table 3. To assess the impact of these model parameters on each input component and the resulting NAPI values, as well as to evaluate the associated uncertainty, we applied the Monte Carlo method using the original data from each research unit for the years 1998, 2003, 2008, 2013, and 2018. Furthermore, we employed a sensitivity index method to identify the most sensitive parameters within the NAPI model when varying a single parameter. The Monte Carlo method is a statistical simulation approach commonly used to solve complex stochastic problems. This method involves using a probability density function to describe the likelihood of a variable’s occurrence and then randomly sampling values for the density parameters within a defined range. Through thousands of iterations of the simulation process, the computer synthesizes the most scientifically plausible output results. This approach reduces errors caused by purely subjective empirical judgments, ensuring the scientific accuracy of the fitted predictions. The sensitivity analysis provides insights into which parameters are most critical for accurate model results and which parameters can be adjusted without significant impact. Together, the Monte Carlo and sensitivity analysis methods offer a comprehensive understanding of the NAPI model and its sensitivity to various parameters, thereby improving the accuracy and reliability of the model predictions.

2.4.1. Monte Carlo Method

RStudio can be implemented with various function packages for generating random number samples, providing a convenient way to implement the Monte Carlo method. In this study, the parameters were randomly selected 5000 times within their range, and the output results are shown in Table 4.

2.4.2. Sensitivity Index Method

The purpose of this study is to explore the sensitivity of parameters in the NAPI model using a sensitivity index. The sensitivity index, denoted by I, is calculated using the formula:
I = ( y 2 y 1 ) / y 0 2 Δ x / x 0
where y refers to the output variable and x refers to the input parameter. The sensitivity index I measures the change in the output result caused by a change in the input parameter. The larger the absolute value of I, the greater the effect of the parameter on the simulation result. In this study, we used y0, y1 and y2 to denote the different results obtained for a parameter at x0, x0 + x and x0 − x, respectively. This allows us to calculate the sensitivity index I for each parameter of the NAPI model. For assessment and comparison purposes of the sensitivity of parameters, sensitivity indices were divided into four categories, as defined by Lenhart [35]. These categories are shown in Table 5.

3. Results

3.1. Interannual Variation Characteristics of NAPI

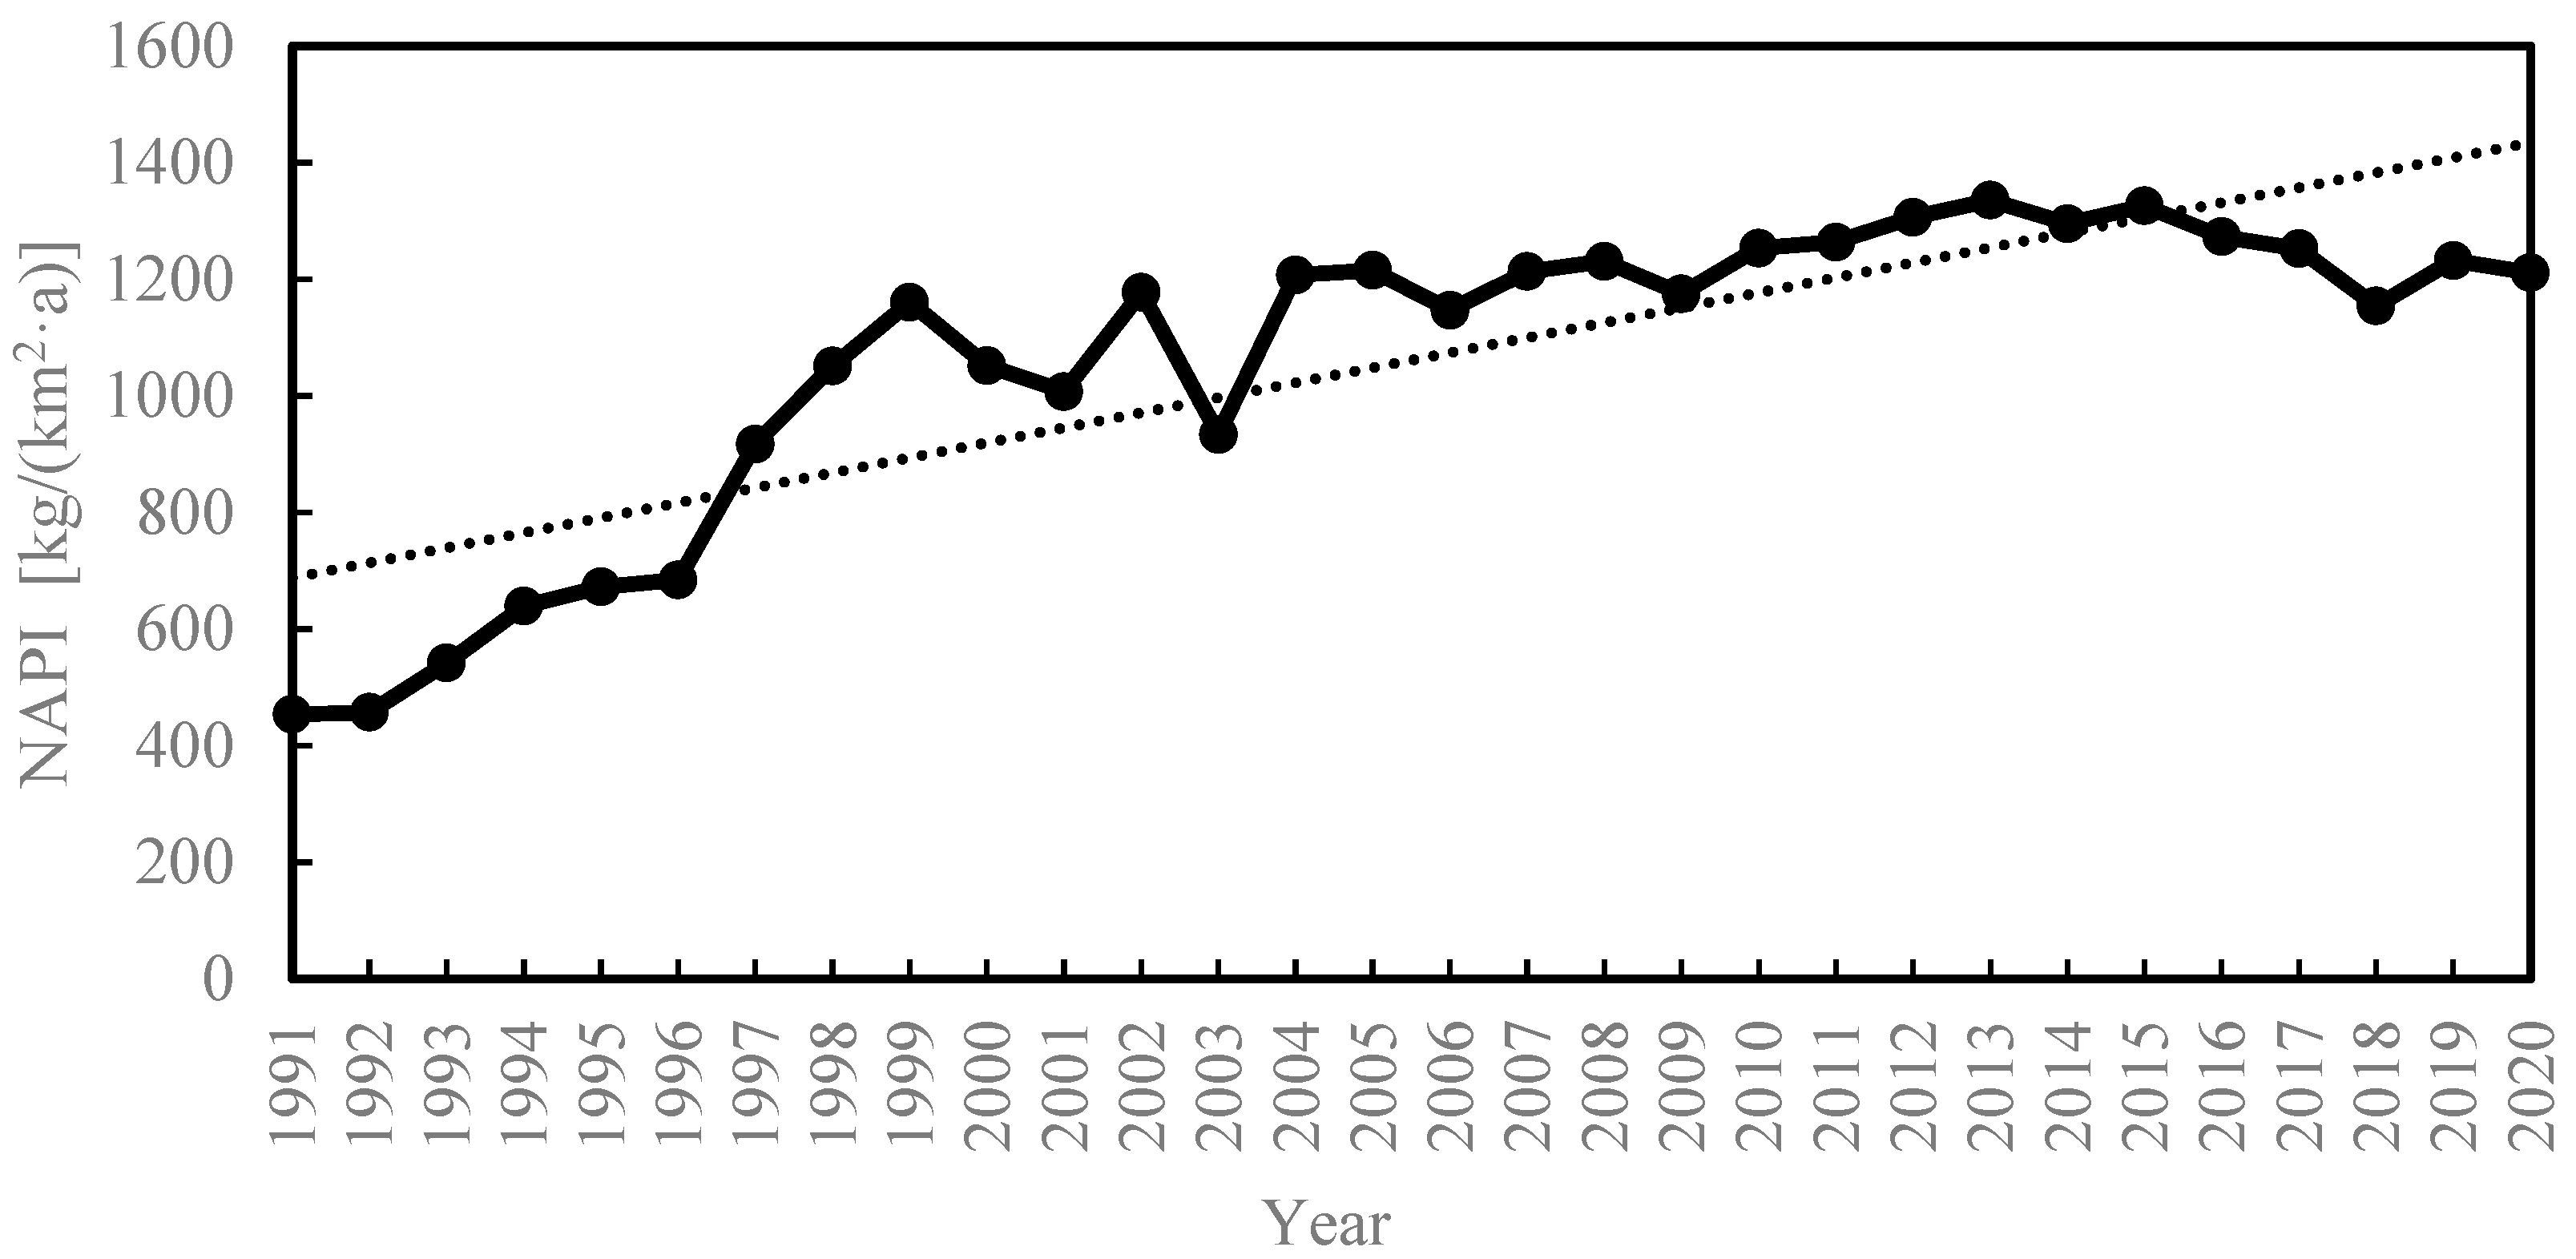
To better understand the spatial and temporal distribution characteristics of net phosphorus input from human activities in the Ningxia region, we conducted an analysis of interannual variation and spatial distribution using appropriate parameters detailed in the Materials and Methods section. As shown in Figure 2, our findings demonstrate that the overall variation of NAPI in the Ningxia region from 1991 to 2020 initially increased, followed by a decrease, and eventually stabilized. Significant increases were observed from 1996 to 1997 and from 2003 to 2004, with average annual growth rates of 34% and 29%, respectively. Subsequently, NAPI stabilized and began decreasing in 2004. The lowest NAPI value during the study period was 454 kg/(km2·a) in 1991, while the highest value occurred in 2003, reaching 1336 kg/(km2·a).
As shown in Figure 3, phosphorus fertilizer application was identified as the main source of phosphorus input in the Ningxia region in terms of the intensity of phosphorus input composition. The interannual variation of Pfer and NAPI during the study period displayed a high consistency and was the decisive factor causing changes in NAPI in the Ningxia region, with an average annual contribution of 77.4%. Additionally, the contribution of Pim was higher than that of Pfer in 1991 but then declined rapidly. From 1992 to 2020, its contribution stabilized at 12% to 29%, indicating that food input from outside the region had been decreasing. Some cities and counties transitioned from net import to net export during the study period. The percentage of Pnf was smaller, with an annual average percentage of 2.3% during the study period. This indicates that, with the popularization of policies, improvements in living standards, and advancements in science and technology, people’s requirements for the living environment gradually improved. Consequently, the use of phosphorus-containing detergents decreased over time.

3.2. Spatial Variation Characteristics of NAPI

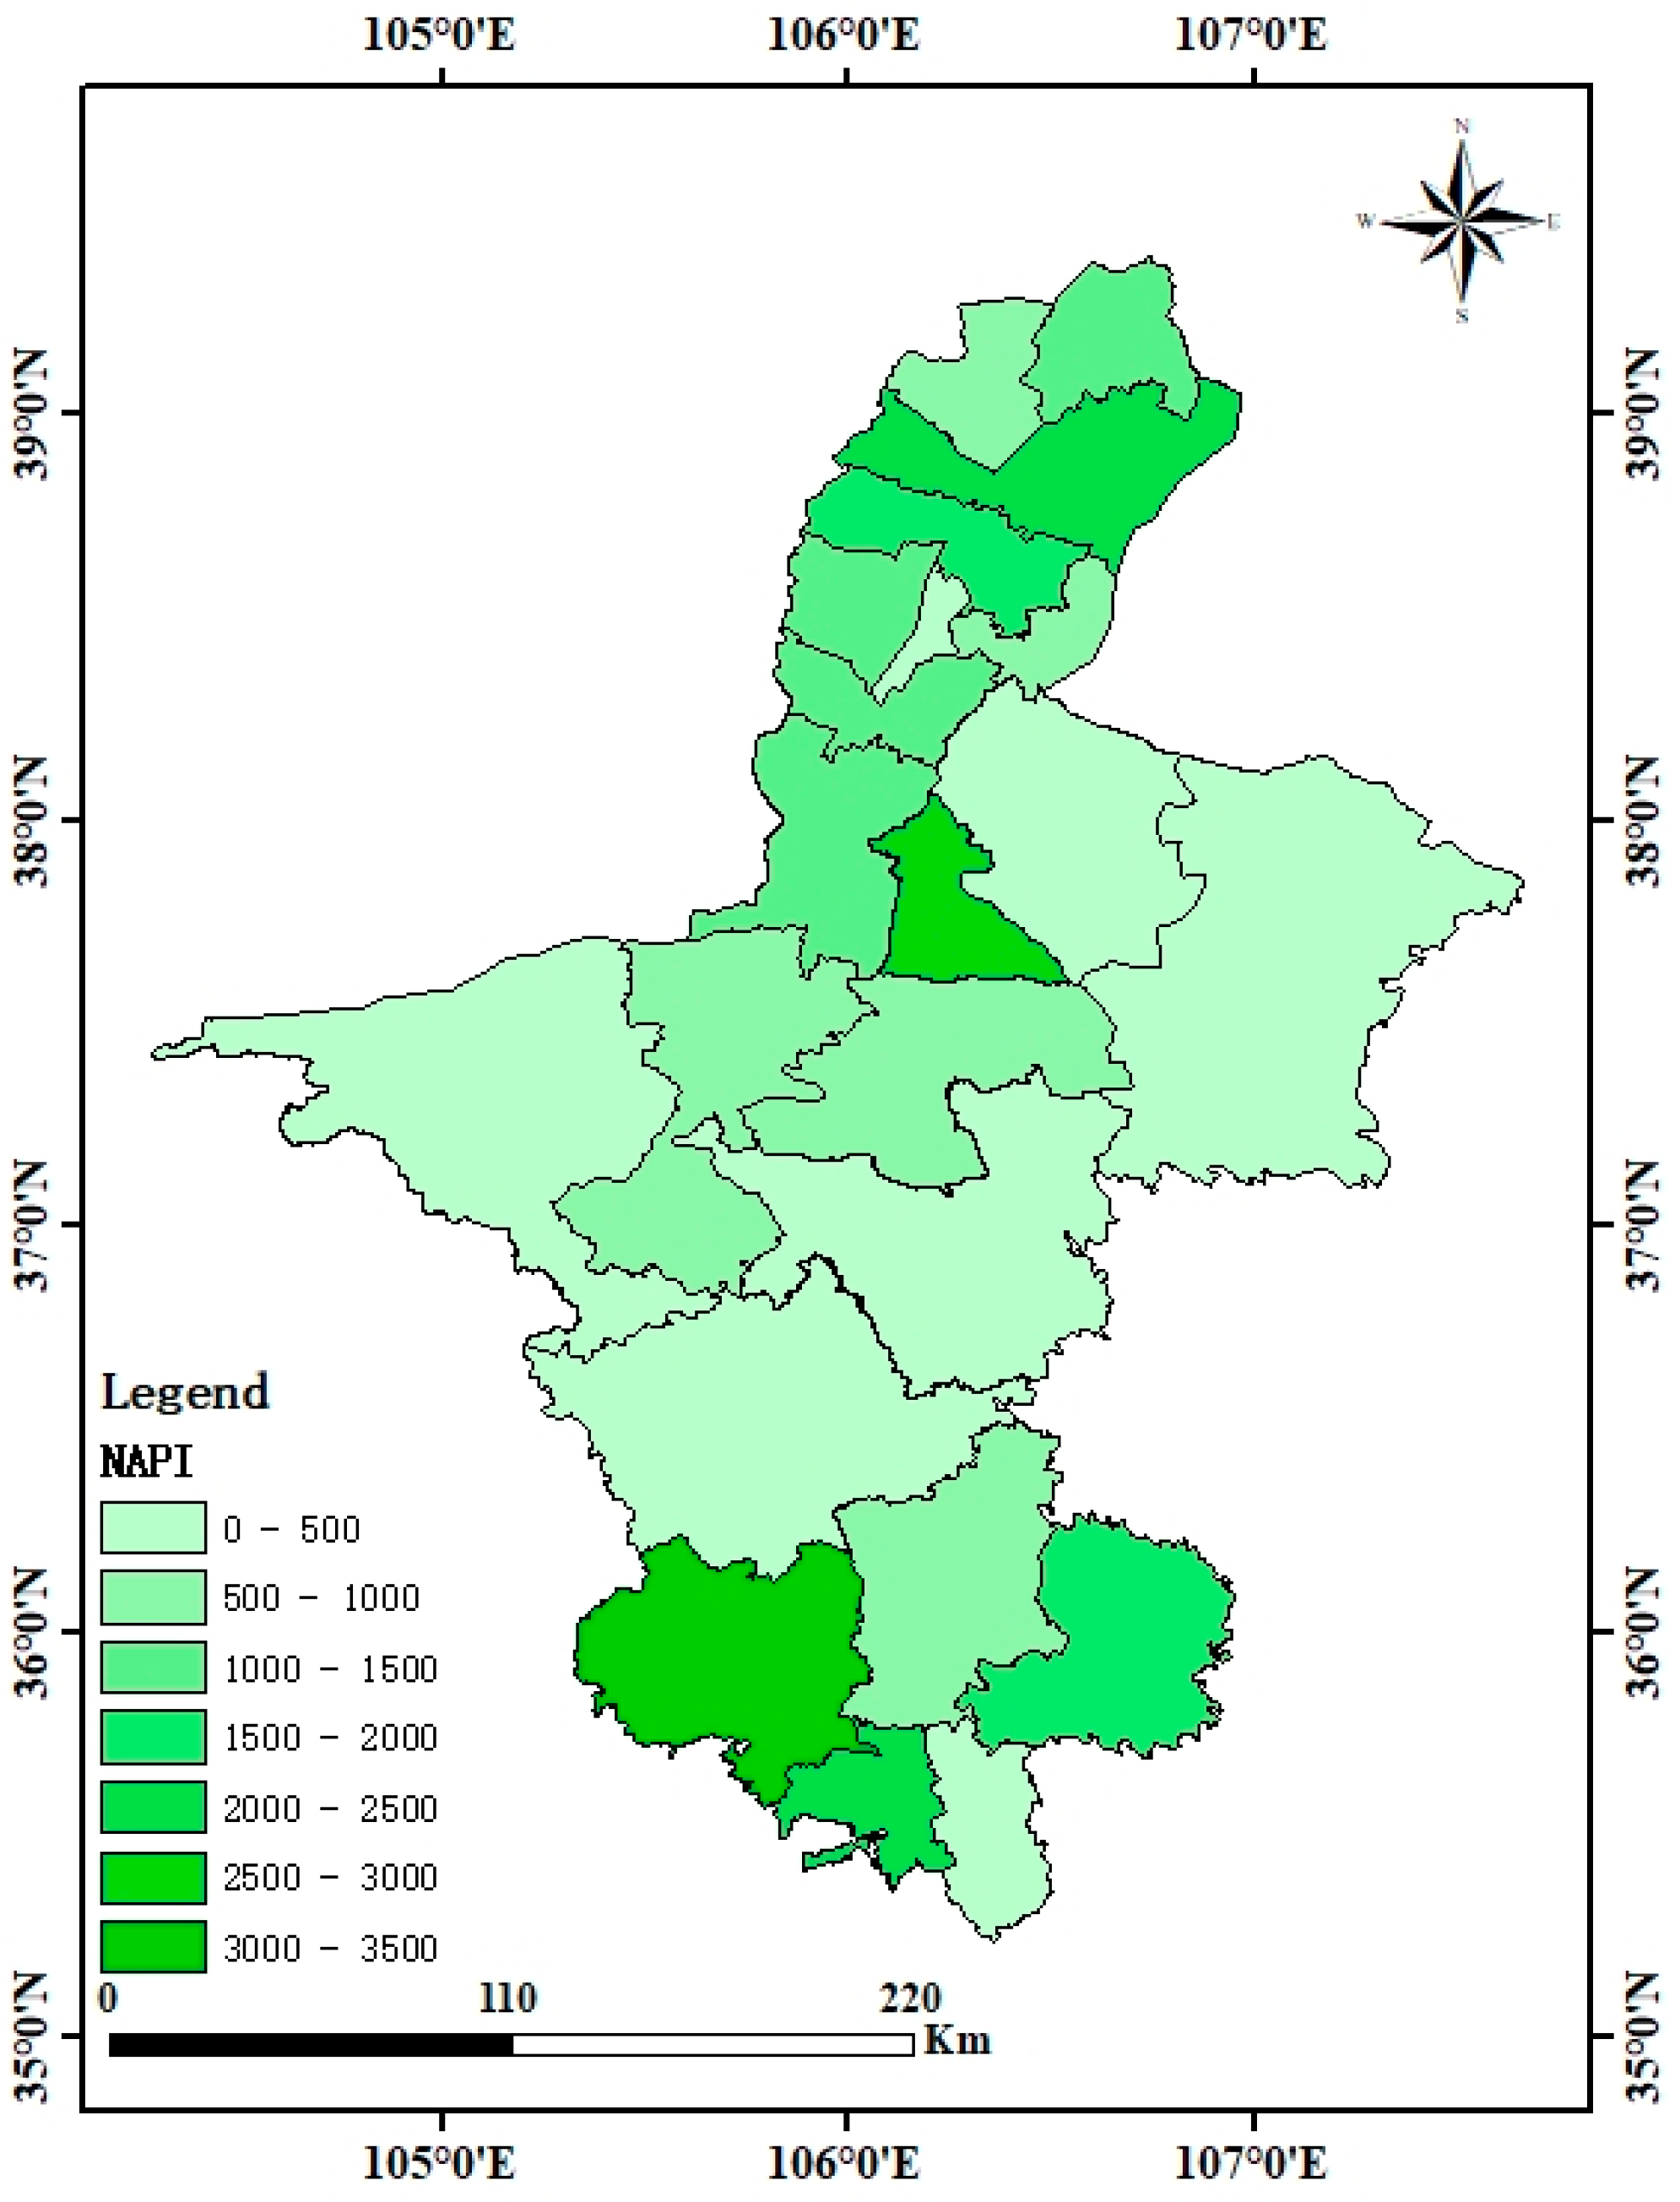
Figure 4 shows the spatial distribution of the annual average net phosphorus input from human activities in each study unit in the Ningxia region during the study period. The distribution of NAPI in the Ningxia region exhibited significant geographical variation, with the southern and northern parts displaying higher values than the central parts. The regions with the highest NAPI values are concentrated in Helan, Litong, Pingluo, Xiji, Longde, and Pengyang in the north-central and southern parts of the region. Xiji had the highest NAPI value, reaching 3256 kg/(km2·a) from 1991 to 2018. Meanwhile, the NAPI values in Helan, Litong, Pingluo, Pengyang, and Longde were consistently high, ranging from 1086–2313 kg/(km2·a), 965–2553 kg/(km2·a), 1011–2441 kg/(km2·a), 537–1725 kg/(km2·a), and 577–2239 kg/(km2·a), respectively.
Previous studies have shown that the spatial distribution intensity of NAPI is significantly influenced by factors such as watershed topography, agricultural distribution, and land use practices [36,37,38,39]. From Figure 1 and Figure 4, it is evident that the land use patterns in the Ningxia region are closely associated with the NAPI levels. The region’s topography is characterized by high elevations in the south and low elevations in the north, with loess hills in the south, terraces, mountains, and inter-mountain plains in the middle, and loess plains in the north. The Liupan Mountains and Helan Mountains towering over the north and south ends lead to high agricultural factor inputs during the agricultural production process, and traditional and rough farming practices have resulted in high NAPI values.

3.3. Uncertainty Analysis of NAPI

The accuracy of the NAPI estimation model is heavily reliant on the variation of its parameters. To explore the influence of these parameters on the NAPI model estimation, this study used data from the Ningxia region from 1991 to 2020 as an example. The Pfer and Pim components were calculated under their parameter ranges as well as suitable parameters, respectively, using the variation range of each parameter shown in Table 2 (the calculation results are shown in Table 3). Furthermore, the parameters were randomly selected within their parameter variation ranges for 5000 calculations, and the NAPI of each city and county in Ningxia was obtained. The calculation results are shown in Table 4. Pnf was considered a fixed parameter in this analysis based on the annual non-food phosphorus emission of 0.63 kg per person in China.
Table 3 and Table 4 demonstrate that changes in the NAPI estimation model’s parameters lead to changes in the corresponding input components and NAPI estimation results. As shown in the calculation results of Table 3, the NAPI value obtained under different parameter sets varied from −24.83% to 31.49% compared to the suitable parameters. Among the input components, the food/feed phosphorus input was more heavily influenced by parameter changes, with a change range of −23.89% to 53.98% compared to the suitable parameters, and its contribution to NAPI varied from 8.11% to 21.80%. The effect of parameter variation on fertilizer was less significant, with a variation range of −2.82% to 8.99%, and its contribution to NAPI varied from 61.27% to 84.18%.

3.4. Parameter Sensitivity Analysis

In this study, the sensitivity index method was used to identify the sensitive parameters in the NAPI estimation model for the entire Ningxia region from 1991 to 2020. Two representative parameters were selected for each of the six input components (Phc, Plc, Plp, Pcp, Pfer, and Pnf), making a total of twelve parameters, with Δx/x0 = 10%, as per the literature. The higher the proportion of components in the NAPI model, the more sensitive the parameters, as shown in Table 6. The results revealed that the fertilizer fractionation rate in the Ningxia region had the highest sensitivity index value of 0.152 for the period 1991–2020 compared to other parameters. Additionally, the phosphorus content in cattle excretion was classified as moderately sensitive, with an index value of 0.072. Significant differences were observed in the sensitivity indices of various parameters, as shown in Table 6. The magnitude of parameter sensitivity in the Pim calculation followed the order: Pcp > Phc > Plp > Plc. Moreover, there were differences in the sensitivity of annual P intake and excretion parameters among different livestock species. For example, the P excretion parameters of cattle were much higher than those of pigs. In contrast, the sensitivity of the parameters in Pnf was relatively lower due to the more uniform input of non-food phosphorus.

4. Discussions

The average NAPI in the Ningxia region at the county scale from 1991 to 2020 was 1050 kg/(km2·a), with Xiji and Yanchi counties having the highest and lowest values, respectively. As shown in Figure 2, the trends in NAPI for the Ningxia region from 1991 to 2020 initially exhibited an increase, followed by a decrease and eventual stabilization. Notable increases in NAPI were also observed between 1996–1997 and 2003–2004, with annual growth rates of 34% and 29%, respectively, highlighting the impact of agricultural practices and cropping patterns on phosphorus inputs during these periods [23,24]. The decrease in net anthropogenic phosphorus inputs (NAPI) between 1999 and 2003 can be largely attributed to shifts in cropping structures within the Ningxia region. During this period, a notable decline occurred in the area planted with summer crops, particularly wheat, due to its relatively lower yields and reduced profitability. In contrast, the area planted with autumn crops, such as potatoes, increased significantly due to higher yields and improved economic returns associated with these crops. As illustrated in Table 1, the phosphorus content in wheat is higher than that in potatoes, which indicates that the adjustment in cropping patterns from 1998 to 2003 had a substantial impact on NAPI levels in the region. This transition to autumn crops with lower phosphorus content contributed to the observed decrease in NAPI over this period. Following 2003, the trend continued with declining summer crop yields and an acceleration in autumn crop yields. This increase not only contributed to total grain production but also raised the proportion of autumn crops in overall grain production from 59.67% in 2003 to 84.56%. Consequently, the notable increase in total grain production during this period led to a subsequent rise in NAPI. Socio-economic changes influencing crop selection and the shift toward more profitable autumn crops were key drivers behind the variations in NAPI observed during these years. The overall NAPI in the Ningxia region is lower than in other regions in China, such as Shanghai (5053.37 kg/(km2·a) in 1997 [34]), the Erhai basin (2384 kg/(km2·a) [23]), and Henan Province (7573.465 kg/(km2·a) on average per year [29]). However, compared to existing studies in other countries, the NAPI in the Ningxia region is slightly higher. For example, the NAPI in the Baltic Sea basin in Europe ranges from 38 to 1142 kg/(km2·a) [20], and it is 1112 and 558 kg/(km2·a) in the Lake Erie and Lake Michigan basins [15], respectively, and 486 kg/(km2·a) in the Chesapeake Bay [13].
The relationship between regional nutrient inputs and riverine nutrient export suggests that 2% to 10% of the net anthropogenic phosphorus input eventually reaches the watershed outlet [18], indicating much higher phosphorus levels in the region compared to the watershed system. Regarding the input components of NAPI, the trend of NAPI in the Ningxia region from 1991 to 2020 is consistent with the trend in its fertilizer application. As with other regions in China, fertilizer is the main contributor to the NAPI in Ningxia. For example, fertilizer application in the Erhai region accounts for 56% of the total input and explains 70.3% of the change in NAPI intensity [22]. Similarly, fertilizer application in the Huaihe River basin accounts for about 70% of the basin NAPI, and fertilizer application in the Dongting Lake basin accounts for about 52.3% of the basin NAPI [38]. Therefore, addressing the issue of excessive regional phosphorus load from fertilizer application in agricultural production cannot be delayed. The proportion of arable land area and fertilizer application per unit of arable land area were significantly correlated with NAPI [40,41]. In this study, 67% of the arable land was distributed in the central arid zone and southern mountainous region, with six counties (districts), including Xiji and Pingluo, accounting for 55% of the arable land area in the region. These findings were consistent with the results of the NAPI calculation at the county scale in Ningxia.
To enhance the relevance of these findings for future phosphorus management strategies, this study emphasizes the need for careful consideration of uncertainty sources within the NAPI model, particularly concerning components like Pim. Although Pim contributes a relatively small proportion (12% to 29%) to overall phosphorus inputs, it exhibits significant uncertainty due to several factors. Firstly, Pim encompasses the most indicators compared to other subcomponents, requiring extensive calculations. For instance, Pcp includes the yields of eight crops, accounting for two-thirds of all indicators. Secondly, the wide variability in parameters, such as the phosphorus intake of cattle in the Plc calculation, contributes to greater uncertainty. The broader the parameter range, the higher the uncertainty in the subdivision. Lastly, the calculation method for Pim is notably complex, involving the addition and subtraction of four subcomponents (Phc, Plc, Plp, and Pcp), which compounds the uncertainties from each subcomponent. Given this high level of uncertainty, improving phosphorus management will necessitate targeted adjustments, including the selection of localized parameters for Pim based on regional conditions. This tailored approach can significantly enhance the accuracy of NAPI simulations, providing more reliable data for phosphorus control policies. Moreover, due to the higher sensitivity associated with larger contributing components, such as Pfer, future management strategies should prioritize refining parameters in these areas. By accurately reflecting local agricultural practices and livestock feed standards, this approach will lead to more precise phosphorus input estimates. Consequently, policymakers will be better equipped to implement region-specific interventions.
Additionally, by integrating these refined NAPI estimations, local authorities can establish clearer phosphorus load limits and identify critical control points, such as livestock management and crop phosphorus requirements. Ultimately, this will help mitigate the risk of phosphorus-driven eutrophication. These insights contribute to a more sophisticated framework for phosphorus management, ensuring its adaptability to the unique characteristics of various watersheds or regions.

5. Conclusions

The study unveiled a general pattern of increasing, then decreasing, and finally stabilizing changes in NAPI in the Ningxia region. Specifically, significant increases were observed from 1996 to 1997 and from 2003 to 2004, with average annual growth rates of 34% and 29%, respectively. However, after 2004, the NAPI values stabilized and decreased. On the spatial scale, the distribution of NAPI in the Ningxia region exhibits strong geographical characteristics. High NAPI values are predominantly found in the central and southern mountainous areas, and there is a significant correlation between these values and the arable land area and land use type.
The calculation structure of the NAPI model indicates that input components with higher contributions exhibit lower parameter uncertainty and greater sensitivity to parameters. Additionally, input components with more complex calculation methods and a larger number of indicators have a stronger impact on parameter uncertainty. In particular, Pim is highly sensitive to changes in parameters, with a change range of −23.89% to 53.98% compared to the appropriate parameters. Its contribution to NAPI ranged from 8.11% to 21.80%. On the other hand, Pfer’s influence is less affected by parameter variation, with a range of −2.82% to 8.99%. Its contribution to NAPI ranged from 61.27% to 84.18%.
These findings offer essential insights for enhancing phosphorus management strategies in Ningxia and analogous regions by underscoring the necessity for localized parameter adjustments and targeted interventions that are informed by specific land use patterns and the varying contributions of different phosphorus input components.

Author Contributions

All authors contributed to the study conception and design. Material preparation, and data collection and analysis were performed by H.M., Q.L. and X.D. The first draft of the manuscript was written by H.M. and all authors commented on previous versions of the manuscript. All authors have read and agreed to the published version of the manuscript.

Funding

This work was supported by funding from the National Natural Science Foundation of China (Grant No. U20A20114, 42107076), China Scholarship Council (CSC).

Data Availability Statement

The data presented in this study are available on request from the corresponding author.

Acknowledgments

We would like to express our heartfelt gratitude to the Ningxia Water Resources Bureau for providing data support for this research. We also thank Xu Jie for her assistance in data collection and Pei Wei for his help in data organization. Our appreciation goes to Professor Keith for his valuable suggestions throughout the study. Finally, we extend our thanks to the reviewers and editors for their insightful comments and constructive feedback, which greatly enhanced the quality of this manuscript.

Conflicts of Interest

The authors have no relevant financial or non-financial interests to disclose.

References

  1. Feng, D. Toxicity Load Model of Non-point Source Phosphorus Pollution. Environ. Sci. Manag. 2019, 44, 56–61. [Google Scholar]
  2. Cai, J.; Wang, L.J.; Chen, J.X.; Tian, Z.; Wang, X.; Huang, S.; Liu, D. Characteristics of phosphorus pollution in rivers entering the West Dongting Lake. Res. Environ. Sci. 2018, 31, 70–78. [Google Scholar]
  3. Filippelli, G.M. The global phosphorus cycle: Past, present, and future. Elements 2008, 4, 89–95. [Google Scholar] [CrossRef]
  4. Ouy, W.; Huang, H.B.; Cai, G.Q. Temporal and spatial characteristics of diffuse phosphorus pollution in the watershed without monitoring data at Chaohu Lake. Acta Sci. Circumstantiae 2014, 34, 1024–1031. [Google Scholar]
  5. Howarth, R.; Chan, F.; Conley, D.J.; Garnier, J.; Doney, S.C.; Marino, R.; Billen, G. Coupled biogeochemical cycles: Eutrophication and hypoxia in temperate estuaries and coastal marine ecosystems. Front. Ecol. Environ. 2011, 9, 18–26. [Google Scholar] [CrossRef]
  6. Howarth, R.W. Coastal nitrogen pollution: A review of sources and trends globally and regionally. Harmful Algae 2008, 8, 14–20. [Google Scholar] [CrossRef]
  7. Zhang, J.J.; Shi, Z.M.; Liao, R.; Wang, Y.; Wang, X.Y. Source apportionment and evaluation of potentially toxic elements, P and Se, for paddy soils in the western margin of Chengdu Plain, China. J. Agro-Environ. Sci. 2022, 42, 327–338. [Google Scholar]
  8. Gao, M. Research on the Construction and Application of ArcGIS-Based Watershed Phosphorus Index Model. Master’s Thesis, Anhui Agricultural University, Hefei, China, 2022. [Google Scholar]
  9. Zheng, J. Spatial Distribution and Risk Assessment of Heavy Metals and Nitrogen and Phosphorus in Different Land Use Patterns in the Caohai Watershed of Guizhou. Master’s Thesis, Guizhou University, Guiyang, China, 2019. [Google Scholar]
  10. Chen, D.; Hu, M.; Guo, Y.; Dahlgren, R.A. Influence of legacy phosphorus, land use, and climate change on anthropogenic phosphorus inputs and riverine export dynamics. Biogeochemistry 2015, 123, 99–116. [Google Scholar] [CrossRef]
  11. Zhang, W.; Swaney, D.P.; Hong, B.; Howarth, R.W. Anthropogenic Phosphorus Inputs to a River Basin and Their Impacts on Phosphorus Fluxes Along Its Upstream-Downstream Continuum. J. Geophys. Res. Biogeosci. 2017, 122, 3273–3287. [Google Scholar] [CrossRef]
  12. Zhang, W.; Swaney, D.P.; Hong, B.; Howarth, R.W.; Han, H.; Li, X. Net anthropogenic phosphorus inputs and riverine phosphorus fluxes in highly populated headwater watersheds in China. Biogeochemistry 2015, 126, 269–283. [Google Scholar] [CrossRef]
  13. Russell, M.J.; Weller, D.E.; Jordan, T.E.; Sigwart, K.J.; Sullivan, K.J. Net anthropogenic phosphorus inputs: Spatial and temporal variability in the Chesapeake Bay region. Biogeochemistry 2008, 88, 285–304. [Google Scholar] [CrossRef]
  14. Howarth, R.W.; Anderson, D.; Church, T.; Greening, H.; Hopkinson, C.; Huber, W.; Marcus, N.; Naiman, R.; Segerson, K.; Sharpley, A. Clean Coastal Waters—Understanding and Reducing the Effects of Nutrient Pollution; National Academy Press: Washington, DC, USA, 2000. [Google Scholar]
  15. Howarth, R.W.; Billen, G.; Swaney, D.; Townsend, A.; Jaworski, N.; Lajtha, K.; Downing, J.A.; Elmgren, R.; Caraco, N.; Jordan, T.; et al. Regional nitrogen budgets and riverine N & P fluxes for the drainages to the North Atlantic Ocean: Natural and human influences. Biogeochemistry 1996, 35, 75–139. [Google Scholar]
  16. Han, H.; Bosch, N.; Allan, J.D. Spatial and temporal variation in phosphorus budgets for 24 watersheds in the Lake Erie and Lake Michigan basins. Biogeochemistry 2011, 102, 45–58. [Google Scholar] [CrossRef]
  17. Han, Y.; Yu, X.; Wang, X.; Wang, Y.; Tian, J.; Xu, L.; Wang, C. Net anthropogenic phosphorus inputs (NAPI) index application in Mainland China. Chemosphere 2013, 90, 329–337. [Google Scholar] [CrossRef]
  18. Hong, B.; Swaney, D.P.; Mörth, C.M.; Smedberg, E.; Hägg, H.E.; Humborg, C.; Howarth, R.W.; Bouraoui, F. Evaluating regional variation of net anthropogenic nitrogen and phosphorus inputs (NANI/NAPI), major drivers, nutrient retention pattern and management implications in the multinational areas of Baltic Sea basin. Ecol. Model. 2012, 227, 117–135. [Google Scholar] [CrossRef]
  19. Hong, B.; Swaney, D.P.; Mccrackin, M.; Svanbäck, A.; Humborg, C.; Gustafsson, B.; Yershova, A.; Pakhomau, A. Advances in NANI and NAPI accounting for the Baltic drainage basin: Spatial and temporal trends and relationships to watershed TN and TP fluxes. Biogeochemistry 2017, 133, 245–261. [Google Scholar] [CrossRef]
  20. Gao, W.; Gao, B.; Yan, C.A.; Liu, Y. Evolution of anthropogenic nitrogen and phosphorus inputs to Lake Poyang Basin and its’ effect on water quality of lake. Acta Sci. Circumstantiate 2016, 36, 3137–3145. [Google Scholar]
  21. Zhang, W.S.; Su, J.J.; Du, X.Z.; Li, X.-Y. Net anthropogenic nitrogen input to Huaihe River Basin, China during 1990–2010. J. Appl. Ecol. 2015, 26, 1831–1839. [Google Scholar]
  22. Yang, X.X. Analysis on total phosphorus and total nitrogen pollution in Erhai Lake. Yunnan Environ. Sci. 2006, 25, 113–115. [Google Scholar]
  23. Li, Y.; Lei, Q.L.; Luo, J.F.; Lindsey, S.; Qin, L.; Zhai, L.; Wang, H.; Wu, S.; Li, W. Impact of human activities on phosphorus flows on an early eutrophic plateau: A case study in Southwest China. Sci. Total Environ. 2020, 714, 136851.1–136851.10. [Google Scholar] [CrossRef]
  24. Xiang, S.; Wu, Y.; Lv, Z.-J.; Gao, S.-J.; Chu, Z.S.; Pang, Y. Characteristics and Spatial Distribution of Agricultural Non-Point Source Pollution in Erhai Lake Basin and Its Classified Control Strategy. Res. Environ. Sci. 2020, 33, 2474–2483. [Google Scholar]
  25. Cai, Z.C.; Wang, S.; Chen, Y.; Gao, W. Estimating multiple spatiotemporal driving forces of anthropogenic phosphorus inputs to Yangtze River Economic Belt. Environ. Sci. Technol. 2020, 43, 197–204. [Google Scholar]
  26. Miao, J.D.; Zhang, X.M.; Wei, T.X. Temporal and spatial distribution characteristics of net nitrogen and phosphorus input from human activity: A case study of Hangzhou section of Qiandao Lake Basin. China Environ. Sci. 2021, 41, 2831–2842. [Google Scholar]
  27. Deng, C.N.; Zhang, Z.Q.; Xu, R.; Li, H.; Zou, T.; Tang, Q.; Liu, W.; Nie, C.; Zhao, Y. Spatiotemporal Evolution and Driving Factors of Nitrogen and Phosphorus Input from Human Activities in Chengdu-Chongqing Economic Circle. Res. Environ. Sci. 2022, 35, 1596–1604. [Google Scholar]
  28. Chen, Y.H.; Mao, Y.P.; Zhang, H. Characteristics of anthropogenic net input of nitrogen and phosphorus and suggestions on pollution control in Pearl River Delta. Chin. J. Environ. Eng. 2022, 16, 2049–2060. [Google Scholar]
  29. Ma, H.; Lei, Q.L.; Du, X.Z.; An, M.; Liu, X.; Qiu, W.; Wu, S.; Liu, H. Spatio-temporal variation and the impacts from parameters analysis of net anthropogenic phosphorus inputs in Henan province. China Environ. Sci. 2022, 42, 1318–1326. [Google Scholar]
  30. Yang, S.J.; Zhang, A.P.; Yang, S.Q.; Yang, S.Q. Investigation of agricultural non-point source pollution in Ningxia irrigation district and analysis of its factors. Agric. Res. Arid Areas 2009, 27, 256–260. [Google Scholar]
  31. Xiao, Y.Z.; Qing, W.Z.; Hui, Z.; Hussain, H.A.; Shaaban, M.; Yang, Z. Pathways of nitrogen loss and optimized nitrogen management for a rice cropping system in arid irrigation region, northwest China. J. Environ. Manag. 2020, 268, 110702. [Google Scholar]
  32. Ma, X.; Li, A.; Wang, X.S.; Kong, D.; Qiu, S.; He, Y.; Yin, Y.S.; Liu, Y.F.; Liu, R.B. Spectral Method for Predicting Nitrogen, Phosphorus, and potassium in small Amount of Compound Fertilizer. Chin. J. Lasers 2021, 48, 158–166. [Google Scholar]
  33. Shang, X.J. Study on Plant Species Selection and Wastewater Purification Efficiency in Constructed Wetlands in Beijing. Bachelor’s Thesis, Chinese Academy of Forestry, Beijing, China, 2009. [Google Scholar]
  34. Zhang, W. Study on Estating Models for Estimation of Per Capita Domestic Wastewater Discharge. Bachelor’s Thesis, Suzhou University of Science and Technology, Suzhou, China, 2010. [Google Scholar]
  35. Ficklin, D.L.; Luo, Y.; Iris, T.; Edwin, S.; Maurer, P. Development and application of a hydroclimatological stream temperature model within the Soil and Water Assessment Tool. Water Resour. Res. 2012, 48, W01511. [Google Scholar] [CrossRef]
  36. Cheng, P.; Zhang, W.S. Spatio-temporal variation characteristics and division analysis of provincial net anthropogenic phosphorus input in mainland China in recent twenty years. Ecol. Environ. Sci. 2019, 28, 540–547. [Google Scholar]
  37. Liu, Y.P.; Xiao, Y.Q.; Zhang, Y. Spatial dstribution of the net anthropogenic phosphorus input (NAPI) to the Dongting Lake basin, China. Chin. J. Appl. Ecol. 2019, 30, 2404–2414. (In Chinese) [Google Scholar]
  38. Pei, W.; Du, X.Z.; Lei, Q.L.; Yan, T.; Li, Y.; Zhang, T.; Chen, M.; Wu, S.; Liu, H. Spatiotemporal variation of net anthropogenic nitrogen input at county level and the impacts from parameters: A case study of Henan Province. China Environ. Sci. 2021, 41, 4447–4456. [Google Scholar]
  39. Gong, H.B.; Hu, J.W.; Rui, X.; Wang, Y.; Zhu, N. Drivers of change behind the spatial distribution and fate of typical trace organic pollutants in fresh waste leachate across China. Water Res. 2024, 263, 122170. [Google Scholar] [CrossRef]
  40. Lian, H.S.; Lei, Q.L.; Zhang, X.Y.; Yen, H.; Wang, H.; Zhai, L.; Liu, H.; Huang, C.; Ren, T.; Zhou, J.; et al. Effects of anthropogenic activities on long-term changes of nitrogen budget in a plain river network region: A case study in the Taihu Basin. Sci. Total Environ. 2018, 645, 1212–1220. [Google Scholar]
  41. Pei, W.; Yan, T.Z.; Lei, Q.L.; Zhang, T.; Fan, B.; Du, X.; Luo, J.; Lindsey, S.; Liu, H. Spatio-temporal variation of net anthropogenic nitrogen inputs (NANI) from 1991 to 2019 and its impacts analysis from parameters in Northwest China. J. Environ. Manag. 2022, 321, 115996. [Google Scholar] [CrossRef]
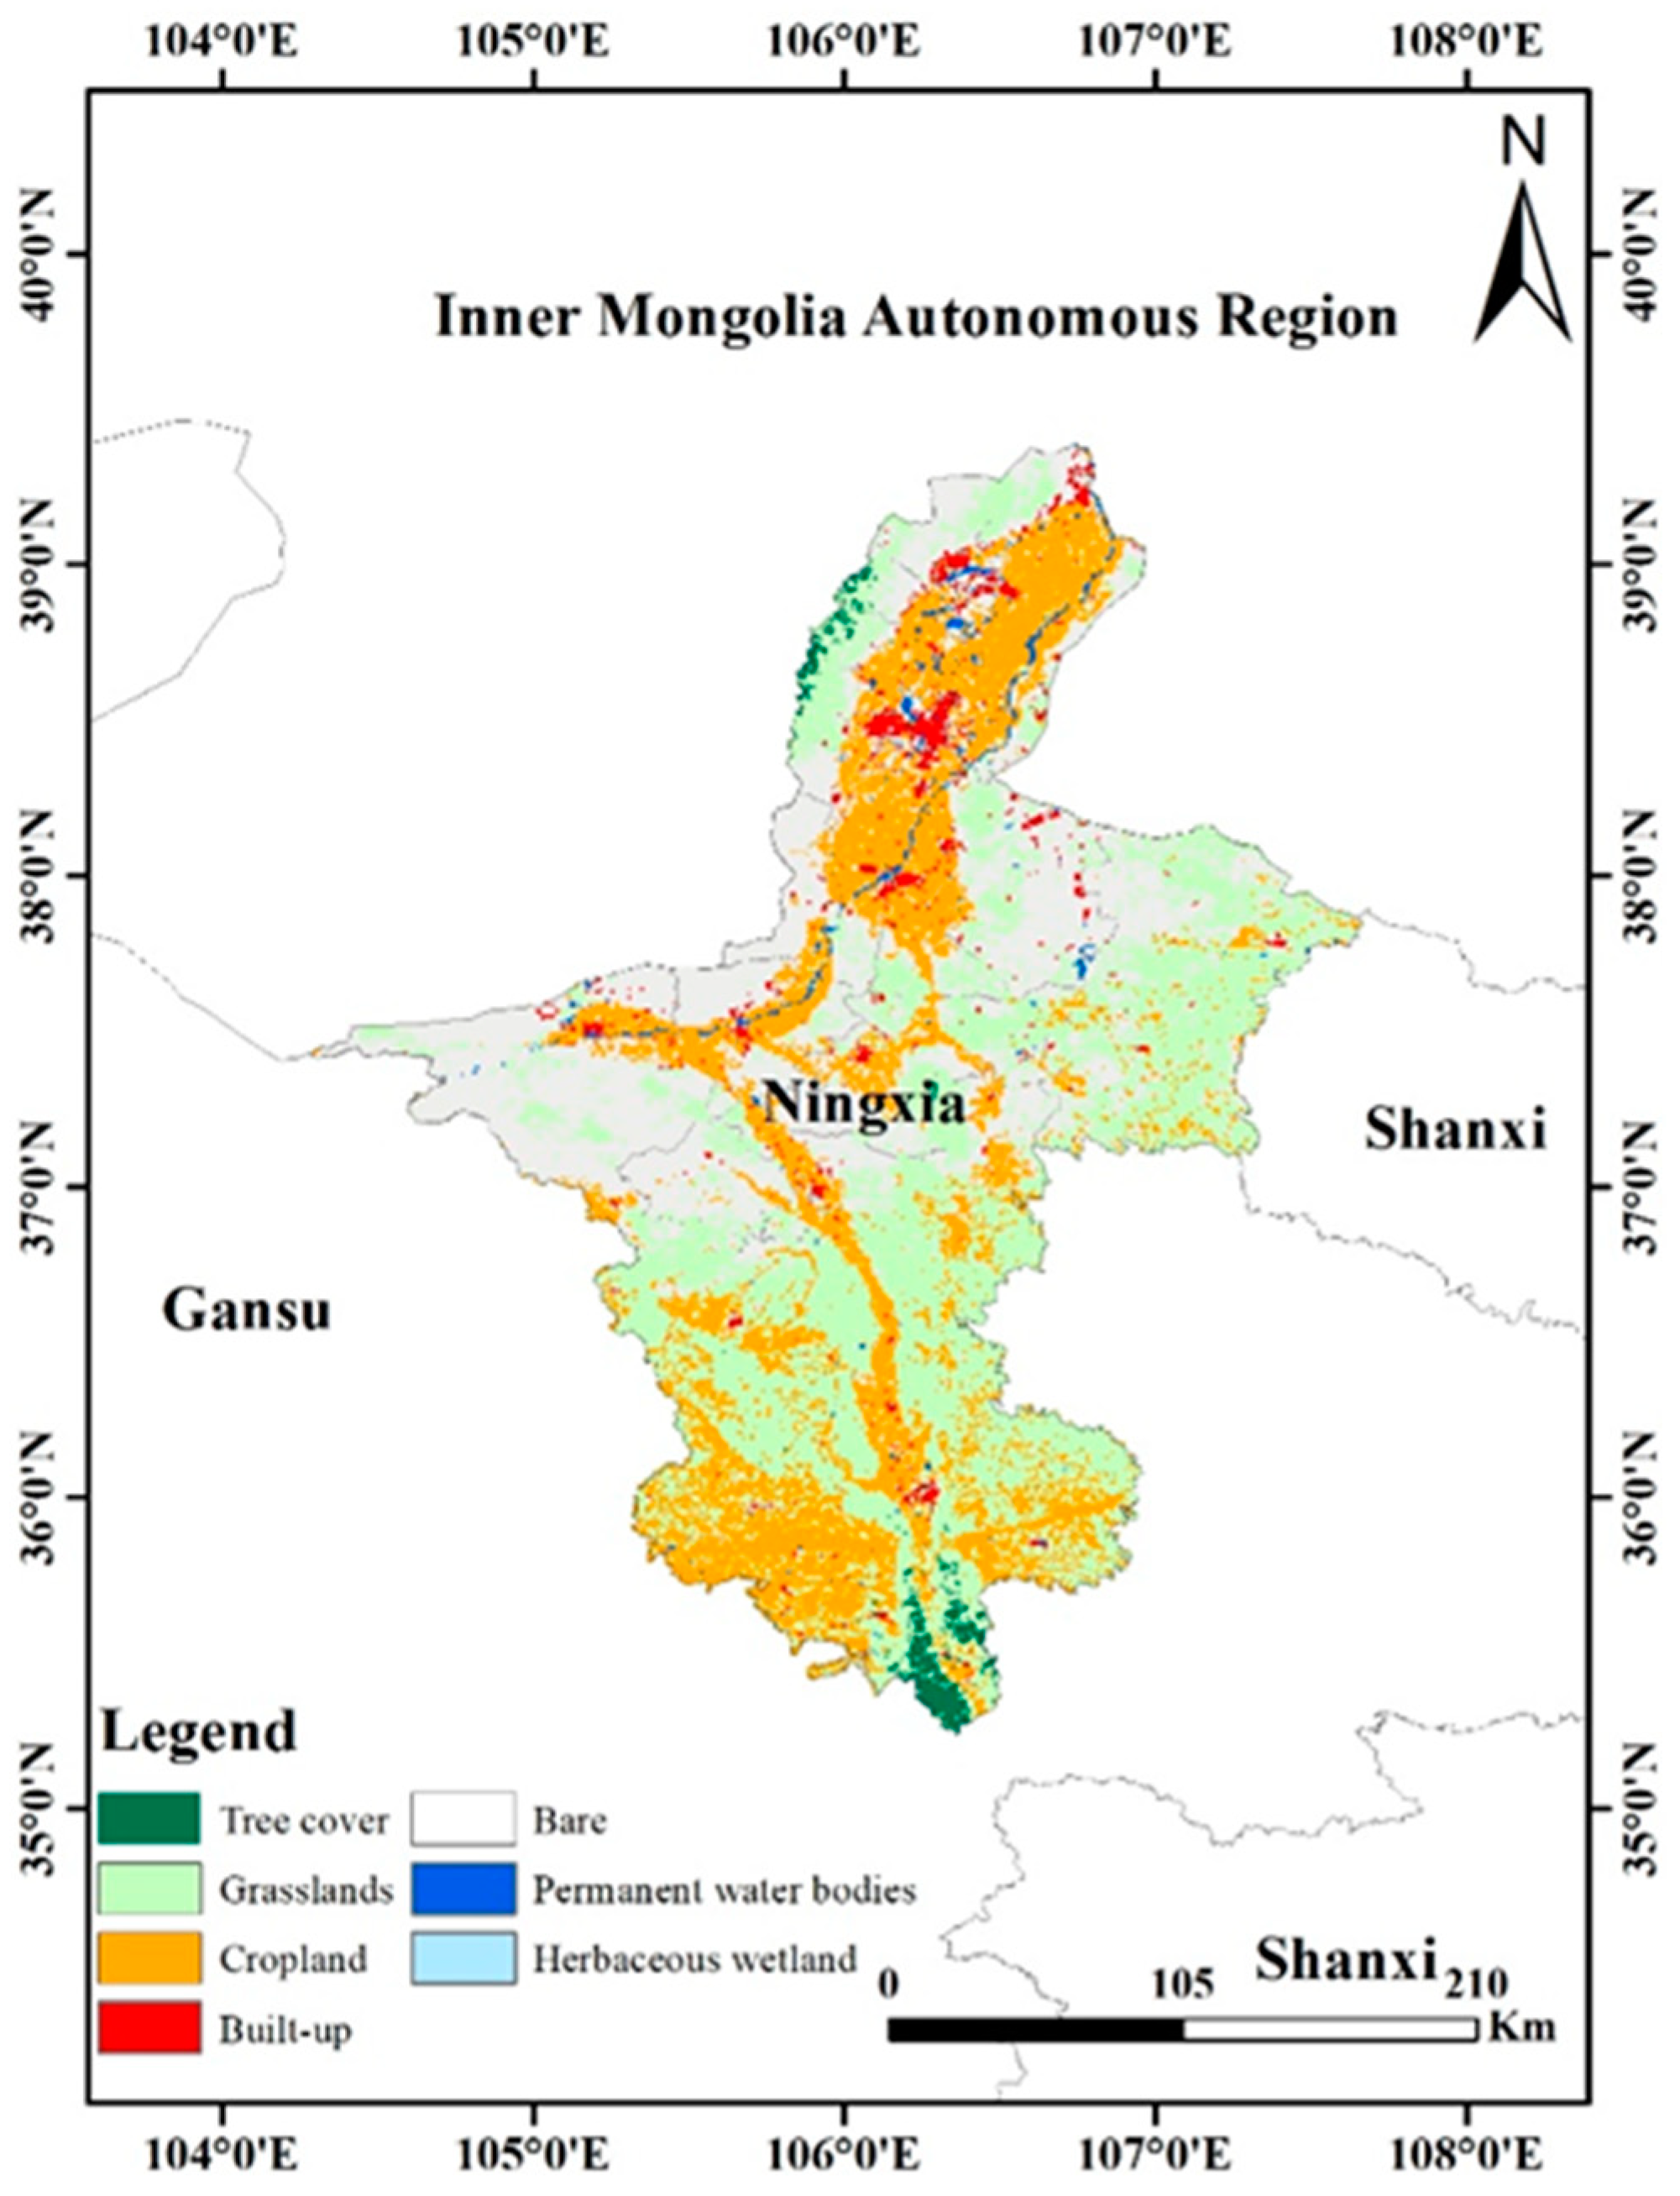
Figure 1. Land use map in Ningxia.
Water 16 03160 g001
Figure 2. Temporal change in NAPI in Ningxia from 1991 to 2020.
Water 16 03160 g002
Figure 3. Proportion for each input component in Ningxia from 1991 to 2020.
Water 16 03160 g003
Figure 4. Spatial distribution of average NAPI in Ningxia on a county scale from 1991 to 2020.
Water 16 03160 g004
Table 1. Phosphorus content in human food.
Crop TypeP (%)Appropriate Parameters
Wheat0.044~0.188 (5)0.167 (8)
Beans0.373~0.465 (6)0.418 (6)
Rice0.074~0.230 (4)0.082 (8)
Corn0.151~0.244 (5)0.196 (8)
Potato0.029~0.052 (4)0.046 (7)
Rapeseed0.210~0.612 (3)0.250 (6)
Vegetable0.012~0.035 (4)0.028
Grape0.008~0.0160.013 (6)
Note: The parameters in this study were chosen based on their relevance to the local context or their frequency of use in current research. The numbers in parentheses next to the parameter range indicate the sample size of the literature reviewed, and the following abbreviations have the same meaning throughout the text.
Table 2. Estimated livestock phosphorus intake and excretion rate and the edible proportion of livestock.
Livestock TypesScope of Phosphorus Intake
[kg/(capita·a)]
Appropriate Parameters
[kg/(capita·a)]
Scope of Phosphorus Excretion
[kg/(capita·a)]
Appropriate Parameters
[kg/(capita·a)]
Proportion of Edible Portion
(%)
Dairy13.90~26.13 (5)14.996.54~22.809.78 (4)79.5
Beef5.11~10.99 (5)5.74 (6)3.48~9.49 (4)3.84 (4)79.5
Pork1.21~3.59 (6)3.480.32~0.63 (5)0.4987.1
Poultry0.03~0.18 (4)0.090.003~0.03 (4)0.018 (5)85.0
Sheep1.22~3.81 (5)1.26 (6)0.17~1.060.8975.7
Table 3. The fluctuation range of NAPI input components as affected by parameter and the calculation results of conventional parameters.
YearPfer
[kg/(km2·a)]
Pim
[kg/(km2·a)]
NAPI
[kg/(km2·a)]
1998665~712/67786~174/113790~1053/1051
2003645~697/653130~225/149843~1032/933
2008827~902/851101~167/1181039~1284/1231
2013984~1091/100198~160/1101208~1396/1336
2018810~859/822101~192/1311146~1402/1154
Table 4. Calculation results based on a random sample of 5000 taken from the period of 1993 to 2018.
NAPI199319982003200820132018
MinMaxMinMaxMinMaxMinMaxMinMaxMinMax
Yinchuan6597591122127911891247128513241150124113701584
Yongning897114476412779581241134117841524166014781573
Helan121514041954227820292341222125932174230923112781
Dawukou148156140150380413220396413578279660
Pingluo8591242625104213582322264935433194333832633515
Huinong43347842643951458678189495710128211014
Litong99011881594205218361926187419992072231222282509
Qingtongxia46356584197810111221124713511224152111271347
Hongsipu278314421496500532511741784860710845
Zhongwei243279392456433463389484418522357405
Zhongning233276220287471544524559557693547792
Lingwu495604469753441574473597551742644751
Yanchi181284125353121268147401225549178427
Tongxin200312267477535703574661560744308554
Guyuan7641205801128910261341111414521259133110441271
Haiyuan255396242401287384306542312593207448
Xiji602739941117920592447256328802895337027733070
Longde486522453524690845124816471879205818802114
Jingyuan156201159210164220170254340499325514
Pengyang3323836547478671023115915781674199215421880
Table 5. Sensitivity index categories.
IndexSensitivity
0.00 ≤ |I| ≤ 0.05Small to negligible
0.05 ≤ |I| ≤ 0.20Medium
0.20 ≤ |I| ≤ 1.00High
|I| ≥ 1.00Very high
Table 6. Parameter sensitivity index in Ningxia.
ParametersYear
1991199520002005201020152020Average
P intake of per person0.0300.0330.0360.0270.0200.0250.0290.029
P intake of cattle0.0270.0220.0230.0210.0100.0110.0090.018
P intake of pig0.0100.0100.0110.0120.0120.0130.0100.011
P excretion of cattle0.0710.0800.0770.0740.0680.0700.0650.072
P excretion of pig0.0110.0130.0110.0120.0140.0140.0130.013
P content of wheat−0.033−0.033−0.029−0.028−0.032−0.032−0.033−0.031
P content of corn−0.022−0.021−0.021−0.019−0.024−0.023−0.030−0.023
P fertilizer0.1100.1280.1110.1340.1150.2150.2500.152
Non-food P0.0110.0120.0130.0110.0110.0110.0090.011
Disclaimer/Publisher’s Note: The statements, opinions and data contained in all publications are solely those of the individual author(s) and contributor(s) and not of MDPI and/or the editor(s). MDPI and/or the editor(s) disclaim responsibility for any injury to people or property resulting from any ideas, methods, instructions or products referred to in the content.