Article

Long-Term Spatiotemporal Trends in Precipitation, Temperature, and Evapotranspiration Across Arid Asia and Africa

1
Key Laboratory of Ecological Safety and Sustainable Development in Arid Lands, Northwest Institute of Eco-Environment and Resources, Chinese Academy of Sciences, Lanzhou 730000, China
2
Low-Carbon and Climate Impact Research Centre, School of Energy and Environment, City University of Hong Kong, Kowloon, Hong Kong SAR 999077, China
3
Fenner School of Environment and Society, Australian National University, Canberra, ACT 2600, Australia
4
Key Laboratory of Cryospheric Science and Frozen Soil Engineering, Northwest Institute of Eco-Environment and Resources, Chinese Academy of Sciences, Lanzhou 730000, China
5
Department of Water Resources Management and Agrometeorology, Federal University, PMB 373, Oye-Ekiti 371104, Ekiti State, Nigeria
*
Author to whom correspondence should be addressed.
Water 2024, 16(22), 3161; https://doi.org/10.3390/w16223161
Submission received: 30 August 2024 / Revised: 17 October 2024 / Accepted: 29 October 2024 / Published: 5 November 2024
(This article belongs to the Special Issue Drought Risk Assessment and Human Vulnerability in the 21st Century)

Abstract

:
This study examines trends in precipitation (PRE), maximum temperature (TMAX), minimum temperature (TMIN), and potential evapotranspiration (PET) using the Modified Mann-Kendall test and Sen’s slope estimator between 1901 and 2022 in the arid lands of Central Asia, West Asia and North Africa. The results reveal complex spatial and temporal climate change patterns across the study area. Annual PRE shows a slight negative trend (Z = −0.881, p = 0.378), with significant decreases from 1951–2000 (Z = −3.329, p = 0.001). The temperatures exhibit strong warming trends (TMIN: Z = 9.591, p < 0.001; TMAX: Z = 8.405, p < 0.001). PET increased significantly (Z = 6.041, p < 0.001), with acceleration in recent decades. Spatially, precipitation decreased by 10% in maximum annual values, while PET increased by 10–15% in many areas. Temperature increases of 2–3 °C were observed, with TMAX rising from 36–39 °C to 39–42 °C in some MENA regions. Seasonal analysis shows winter precipitation decreasing significantly in recent years (Z = −1.974, p = 0.048), while summer PET shows the strongest increasing trend (Z = 5.647, p < 0.001). Spatial analysis revealed clear latitudinal gradients in temperature and PET, with higher values in southern regions. PRE patterns were more complex, with coastal and mountainous areas receiving more precipitation. The combination of rising temperatures, increasing PET, and variable PRE trends suggest an overall intensification of aridity in many parts of the region. This analysis provides crucial insights into the climate variability of these water-scarce areas, emphasizing the need for targeted adaptation strategies in water resource management, agriculture, and ecosystem conservation.

1. Introduction

Global warming remains a critical issue, with the increasing annual temperatures of the world’s oceans and Earth’s atmosphere attributed to natural and anthropogenic factors [1]. Evidence of climate change, primarily indicated by rising temperatures, continues to grow [2,3,4]. As global warming escalates into a major concern for countries and regions worldwide, our understanding of climate change is continually refined [5,6,7,8]. In arid regions, the impacts of global warming are particularly pronounced. These areas, already characterized by scarce water resources and extreme temperatures [9], face heightened vulnerability to climate change. The increasing frequency and intensity of heatwaves and prolonged droughts exacerbate water scarcity and threaten agricultural productivity, biodiversity, and human livelihoods [9,10,11,12]. Analysing the regional distribution characteristics, change patterns, and interrelationships of various climatic elements in arid regions provides substantial practical and theoretical value for understanding the comprehensive, long-term impacts of climate change. Such analysis is crucial for developing adaptive strategies to mitigate the adverse effects on ecosystems and human societies in these vulnerable regions.
The arid regions of North Africa, Central Asia, and West Asia, characterized by diverse climates, topographies, and ecosystems, are experiencing intensifying environmental pressures with far-reaching implications [10]. From the Sahara Desert’s expanding ecological boundaries in North Africa to Central Asia’s complex steppes and mountain ranges and the water-stressed landscapes of West Asia, these regions exhibit heightened sensitivity to climate variations [13]. Recent satellite data and climate reports indicate significant drying trends, temperature anomalies, and altered precipitation patterns across these areas [9,11]. The consequences profoundly affect water resources, agricultural productivity, ecosystem stability, and human settlements. Moreover, the influence of broader climate phenomena, such as the rapid warming and sea-level rise in the Indian Ocean region, amplifies the climatic challenges these arid zones face [11]. The interplay between climate change, water resources, and human activities in these regions has local ramifications and contributes significantly to our global understanding of climate change dynamics [9]. A novel approach to studying these areas involves developing a comprehensive, long-term, multi-scalar trend analysis that integrates atmospheric, hydrological, and socio-economic data. Such analysis could uncover previously unrecognized patterns and feedback loops within the climate system, potentially revealing new climate change propagation and adaptation mechanisms. This is crucial for advancing our predictive capabilities and informing adaptive strategies, ultimately contributing to more effective climate change mitigation and sustainable development policies in vulnerable arid regions and beyond.
Recent studies have revealed complex spatial and temporal patterns of climate change across these areas. In North Africa, projections indicate temperature increases of up to 2 °C and 7 °C in some cities by the end of the century, under Representative Concentration Pathway (RCP) 2.6 and 8.5, respectively, with the Mediterranean climate zone shifting northward at a rate of 30–40 km per decade [14]. Central Asia experienced significant warming of 0.28–0.38 °C per decade from 1979 to 2020, coupled with a slight increase in annual precipitation but substantial seasonal variations. West Asia, particularly the Middle East, faces intense climatic pressures, with projections suggesting an increase of 80–120 heatwave days per year with temperatures exceeding 35 °C by 2100 in some areas [5,15,16]. Moreover, studies have also indicated that urban heat islands can prolong heat waves in tropical areas, whereas their effect is weaker in mid-latitudes, highlighting the influence of urban development on local and regional climate differences [5,17].
Precipitation patterns show complex spatial distributions, with some regions experiencing decreases of 6.3 mm per decade while others see increases of up to 17.6 mm per decade [18]. Extreme events are becoming more frequent, with warm days increasing by 3–4 days per decade [5]. Water resources are also under stress, with significant groundwater depletion rates observed in the northern Middle East. However, most of these studies have primarily focused on specific sub-regions or countries within these vast areas, with limited research providing a comprehensive analysis across the entire arid belt. Additionally, many studies have centred on individual climate parameters or short-term variations, with few investigations covering these regions’ overall climate system variability. Moreover, previous studies have rarely considered the temporal and spatial variations of climate elements at different scales across this extensive arid zone, and they often lack an in-depth analysis of the reasons for climate element changes. This gap in research is particularly significant given the complex interaction of various climatic factors in these arid regions and their potential for far-reaching impacts on local ecosystems and human populations.
To address these limitations, this study aims to conduct a comprehensive, long-term trend analysis of multiple climate factors, including precipitation, temperature, and PET, across the arid lands of North Africa, Central Asia, and West Asia. The specific objectives are (1) to examine annual and seasonal trends using the modified Mann-Kendall (MMK) test and Sen’s Slope estimator, and (2) to identify significant change points in annual and seasonal time series data. This multi-faceted approach, combining long-term trend analysis and comprehensive spatial coverage across three major arid regions, will contribute significantly to our understanding of climate variability in these crucial regions. The findings from this study will not only fill critical gaps in the current literature but also provide valuable insights for regional climate adaptation strategies and policymaking in the face of ongoing global climate change.

2. Study Area and Data
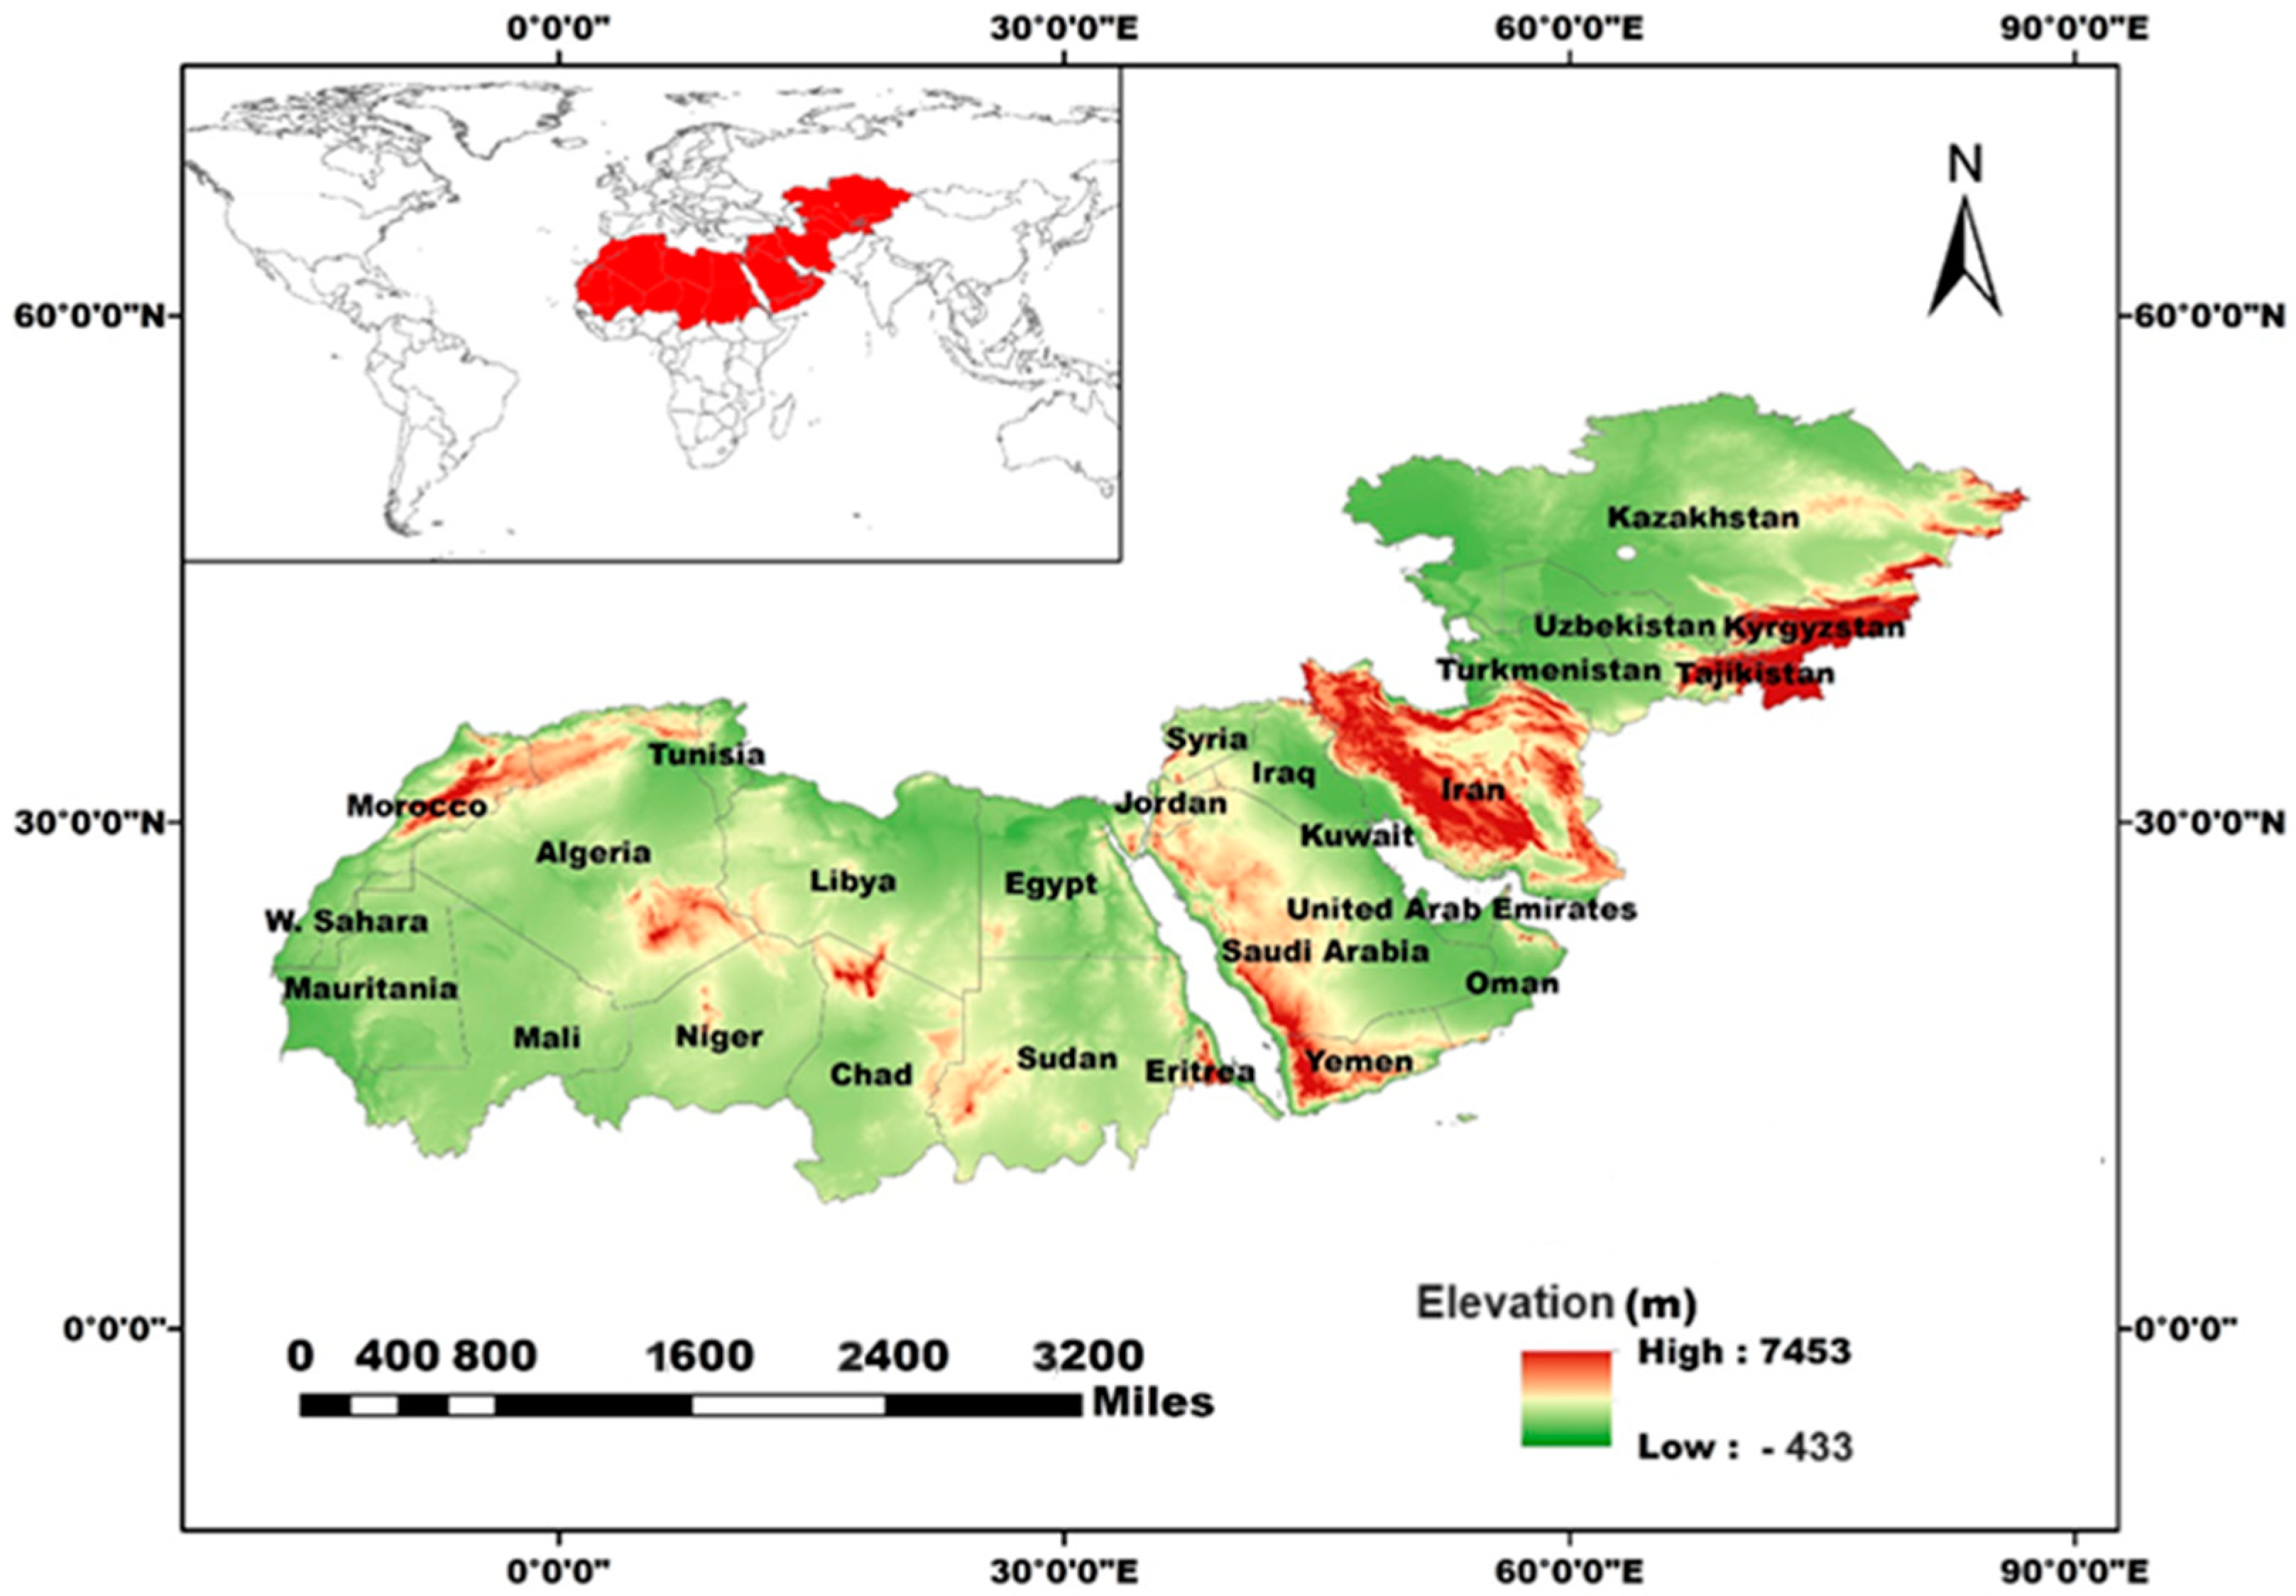
2.1. Study Area

The arid regions of Central and Western Asia and North Africa represent a vast and interconnected system of extreme environments, encompassing iconic deserts such as the Sahara, Arabian, and Gobi. Spanning latitudes from 15° N to 45° N and longitudes from 25° E to 120° E, this region presents a tapestry of unique geological formations, specialized ecological communities, and a dynamic climatic regime (Figure 1). Understanding the relationship of these factors is crucial for addressing critical issues such as desertification, climate change impacts, and sustainable resource management in arid landscapes. Geographically, these regions are dominated by extensive desert landscapes, punctuated by significant mountain ranges like the Atlas Mountains in North Africa and the Zagros Mountains in Iran [19]. This topography, shaped by both tectonic activity and aeolian processes, results in diverse landforms, from vast sand seas and gravel plains to rocky plateaus and salt flats [20]. This geomorphological diversity provides a natural laboratory for investigating the interplay of wind, water, and tectonic forces in shaping arid landscapes [21]. Despite the harsh conditions, these arid regions support a surprisingly diverse array of life. Vegetation is characterized by xerophytic adaptations to drought and extreme temperatures. Iconic species include the date palm (Phoenix dactylifera) and acacia trees (Acacia spp.) in the Sahara, the ghaf tree (Prosopis cineraria) in the Arabian Desert, and the drought-resistant saxaul (Haloxylon ammodendron) in the Gobi Desert. These plant communities are critical in stabilizing soils, providing habitat, and influencing local microclimates. The climate of these regions is defined by its extremes. Annual precipitation is often less than 250 mm, with significant spatial and temporal variability [11]. Temperatures fluctuate dramatically, exceeding 40 °C in summer and dropping below freezing in winter. The Sahara experiences a hot desert climate (BWh), while the Gobi Desert exhibits a cold desert climate (BWk) [22]. The terrain elevation of the study area and the country boundaries are illustrated in Figure 1.

2.2. Data Sources

The digital elevation model (DEM) data utilized in this study were obtained from the National Aeronautics and Space Administration (NASA) Shuttle Radar Topography Mission (SRTM) Global 30 m dataset, accessed and processed through Google Earth Engine. This dataset provides a spatial resolution of 30 m and offers near-global coverage of Earth’s land surface. The meteorological data, which include monthly measurements of precipitation (PRE), maximum temperature (TMAX), minimum temperature (TMIN), and potential evapotranspiration (PET), were sourced from the Climatic Research Unit’s dataset (CRU TS 4.07). These variables directly influence water availability, thermal stress, and evaporative demand, which are critical factors affecting ecosystem dynamics, water resources, and human activities in water-scarce environments of Central and Western Asia and North Africa. These datasets are available through the Climate Impacts LINK project of the Climate Research Unit, University of East Anglia, Norwich, UK via https://crudata.uea.ac.uk/cru/data/hrg/cru_ts_4.07/cruts.2304141047.v4.07/ (accessed on 10 July 2024). The CRU dataset consists of monthly gridded time series of climatic variables at a 0.5° latitude/longitude resolution, spanning 1901 to 2022.
We chose the CRU dataset because it is an essential and extensively utilized dataset in global climate research. It offers an extensive historical record vital for examining historical and current climate trends, variability, and changes, as demonstrated in our study. This dataset supports various research areas, such as climate modelling, impact analysis, and attribution studies. Additionally, it is accompanied by comprehensive documentation detailing its data sources, processing techniques, and quality assurance protocols.
The post-processing procedure for the CRU TS 4.07 dataset encompassed several methodological steps. Initially, the climatological variables were extracted from netCDF files utilizing Python’s xarray library, focusing on the specified temporal and spatial domains of the study area. Subsequently, quality control procedures were implemented to identify and mitigate anomalies and statistical outliers. Temporal aggregation was performed to derive seasonal (December-January-February (DJF), March-April-May (MAM), June-July-August (JJA), and September-October-November (SON)) and annual composites from the monthly data. The cumulative values of PRE and PET were calculated, while TMIN and TMAX were averaged over the respective periods. To ensure the robustness of the post-processed dataset, a validation procedure was conducted by comparing the derived values against independent local meteorological station records. These steps facilitated the creation of a high-quality, temporally consistent climatological dataset suitable for subsequent analyses in our research framework.

3. Research Methods

3.1. Basic Statistics

This study employed a suite of statistical measures to characterize the meteorological time series data (PRE, TMAX, TMIN and PET). Central tendency was assessed using the arithmetic mean (μ), while data dispersion was quantified through standard deviation (σ) and coefficient of variation (CV). To evaluate distribution asymmetry, we calculated skewness, and the distribution’s tail was examined using kurtosis. Particular attention was given to distinguishing between mesokurtic distributions, which approximate normal distribution kurtosis, and platykurtic distributions, characterized by lower kurtosis values.

3.2. Modified Mann-Kendall (MMK) Test

The MMK Test is an advanced version of the original Mann-Kendall test, designed to address the issue of serial correlation in time series data. This modification is particularly crucial in climate studies, where autocorrelation is common and can lead to an increased probability of detecting a significant trend when one does not exist (Type I error) [2,23]. Several studies have used this method for various climatic and hydrological data [2,24]. The MMK test begins with the calculation of the S statistic, similar to the original Mann-Kendall test:
S = i = 1 n 1 j = i + 1 n s i g n ( x j x i )
where the sign function is used to assess whether x j is greater than, equal to, or less than x i . x j and x i are the sequential data values, n is the length of the dataset, and
sign x j x i = 1         i f x j x i > 0 0         i f x j x i = 0 1       i f x j x i < 0  
The variance of S, Var(S), is then calculated considering the autocorrelation structure of the data:
Var S = n n 1 2 n + 5 i = 1 m   t i t i 1 2 t i + 5 18 × n n s *
where m is the number of tied groups, t i is the number of ties of extent i, and n s * is the effective sample size, given by:
n s * = n 1 + 2 i = 1 n 1   n i n ρ s ( i )  
Here, ρ s ( i ) is the autocorrelation function of the ranks of the observations.
The test statistic Z is then computed as follows:
Z = S 1 V a r ( S )         i f   S > 0 0                                     i f   S = 0 S + 1 V a r ( S )         i f   S < 0
The null hypothesis of no trend is rejected if |Z| > Z1 − α/2, where Z1 − α/2 is the value of the standard normal distribution with a probability of exceedance of α/2.
We subsequently use Sen’s slope to estimate the magnitude of the trends. Sen’s slope is a non-parametric estimator used to determine the slope of a linear trend in a time series. It is particularly robust against outliers. The equation for Sen’s slope is based on the median of slopes calculated between all pairs of data points.
The formula for calculating Sen’s slope (β) is the following:
β = median y j y i x j x i
where yi and yj are the data values at times xi and xj, respectively. i < j, meaning the calculation will be done for all pairs where the second index is greater than the first; the median is taken over all calculated slopes.
Z-score quantifies data points’ distance from the mean in standard deviations, enabling cross-dataset comparisons. p-value indicates the probability of obtaining results as extreme as observed, assuming the null hypothesis is true; smaller values (≤0.05) suggest stronger evidence against it. Kendall Tau measures the ordinal association between variables. Sen’s slope estimates linear trends non-parametrically, is useful for time series, and is robust against outliers.
The study period from 1901 to 2022 is divided into three climatological epochs (1901–1950, 1951–2000, and 2001–2022) to delineate climatic conditions influenced by human activity. The first epoch (1901–1950) represents pre-industrial and early-industrial climates, providing a natural variability baseline before significant human impacts. The second period (1951–2000) marks the post-World War II phase, noted for rapid industrialization and increased greenhouse gas emissions, leading to notable climate disruptions. The third epoch (2001–2022) signifies current climate dynamics, highlighting intensified thermal forcing and hydrological alterations amid growing global climate awareness and policy responses. This tripartite framework enables a detailed examination of climate progression across varying human influence stages.

3.3. Change Point Analysis

Segmented models are statistical tools used to detect changes in the statistical properties of a time series or data sequence. They effectively identify structural changes or change points, signalling shifts in the data’s underlying process. These changes can appear as sudden shifts in mean, variance, trend, or other attributes [2]. This technique was used to analyse annual and seasonal PRE, TMIN, TMAX, and PET time series change points.

3.4. Kriging Interpolation Method

The Kriging interpolation method is used to estimate the optimal, linear, and unbiased interpolation of spatially distributed data. It uses known partial spatial sample information to estimate unknown geographic spatial features and is an essential component of GIS. Kriging assumes that attributes with spatial continuity are irregular and described using random models rather than simple function simulations. This method effectively handles extreme values and can avoid the “bull’s eye” phenomenon. Ordinary Kriging is the most common and widely used Kriging interpolation method. Its interpolation process is similar to weighted sliding averaging of the expected value of the variable in the unknown area based on sample points.
Despite the existence of various methods for spatial interpolation, no single method is universally optimal. In this study, the Ordinary Kriging interpolation method was chosen considering the characteristics and usage of each meteorological element (PRE, TMIN, TMAX and PET) and the resolution of the gridded datasets. Various standard functions were used for theoretical semi-variogram modelling during the interpolation process. The spherical model was selected to fit the semi-variogram to achieve unbiased estimation under the assumption of second-order stationarity.

4. Results and Discussion

4.1. Temporal Analysis of Climatic Parameters

4.1.1. General Descriptive Statistics

Table S1 provides a comprehensive overview of PRE, TMAX, TMIN, and PET across months, seasons, annual scale, and their basic statistical metrics for the study area. This extensive dataset offers valuable insights into the climate characteristics and variability of these water-scarce areas, which are crucial for understanding regional climate dynamics and their potential impacts on water resources, ecosystems, and human activities. The PRE data reveal significant variability across different months and seasons. The mean monthly precipitation ranges from 11.43 mm in February to 31.12 mm in August. The coefficient of variation (CV) indicates high variability, especially in October (27.06%) and November (21.72%), suggesting that these months experience more erratic precipitation patterns. This variability can be attributed to the influence of different climatic systems, such as the moisture vapor transport from the Mediterranean and African and Asian monsoon influences [9,25]. The skewness and kurtosis values indicate that the precipitation distribution is nearly symmetrical and mesokurtic for most months, with slight positive skewness in May (0.24) and July (0.22). These findings align with previous studies that have documented the erratic nature of precipitation in arid regions [26]. The precipitation data also reveal significant seasonal and annual variability across the study area. Annual precipitation ranges from 149.55 mm to 228.66 mm, with a mean of 190.92 mm, indicating the overall arid nature of the region. This aligns with the findings of Nicholson [25], who reported similar precipitation ranges for the MENA region. Seasonal analysis shows that summer (JJA) experiences the highest precipitation (mean: 69.51 mm), followed by spring (MAM: 43.97 mm), autumn (SON: 40.30 mm), and winter (DJF: 37.15 mm). This seasonal pattern is consistent with the monsoon-influenced climate in parts of the study area, particularly in West Asia [27]. The CV for PRE is notably high, ranging from 11.79% to 27.06% across different seasons. This high variability is characteristic of arid regions and poses significant challenges for water resource management and agriculture [5,9].
The TMAX data show a clear seasonal trend, with the highest mean temperatures in July (36.38 °C) and the lowest in January (15.65 °C). The CV values are relatively low, indicating less variability in TMAX compared to precipitation. The skewness values suggest a slight positive skew for most months, with the highest skewness observed in March (0.69). The kurtosis values are near zero, indicating a normal distribution for most months. The increase in TMAX during summer can be attributed to the high insolation and the lack of cloud cover in arid regions. TMAX shows a clear seasonal pattern, with summer experiencing the highest mean temperatures (35.89 °C) and winter the lowest (16.94 °C). The annual mean TMAX is 27.15 °C, with a relatively low CV of 1.90%, indicating consistent high temperatures throughout the year.
The TMIN data also exhibit clear seasonal trends, with the highest mean temperatures in July (22.56 °C) and the lowest in January (3.06 °C). The CV values are higher than TMAX, indicating greater variability in TMIN. The skewness values suggest a slight positive skew for most months, with the highest skewness observed in July (0.81). The positive skewness values in most months suggest a tendency towards higher TMIN, reflecting a warming trend consistent with global climate change. The kurtosis values are negative for most months, indicating a platykurtic distribution. These findings align with the results of Donat et al. [3], who documented similar trends in TMIN in arid regions. The higher variability in TMIN can be attributed to local factors such as topography and land use changes. The TMIN follows a similar seasonal pattern, ranging from a mean of 4.19 °C in winter to 21.86 °C in summer, with an annual average of 13.52 °C. The CV for TMIN (4.09% annually) is higher than for TMAX, suggesting greater variability in night-time temperatures. These temperature patterns are consistent with those reported by Zittis et al. [14] for the MENA region, highlighting the extreme heat conditions in these arid areas. TMIN has also been rising in North Africa, particularly in urban areas, due to the urban heat island effect [5].
The PET data indicate high values throughout the year, reflecting the high evaporative demand in arid regions. The mean monthly PET ranges from 75.95 mm in December to 213.79 mm in June. The CV values are relatively low, indicating less variability in PET than PRE. The skewness values suggest a slight positive skew for most months, with the highest skewness observed in March (0.95). The kurtosis values are near zero, indicating a normal distribution for most months. These PET trends are consistent with the findings of Hargreaves and Samani (1985), who reported similar PET values for arid regions. The high PET values indicate the high energy availability and the prevalent low humidity conditions in these regions. PET values demonstrate the high atmospheric water demand characteristic of arid regions. Annual PET ranges from 1683.11 mm to 1806.33 mm, with a mean of 1729.94 mm. This far exceeds the annual PRE, underscoring the water-limited nature of the ecosystem. Seasonally, summer exhibits the highest PET (mean: 615.18 mm), followed by spring (480.65 mm), autumn (380.84 mm), and winter (253.28 mm). The relatively low CV values for PET (ranging from 1.35% to 2.01% seasonally) indicate consistently high evaporative demand throughout the year, typical of arid climates [28].

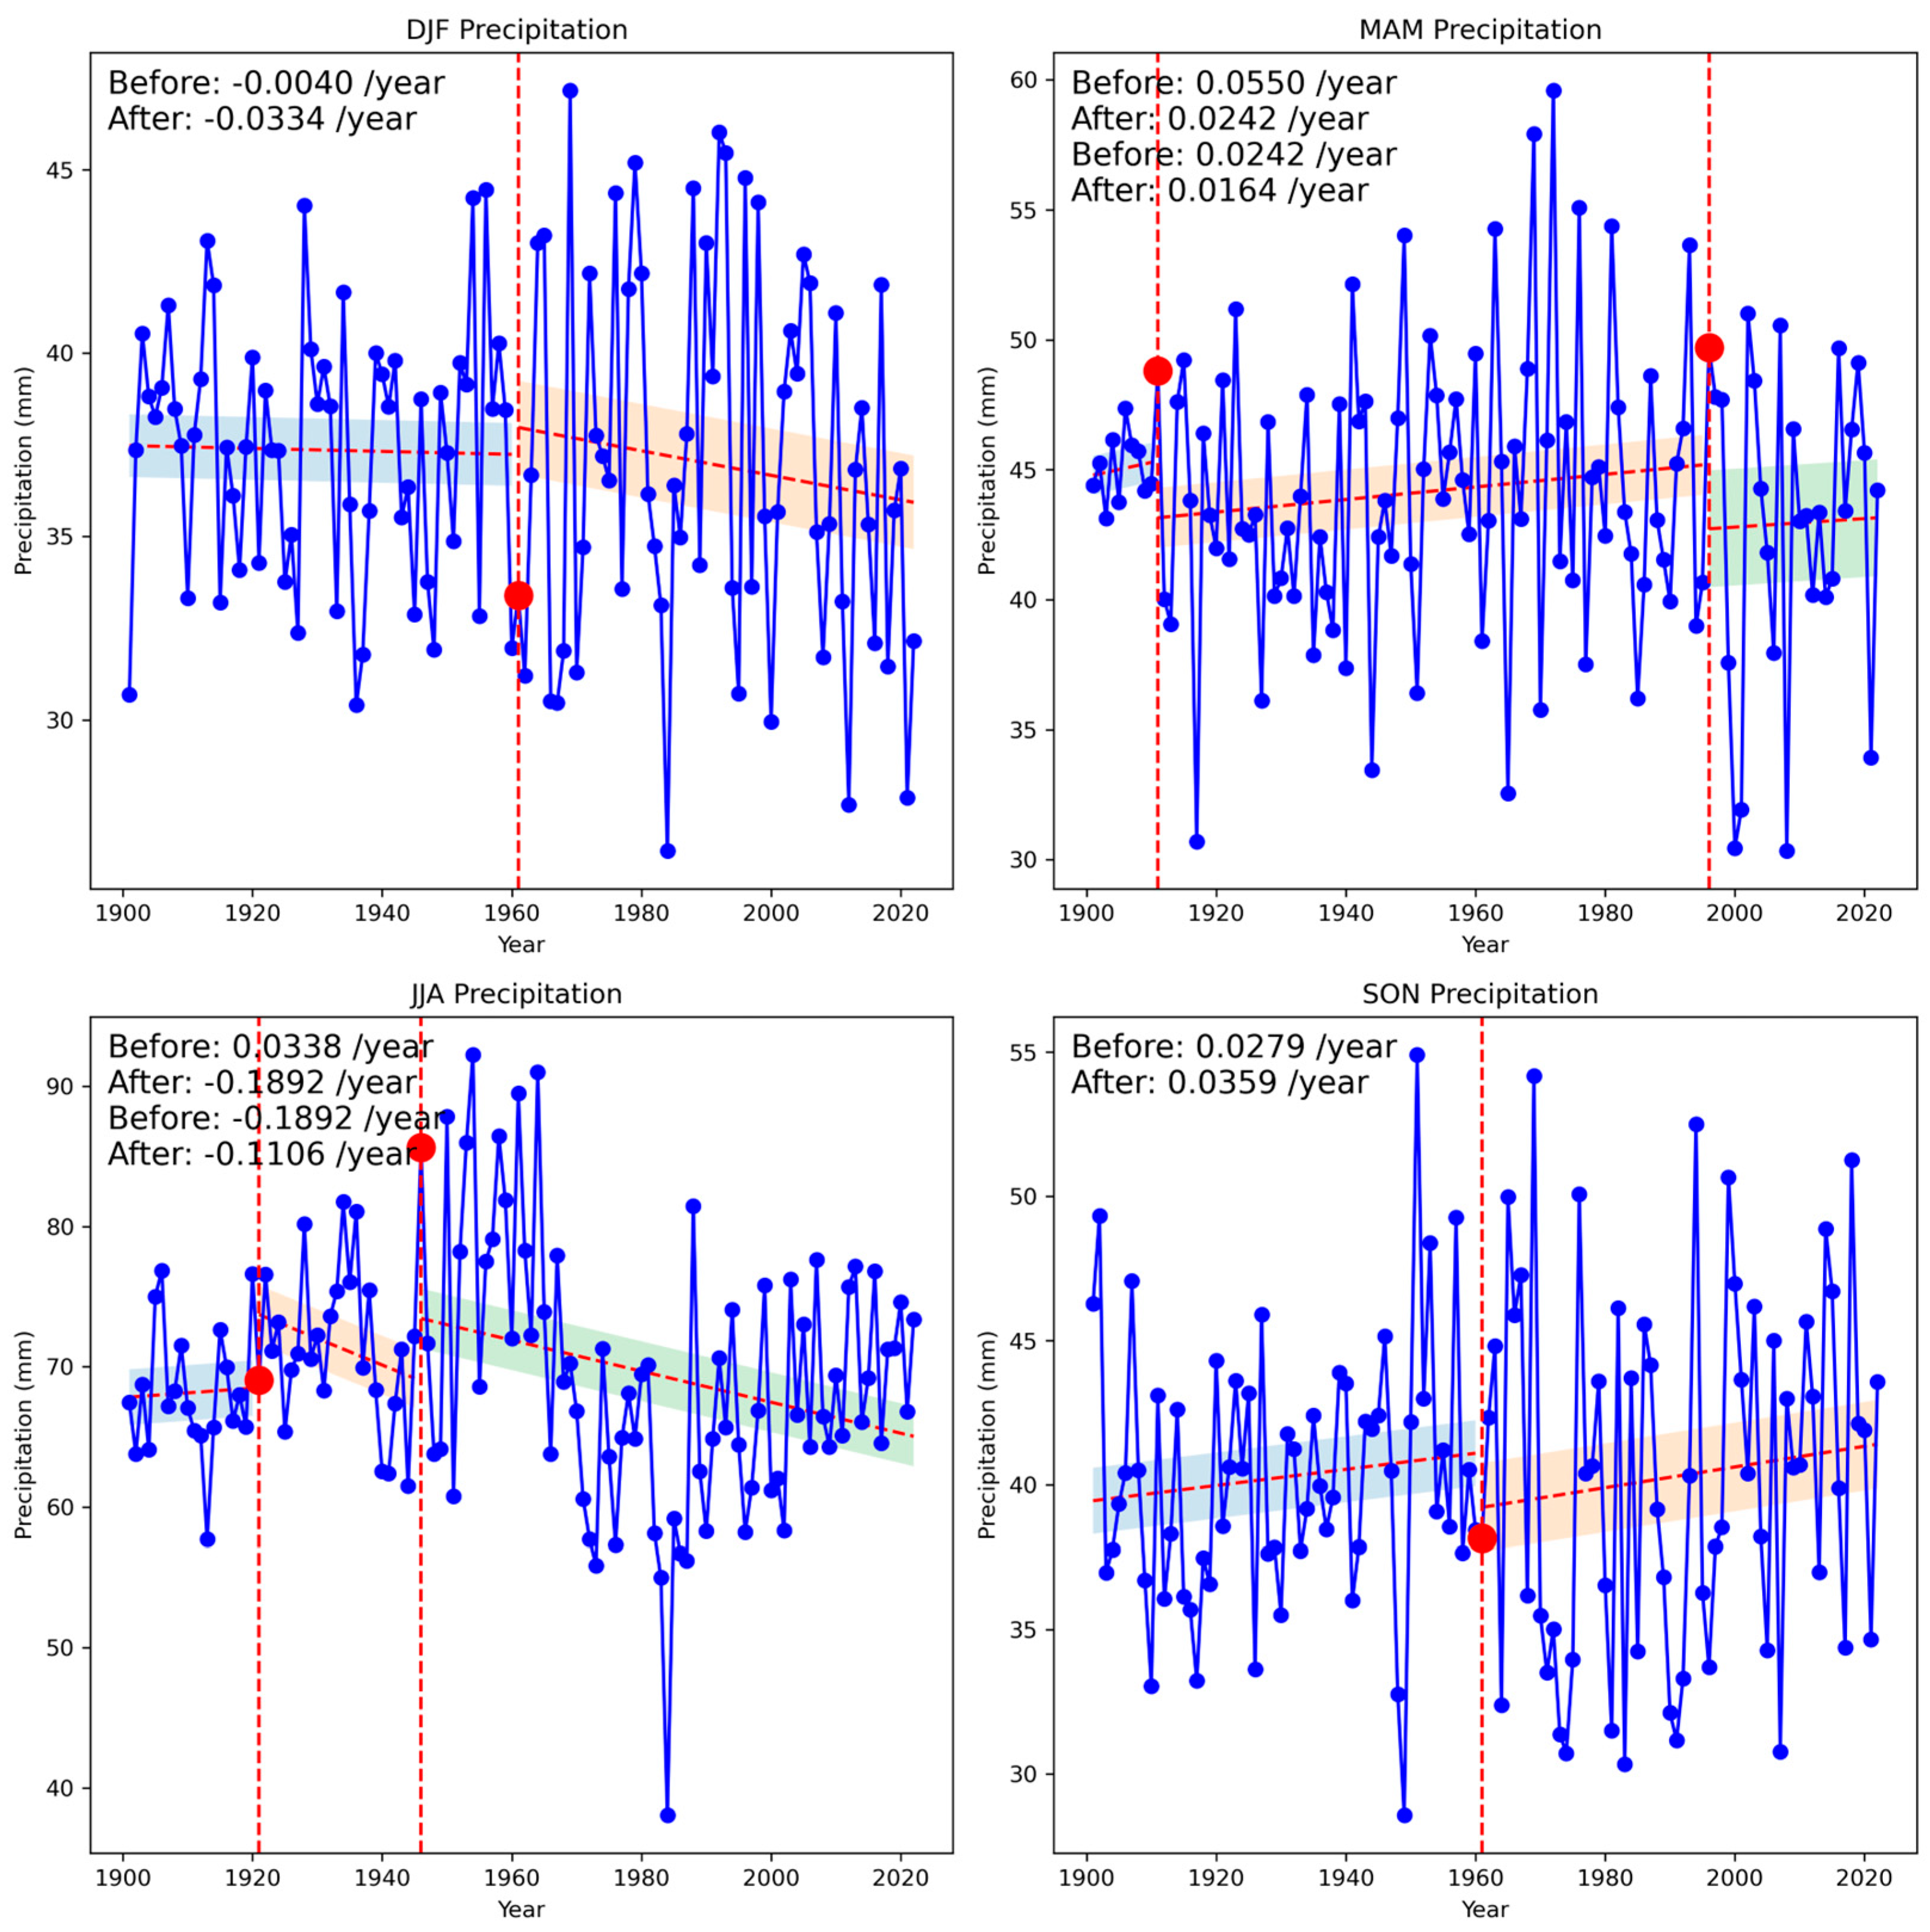
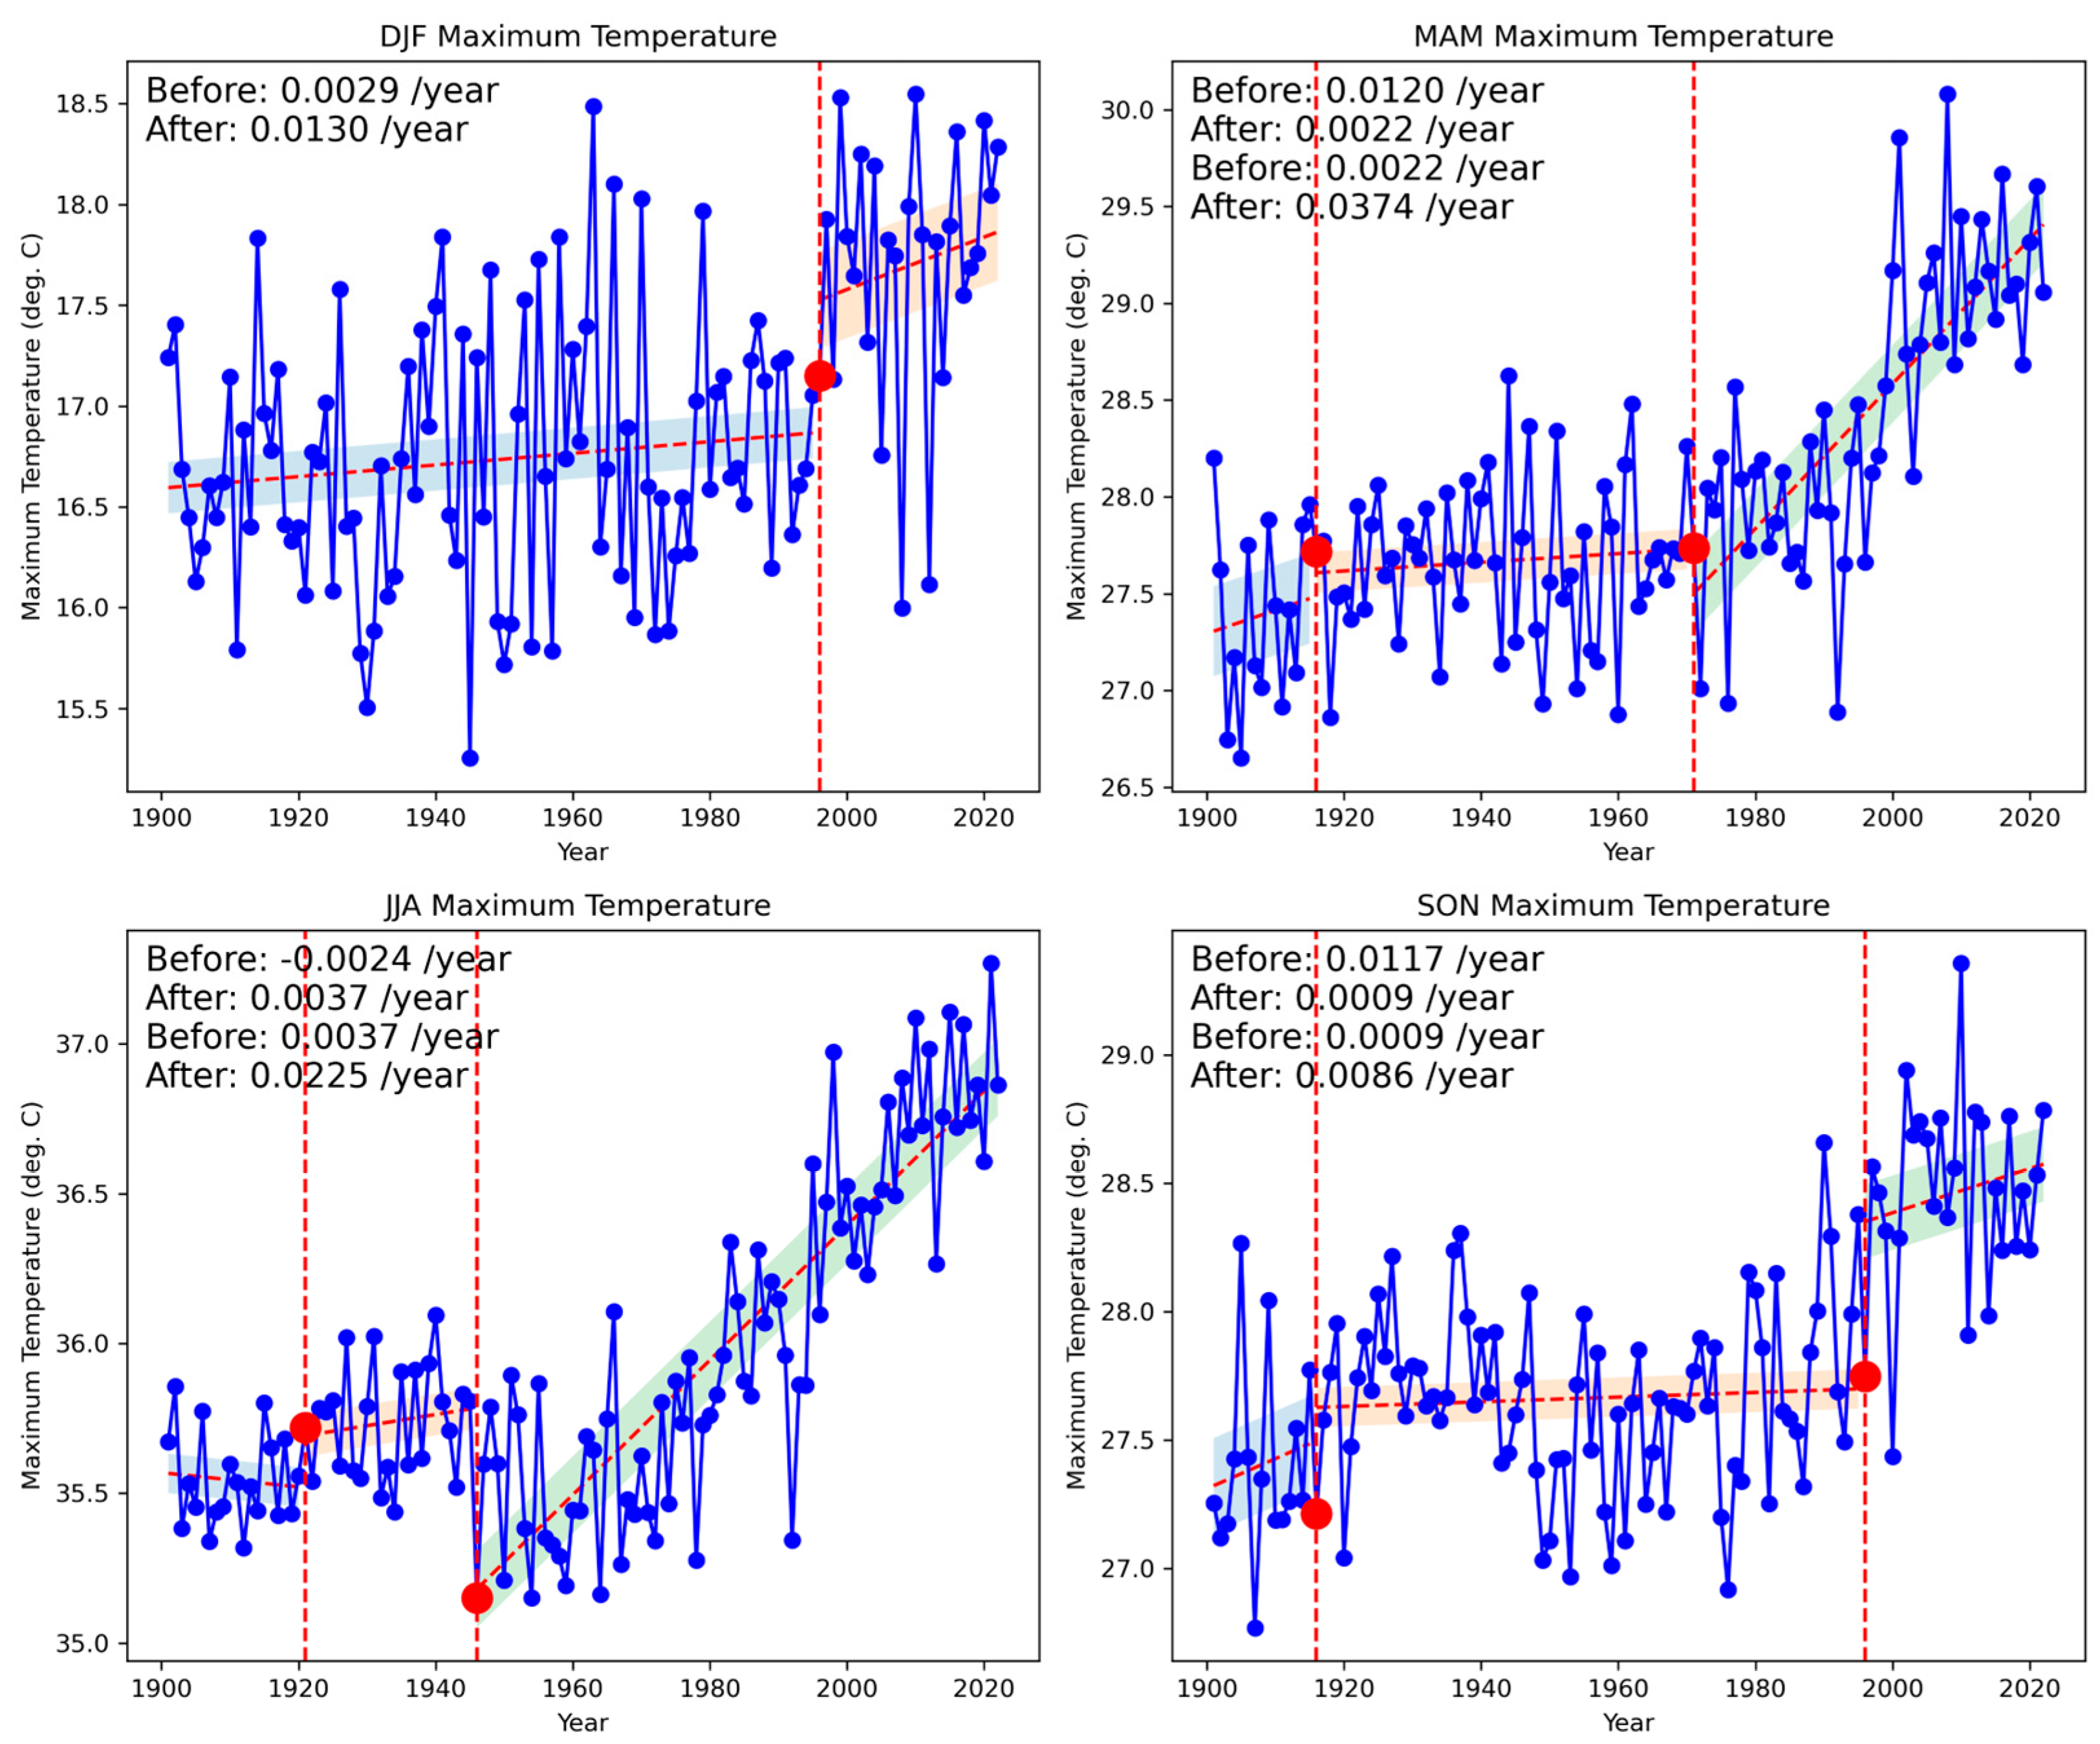
4.1.2. Trend Analysis of the Climatic Parameters

The analysis of long-term PRE, TMIN, TMAX, and PET trends in the study area, as presented in Table 1, Table 2, Table 3 and Table 4, respectively, reveals a complex pattern of temporal and seasonal variability. Examining the long-term annual PRE trend from 1901 to 2022, we observe a slight negative tendency (Z-statistic = −0.881, p-value = 0.378). This finding aligns with studies by Donat et al. [3], who noted high interannual precipitation variability across arid regions, often masking long-term trends. The non-significant trend over the entire period suggests that other factors, such as decadal oscillations or regional climate patterns [29], may be crucial in modulating precipitation in these arid areas [27]. However, a more distinct picture emerges when examining trends across different time slices. Notably, the period from 1951 to 2000 shows a significant decreasing trend in annual precipitation (Z-statistic = −3.329, p-value = 0.001, Sen’s slope = −0.489), indicating a substantial reduction during the latter half of the 20th century. This observation is consistent with findings by Hoerling et al. [30], who reported a drying trend in the Mediterranean region during this period, attributing it partly to anthropogenic climate change. Interestingly, the most recent period (2001–2022) shows a positive, albeit non-significant, trend (Z-statistic = 1.015, p-value = 0.31, Sen’s slope = 0.436). Although not statistically significant, this recent shift towards increased precipitation warrants further investigation as it could indicate a potential reversal in the drying trend or represent short-term variability in a longer-term pattern [31].
The seasonal analysis further elucidates the complexity of precipitation changes in these arid regions. Winter PRE shows a significant decreasing trend in the most recent period (2001–2022), with a Z-statistic of −1.974 (p-value = 0.048) and a Sen’s slope of −0.378. This winter drying trend is particularly concerning for arid regions, as winter PRE is often crucial for water resource replenishment [9,32]. The absence of significant trends in earlier periods suggests a recent intensification of winter drying, which could have severe implications for water availability and ecosystem stability. Summer PRE exhibits intriguing temporal variations. The early 20th century (1901–1950) shows a significant increasing trend (Z-statistic = 2.024, p-value = 0.043, Sen’s slope = 0.145), while the period 1951–2000 demonstrates a significant decreasing trend (Z-statistic = −3.664, p-value < 0.001, Sen’s slope = −0.426). This reversal in summer precipitation trends in the mid-century is noteworthy and may be related to changes in large-scale atmospheric circulation patterns or land-use changes [9]. The most recent period (2001–2022) shows a positive but non-significant trend, suggesting a possible recovery in summer PRE. In contrast, spring and autumn PRE show no significant trends across all time slices. However, the consistent negative Sen’s slopes for spring across periods suggest a tendency towards drier springs, albeit not statistically significant. The stability in autumn PRE patterns indicates that this season may be less affected by long-term climate changes in these regions.
The analysis of long-term trends in TMIN (Table 2) and TMAX (Table 3) in the study area complements our understanding of PRE patterns discussed earlier. Table 2 shows a significant increasing trend (Z-statistic = 9.591, p-value < 0.001, Sen’s slope = 0.013). This strong warming signal aligns with global warming trends and indicates a substantial increase in night-time temperatures over the past century [5,33]. The temporal analysis across different time slices reveals an intensification of this warming trend, with the most recent period (2001–2022) showing a particularly steep increase (Sen’s slope = 0.014). These observations are consistent with studies by Donat et al. [3], who noted accelerated warming in arid regions over recent decades. The seasonal analysis of TMIN trends provides further insights into the changing climate of these arid regions. All seasons show significant warming trends over the entire period (1901–2022), with summer and spring exhibiting the strongest increases (Z-statistics of 9.516 and 9.502, respectively). The consistent warming across all seasons suggests a year-round increase in night-time temperatures, which could have significant implications for ecosystems, agriculture, and human health in these already heat-stressed regions [5,34].
Considering TMAX trends (Table 3), we observe a similar pattern of significant warming. The long-term annual TMAX trend from 1901 to 2022 shows a strong increasing trend (Z-statistic = 8.405, p-value < 0.001, Sen’s slope = 0.011). When considered alongside the TMIN trends, this trend in daytime temperatures indicates a comprehensive warming of the thermal regime in these arid regions. Temporal analysis of TMAX trends reveals an intensification of warming over time. The period from 1951 to 2000 shows a notable acceleration in warming (Z-statistic = 3.948, p-value < 0.001, Sen’s slope = 0.014) compared to the earlier half of the 20th century. Seasonal variations in TMAX trends further elucidate the complexity of thermal changes in these areas. Summer exhibits the most pronounced increase in TMAX over the entire period (Z-statistic = 8.020, p-value < 0.001, Sen’s slope = 0.010), which, coupled with the strong TMIN trend in summer, suggests an intensification of heat stress during the hottest months of the year.
The consistent warming trends in TMIN and TMAX suggest an overall increase in the region’s heat content, which could lead to enhanced evaporation rates and increased aridity [35]. Areas experiencing both increased temperatures and decreased precipitation may face heightened water scarcity and drought risks [29], necessitating adaptive management strategies. The observed acceleration of warming in recent decades, particularly evident in the TMIN trends, aligns with global observations of climate change and underscores the urgency of mitigation and adaptation efforts in these vulnerable regions [10]. The stronger warming signal in TMIN compared to TMAX may reduce the diurnal temperature range [5], affecting various ecological processes and agricultural practices [29].
The long-term spatio-temporal trends of PET in the study area reveal complex patterns of change over the past century, as evidenced by the MMK and Sen’s slope test statistics presented in Table 4. These trends, analysed across different temporal scales (seasonal and annual) and time periods (1901–1950, 1951–2000, 2001–2022, and 1901–2022), provide crucial insights into the changing water balance dynamics of these water-scarce regions. Over the entire study period (1901–2022), a statistically significant increasing trend in annual PET is observed (Z = 6.041, p < 0.001), with a Sen’s slope of 0.014 mm/year. The positive trend in PET could be attributed to rising temperatures and changes in other meteorological variables such as wind speed, solar radiation, and humidity [36]. However, it is important to note that the magnitude and significance of these trends vary considerably across different time slices and seasons.
Examining the seasonal trends over the entire study period reveals significant increasing trends across all seasons, with the highest Z-statistic observed in summer (Z = 5.647, p < 0.001) and spring (Z = 5.678, p < 0.001). This seasonal variation in PET trends is consistent with Hu et al. [37], who observed stronger warming trends in spring and summer in arid regions of Central Asia. Interestingly, we observe notable variations in trend patterns when analysing shorter time periods. During the first half of the 20th century (1901–1950), all seasons show positive trends, with winter and autumn exhibiting statistically significant increases (Z = 2.643, p = 0.008 and Z = 2.158, p = 0.031, respectively). This early 20th-century increase in PET could be linked to the early warming phase observed in many global temperature records [33]. The period from 1951 to 2000 presents a more mixed picture, with some seasons showing no significant trends. However, summer maintains a significant increasing trend (Z = 2.610, p = 0.009), suggesting enhanced evaporative demand continued during the warmest months. This persistence of summer PET increase could have significant implications for agricultural water demand and natural ecosystem functioning in these arid regions [38]. The most recent period (2001–2022) shows a marked intensification of PET trends, particularly in summer (Z = 2.820, p = 0.005) and annually (Z = 2.707, p = 0.007). This recent acceleration of PET increase aligns with the observed global temperature rise and is consistent with projections of intensified aridity in many dryland regions under climate change scenarios [9,39]. The steeper Sen’s slopes observed in this recent period (e.g., 0.020 mm/year for summer and 0.024 mm/year annually) suggest a potential acceleration of the hydrological cycle in these arid regions, which could have profound implications for water resource management and ecosystem resilience [26].
It is worth noting that while most seasons show increasing trends, the magnitude and significance of these trends vary. For instance, autumn shows weaker and often non-significant trends across different time slices, suggesting PET changes may be less pronounced during this transitional season. The observed long-term increase in PET, particularly its acceleration in recent decades, raises important questions about the future water balance in these arid regions. Increased PET, if not matched by precipitation increases, could lead to more severe and frequent droughts, reduced water availability for agriculture and ecosystems, and potential shifts in vegetation patterns [29,35]. Moreover, the seasonal variations in PET trends suggest that water management strategies must be tailored to address season-specific challenges, such as potentially higher irrigation demands during spring and summer.
Figure 2 illustrates the changes in the seasonal PRE time series, highlighting the change points and trends before and after these points. These change points are significant as they often signal underlying shifts in environmental and climatic conditions, frequently linked to anthropogenic influences such as urbanization, land cover modifications, and broader climate dynamics. Donat et al. [3] and Adeyeri et al. [2] underscore the impact of human activities on precipitation patterns, noting that urbanization and industrialization can alter local climates, leading to more pronounced and frequent change points. The varying trends observed around these change points further highlight the complexity of precipitation regimes. Large-scale atmospheric circulation patterns like the North Atlantic Oscillation (NAO) and the El Niño-Southern Oscillation (ENSO) often influence this complexity. For instance, Schurer et al. [40] demonstrated how the NAO significantly affects winter precipitation patterns across the North Atlantic region, altering storm tracks and precipitation distribution. Similarly, Cai et al. [41] explored the role of ENSO in modulating precipitation in the Pacific and adjacent regions, emphasizing its influence on seasonal variability and extreme weather events. For instance, the observed decreasing trends in some seasons (e.g., winter and spring) align with Huang et al. [39], who reported a significant decrease in PRE over global semi-arid lands. These PRE changes could significantly affect the region’s water resource management, agriculture, and natural ecosystems. For example, shifts in seasonal precipitation patterns may necessitate adjustments in agricultural practices, including changes in crop selection and irrigation strategies [42].
Figure 3 and Figure 4 depict seasonal TMAX and TMIN time series changes, respectively. The trends in TMAX and TMIN appear to be predominantly positive, indicating a general warming pattern across seasons. This aligns with the findings of Zittis et al. [14], who reported significant warming trends across the MENA region, with the rate of increase often exceeding the global average. The warming trends observed in both TMAX and TMIN could have far-reaching consequences for the region. Increased temperatures can exacerbate water stress through enhanced evapotranspiration, potentially leading to more frequent and severe droughts [9,43]. Moreover, higher temperatures, especially increases in TMIN, can impact crop yields and phenology, potentially necessitating changes in agricultural practices and crop varieties [2,44]. It is worth noting that if the rate of increase in TMIN exceeds that of TMAX, it could lead to a reduction in the diurnal temperature range. Such a phenomenon has been observed in other parts of the world and can have significant ecological implications [2,44,45].
Figure 5 illustrates the changes in seasonal PET time series. The trends in PET are particularly crucial for arid regions, as they directly influence water availability and drought conditions. The presence of change points in the PET time series suggests that the rates of change in atmospheric water demand have not been constant over the study period. The PET trends have predominantly increased in all seasons, especially since 2000. This trend aligns with the findings of Vicente-Serrano et al. [46], who reported widespread increases in atmospheric evaporative demand across many global regions, including arid areas. Increased PET, combined with the observed changes in precipitation, could exacerbate water scarcity issues in the region, potentially leading to more frequent and severe droughts [9,29]. The seasonal variability in PET trends shows summer PET has a stronger increasing trend; this could have significant implications for summer crops and natural vegetation, potentially increasing irrigation requirements and the risk of wildfires [29,47].

4.2. Spatial Characteristics of Climatic Parameters

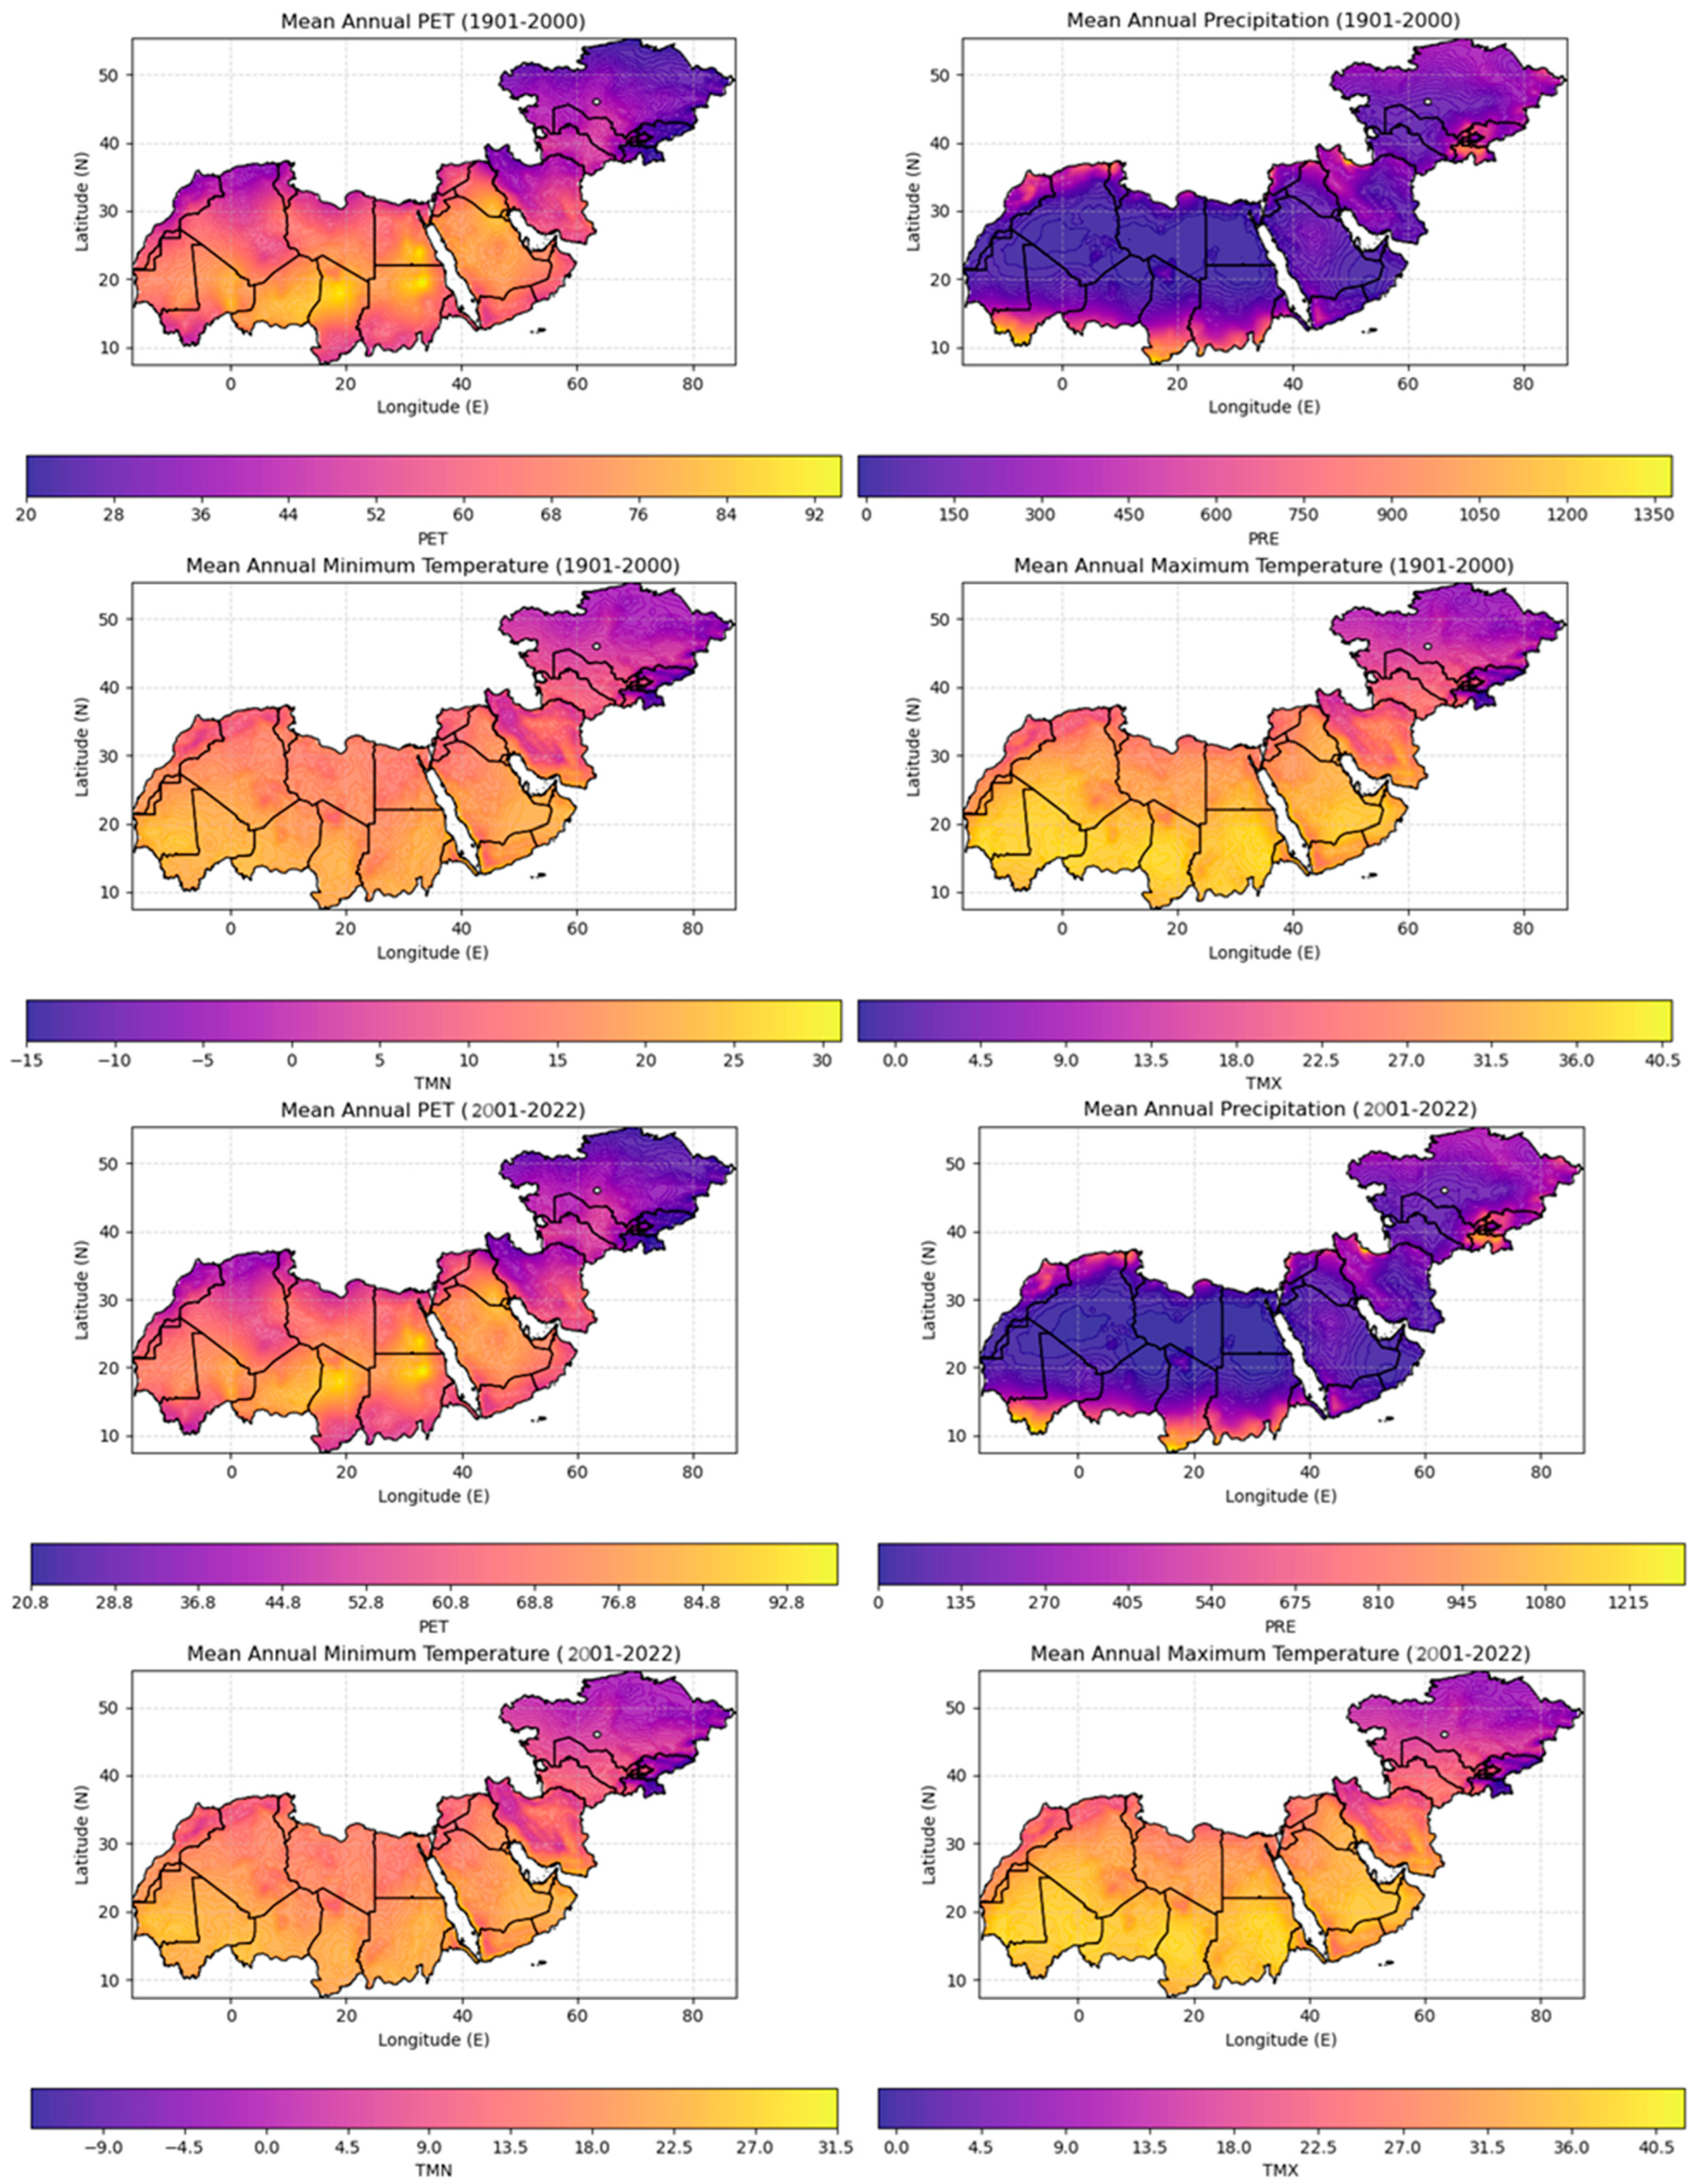
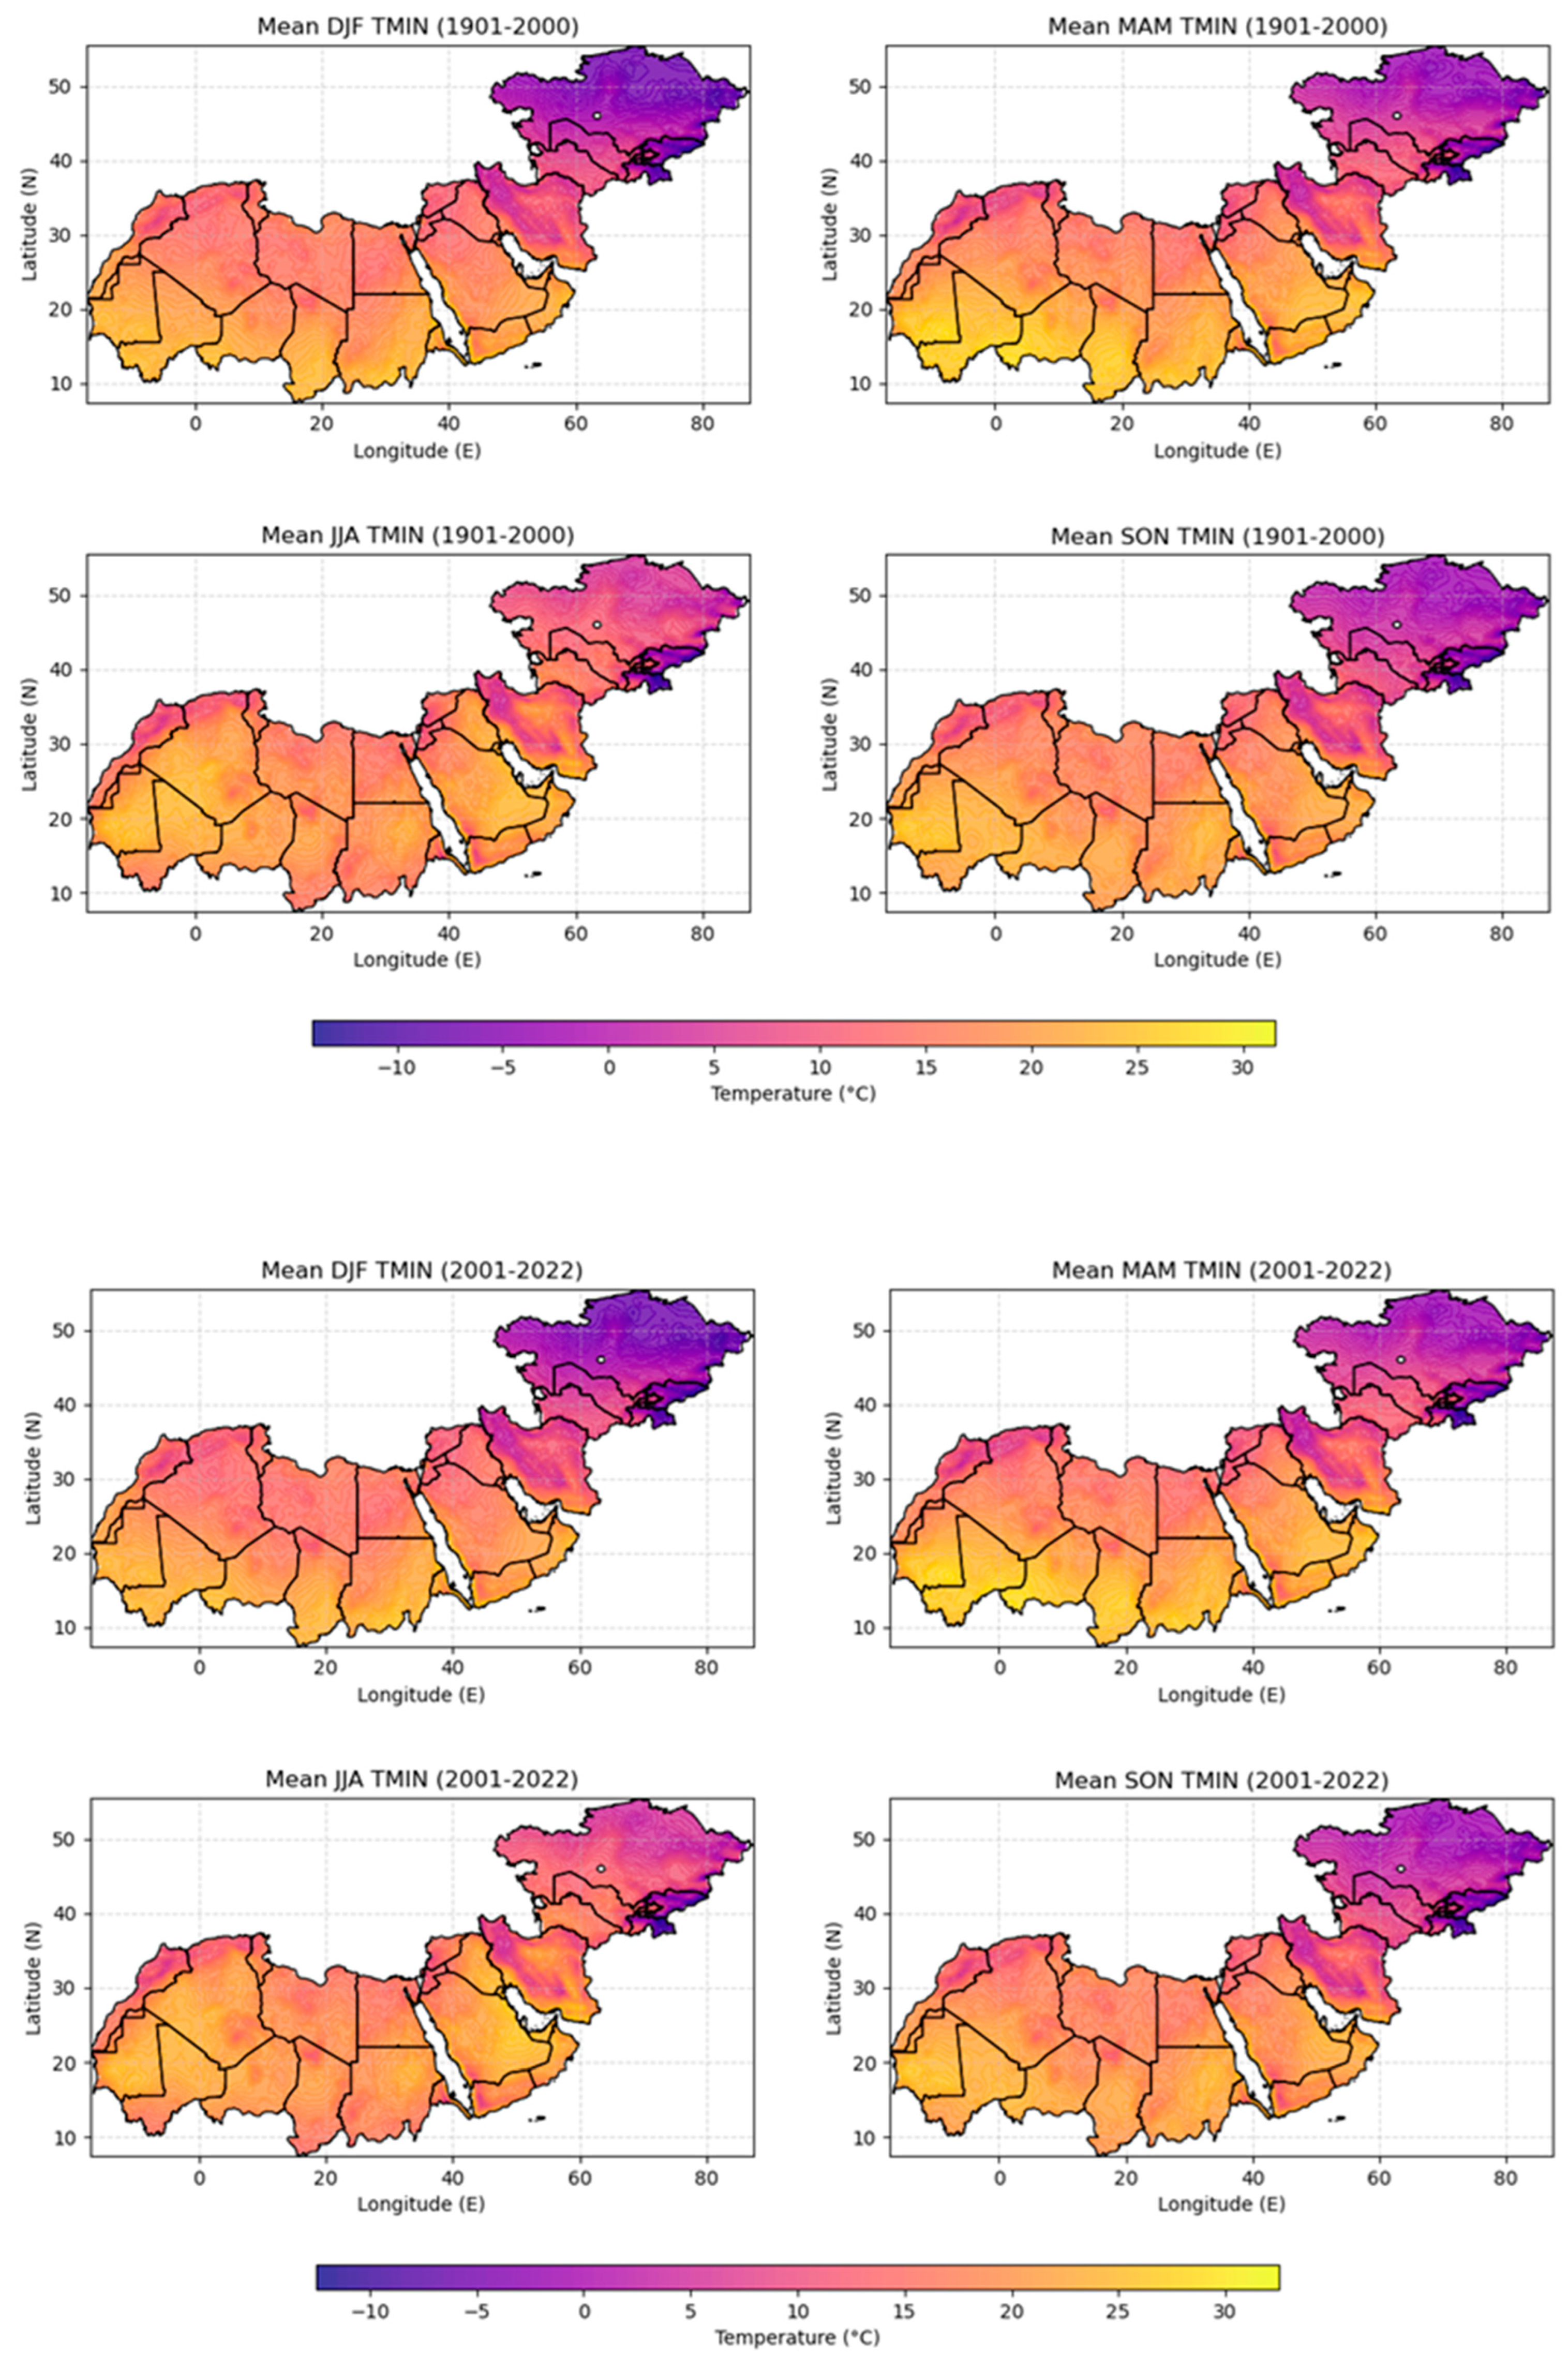
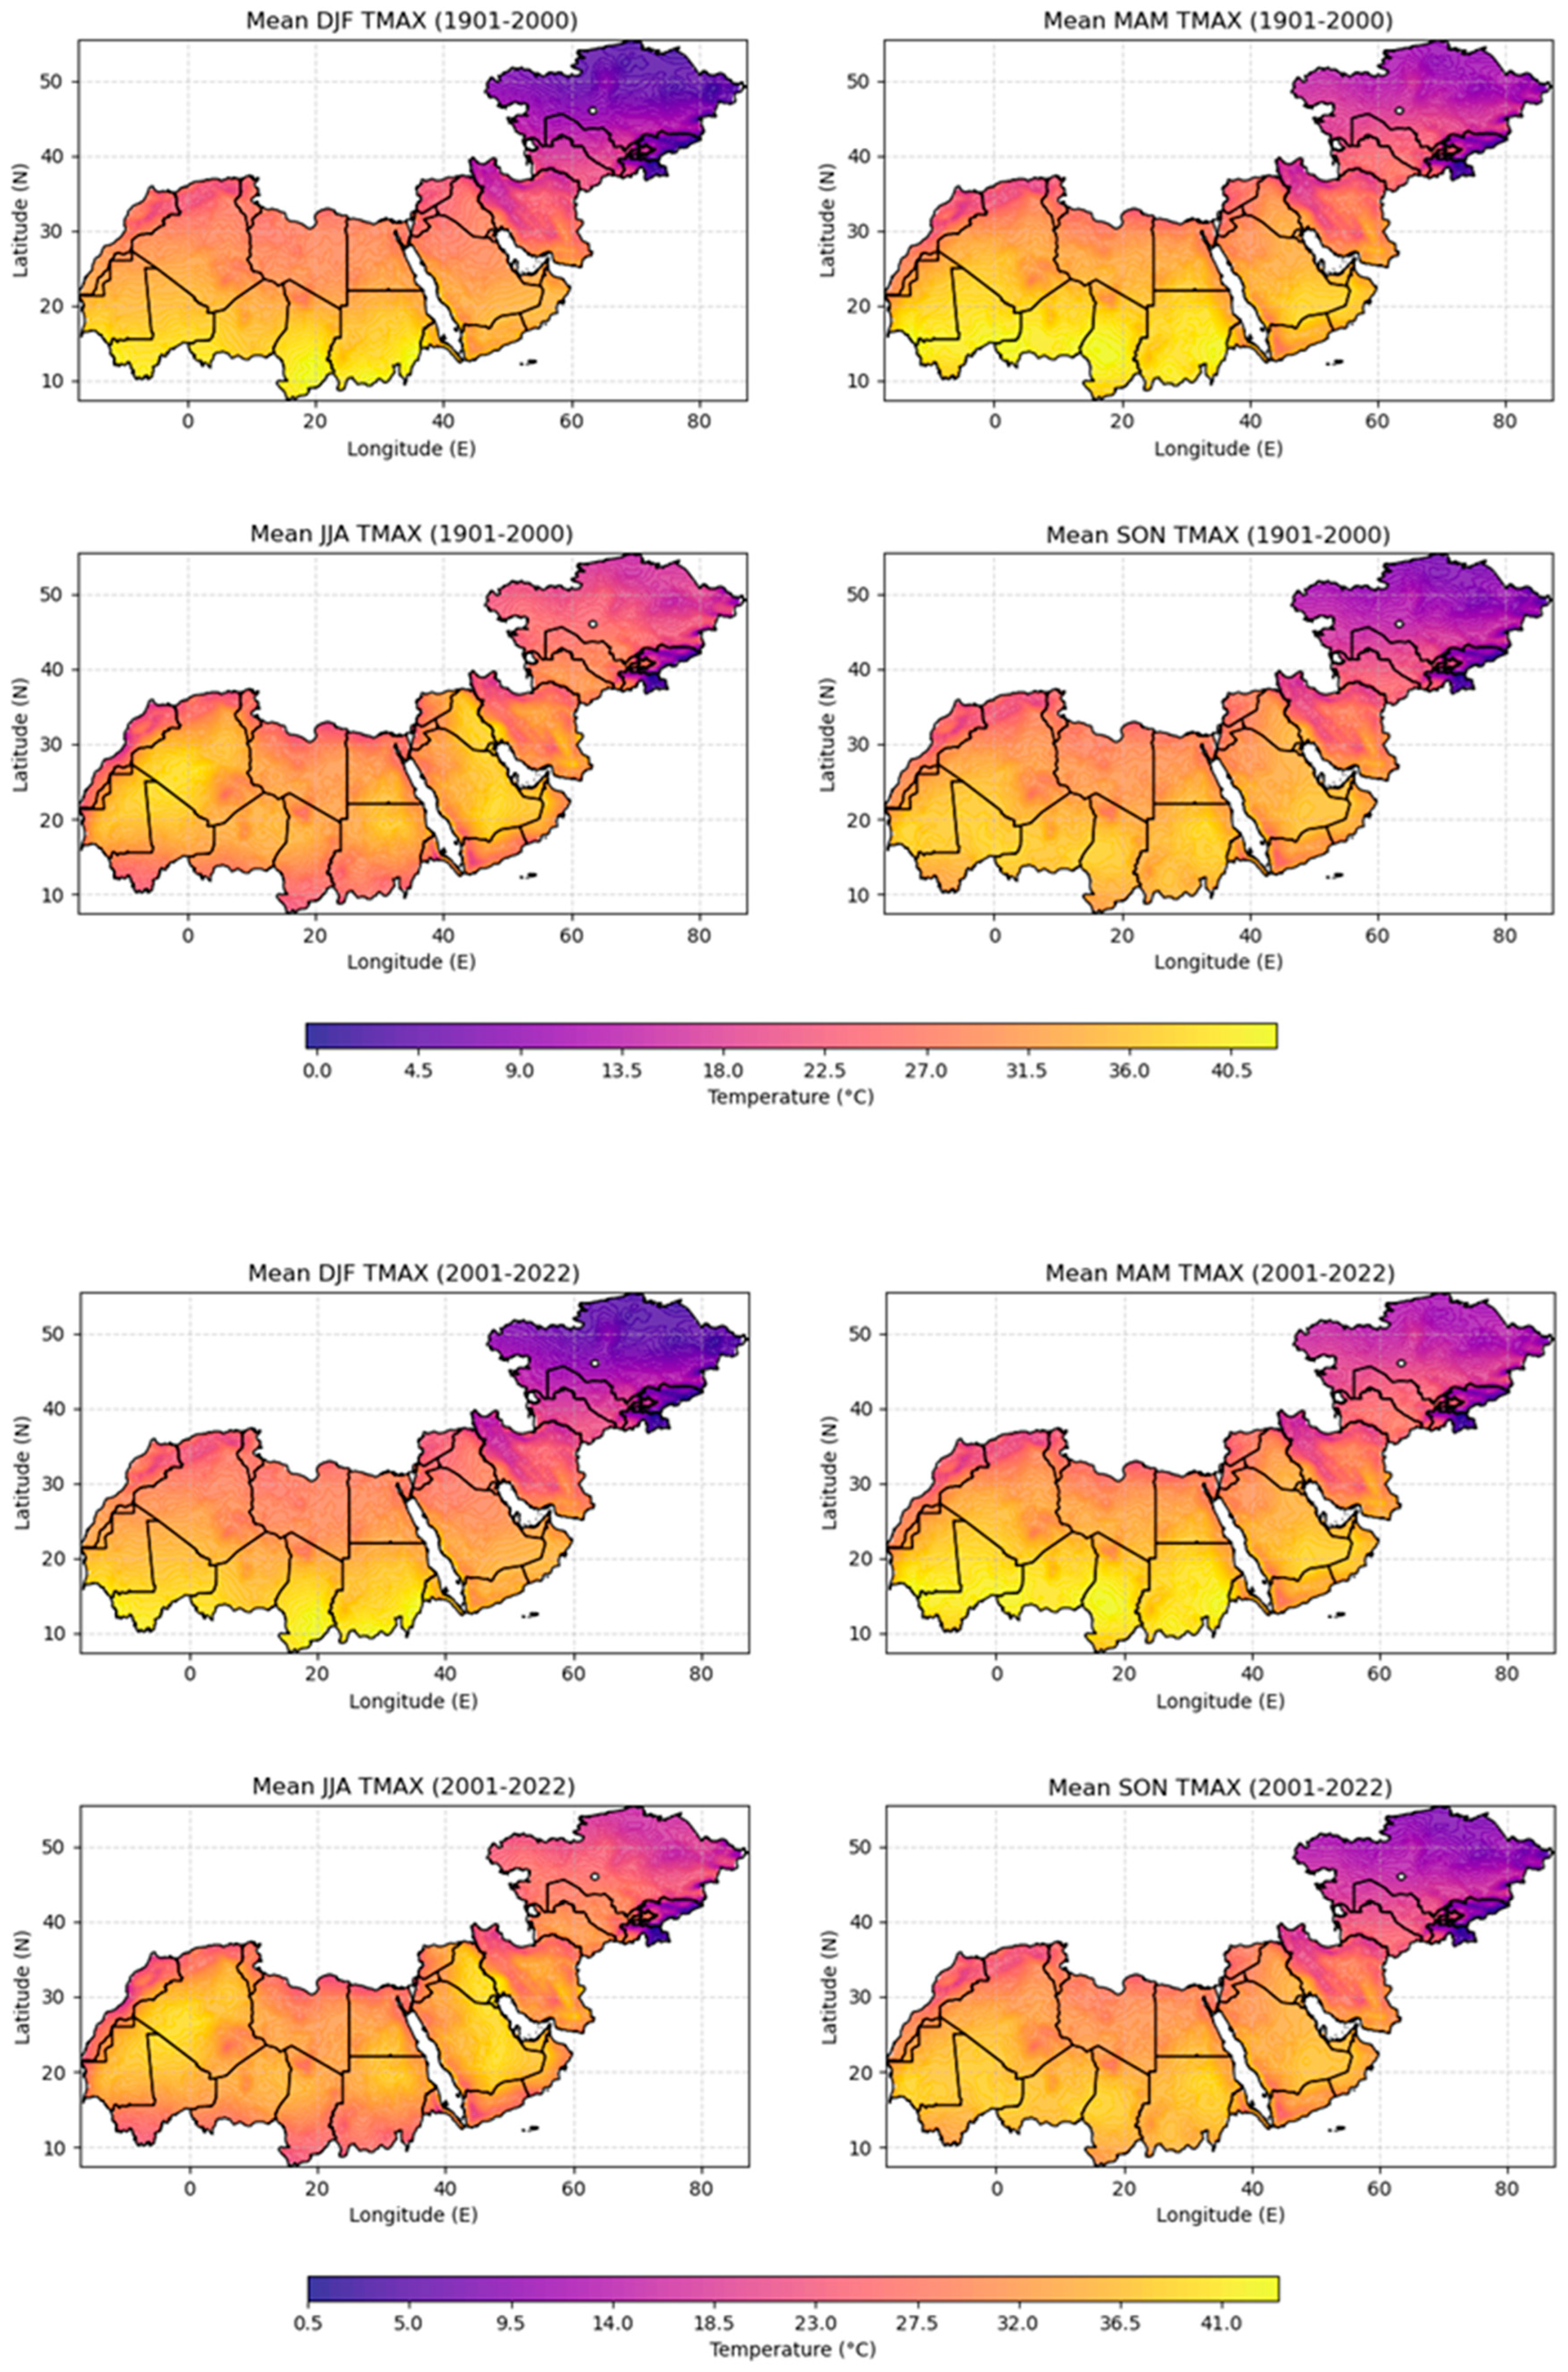
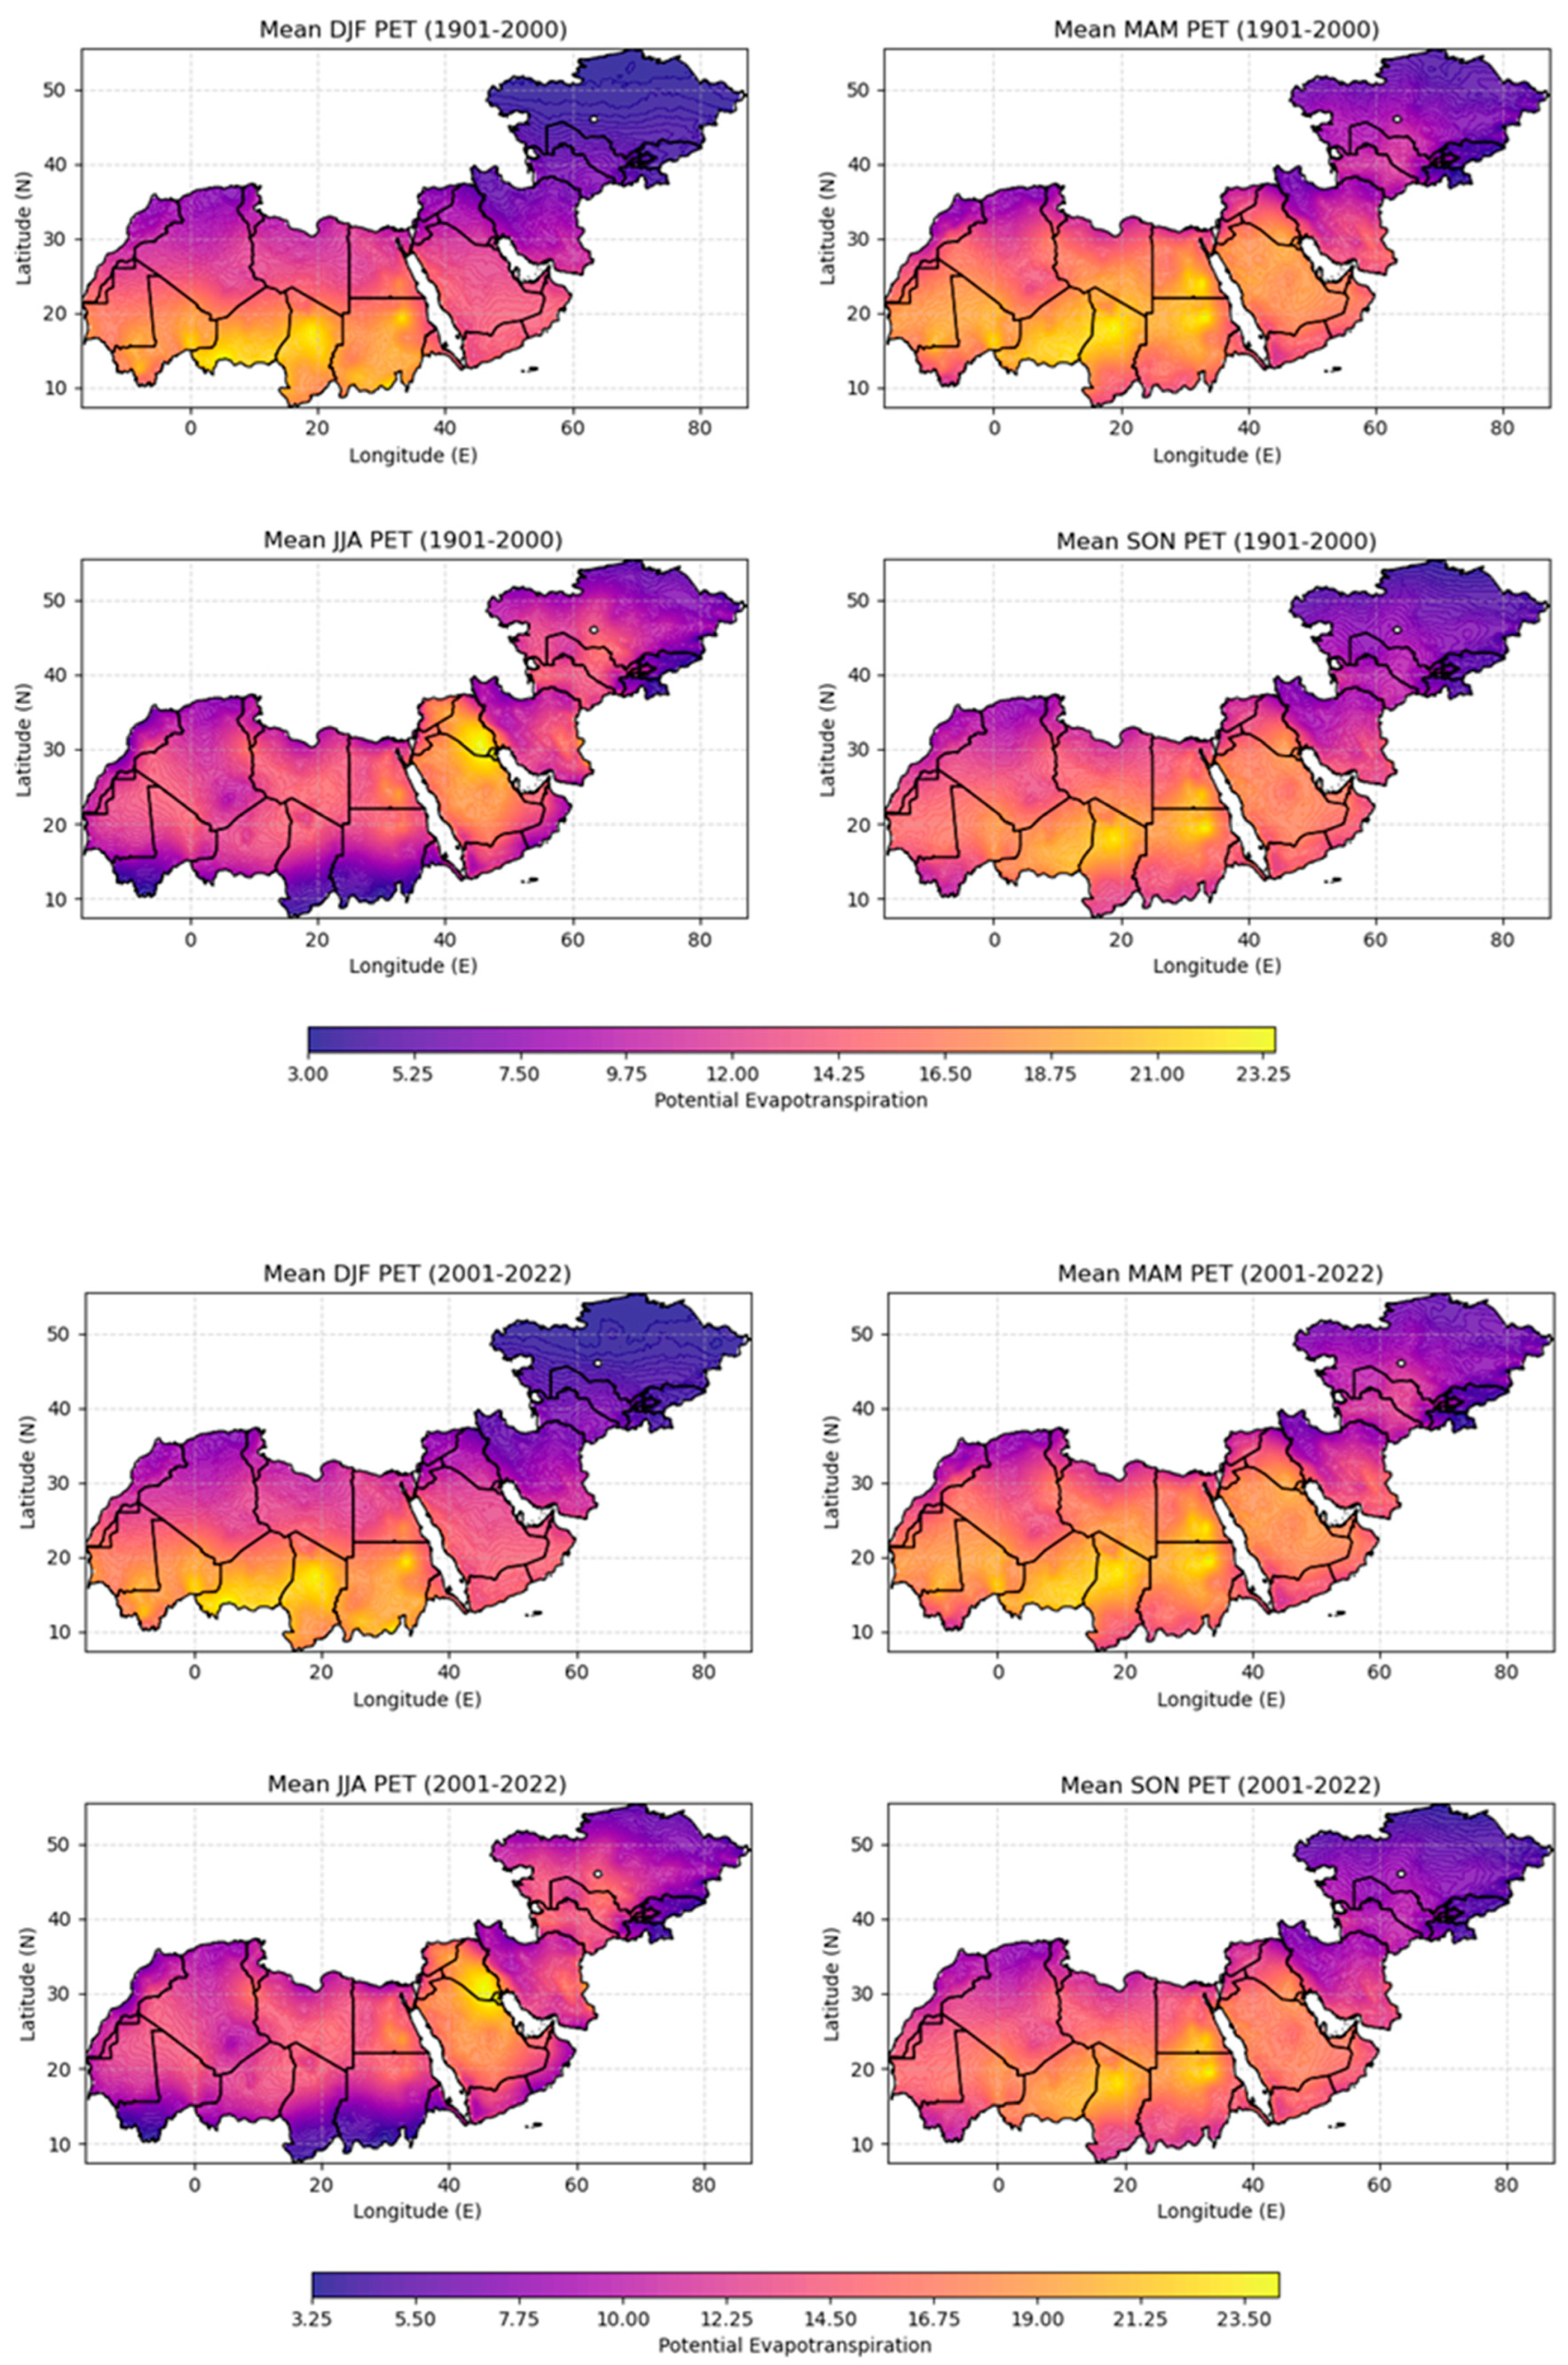
4.2.1. Spatial Variation in the Climatic Parameters

Figure 6 presents a comprehensive spatial analysis of four key climatological parameters—PET, PRE, TMIN, and TMAX—across the study area. The figure compares two distinct periods: the long-term average from 1901–2000 and the recent period of 2021–2022, allowing for a quantitative assessment of climate change impacts in these vulnerable arid regions. The spatial distribution of annual PET reveals a marked increase in 2021–2022 compared to the 1901–2000 average across most of the study area. In the Sahara Desert, PET values have increased from 700–1100 mm/year in 1901–2000 to 800–1200 mm/year in 2021–2022, representing a 10–15% increase. Similar trends are observed in the Arabian Peninsula and parts of Central Asia, with increases of about 50–100 mm/year in many areas. This significant rise in PET aligns with the findings of Fu and Feng [48], who projected an expansion of global drylands under climate change scenarios. The observed decrease in precipitation patterns across the study area, particularly in the core arid regions of the Sahara Desert, North Africa, the Middle East, and Central Asia, is consistent with the long-term trends reported in the recent literature [5,49]. The reduction in PRE ranges from 750 mm to 675 mm as the upper limit between the two periods (1901–2000 and 2001–2022) represents a decrease of approximately 10% in maximum annual PRE. This trend aligns with the findings of Trenberth [26], who reported a global redistribution of precipitation, with arid and semi-arid regions experiencing further drying. The persistence of extremely low precipitation values (<10 mm) in both periods underscores the chronic water scarcity in these regions. Lelieveld et al. [50] conducted a comprehensive study on climate change in the MENA region, corroborating our findings of decreasing PRE trends. They projected that even under moderate emissions scenarios, these regions could experience a reduction in PRE of up to 20% by the end of the 21st century. Our observed decrease of 10% in the maximum PRE over a shorter time frame (2001–2022 compared to 1901–2000) suggests that these projections may be conservative, and the rate of change could be more rapid than initially anticipated. In Central Asia, Luo et al. [51] reported spatially heterogeneous changes in PRE, with a general drying trend in the western parts and slight increases in the eastern regions. Our findings of an overall decrease across most of the study area, including Central Asia, highlight the dominance of the drying trend, particularly in the more arid western sections. The implications of this PRE decrease are far-reaching. Reduced precipitation in already water-scarce regions can exacerbate desertification processes and expand arid lands [10,52]. The continuation of this trend, as evidenced by our 2001–2022 data, suggests an ongoing expansion of arid conditions.
TMIN and TMAX show a clear warming trend across the study area. In the northern latitudes of Central Asia, TMIN has increased by 2–3 °C, from around −5 °C to −2 °C in many areas. TMAX in the same region has risen by a similar magnitude, from about 15 °C to 18 °C. The increase is also pronounced in parts of the MENA region, with TMAX rising from 36–39 °C to 39–42 °C in some areas, representing a 3 °C increase. This observation aligns with the global trend of amplified warming in arid and semi-arid regions, as reported by Huang et al. [11]. The rapid rate of change observed in the 2001–2022 period compared to the century-long average (1901–2000) is alarming. For instance, the 2–3 °C increase in temperatures and 50–100 mm/year increase in PET observed over just two decades would translate to rates of change five times faster than the long-term trend if they were to continue. This accelerated change aligns with the “climate velocity” concept introduced by Loarie et al. [53], suggesting that the rate of climate change in arid regions may outpace the adaptive capacity of many species and ecosystems.
Figure 7, Figure 8, Figure 9 and Figure 10 comprehensively analyse the long-term spatial distribution of seasonal precipitation, TMIN, TMAX, and PET across the study area. The figures also compare two distinct periods: 1901–2000 and 2001–2022, allowing for a quantitative assessment of changes in these four climatic variable patterns over the past century and into the early 21st century. The seasonal breakdown in Figure 7 reveals spatial variability in precipitation patterns, indicating a general reduction in PRE values across all seasons. For illustration, during the winter, the Mediterranean coastal regions and parts of Western Asia show the highest PRE rates, ranging from 100–300 mm in the 1901–2000 period. However, in the 2001–2022 period, there is a noticeable decrease in winter PRE in these areas, with many regions experiencing a 30–50 mm reduction. This decline is particularly evident in the Atlas Mountains of Northwest Africa and the Levant region, where winter PRE has decreased by approximately 10–15%. When examining the annual precipitation totals, a clear pattern emerges. Most of the study area shows a decrease in annual PRE, with the most significant reductions observed in North Africa and parts of the Middle East. The spatial heterogeneity in PRE changes across seasons and regions highlights the complex nature of climate dynamics in these arid areas. The general trend towards drier conditions, particularly in the MENA region, suggests an increasing risk of drought and water scarcity. This could severely affect agriculture, water resource management, and ecosystem stability in these regions [54].
Figure 8 and Figure 9 depict that TMIN and TMAX are shifting towards warming trends across all seasons and regions. The warming trend is more pronounced in TMAX than TMIN, suggesting an increase in daily temperature range across the study area. This observation is consistent with the findings of Vose et al. [55] and Adeyeri et al. [5], who reported a global trend of increasing daily temperature ranges in arid and semi-arid regions. The most significant warming is observed during the summer months, with TMIN and TMAX increasing up to 3 °C across large parts of the study area. This amplified summer warming could lead to more frequent and intense heatwaves, with potentially severe consequences for human health, agriculture, and ecosystems [5,56]. The rate of warming appears to have accelerated in the 2001–2022 period compared to the long-term average (1901–2000). The changes in seasonal temperature patterns could significantly impact the phenology of local vegetation, the timing of agricultural activities, and the dynamics of regional water cycles. For instance, the increase in spring temperatures may lead to earlier snowmelt in mountainous regions, affecting the timing and availability of water resources downstream [57].
The seasonal breakdown in Figure 10 reveals significant spatial variability in PET patterns across the study area. During the winter season (DJF), the lowest PET values are observed, as expected, due to lower temperatures and reduced solar radiation. In the 1901–2000 period, winter PET values ranged from 10–25 mm/day in the northern parts of Central Asia to 60–70 mm/month in the Sahara and Arabian Peninsula. However, in the 2001–2022 period, there is a noticeable increase in winter PET across most of the study area. For instance, winter PET has increased to 70–80 mm/month in the Sahara and Arabian Peninsula, representing a 10–15% increase. Other seasons reflect a similar increase within the 2001–2022 period compared to the 1901–2000 period. The spatial heterogeneity in PET changes across seasons and regions highlights the complex nature of climate dynamics in these arid areas. The observed changes can be attributed to various factors, including rising temperatures, changes in solar radiation due to altered cloud cover patterns, and shifts in wind speeds and humidity levels [58,59]. The general trend towards higher PET values across all seasons suggests an intensification of the hydrological cycle in these already water-stressed environments.
Moreover, the changes in seasonal PET patterns could significantly impact agriculture and natural ecosystems. For instance, the increase in spring PET may necessitate earlier irrigation in agricultural areas, potentially straining water resources before the peak summer demand [60]. In natural ecosystems, the increased atmospheric water demand could lead to shifts in vegetation composition [29], favouring more drought-tolerant species and potentially altering ecosystem functioning and services [54]. It is important to note that while PET represents the atmospheric water demand, actual evapotranspiration in these arid regions is often limited by water availability rather than atmospheric demand. Therefore, the observed increases in PET may not necessarily translate directly into increased actual evapotranspiration but rather into increased aridity and potential for drought stress when water is available [9,61].

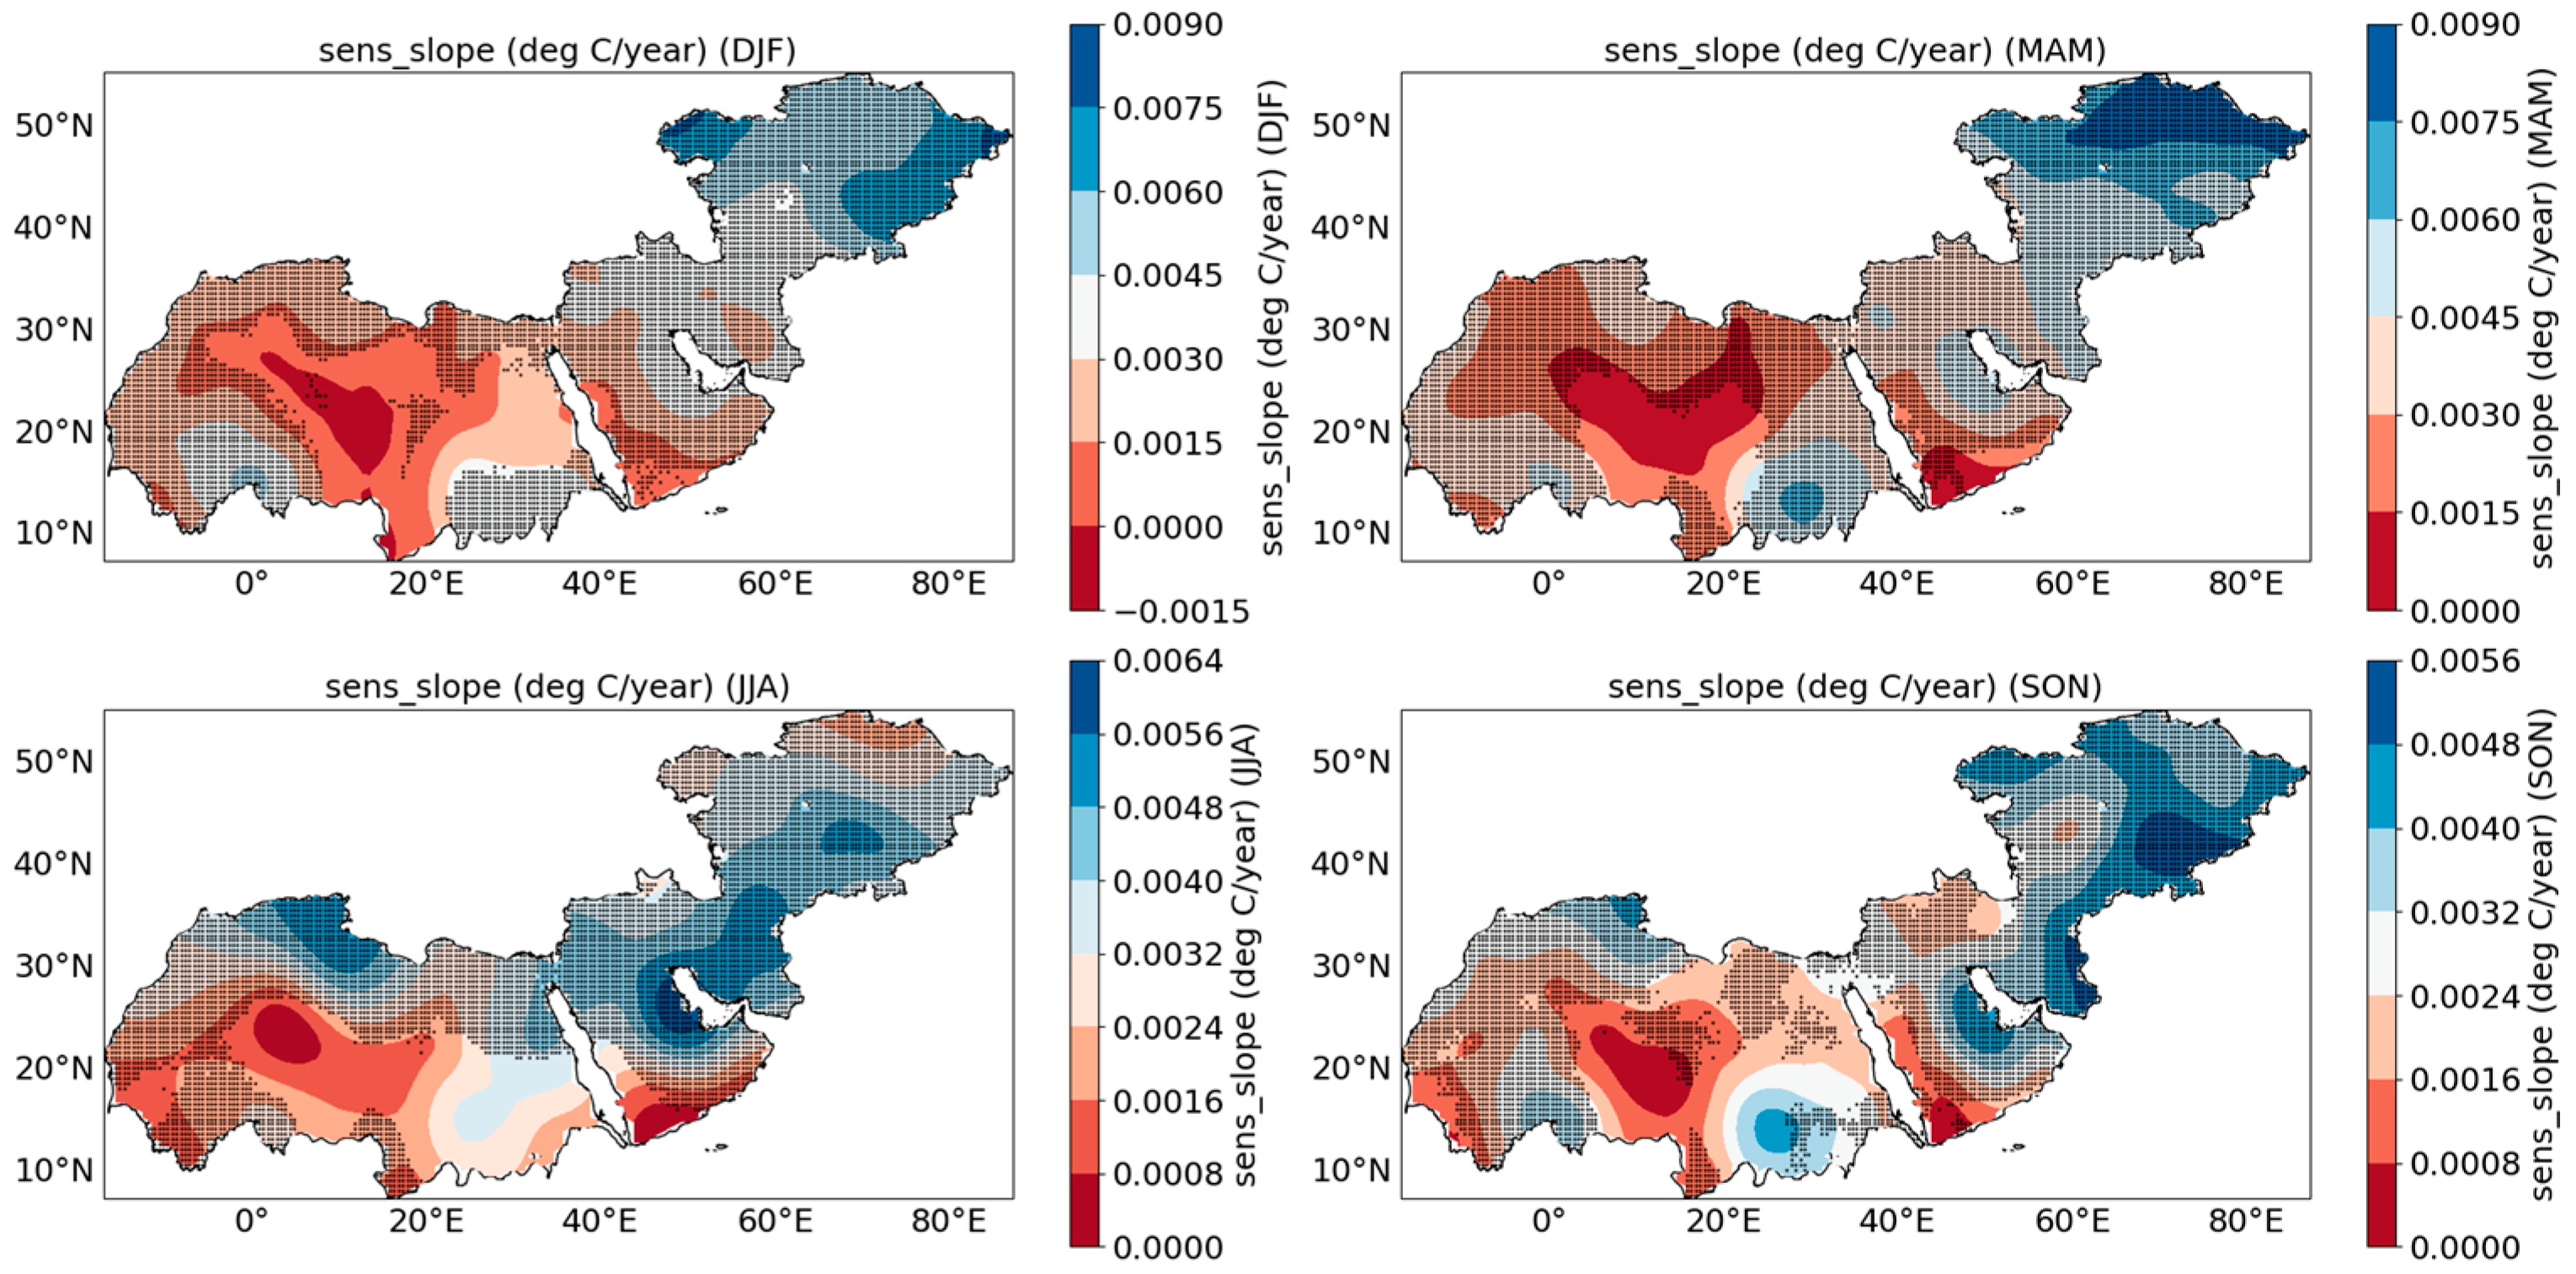
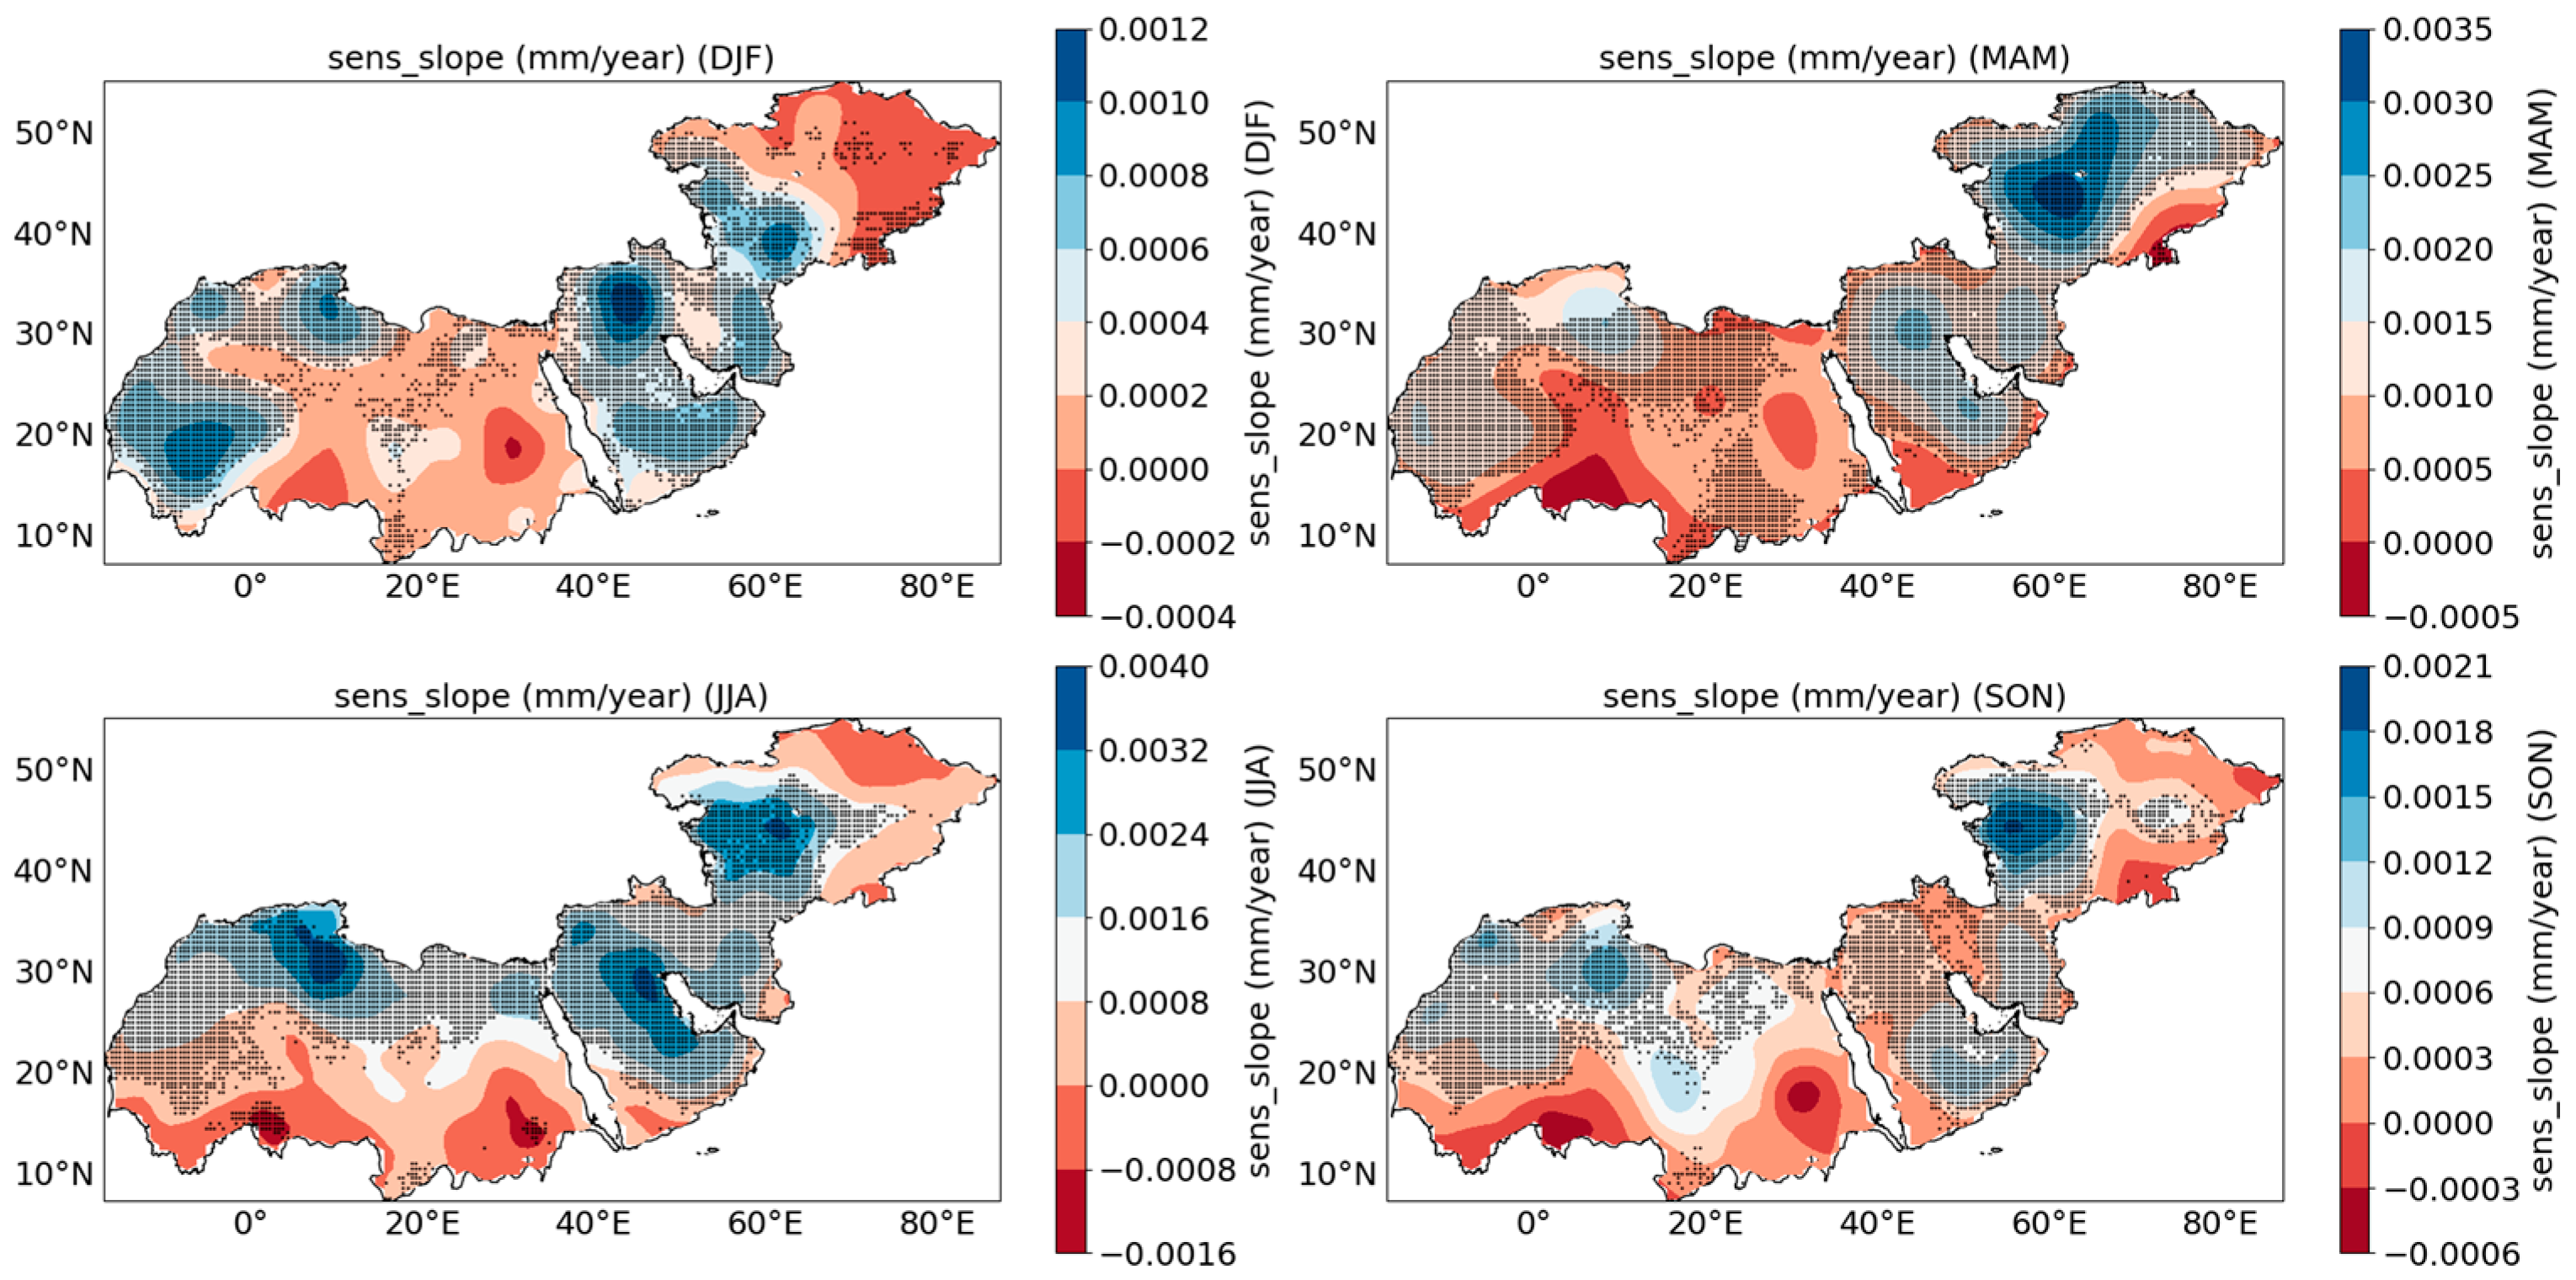
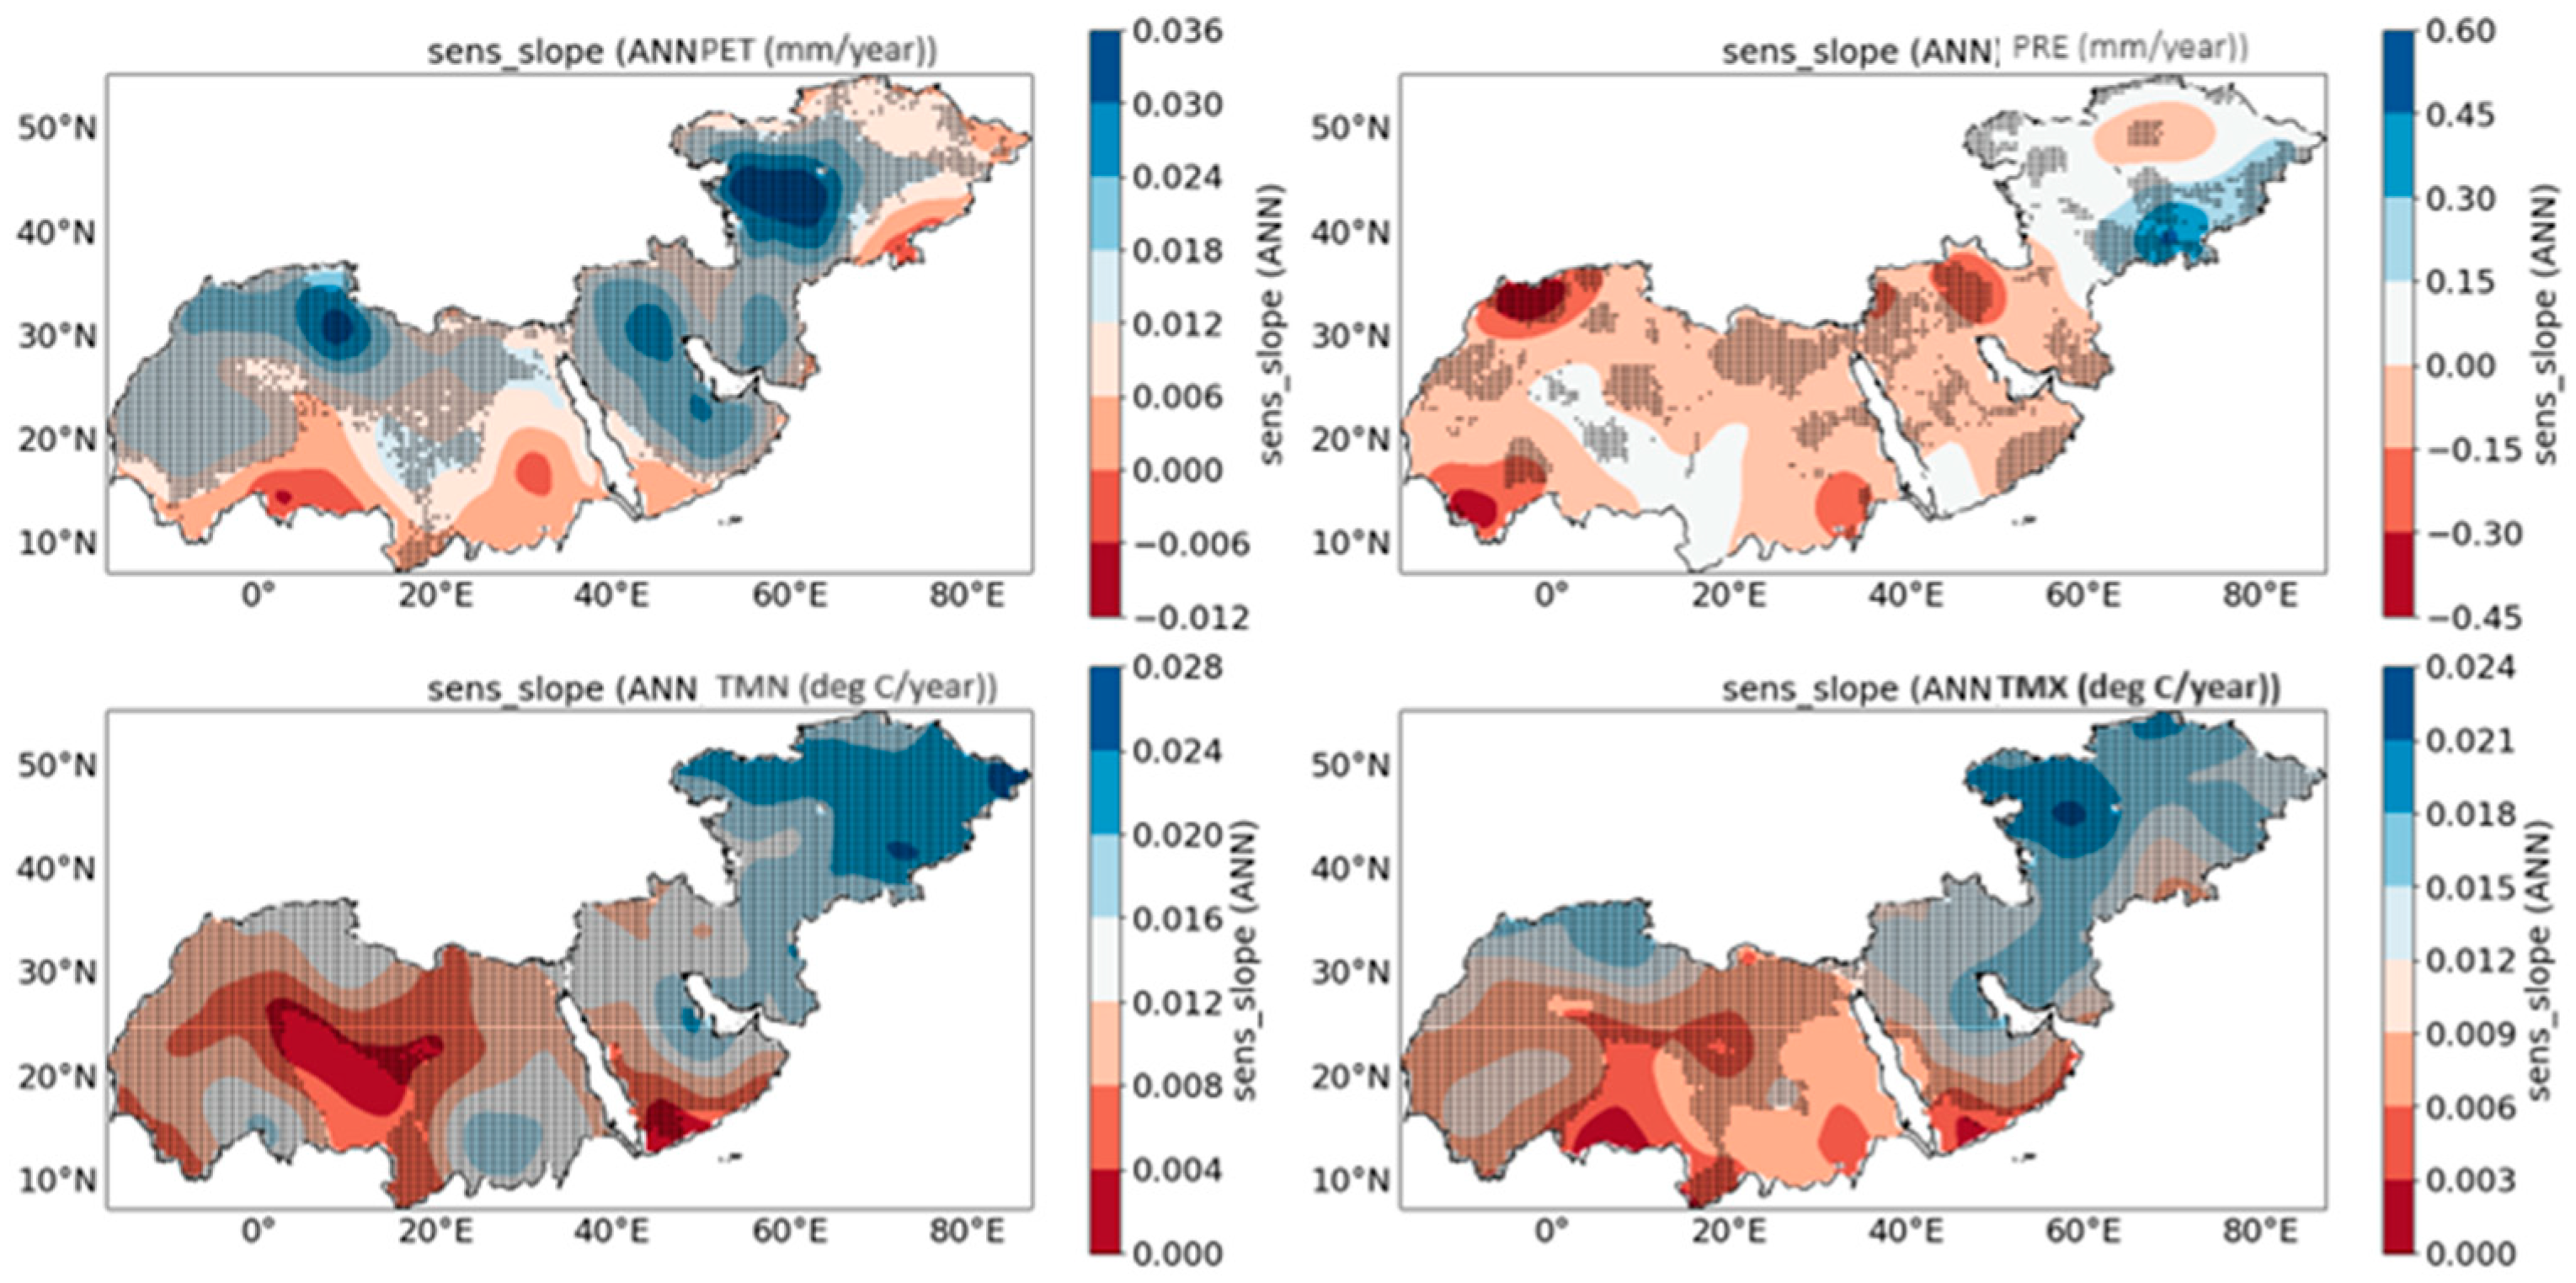
4.2.2. Spatial Trend Analysis of the Climatic Elements

The long-term spatial trends of seasonal and annual climate variables in the study area from 1901 to 2022, as analysed using the MMK test, reveal significant and complex patterns of climate change. These trends provide critical insights into the evolving climate dynamics of these water-scarce regions and their potential impacts on water resources, ecosystems, and human activities. Figure 11 illustrates the spatial trends of seasonal PRE across the study area. The most notable feature is the heterogeneity in PRE trends, both spatially and seasonally. During the winter, significant decreasing trends (p < 0.05) are observed in parts of North Africa, particularly Morocco and northern Algeria. This aligns with the findings of Tramblay et al. [62], who reported a decline in winter PRE in the western Mediterranean region. This trend aligns with the negative correlation between winter rainfall and the North Atlantic Oscillation (NAO) in the region, as reported by Lüdecke et al. [63]. The NAO’s influence on Moroccan precipitation is particularly strong during boreal autumn and winter, with negative NAO phases associated with increased rainfall [64]. Conversely, parts of the Arabian Peninsula and Central Asia show increasing trends, albeit with limited spatial coherence. This variability may be partially attributed to the complex interactions between the Indian Ocean Dipole (IOD) and the El Niño-Southern Oscillation (ENSO), which have been shown to influence rainfall patterns in the broader region [65]. The spring season exhibits a mixed pattern, with significant decreasing trends in the eastern Mediterranean and parts of Central Asia, while increasing trends are observed in portions of the Arabian Peninsula and eastern Iran. The spatial variability in spring PRE trends is consistent with the complex spring PRE patterns reported by Zittis [66] for the MENA region. The Atlantic Multidecadal Oscillation (AMO) may play a role in modulating these patterns, as it has been linked to rainfall variability in parts of North Africa and the Middle East. Summer and autumn seasons show less pronounced trends, with scattered areas of significant change. Notably, parts of the Sahel region display increasing trends in summer PRE, which aligns with the “Sahel greening” phenomenon reported by Adeyeri et al. [58] and Dardel et al. [67]. This trend may be influenced by the positive phase of the AMO, which has been associated with increased Sahel rainfall [68]. However, the limited extent of significant trends in summer and autumn suggests a higher degree of interannual variability during these seasons. This variability may be influenced by complex interactions between multiple teleconnection patterns, including ENSO, IOD, and the Pacific Decadal Oscillation (PDO) [63]. These findings underscore the complex nature of PRE changes in arid regions and highlight the need for region-specific adaptation strategies in water resource management.
Figure 12 and Figure 13 depict the spatial trends of seasonal TMIN and TMAX, respectively. Both variables show a predominant warming trend across all seasons, with extensive areas of statistically significant increases (p < 0.05). For TMIN (Figure 12), the warming trend is particularly pronounced in winter and spring across the MENA region. This is consistent with the findings of Donat et al. [3], who reported stronger warming trends in cold extremes compared to warm extremes in the Arab region. The summer and autumn seasons also show widespread warming but with some spatial variability in the magnitude of trends. TMAX trends (Figure 13) exhibit a similar pattern of widespread warming but with some notable differences. The most intense warming trends for TMAX are observed in summer and spring, particularly over the Arabian Peninsula and parts of North Africa. This aligns with the findings of Lelieveld et al. [34], who projected amplified summer warming in the MENA region due to anthropogenic climate change. The consistent and significant warming trends across both TMIN and TMAX highlight the intensification of heat stress in these already hot arid regions [5]. This has profound implications for human health, agriculture, and ecosystems, as Pal and Eltahir [69] discussed in their study on future temperature extremes in the Middle East.
Figure 14 illustrates the spatial trends of seasonal PET. The trends in PET closely mirror those of TMAX, with widespread increasing trends across all seasons. This relationship is expected, given the strong dependence of PET on temperature [70]. The most pronounced increases in PET are observed in summer and spring, particularly over the Arabian Peninsula, Iran, and parts of North Africa. The increasing PET trends have significant implications for water resources in these arid regions. This is particularly concerning given the limited water resources in these arid regions, as Voss et al. [71] highlighted in their study on groundwater depletion in the Middle East and other parts of the world.
Figure 15 presents the annual trends for PET, PRE, TMIN and TMAX. The annual trends largely reflect the patterns observed in the seasonal analysis but provide an integrated view of long-term climate change in the region. Annual PRE shows a mixed pattern of trends, with significant decreases in parts of North Africa and the eastern Mediterranean and increases in portions of the Arabian Peninsula and Central Asia. Annual TMIN and TMAX show widespread significant warming trends across the entire study area, with particularly strong warming over the Arabian Peninsula and parts of North Africa. Annual PET trends closely follow the temperature patterns, with significant increases across most of the study area. The combination of rising PET and variable precipitation trends suggests an overall intensification of aridity in many parts of the region, consistent with projections of expanding arid climates under global warming scenarios [9,52].

5. Limitations and Future Research Directions

This study provides valuable insights into the spatial-temporal climate variability in the arid regions of Central and Western Asia and North Africa. However, limitations in data resolution and scope are acknowledged. The research relies on the CRU TS 4.07 dataset with a 0.5° spatial resolution, which may not capture local-scale climate variations, particularly in areas with complex topography. Future studies could benefit from higher-resolution datasets or a combination of multiple data sources, including satellite-derived products, to improve spatial representation of climate variables.
Although the study identifies significant trends in climate variables, it does not extensively explore underlying climate drivers or teleconnections influencing these patterns. Future research could investigate the roles of large-scale atmospheric circulation patterns (e.g., ENSO, NAO) and their impacts on regional climate variability. Additionally, attribution studies could determine the relative contributions of various factors (e.g., greenhouse gas emissions and natural variability) to the observed climate changes in these arid regions [5,72]. Also, future research directions could include incorporating climate model projections under various emission scenarios to offer insights into potential future climate changes and their implications for water resources, agriculture, and ecosystems [9,73].

6. Conclusions

The study of climate variability in the arid regions of Central and Western Asia and North Africa from 1901 to 2022 reveals significant and complex patterns of change across multiple climatic variables. The analysis, encompassing PRE, TMIN, TMAX, and PET, provides crucial insights into the evolving climate variability of these water-scarce regions. PRE patterns show marked spatial and temporal heterogeneity. Precipitation shows high variability, with a slight negative tendency overall (Z = −0.881, p = 0.378), but significant decreases from 1951–2000 (−0.489 mm/year, Z = −3.329, p = 0.001). Recent winter precipitation (2001–2022) shows significant decline (Z = −1.974, p = 0.048, Sen’s slope = −0.378). Temperatures increased significantly, with TMIN rising faster (Z = 9.591, p < 0.001, Sen’s slope = 0.013 °C/year) than TMAX (Z = 8.405, p < 0.001, Sen’s slope = 0.011 °C/year). Summer exhibited the strongest warming (TMAX Z = 8.020, p < 0.001, Sen’s slope = 0.010 °C/year). PET increased across all seasons (annual Z = 6.041, p < 0.001, Sen’s slope = 0.014 mm/year), accelerating in recent decades (2001–2022: 0.024 mm/year annually). Summer showed the highest PET increase (Z = 5.647, p < 0.001). This rise in PET, combined with the variable precipitation trends, suggests an intensification of aridity across much of the study area.
Spatially, the analysis revealed distinct patterns in climate variability. Coastal regions of North Africa and northern parts of West Asia showed higher precipitation, particularly in winter and spring, while interior regions consistently exhibited low PRE. Temperature distributions displayed a clear latitudinal gradient, with the highest temperatures in the southern parts of the study area, particularly in the Sahara Desert and Arabian Peninsula. PET patterns closely followed temperature distributions, with the highest values observed during summer across most of the study area, especially in the Sahara Desert, Arabian Peninsula, and lowland areas of Central Asia. The long-term spatial trends analysis using the MMK test revealed significant warming trends across the entire study area for both TMIN and TMAX, with particularly strong warming over the Arabian Peninsula and parts of North Africa. Precipitation trends showed more spatial variability, with significant decreases in parts of North Africa and the eastern Mediterranean and increases in portions of the Arabian Peninsula and Central Asia. The current study provides robust evidence of significant climate change in the study area over the past century. The combination of rising temperatures, increasing PET, and variable precipitation trends points to an overall intensification of aridity in many parts of the region. These changes have profound implications for water resources, agriculture, ecosystems, and human activities in these vulnerable areas.
The spatial and temporal heterogeneity in climate trends underscores the need for region-specific adaptation strategies and highlights the importance of continued monitoring and analysis of climate variables in arid regions. These findings contribute to the growing body of evidence on climate change impacts in water-scarce environments and provide valuable insights for climate adaptation and mitigation efforts in these critical regions.

Supplementary Materials

The following supporting information can be downloaded at: https://www.mdpi.com/article/10.3390/w16223161/s1. Table S1. Comprehensive overview of key climatic variables and their basic statistical metrics. Figure S1: Long-term spatial distribution of seasonal precipitation in the Arid countries of North Africa, West and Central Asia (1901–2022). Figure S2. Long-term spatial distribution of seasonal minimum temperature in the Arid countries of North Africa, West and Central Asia (1901–2022). Figure S3. Long-term spatial distribution of seasonal maximum temperature in the Arid countries of North Africa, West and Central Asia (1901–2022). Figure S4. Long-term spatial distribution of seasonal potential evapotranspiration in the Arid countries of North Africa, West and Central Asia (1901–2022). Figure S5. Long-term Spatial Distribution of Annual PET, Precipitation, Minimum and Maximum Temperature in the Arid Regions of North Africa, West Asia, and Central Asia (1901–2022).

Author Contributions

A.T.O.: Writing—original draft, Visualization, Methodology, Investigation, Formal analysis, Conceptualization. O.E.A.: Writing—review and editing. X.X.: Supervision, Writing—review & editing. H.Y.: Writing—review and editing. Q.J.: Visualization. O.T.F.: Writing—review and editing. All authors have read and agreed to the published version of the manuscript.

Funding

This work was supported by Northwest Institute of Ecological Environment and Resources, Chinese Academy of Science (grant number: E429020101).

Data Availability Statement

The URL of the data used in this study can be found in the text.

Conflicts of Interest

The authors declare that they have no known competing financial interests or personal relationships that could have influenced the work reported in this paper.

References

  1. Elizbarashvili, M.; Elizbarashvili, E.; Tatishvili, M.; Elizbarashvili, S.; Meskhia, R.; Kutaladze, N.; King, L.; Keggenhoff, I.; Khardziani, T. Georgian climate change under global warming conditions. Ann. Agrar. Sci. 2017, 15, 17–25. [Google Scholar] [CrossRef]
  2. Adeyeri, O.E.; Laux, P.; Ishola, K.A.; Zhou, W.; Balogun, I.A.; Adeyewa, Z.D.; Kunstmann, H. Homogenising meteorological variables: Impact on trends and associated climate indices. J. Hydrol. 2022, 607, 127585. [Google Scholar] [CrossRef]
  3. Donat, M.G.; Peterson, T.C.; Brunet, M.; King, A.D.; Almazroui, M.; Kolli, R.K.; Boucherf, D.; Al-Mulla, A.Y.; Nour, A.Y.; Aly, A.A.; et al. Changes in extreme temperature and precipitation in the Arab region: Long-term trends and variability related to ENSO and NAO. Int. J. Climatol. 2014, 34, 581–592. [Google Scholar] [CrossRef]
  4. Ongoma, V.; Chen, H. Temporal and spatial variability of temperature and precipitation over East Africa from 1951 to 2010. Meteorol. Atmos. Phys. 2017, 129, 131–144. [Google Scholar] [CrossRef]
  5. Adeyeri, O.E.; Zhou, W.; Wang, X.; Zhang, R.; Laux, P.; Ishola, K.A.; Usman, M. The trend and spatial spread of multisectoral climate extremes in CMIP6 models. Sci. Rep. 2022, 12, 21000. [Google Scholar] [CrossRef]
  6. Liuzzo, L.; Bono, E.; Sammartano, V.; Freni, G. Analysis of spatial and temporal rainfall trends in Sicily during the 1921–2012 period. Theor. Appl. Climatol. 2016, 126, 113–129. [Google Scholar] [CrossRef]
  7. Revesz, R.L.; Howard, P.H.; Arrow, K.; Goulder, L.H.; Kopp, R.E.; Livermore, M.A.; Oppenheimer, M.; Sterner, T. Global warming: Improve economic models of climate change. Nature 2014, 508, 173–175. [Google Scholar] [CrossRef]
  8. Wheeler, T.; Braun, J. von. Climate change impacts on global food security. Science 2013, 341, 508–513. [Google Scholar] [CrossRef] [PubMed]
  9. Adeyeri, O.E.; Zhou, W.; Ndehedehe, C.E.; Wang, X.; Ishola, K.A.; Laux, P. Minimizing uncertainties in climate projections and water budget reveals the vulnerability of freshwater to climate change. One Earth 2024, 7, 72–87. [Google Scholar] [CrossRef]
  10. Adeyeri, O.E.; Zhou, W.; Laux, P.; Ndehedehe, C.E.; Wang, X.; Usman, M.; Akinsanola, A.A. Multivariate Drought Monitoring, Propagation, and Projection Using Bias-Corrected General Circulation Models. Earth’s Future 2023, 11. [Google Scholar] [CrossRef]
  11. Huang, J.; Li, Y.; Fu, C.; Chen, F.; Fu, Q.; Dai, A.; Shinoda, M.; Ma, Z.; Guo, W.; Li, Z.; et al. Dryland climate change: Recent progress and challenges. Rev. Geophys. 2017, 55, 719–778. [Google Scholar] [CrossRef]
  12. Trenberth, K.E.; Fasullo, J.T.; Shepherd, T.G. Attribution of climate extreme events. Nat. Clim Chang. 2015, 5, 725–730. [Google Scholar] [CrossRef]
  13. Oswald, J.; Harris, S. Desertification. Biological and Environmental Hazards, Risks, and Disasters; Elsevier: Amsterdam, The Netherlands, 2023; pp. 369–393. ISBN 9780128205099. [Google Scholar]
  14. Zittis, G.; Hadjinicolaou, P.; Klangidou, M.; Proestos, Y.; Lelieveld, J. A multi-model, multi-scenario, and multi-domain analysis of regional climate projections for the Mediterranean. Reg. Environ. Chang. 2019, 19, 2621–2635. [Google Scholar] [CrossRef]
  15. Karzani, M.; Ghavidel, Y.; Farajzadeh, M. Temporal Changes in Lethal Temperatures Above 50 °C in the Northern Hemisphere. Pure Appl. Geophys. 2022, 179, 3377–3390. [Google Scholar] [CrossRef]
  16. Zittis, G.; Hadjinicolaou, P.; Almazroui, M.; Bucchignani, E.; Driouech, F.; El Rhaz, K.; Kurnaz, L.; Nikulin, G.; Ntoumos, A.; Ozturk, T.; et al. Business-as-usual will lead to super and ultra-extreme heatwaves in the Middle East and North Africa. NPJ Clim. Atmos. Sci. 2021, 4, 20. [Google Scholar] [CrossRef]
  17. Goyal, M.K.; Singh, S.; Jain, V. Heat waves characteristics intensification across Indian smart cities. Sci. Rep. 2023, 13, 14786. [Google Scholar] [CrossRef]
  18. Almazroui, M.; Saeed, S.; Saeed, F.; Islam, M.N.; Ismail, M. Projections of Precipitation and Temperature over the South Asian Countries in CMIP6. Earth Syst. Environ. 2020, 4, 297–320. [Google Scholar] [CrossRef]
  19. Feulner, G.R. Geography and Geology of the United Arab Emirates: A Naturalist’s Introduction. In A Natural History of the Emirates; Burt, J.A., Ed.; Springer Nature: Cham, Switzerland, 2024; pp. 13–64. ISBN 978-3-031-37396-1. [Google Scholar]
  20. Middleton, N.J.; Thomas, D. World Atlas of Desertification, 2nd ed.; United Nations Environment Programme (UNEP); Arnold: London, UK, 1997. [Google Scholar]
  21. Gardner, J. How water, wind, waves and ice shape landscapes and landforms: Historical contributions to geomorphic science. Geomorphology 2020, 366, 106687. [Google Scholar] [CrossRef]
  22. Engelstaedter, S.; Kohfeld, K.E.; Tegen, I.; Harrison, S.P. Controls of dust emissions by vegetation and topographic depressions: An evaluation using dust storm frequency data. Geophys. Res. Lett. 2003, 30, 1294. [Google Scholar] [CrossRef]
  23. Hamed, K.H.; Ramachandra Rao, A. A modified Mann-Kendall trend test for autocorrelated data. J. Hydrol. 1998, 204, 182–196. [Google Scholar] [CrossRef]
  24. Tabari, H.; Willems, P. More prolonged droughts by the end of the century in the Middle East. Environ. Res. Lett. 2018, 13, 104005. [Google Scholar] [CrossRef]
  25. Nicholson, S.E. Dryland Climatology; Cambridge University Press: Cambridge, UK, 2011; ISBN 9780521516495. [Google Scholar]
  26. Trenberth, K.E. Changes in precipitation with climate change. Clim. Res. 2011, 47, 123–138. [Google Scholar] [CrossRef]
  27. Mariotti, A.; Pan, Y.; Zeng, N.; Alessandri, A. Long-term climate change in the Mediterranean region in the midst of decadal variability. Clim. Dyn. 2015, 44, 1437–1456. [Google Scholar] [CrossRef]
  28. Vicente-Serrano, S.M.; McVicar, T.R.; Miralles, D.G.; Yang, Y.; Tomas-Burguera, M. Unraveling the influence of atmospheric evaporative demand on drought and its response to climate change. WIREs Clim. Chang. 2020, 11, e632. [Google Scholar] [CrossRef]
  29. Adeyeri, O.E.; Zhou, W.; Ndehedehe, C.E.; Wang, X. Global vegetation, moisture, thermal and climate interactions intensify compound extreme events. Sci. Total Environ. 2024, 912, 169261. [Google Scholar] [CrossRef] [PubMed]
  30. Hoerling, M.; Eischeid, J.; Perlwitz, J.; Quan, X.; Zhang, T.; Pegion, P. On the Increased Frequency of Mediterranean Drought. J. Clim. 2012, 25, 2146–2161. [Google Scholar] [CrossRef]
  31. He, J.; Deser, C.; Soden, B.J. Atmospheric and Oceanic Origins of Tropical Precipitation Variability. J. Clim. 2017, 30, 3197–3217. [Google Scholar] [CrossRef]
  32. Zhang, R.; Tian, W.; He, X.; Qie, K.; Liu, D.; Tian, H. Enhanced influence of ENSO on winter precipitation over southern China in recent decades. J. Clim. 2021, 34, 7983–7994. [Google Scholar] [CrossRef]
  33. IPCC. Climate Change 2021: The Physical Science Basis. Contribution of Working Group I to the Sixth Assessment Report of the Intergovernmental Panel on Climate Change; The Intergovernmental Panel on Climate Change; Cambridge University Press: Cambridge, UK, 2021. [Google Scholar]
  34. Lelieveld, J.; Proestos, Y.; Hadjinicolaou, P.; Tanarhte, M.; Tyrlis, E.; Zittis, G. Strongly increasing heat extremes in the Middle East and North Africa (MENA) in the 21st century. Clim. Chang. 2016, 137, 245–260. [Google Scholar] [CrossRef]
  35. Sherwood, S.; Fu, Q. Climate change. A drier future? Science 2014, 343, 737–739. [Google Scholar] [CrossRef]
  36. Sonali, P.; Nagesh Kumar, D. Spatio-temporal variability of temperature and potential evapotranspiration over India. J. Water Clim. Chang. 2016, 7, 810–822. [Google Scholar] [CrossRef]
  37. Hu, Z.; Chen, X.; Chen, D.; Li, J.; Wang, S.; Zhou, Q.; Yin, G.; Guo, M. “Dry gets drier, wet gets wetter”: A case study over the arid regions of central Asia. Int. J. Climatol. 2019, 39, 1072–1091. [Google Scholar] [CrossRef]
  38. Mueller, B.; Seneviratne, S.I. Systematic land climate and evapotranspiration biases in CMIP5 simulations. Geophys. Res. Lett. 2014, 41, 128–134. [Google Scholar] [CrossRef] [PubMed]
  39. Huang, J.; Ji, M.; Xie, Y.; Wang, S.; He, Y.; Ran, J. Global semi-arid climate change over last 60 years. Clim Dyn 2016, 46, 1131–1150. [Google Scholar] [CrossRef]
  40. Schurer, A.P.; Hegerl, G.C.; Goosse, H.; Bollasina, M.A.; England, M.H.; Smith, D.M.; Tett, S.F.B. Role of multi-decadal variability of the winter North Atlantic Oscillation on Northern Hemisphere climate. Environ. Res. Lett. 2023, 18, 44046. [Google Scholar] [CrossRef]
  41. Cai, W.; Santoso, A.; Wang, G.; Yeh, S.-W.; An, S.-I.; Cobb, K.M.; Collins, M.; Guilyardi, E.; Jin, F.-F.; Kug, J.-S.; et al. ENSO and greenhouse warming. Nat. Clim. Chang. 2015, 5, 849–859. [Google Scholar] [CrossRef]
  42. Sowers, J.; Vengosh, A.; Weinthal, E. Climate change, water resources, and the politics of adaptation in the Middle East and North Africa. Clim. Chang. 2011, 104, 599–627. [Google Scholar] [CrossRef]
  43. Kelley, C.P.; Mohtadi, S.; Cane, M.A.; Seager, R.; Kushnir, Y. Climate change in the Fertile Crescent and implications of the recent Syrian drought. Proc. Natl. Acad. Sci. USA 2015, 112, 3241–3246. [Google Scholar] [CrossRef]
  44. Lobell, D.B.; Schlenker, W.; Costa-Roberts, J. Climate trends and global crop production since 1980. Science 2011, 333, 616–620. [Google Scholar] [CrossRef]
  45. Davy, R.; Esau, I.; Chernokulsky, A.; Outten, S.; Zilitinkevich, S. Diurnal asymmetry to the observed global warming. Int. J. Climatol. 2017, 37, 79–93. [Google Scholar] [CrossRef]
  46. Vicente-Serrano, S.M.; Lopez-Moreno, J.-I.; Beguería, S.; Lorenzo-Lacruz, J.; Sanchez-Lorenzo, A.; García-Ruiz, J.M.; Azorin-Molina, C.; Morán-Tejeda, E.; Revuelto, J.; Trigo, R.; et al. Evidence of increasing drought severity caused by temperature rise in southern Europe. Environ. Res. Lett. 2014, 9, 44001. [Google Scholar] [CrossRef]
  47. Turco, M.; von Hardenberg, J.; AghaKouchak, A.; Llasat, M.C.; Provenzale, A.; Trigo, R.M. On the key role of droughts in the dynamics of summer fires in Mediterranean Europe. Sci. Rep. 2017, 7, 81. [Google Scholar] [CrossRef] [PubMed]
  48. Fu, Q.; Feng, S. Responses of terrestrial aridity to global warming. J. Geophys. Res. Atmos. 2014, 119, 7863–7875. [Google Scholar] [CrossRef]
  49. Francis, D.; Fonseca, R. Recent and projected changes in climate patterns in the Middle East and North Africa (MENA) region. Sci. Rep. 2024, 14, 10279. [Google Scholar] [CrossRef] [PubMed]
  50. Lelieveld, J.; Hadjinicolaou, P.; Kostopoulou, E.; Chenoweth, J.; El Maayar, M.; Giannakopoulos, C.; Hannides, C.; Lange, M.A.; Tanarhte, M.; Tyrlis, E.; et al. Climate change and impacts in the Eastern Mediterranean and the Middle East. Clim. Chang. 2012, 114, 667–687. [Google Scholar] [CrossRef]
  51. Luo, M.; Liu, T.; Meng, F.; Duan, Y.; Bao, A.; Frankl, A.; de Maeyer, P. Spatiotemporal characteristics of future changes in precipitation and temperature in Central Asia. Int. J. Climatol. 2019, 39, 1571–1588. [Google Scholar] [CrossRef]
  52. Huang, J.; Yu, H.; Guan, X.; Wang, G.; Guo, R. Accelerated dryland expansion under climate change. Nat. Clim. Chang. 2016, 6, 166–171. [Google Scholar] [CrossRef]
  53. Loarie, S.R.; Duffy, P.B.; Hamilton, H.; Asner, G.P.; Field, C.B.; Ackerly, D.D. The velocity of climate change. Nature 2009, 462, 1052–1055. [Google Scholar] [CrossRef]
  54. Schlaepfer, D.R.; Bradford, J.B.; Lauenroth, W.K.; Munson, S.M.; Tietjen, B.; Hall, S.A.; Wilson, S.D.; Duniway, M.C.; Jia, G.; Pyke, D.A.; et al. Climate change reduces extent of temperate drylands and intensifies drought in deep soils. Nat. Commun. 2017, 8, 14196. [Google Scholar] [CrossRef]
  55. Vose, R.S.; Easterling, D.R.; Gleason, B. Maximum and minimum temperature trends for the globe: An update through 2004. Geophys. Res. Lett. 2005, 32, L23822. [Google Scholar] [CrossRef]
  56. Diffenbaugh, N.S.; Scherer, M. Observational and model evidence of global emergence of permanent, unprecedented heat in the 20(th) and 21(st) centuries. Clim. Chang. 2011, 107, 615–624. [Google Scholar] [CrossRef] [PubMed]
  57. Barnett, T.P.; Adam, J.C.; Lettenmaier, D.P. Potential impacts of a warming climate on water availability in snow-dominated regions. Nature 2005, 438, 303–309. [Google Scholar] [CrossRef] [PubMed]
  58. Adeyeri, O.E.; Folorunsho, A.H.; Ayegbusi, K.I.; Bobde, V.; Adeliyi, T.E.; Ndehedehe, C.E.; Akinsanola, A.A. Land surface dynamics and meteorological forcings modulate land surface temperature characteristics. Sustain. Cities Soc. 2024, 101, 105072. [Google Scholar] [CrossRef]
  59. McVicar, T.R.; Roderick, M.L.; Donohue, R.J.; Li, L.T.; van Niel, T.G.; Thomas, A.; Grieser, J.; Jhajharia, D.; Himri, Y.; Mahowald, N.M.; et al. Global review and synthesis of trends in observed terrestrial near-surface wind speeds: Implications for evaporation. J. Hydrol. 2012, 416–417, 182–205. [Google Scholar] [CrossRef]
  60. Zhang, Y.; Peña-Arancibia, J.L.; McVicar, T.R.; Chiew, F.H.S.; Vaze, J.; Liu, C.; Lu, X.; Zheng, H.; Wang, Y.; Liu, Y.Y.; et al. Multi-decadal trends in global terrestrial evapotranspiration and its components. Sci. Rep. 2016, 6, 19124. [Google Scholar] [CrossRef] [PubMed]
  61. Feng, S.; Fu, Q. Expansion of global drylands under a warming climate. Atmos. Chem. Phys. 2013, 13, 10081–10094. [Google Scholar] [CrossRef]
  62. Tramblay, Y.; Koutroulis, A.; Samaniego, L.; Vicente-Serrano, S.M.; Volaire, F.; Boone, A.; Le Page, M.; Llasat, M.C.; Albergel, C.; Burak, S.; et al. Challenges for drought assessment in the Mediterranean region under future climate scenarios. Earth-Sci. Rev. 2020, 210, 103348. [Google Scholar] [CrossRef]
  63. Lüdecke, H.-J.; Müller-Plath, G.; Wallace, M.G.; Lüning, S. Decadal and multidecadal natural variability of African rainfall. J. Hydrol. Reg. Stud. 2021, 34, 100795. [Google Scholar] [CrossRef]
  64. Knippertz, P.; Christoph, M.; Speth, P. Long-term precipitation variability in Morocco and the link to the large-scale circulation in recent and future climates. Meteorol. Atmos. Phys. 2003, 83, 67–88. [Google Scholar] [CrossRef]
  65. Hoell, A.; Funk, C.; Zinke, J.; Harrison, L. Modulation of the Southern Africa precipitation response to the El Niño Southern Oscillation by the subtropical Indian Ocean Dipole. Clim. Dyn. 2017, 48, 2529–2540. [Google Scholar] [CrossRef]
  66. Zittis, G. Observed rainfall trends and precipitation uncertainty in the vicinity of the Mediterranean, Middle East and North Africa. Theor. Appl. Climatol. 2018, 134, 1207–1230. [Google Scholar] [CrossRef]
  67. Dardel, C.; Kergoat, L.; Hiernaux, P.; Mougin, E.; Grippa, M.; Tucker, C.J. Re-greening Sahel: 30years of remote sensing data and field observations (Mali, Niger). Remote Sens. Environ. 2014, 140, 350–364. [Google Scholar] [CrossRef]
  68. Zhang, R.; Delworth, T.L. Impact of Atlantic multidecadal oscillations on India/Sahel rainfall and Atlantic hurricanes. Geophys. Res. Lett. 2006, 33, L17712. [Google Scholar] [CrossRef]
  69. Pal, J.S.; Eltahir, E.A.B. Future temperature in southwest Asia projected to exceed a threshold for human adaptability. Nature Clim. Chang. 2016, 6, 197–200. [Google Scholar] [CrossRef]
  70. Allen, R.G. Crop Evapotranspiration: Guidelines for Computing Crop Water Requirements; Food and Agriculture Organization of the United Nations: Rome, Italy, 1998; ISBN 9251042195. [Google Scholar]
  71. Voss, K.A.; Famiglietti, J.S.; Lo, M.; Linage, C.; Rodell, M.; Swenson, S.C. Groundwater depletion in the Middle East from GRACE with implications for transboundary water management in the Tigris-Euphrates-Western Iran region. Water Resour. Res. 2013, 49, 904–914. [Google Scholar] [CrossRef] [PubMed]
  72. Stott, P.A.; Christidis, N.; Otto, F.E.L.; Sun, Y.; Vanderlinden, J.-P.; van Oldenborgh, G.J.; Vautard, R.; von Storch, H.; Walton, P.; Yiou, P.; et al. Attribution of extreme weather and climate-related events. Wiley Interdiscip. Rev. Clim. Chang. 2016, 7, 23–41. [Google Scholar] [CrossRef]
  73. Giorgi, F.; Lionello, P. Climate change projections for the Mediterranean region. Glob. Planet. Chang. 2008, 63, 90–104. [Google Scholar] [CrossRef]
Figure 1. The map of the study area showing the terrain elevation.
Water 16 03161 g001
Figure 2. Changes in seasonal precipitation time series. Note: The red dash lines and points show change points. The texts represent the seasonal trends before and after change points, respectively.
Water 16 03161 g002
Figure 3. Changes in seasonal maximum temperature time series.
Water 16 03161 g003
Figure 4. Changes in seasonal minimum temperature time series.
Water 16 03161 g004
Figure 5. Changes in seasonal potential evapotranspiration (PET) time series.
Water 16 03161 g005
Figure 6. Century-long comparison of spatial patterns: annual PET, Precipitation, Minimum and Maximum Temperature for 1901–2000 (first four panels) and 2021–2022 (last four panels) periods in the study area.
Water 16 03161 g006
Figure 7. Century-long comparison of spatial patterns for seasonal precipitation during the 1901–2000 (first four panels) and 2021–2022 (last four panels) periods in the study area.
Water 16 03161 g007
Figure 8. Century-long comparison of spatial patterns for seasonal minimum temperature during the 1901–2000 (first four panels) and 2021–2022 (last four panels) periods in the study area.
Water 16 03161 g008
Figure 9. Century-long comparison of spatial patterns for seasonal maximum temperature during the 1901–2000 (first four panels) and 2021–2022 (last four panels) periods in the study area.
Water 16 03161 g009
Figure 10. Century-long comparison of spatial patterns for seasonal PET during the 1901–2000 (first four panels) and 2021–2022 (last four panels) periods in the study area.
Water 16 03161 g010
Figure 11. Century-long spatial trends of seasonal precipitation in arid regions of North Africa, West Asia, and Central Asia (1901–2022) using the Modified Mann-Kendall test. Note: The stippled areas indicate trends significant at the 95 % confidence level.
Water 16 03161 g011
Figure 12. Century-long spatial trends of seasonal minimum temperature in arid regions of North Africa, West Asia, and Central Asia (1901–2022) using the Modified Mann-Kendall test.
Water 16 03161 g012
Figure 13. Century-long spatial trends of seasonal maximum temperature in arid regions of North Africa, West Asia, and Central Asia (1901–2022) using the Modified Mann-Kendall test.
Water 16 03161 g013
Figure 14. Century-long spatial trends of seasonal potential evapotranspiration in arid regions of North Africa, West Asia, and Central Asia (1901–2022) using the Modified Mann-Kendall test.
Water 16 03161 g014
Figure 15. Century-long spatial trends of annual PET, Precipitation, Minimum and Maximum Temperature in arid regions of North Africa, West Asia, and Central Asia (1901–2022) using the Modified Mann-Kendall test.
Water 16 03161 g015
Table 1. MMK and Sen’s tests statistics for annual and seasonal precipitation.
SeasonsFirst YearLast YearNo of YearsZ-Statisticp-ValueKendall TauSen’s Slope
DJF1901195050−0.0170.987−0.002−0.001
19512000500.3180.7510.0320.019
2001202222−1.9740.048−0.307−0.378
19012022122−0.3810.703−0.023−0.006
MAM1901195050−0.7700.442−0.076−0.030
1951200050−1.1380.255−0.112−0.069
20012022220.0001.000−0.004−0.004
19012022122−0.1280.898−0.008−0.002
JJA19011950502.0240.0430.1980.145
1951200050−3.6640.000−0.358−0.426
20012022221.2410.2150.1950.268
19012022122−0.6150.538−0.038−0.012
SON19011950500.3850.7000.0380.023
1951200050−1.3890.165−0.136−0.103
20012022220.2260.8220.0390.028
190120221220.9600.3370.0590.013
Annual19011950500.0670.9470.0070.006
1951200050−3.3290.001−0.326−0.489
20012022221.0150.310.160.436
19012022122−0.8810.378−0.054−0.028
Table 2. MMK and Sen’s tests statistics for annual and seasonal minimum temperature.
SeasonsFirst YearLast YearNo of YearsZ-Statisticp-ValueKendall TauSen’s Slope
DJF1901195050−0.0170.987−0.0020.000
19512000502.8780.0040.2820.020
20012022221.1840.2360.1860.021
190120221226.1470.0000.3770.012
MAM19011950502.0410.0410.2000.009
19512000504.6010.0000.4500.018
20012022221.1840.2360.1860.015
190120221229.5020.0000.5820.015
JJA19011950502.5090.0120.2460.005
19512000505.8390.0000.5710.022
20012022223.4400.0010.5320.027
190120221229.5160.0000.5830.012
SON19011950502.2750.0230.2230.008
19512000504.8350.0000.4730.020
2001202222−0.8460.398−0.134−0.008
190120221228.1520.0000.4990.011
Annual19011950502.0740.0380.2030.006
19512000505.6210.0000.5490.021
20012022222.1430.0320.3330.014
190120221229.5910.0000.5870.013
Table 3. MMK and Sen’s tests statistics for annual and seasonal maximum temperature.
SeasonsFirst YearLast YearNo of YearsZ-Statisticp-ValueKendall TauSen’s Slope
DJF1901195050−0.1000.920−0.011−0.001
19512000501.5560.1200.1530.012
20012022221.0720.2840.1690.019
190120221225.0370.0000.3080.010
MAM19011950501.6730.0940.1640.009
19512000502.7770.0050.2720.014
20012022220.9020.3670.1430.016
190120221227.7760.0000.4760.014
JJA19011950502.1580.0310.2110.004
19512000505.2200.0000.5100.021
20012022222.8200.0050.4370.027
190120221228.0200.0000.4910.010
SON19011950501.9240.0540.1890.008
19512000503.3120.0010.3240.015
2001202222−0.6770.499−0.108−0.009
190120221226.2450.0000.3820.008
Annual19011950502.0410.0410.2000.006
19512000503.9480.0000.3860.014
20012022221.9740.0480.3070.011
190120221228.4050.0000.5150.011
Table 4. MMK and Sen’s tests statistics for annual and seasonal potential evapotranspiration.
SeasonsFirst YearLast YearNo of YearsZ-Statisticp-ValueKendall TauSen’s Slope
DJF19011950502.6430.0080.2590.004
1951200050−0.1000.920−0.0110.000
20012022220.9020.3670.1430.004
190120221224.2530.0000.2610.002
MAM19011950500.7530.4520.0740.001
19512000501.6230.1050.1590.004
20012022220.9590.3380.1520.007
190120221225.6780.0000.3480.005
JJA19011950500.7700.4420.0760.001
19512000502.6100.0090.2560.007
20012022222.8200.0050.4370.020
190120221225.6470.0000.3460.004
SON19011950502.1580.0310.2110.003
19512000500.6520.5140.0640.001
20012022220.4510.6520.0740.003
190120221224.4700.0000.2740.002
Annual19011950502.0410.0410.2000.008
19512000501.8240.0680.1790.009
20012022222.7070.0070.4200.024
190120221226.0410.0000.3700.014
Disclaimer/Publisher’s Note: The statements, opinions and data contained in all publications are solely those of the individual author(s) and contributor(s) and not of MDPI and/or the editor(s). MDPI and/or the editor(s) disclaim responsibility for any injury to people or property resulting from any ideas, methods, instructions or products referred to in the content.

