Article

Integrated Subsurface Hydrologic Modeling for Agricultural Management Using HYDRUS and UZF Package Coupled with MODFLOW

by
Efthymios Chrysanthopoulos
*,
Martha Perdikaki
*,
Konstantinos Markantonis
and
Andreas Kallioras
Laboratory of Engineering Geology and Hydrogeology, School of Mining and Metallurgical Engineering, National Technical University of Athens, 15772 Zografou, Greece
*
Authors to whom correspondence should be addressed.
Water 2024, 16(22), 3297; https://doi.org/10.3390/w16223297
Submission received: 30 September 2024 / Revised: 2 November 2024 / Accepted: 14 November 2024 / Published: 17 November 2024

Abstract

:
The present work aims to compare two different subsurface hydrological models, namely HYDRUS and MODFLOW UZF package, in terms of groundwater recharge; thus, both models were coupled with MODFLOW. The study area is an experimental kiwifruit orchard located in the Arta plain in the Epirus region of Greece. A novel conceptual framework is introduced in order to (i) use in situ and laboratory measurements to estimate parameter values for both sub-surface flow models; (ii) couple the developed models with MODFLOW to estimate groundwater recharge; and (iii) compare and evaluate the performance of both approaches, with differences stemming from the distinctive equations describing the flow in the unsaturated zone. Detailed soil investigation was conducted in two soil horizons in the research field to identify soil texture zones, along with infiltration experiments implementing both double-ring and single-ring infiltrometers. The results of the field measurements indicate that fine-textured soils are predominant within the field, affecting several hydrological processes, such as infiltration, drainage, and root water uptake. Field measurements were incorporated in unsaturated zone flow modeling and the infiltration fluxes were simulated with the application of both the UZF package of MODFLOW and the HYDRUS code. The two codes presented acceptable agreement between the simulated and observed hydraulic head values with a similar performance in terms of statistics; however, they produced different results regarding recharge rates in the aquifer as simulated by MODFLOW. HYDRUS produced higher hydraulic head values in the aquifer throughout the simulation, related to higher recharge rates arising from the root water uptake and the capillary effects that are computed by HYDRUS but neglected by the UZF package of MODFLOW.

1. Introduction

The need for water in irrigated crops can be satisfied through three main distinct sources: green water, which refers to water retained in the unsaturated zone by precipitation or irrigation and is available for crops; blue water, which includes surface freshwater aquatic systems such as rivers, lakes, reservoirs, and wetlands, in addition to renewable groundwater resources and non-renewable groundwater along with extrinsic water resources [1,2,3]. While blue water can be transferred and administered away from the source, green water management can only be conducted on site. Soil moisture management from global to local scales involves complexity, which arises from the heterogeneous nature of soils and their dynamic development [4]. In groundwater-irrigated agricultural fields, the combined management of green and blue water resources is considered imperative to maintain crop health, improve productivity, and exploit natural water resources in a sustainable way.
Groundwater recharge is closely related to hydrological processes in the unsaturated zone, and its quantification in irrigated agricultural watersheds or fields has been the subject of several research papers [5,6,7,8]. Water budget methods and the water table fluctuation method [5,7,9,10], chloride mass balance among soil moisture measurements (soil water content and soil matric potential) [6], and groundwater modeling [8] have been used for groundwater recharge estimation in agricultural areas. Unsaturated zone flow models have also been used to quantify recharge estimates in various types of land cover, including agricultural sites, in shallow aquifers [11]. Coupling between unsaturated zone flow models and groundwater models, providing the capability of deep understanding of the subsurface flow system and its distinct hydrological processes under the effect of future climate, land use change, and management scenarios, has been implemented for the estimation of groundwater recharge [12]. Quantifying groundwater recharge in agricultural settings is crucial for establishing efficient irrigation practices. To achieve this, combined simulations of unsaturated zone flow and groundwater flow are considered the most robust approach [13,14].
Unsaturated zone water flow simulation is usually conducted with process-based hydrological models which integrate the conceptual approximation of the physical system [15]. The equations describing the flow in the unsaturated porous media are solved by process-based hydrological models [16], while the soil hydraulic properties, which regulate water flow in the unsaturated zone, are derived from laboratory and field experiments or inferred from pedotransfer functions (PTFs), which are used to predict soil hydraulic properties from basic soil attributes [17,18,19,20]. Inverse modeling is used to optimize soil hydraulic properties, with the aim of improving the simulation accuracy of the model [21]. Furthermore, meteorological data and root system parameters, for a specific crop type, are embedded in process-based unsaturated zone models to define the quantities of water penetrating and retained by the physical system.
Several factors, such as soil structure and soil hydraulic properties, vegetation, and meteorological characteristics, influence infiltration, which is considered as one of the predominant sources of groundwater recharge. Groundwater and water in the unsaturated zone are interconnected by infiltration, the rate of which is determined by various hydrological processes in the unsaturated zone. Infiltration is deemed a 1D process in the vertical direction, since it has been proved that 2D or 3D approaches are essential in spatial scales below 10 m [22]. The physical background of the Richards equation [23], the law of capillary flow of Buckingham–Darcy, is challenged by spatial discretization over the spatial limit of 10 m [24].
Although several models have been developed simulating the subsurface flow, both in the saturated and unsaturated zone (CATHY [25], ParFlow [26], WASH123D [27], FEFLOW), using the Richards equation, its implementation in unsaturated zone flow modeling tasks is limited due to the necessity of an abundance of input data, the computational effort, and the required user experience [12]. The coarse spatial resolution of the integrated model grid (>500 m) does not conform to the representative elementary volume assumption that is applied in the Richards equation, which exceeds the proposed horizontal flow scale in the unsaturated zone [24]. For these reasons, the most applicable approach in coupling and feedback between unsaturated zone flow and groundwater flow models results from the interconnection of 1D unsaturated zone models with flow simulation codes in the saturated zone belonging to the family of MODFLOW USGS codes [12]. In this modeling approach, flow in the unsaturated zone is simulated in representative soil horizon profiles within the groundwater model solution domain, pertaining to the flow in the unsaturated zone being conducted in the vertical direction.
Several versions of the MODFLOW code integrate the UZF package [28], which simulates the flow of water in the unsaturated zone using the kinematic wave equation, assuming that the flow in the unsaturated zone is exclusively regulated by gravity. While computational effort is reduced by the implementation of the UZF package, the exclusion of capillary flow in the unsaturated zone does not capture the whole range of hydrological processes, such as upward flow emerging from root water uptake [12]. Given that the effect of gravity regulates the flow in the unsaturated zone in the UZF package, its implementation is more effective in soil matrices in which the groundwater table lies several meters below the soil surface, as in groundwater systems in which the groundwater table lies in the proximity of the soil surface, capillary flow is considered a crucial process [29].
Apart from the provided packages of MODFLOW for the simulation of water flow in the unsaturated zone, several 1D unsaturated zone models which solve the Richards equation have been coupled with MODFLOW-2000 and MODFLOW-2005 codes [12,29,30,31,32]. The most used code for the Richards equation solution and the simulation of water flow in the unsaturated zone is HYDRUS [33]. The HYDRUS 1D free and open-source code solves the mixed form of the Richards equation using the finite element method, with nonlinearities handled through a modified Picard iteration [34]. The code was originally developed in Fortran programming language; however, a Python library (Phydrus) [35] can be used to process the input files, to conduct the simulation through HYDRUS executable, and to visualize the results, providing the capability of efficient coupling between HYDRUS and MODFLOW groundwater models. This paper investigates the simulation of groundwater recharge within the spatial scale of a kiwifruit orchard with the implementation of subsurface hydrological modeling. The great expansion of kiwifruit cultivations within the agricultural basin of Arta’s plain in Greece in recent years has led to the systematic exploitation of local groundwater systems, as kiwifruit irrigation predominantly takes place from groundwater resources. Explicit soil investigation was conducted in two soil horizons in the field to identify soil texture zones, along with infiltration experiments implementing both double-ring and single-ring infiltrometers. Although soil texture within an agricultural field is considered homogeneous, infiltration rates tend to vary extremely in natural and artificial landscapes [36,37,38,39], revealing the effects of soil structure on flow in the unsaturated zone. The saturated hydraulic conductivity (Ksat [L/T]), determining the rate of water flow through saturated soil media [40], was estimated from the modified infiltration rates considering the extent of the wetting front after the experiment [41,42], through a combined form of Philip’s and Kostiakov’s equations [43], used for the first time with field measurements. Infiltration fluxes in the unsaturated zone were simulated with the application of both the UZF MODFLOW package and the HYDRUS code to evaluate potential differences arising from the distinctive equations describing the flow in the unsaturated zone in each code. The HYDRUS infiltration rates simulated for the selected modeling period were integrated into the MODFLOW-2005 groundwater model to compare the resulting groundwater level fluctuations under each unsaturated zone modeling scheme. This study provides important insights into the quantification of groundwater recharge in agricultural fields by evaluating the efficiency of distinct unsaturated zone modeling frameworks.

2. Materials and Methods

For the implementation of the proposed subsurface flow modeling framework, coupling the unsaturated zone flow models with groundwater model for the estimation of groundwater recharge, an experimental kiwifruit orchard located in the Arta plain in the Epirus region of Greece was selected as the research site (Figure 1). The plain is developed within the boundaries of alluvium deposits, while altitudes range between 0 and 20 m, except for two hills in the eastern and southwest boundaries of the plain with altitudes of 246 m and 326 m., respectively. The gradient of the topographical relief in the plain fluctuates within the range of 0–2%. The dominant soil classes in the plain according to the World Reference Base for Soil Resources (WRB) classification are Fluvisols and Cambisols [44,45], while by the USDA texture classification system, the majority of the soils in the plain are classified as silty-clay and silty-clay-loam [46].
The climatic conditions in the Arta plain are characterized as Csa type in the Köppen climate classification [47], with mild winters and dry and warm summers. According to weather data obtained from local meteorological stations ([48] and http://e-pyrros.gr/field-lab-gr/), the average annual rainfall is around 850 mm, with higher precipitation rates occurring from October to March, while the mean temperature ranges from −2.2 °C in January to 36 °C in August.
The area of the experimental field is approximately 36 hectares, with 1500 kiwifruit trees planted per 9 hectares. The specific crop type is ‘Soreli’ kiwifruit, a yellow-fleshed tetraploid selection of Actinidia chinensis, developed at the University of Udine and released for cultivation in 2008 [49]. The tetraploid selection of Actinidia chinensis, ‘Soreli’, according to data emerging from six-year studies after the beginning of its cultivation [50], can be easily adapted to various climatic conditions and soil types. The pattern of root growth in kiwifruit orchards cultivated in various soil types, with a special reference in Actinidia chinensis, reveals a horizontal distribution of 2.2–2.4 m. from the base of the stem [51]. In coarse-textured soils, the roots develop to a depth of 3 m, while in fine-texture soils the root depth is confined within 70 cm from the soil surface [51]. While the development pattern of the root system can be similarly characterized among different cultivation distances in the orchard, kiwifruit selections, soil types, climatic conditions, and agronomic management practices in the field, root depth is restricted with the existence of gravels in soil horizons, seasonal fluctuating groundwater tables in proximity to the soil surface, and poor soil drainage conditions, which are predominant in fine-textured soils [52]. Kiwifruit cultivation is considered quite susceptible to low-oxygen conditions, which are developed in the soil by excess water [53]. Root water uptake by the root system of kiwifruit vines occurs in the upper part of the root system, in proximity to the stem, retrieving the readily available water after irrigation or precipitation events [54].

2.1. Particle Soil Distribution Analysis and Infiltration Experiments in the Field

Within the area of the kiwifruit orchard, 10 samples were collected from 5 locations in the field to conduct a particle soil distribution analysis considering two soil horizons (0–30 cm and 30–60 cm). Soil sampling points were chosen according to the agronomic management of the field, which separates the experimental kiwifruit orchard into five distinct zones. The investigation was expanded from the top-soil to the sub-soil horizons to explore the whole range of physical and manmade impacts in the soil matrix.
The samples were oven-dried at 60 °C overnight and then subjected to wet sieving, to disaggregate hard lumps generated by smaller particles or coatings with coarse particles. The wet sieving classified the grain into sieves with a smaller diameter of 75 μm and then the smaller grains were sorted by hydrometer sedimentation analysis. Hydrometer analysis is based on Stoke’s law, assuming that dispersed soil particles of varying shapes and sizes do not interact when they fall into the water [55]. The organic content of the soil samples used for the hydrometer analysis (50 g) was removed by adding hydrogen peroxide. The dispersing agent used to disaggregate soil particles was sodium hexametaphosphate (Na(PO3)6). Hydrometer values in each step were corrected for meniscus reading, temperature, and dispersing agent. The resulting particle soil distribution curves from the combined wet sieving and hydrometer analysis were fitted by the Andersson model [56,57,58] to retrieve the sand, silt, and clay fractions to classify the samples in the USDA system.
Apart from soil texture analysis, several infiltration tests (single- and double-ring) were conducted in the kiwifruit orchard to investigate the effects of the spatial arrangement of particles in the soil and soil structure [4], and not only the size of the particles. Single- and double-ring infiltration experiments are widely used for determining the infiltration rates of soil media in field conditions. The double-ring methodology has been developed to eliminate the effects of lateral flow during the experiment and, as a result, the integration of significant error in the measurement. However, significant amounts of water are required for the conduction of the double-ring infiltration test, which are not always available in field conditions. Furthermore, the divergence of flow emerging in the double-ring infiltration test cannot be specified at the end of the experiment, as is possible in single-ring infiltration tests. In this study, both types of field infiltration experiments were conducted, covering the spatial extent of the experimental field with single-ring infiltrometers, in which less amount of water is required in comparison with double-ring infiltration tests, which were conducted in each subsection of the kiwifruit orchard.
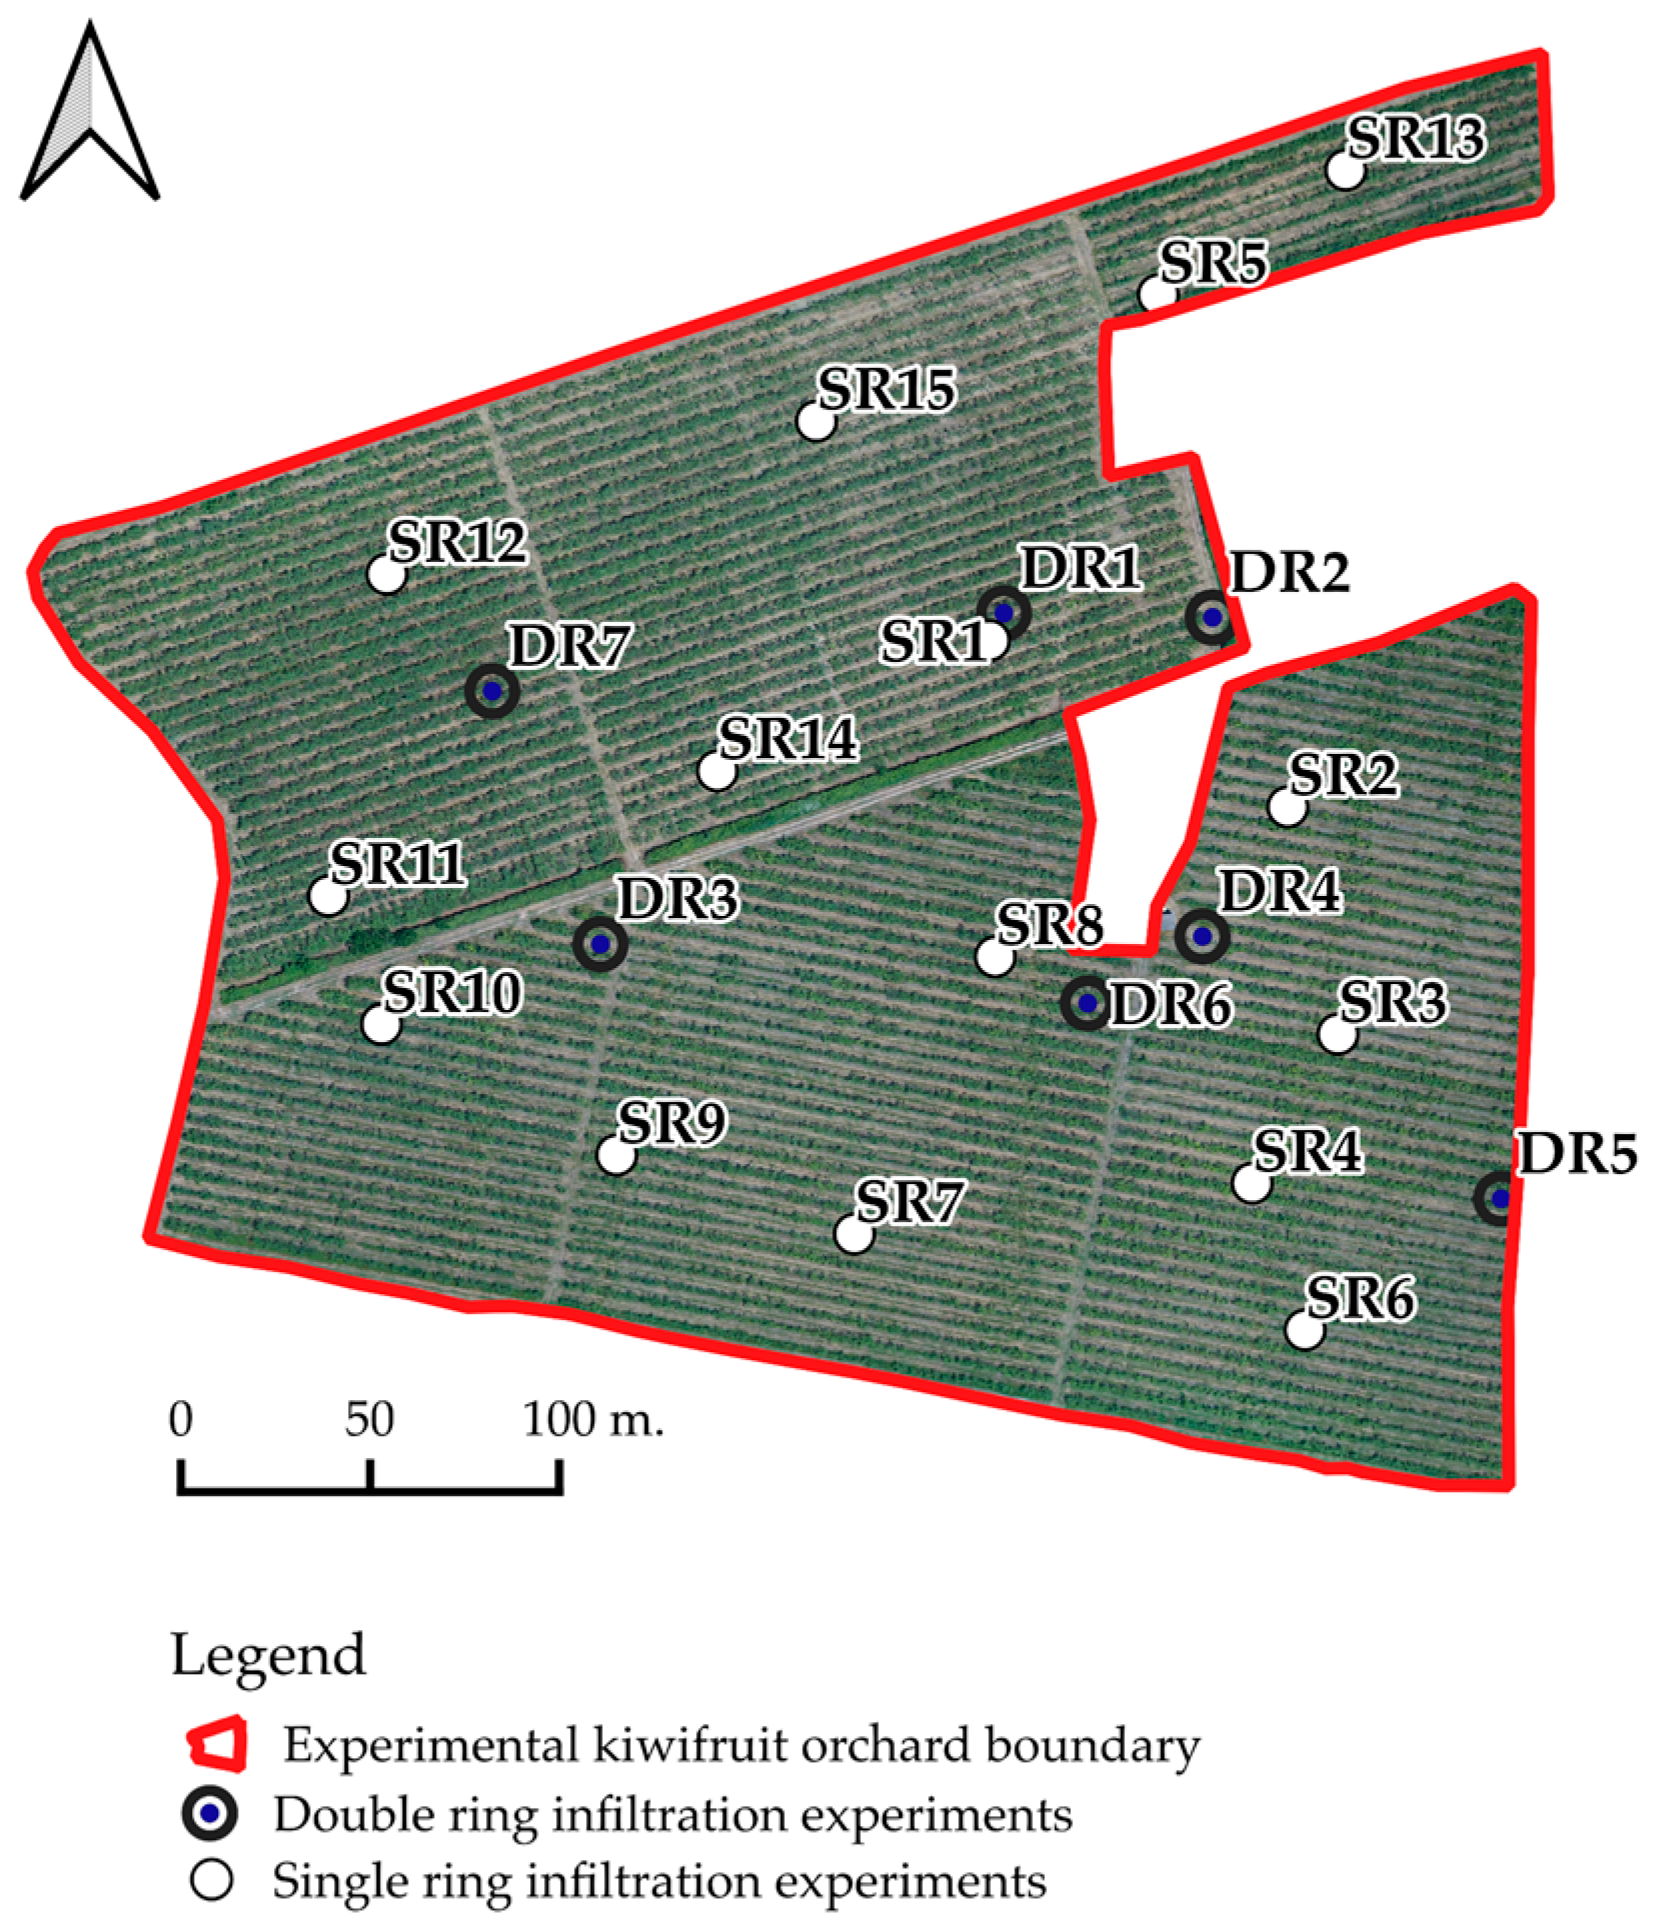
A single ring of 15 cm inner diameter and 20 cm height was constructed for single-ring infiltration experiments [59], while for the double-ring apparatus, an inner ring and an outer ring of 30 cm and 60 cm diameter, respectively, were used. Within the boundaries of the experimental kiwifruit orchard, 15 single-ring and 6 double-ring infiltration experiments were conducted, covering the spatial extent of the field (Figure 2). The single-ring infiltrometers were placed 8 cm below the soil surface and each ring of the double-ring infiltrometer 5 cm below the soil surface, ensuring minimum soil disturbance during the installation. The duration of the experiments was determined from the stabilization of the infiltration rate.
To administer the error emerging on single-ring infiltration concerning the existence of lateral flow, which causes an increase in the infiltration rates, a divergence correction method was used based on wetting front [41,42]. After the conventional single-ring infiltration test was conducted, the soil underneath the experiment was excavated to determine the distance of lateral divergence. The downward infiltration rate in the wetted zone, corrected for lateral divergence, was computed as the ratio of wetted area to the cylinder area, given that the flow in the unsaturated zone is predominantly considered vertical [41].
From the field infiltration experiments, in particular, the single- and double-ring methods, Ksat [L/T] can be estimated by the implementation of mathematical models which describe the cumulative infiltration rates. Widely used in describing the cumulative infiltration curve are the Kostiakov [60] and Philip [61] models. Philip’s model parameters in a two-term equation have a specific physical meaning, with the first used to describe sorptivity (A), which expresses the rate of infiltration of water in soil without the gravity effect, and the second considered to be an expression of Ksat [L/T] [43,62,63]. Kostiakov’s model parameters (m, n) are derived through regression analysis using experimental data and, as a result, do not have a significant physical meaning; however, they can be readily obtained in comparison with Philip’s model parameters.
Philip’s and Kostiakov’s equations have been proved to be fundamentally equivalent in nature with certain assumptions [43,64]. Consequently, the parameters of the Kostiakov model can be expressed in terms of the parameters of the Philip model, resulting in an equation describing Ksat [L/T]. The cumulative infiltration rates derived from single- and double-ring experiments in the experimental kiwifruit orchard were described both with the Philip and the Kostiakov model, and Ksat [L/T] was calculated based on the aforementioned equation [43] from Kostiakov fitted parameters and Kostiakov parameters derived from Philip parameters with prominent physical meaning.

2.2. Groundwater and Soil Moisture Monitoring in the Field

For the constant monitoring of groundwater levels and soil water content at several depths, a pressure sensor (WIKA LH-20 [65]) was installed inside a well piezometer and two FDR soil moisture sensors were placed at 10 cm and 50 cm below the soil surface in a non-irrigated non-cultivated area of the field. The sensors have been functioning since mid-October 2023 and transmitting real-time data (at 30 min intervals) to a remote cloud platform (http://e-pyrros.gr/field-lab-gr/) through the LoraWan network [66]. The recorded data are transmitted without any telecommunication costs and with minimum energy consumption by the sensor and the network. Meteorological datasets for unsaturated zone flow and groundwater modeling were retrieved by an agro-meteorological station functioning close to the experimental kiwifruit orchard [48].
Precipitation rates within the wet period are significantly high, leading to the rising of the groundwater table in proximity to the soil surface (0.8 m). Irrigation in the experimental kiwifruit orchard starts in March and ends at the end of August. During the irrigation period, the kiwifruit orchard is irrigated with approximately 520 m3/day of water (pumped from groundwater) to meet crop water needs. Soil moisture fluctuations at the first cm below the soil surface (10 cm) indicate that the water is infiltrating rapidly up to that zone, resulting in immediate responses after precipitation events that provide a substantial amount of water in the unsaturated zone. On the other hand, soil moisture at deeper soil layers (50 cm) remains stable, with small variations after precipitation events (Figure 3).

2.3. Unsaturated Zone Flow Modeling

The unsaturated zone flow was modeled by implementing distinct modeling frameworks, the UZF package and the HYDRUS code, which use the kinematic wave equation [28] and the Richards equation [23], respectively. The UZF package is integrated into the MODFLOW family of codes, and, as a result, the modeling process is straightforward, while with the implementation of the HYDRUS code, the flow in the unsaturated zone is individually simulated, and the infiltration rates to the groundwater are embedded in the groundwater model.
The soil hydraulic properties in the UZF package are described by the Brooks–Corey model parameters [67]. Within the text, the soil hydraulic parameters used in UZF are represented with their scientific notation and inside the parentheses with the MODFLOW parameter name. The parameter e (EPS) that influences the unsaturated hydraulic conductivity function is related through Equation (1) with λ, the pore-size distribution index of the soil matrix [67].
ϵ = 2 λ + 3 ,
The pore-size distribution index of the medium is geometrically described as the negative of the slope of the effective saturation (Se) curve as a function of P c γ , where Pc is the capillary pressure and γ is the specific weight of the fluid. In other studies, λ is merely considered a dimensionless parameter related to the shape of the soil water retention curve (SWRC) [68]. The pore-size distribution index (λ) is related to the parameter n of the Van Genuchten parametric model, which describes the width of the pore-size distribution, and therefore both Van Genuchten and Brooks–Corey parameters are relevant to the arrangement of the pore-size distribution [69,70,71]. In general, the Van Genuchten model exhibits greater efficiency in simulating experimental data than the Brooks–Corey model, and soil water retention data are presented in the majority of studies in terms of Van Genuchten parameters [71]. Furthermore, PTFs use soil textural information to infer the soil hydraulic properties, employing Van Genuchten model parameters to describe soil hydraulic properties [72]. The association of the Van Genuchten n parameter and the Brooks–Corey λ parameter is achieved through Equation (2):
λ = m 1 m 1 0.5 1 m ,
where m = 1 1 n .
The values of λ are generally small for soil matrices with a wide pore size range and large for soil matrices with uniform pore sizes [67]. If the soil pores are characterized as uniform, the drainage of the soil medium will sharply occur, compared to soils with wide pore-size distribution which exhibit a smooth drainage pattern [69]. Typical values of λ can vary from 5 for uniform sand to approximately 0.1 for highly heterogeneous silty-clay soils [69,71,73]. The experimental estimation of Brooks–Corey soil water parameters based on a database of 1323 soils, from 5350 soil horizons originated from 32 USA states, led to the generation of an explicit directory for each USDA soil texture class [74,75].
In this study, the values of λ, θs (THTS), and θr (THTR) were retrieved from the explicit directory of Brooks–Corey soil water parameters [74,75] and from the conversion of the Van Genucthen n parameter based on Equation (2), derived from [18], estimated by the soil texture analysis of the experimental kiwifruit orchard. Ksat [L/T] (VKS) was assigned to the distribution of Ksat [L/T] calculated from the infiltration experiments in the field. The extinction depth (EXTDP), which describes the boundary of the evapotranspiration process and is delimited by the kiwifruit root growth, was assigned equal to the development depth of kiwifruit tree roots for the specific soil type and groundwater table level.
The simulation process of the unsaturated zone flow with the HYDRUS code encompassed the development of two-layer models, considering the soil texture analysis in two soil horizons, based on the distribution of Ksat [L/T] across the experimental kiwifruit orchard. The soil hydraulic properties of each layer were inferred from [18], providing the soil texture data (Section 2.1). As upper boundary conditions of the model were assigned variable atmospheric boundary conditions determined by the combination of precipitation and crop evapotranspiration. The model’s bottom boundary conditions were chosen to be described by free drainage. The root growth and root water uptake parameters were selected according to the root growth and root water uptake pattern of kiwifruit trees.

2.4. Groundwater Flow Modeling

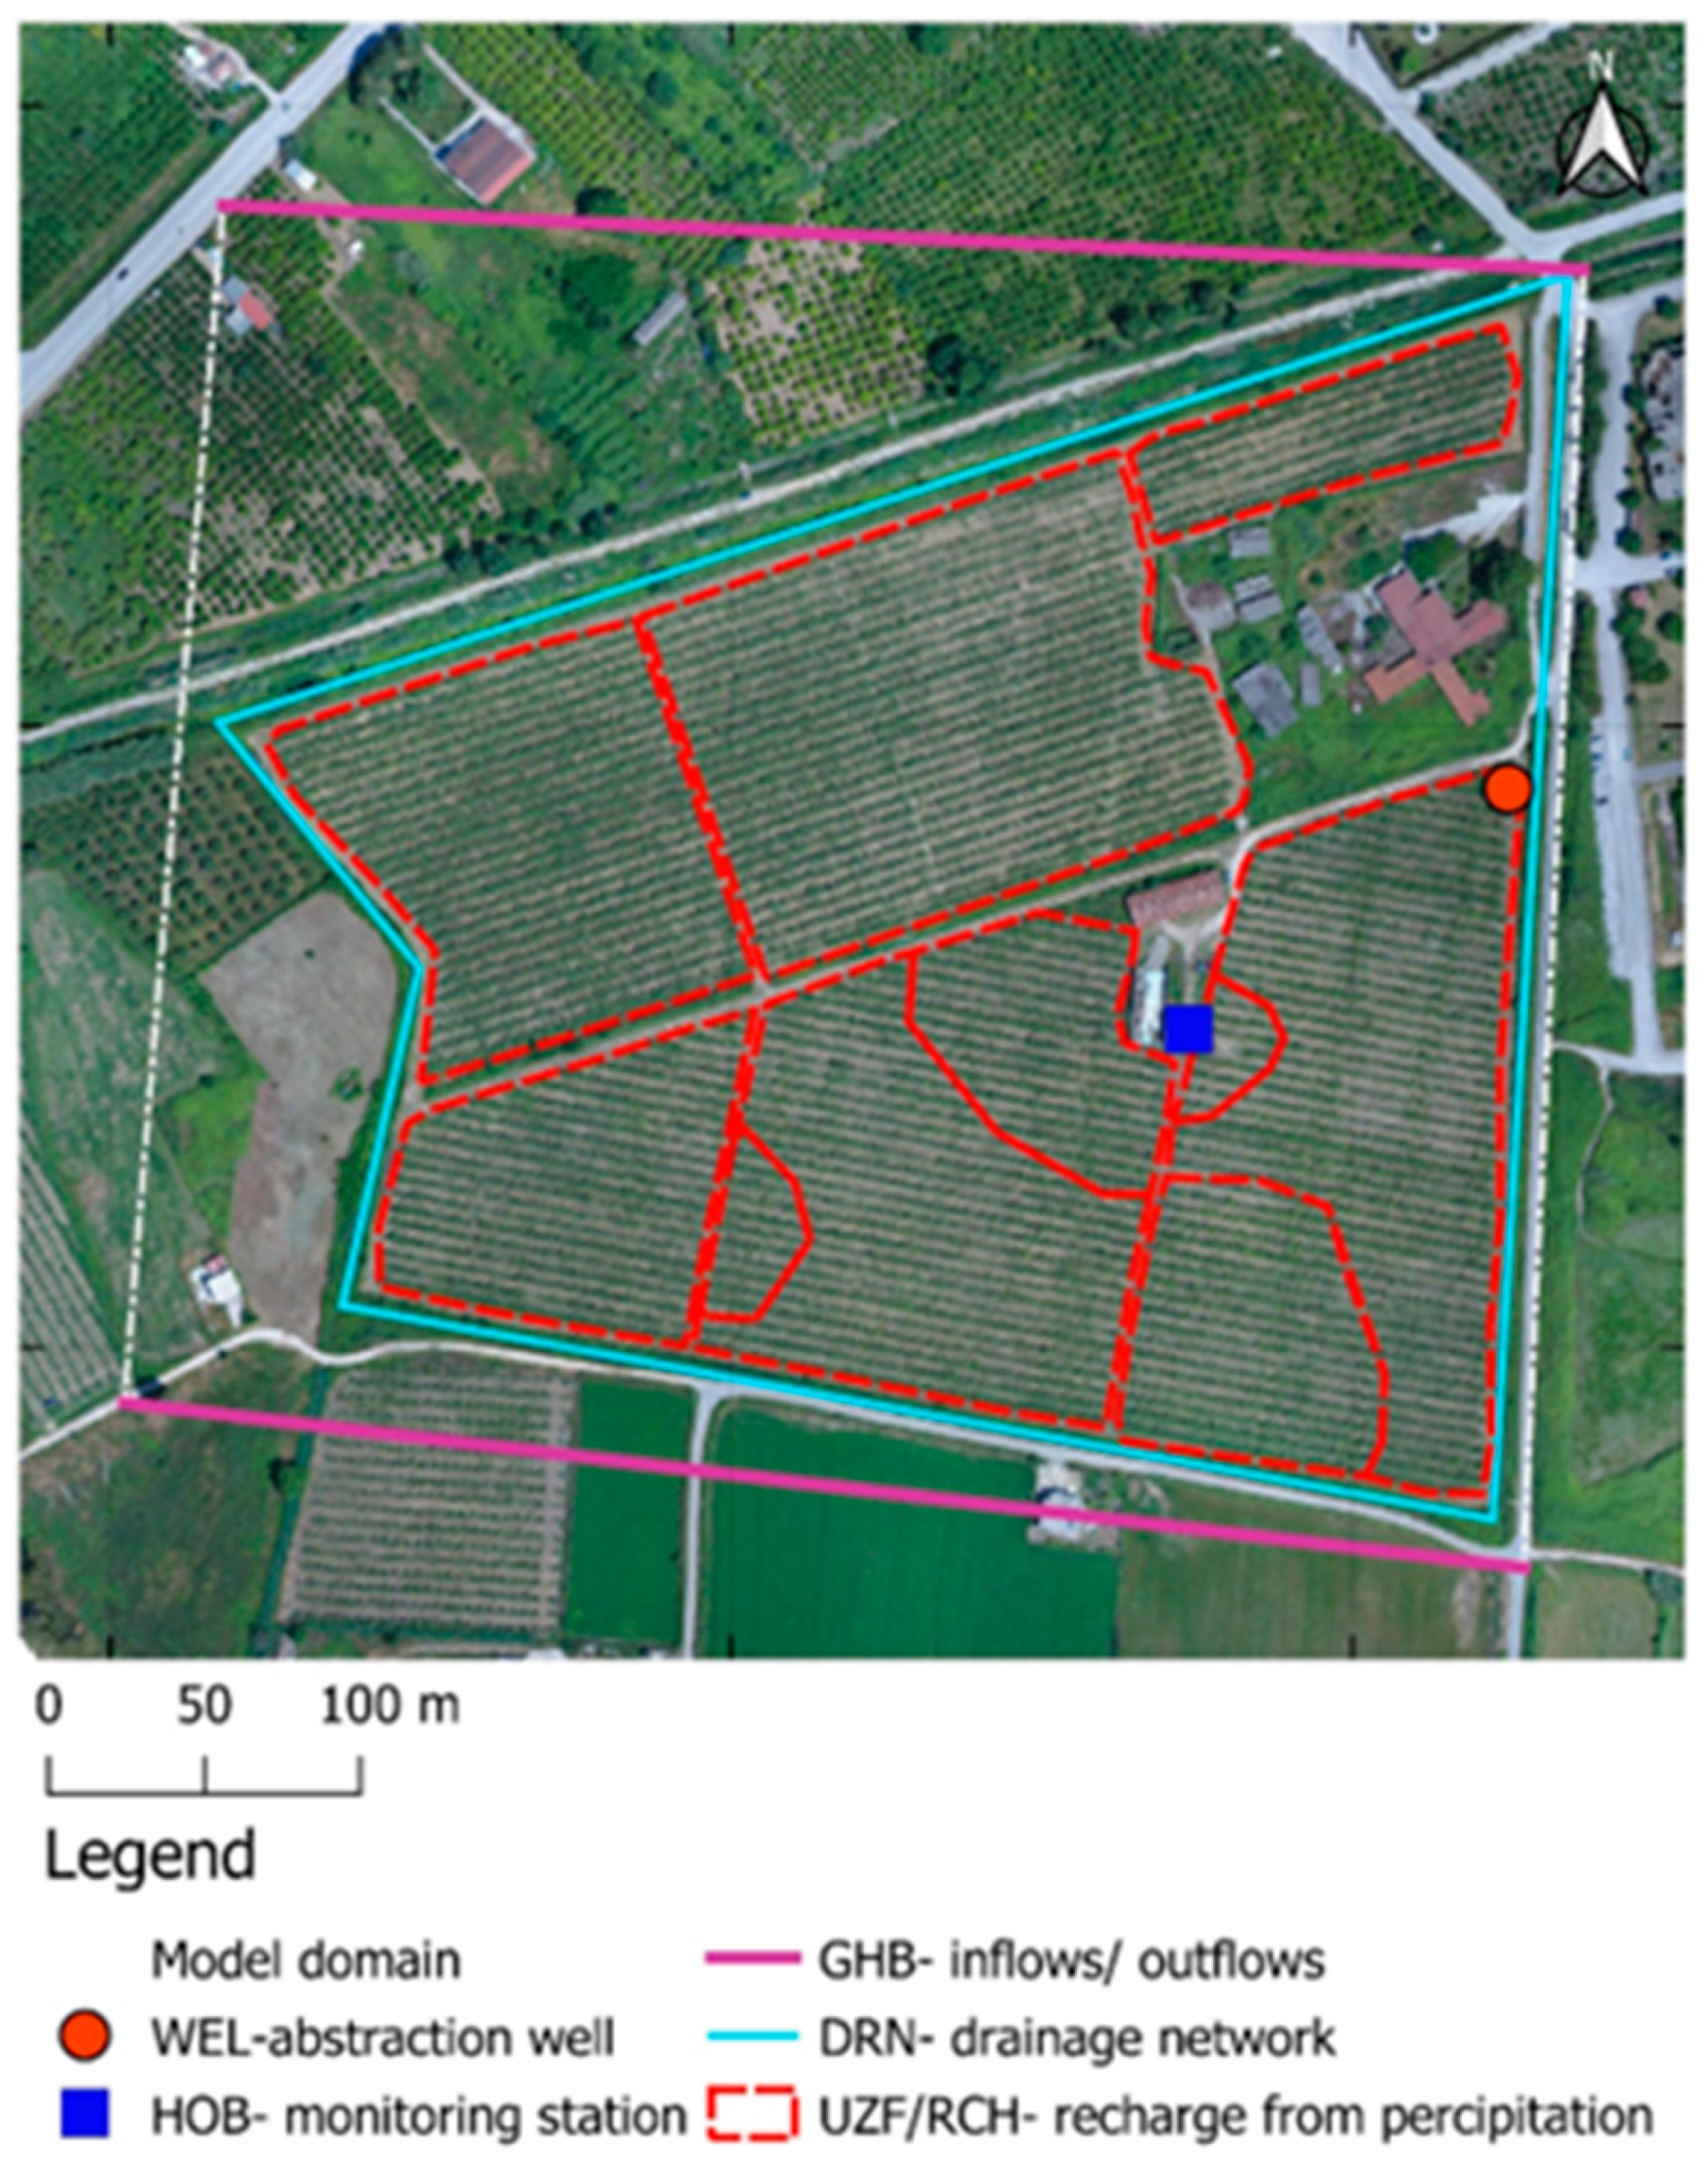
Groundwater flow modeling was implemented with the three-dimensional finite difference MODFLOW-2005 code [76] and the ModelMuse free platform of USGS [77]. The conceptual model of the groundwater system was decided according to field research and past studies conducted in the wider area of interest [78,79]. The hydrologic conditions of the aquifer in the research area, along with several constructions related to land reclamation, defined the conceptual model for the aquifer underneath the research field. For simulation purposes, a two-layered model was built. Aquifer hydraulic parameters were retrieved from an existing regional model of the wider area of interest [80] (Table 1). The next stage involved a modification of hydraulic parameters with the model calibration process concerning all the stress periods by applying the trial and error method. Although the aquifer of the alluvial plain is partially and seasonally confined, in this part of the plain, groundwater flow is under unconfined conditions throughout the year. The model domain covers an area of 1.8 km2 representing the study field along with part of the extended drainage network. Groundwater formation consists of a two-layer aquifer with a thickness of 22 m and 24 m for the top and bottom layer, respectively, while the model top arose from the Digital Elevation Model (DEM) with a 5 m × 5 m resolution. A fine grid of 2 m × 2 m with 226 columns and 209 rows was selected for the simulation while the temporal discretization was on a daily timestep. Groundwater flow was simulated for one hydrologic year (10 October 2023 to 17 September 2024), following the groundwater measurements obtained from the monitoring station (pressure sensor). The boundary conditions and sink and source terms of the study field were interpreted through different packages of MODFLOW-2005:
  • Newman boundary conditions.
  • Abstraction well (WEL: Well package): a mean pumping rate of 520 m3/day (every three days) was selected during the irrigation period, according to the irrigation practice that is followed for the specific kiwi field.
  • Percolation of precipitation (RCH: Recharge package): the specific package was utilized for groundwater recharge from precipitation and irrigation fluxes that was calculated as an output of the HYDRUS model. For the case where the Unsaturated Zone Flow (UZF) package was utilized, the RCH package remained inactive.
  • Cauchy boundary conditions.
  • Lateral inflows/outflows from/to the aquifer (GHB: General Head Boundary): GHB was used to interpret the inflows and outflows from and to the surrounding aquifer of the study area. GHB was placed at the northern and southern part of the study field, following the groundwater flow pattern.
  • Drainage network (DRN: Drain package): the elevation of the drainage network was defined through measurements during field research.
The UZF package was selected for the simulation of the unsaturated zone flow and the implementation of recharge from precipitation, irrigation fluxes, and outflows from evapotranspiration. For the specific package, two different approaches were followed regarding the soil parameters. In the first approach, THTS and THTR parameters were retrieved from the explicit directory of Brooks–Corey soil water parameters [69,70] and from the conversion of the Van Genucthen equation n parameter, as described in Section 2.3. The infiltration rates produced by HYDRUS were incorporated to the MODFLOW groundwater model through the RCH package. Considering the above, three different models were generated for the simulation of unsaturated zone and groundwater flow, named “MODFLOW-HYDRUS”, “MODFLOW-UZF”, and “MODFLOW-TOTH”. Also, field and laboratory measurements regarding the unsaturated vertical hydraulic conductivity were incorporated as model parameters, and no further calibration was performed. The visual flowchart of the integration of soil analysis data into the modeling process is presented in Figure 4. Finally, the Head Observation package (HOB) was used to monitor the performance of the model with respect to the monitoring data of the pressure transducer. The evaluation between the simulated hydraulic head under each modeling framework with observations was conducted with Pearson’s correlation coefficient (r), the coefficient of determination (R2), and root mean square error (RMSE) [81].
The hydrologic compounds and boundary conditions mentioned above are presented in the map of Figure 5.

3. Results–Discussion

3.1. Particle Soil Distribution Analysis

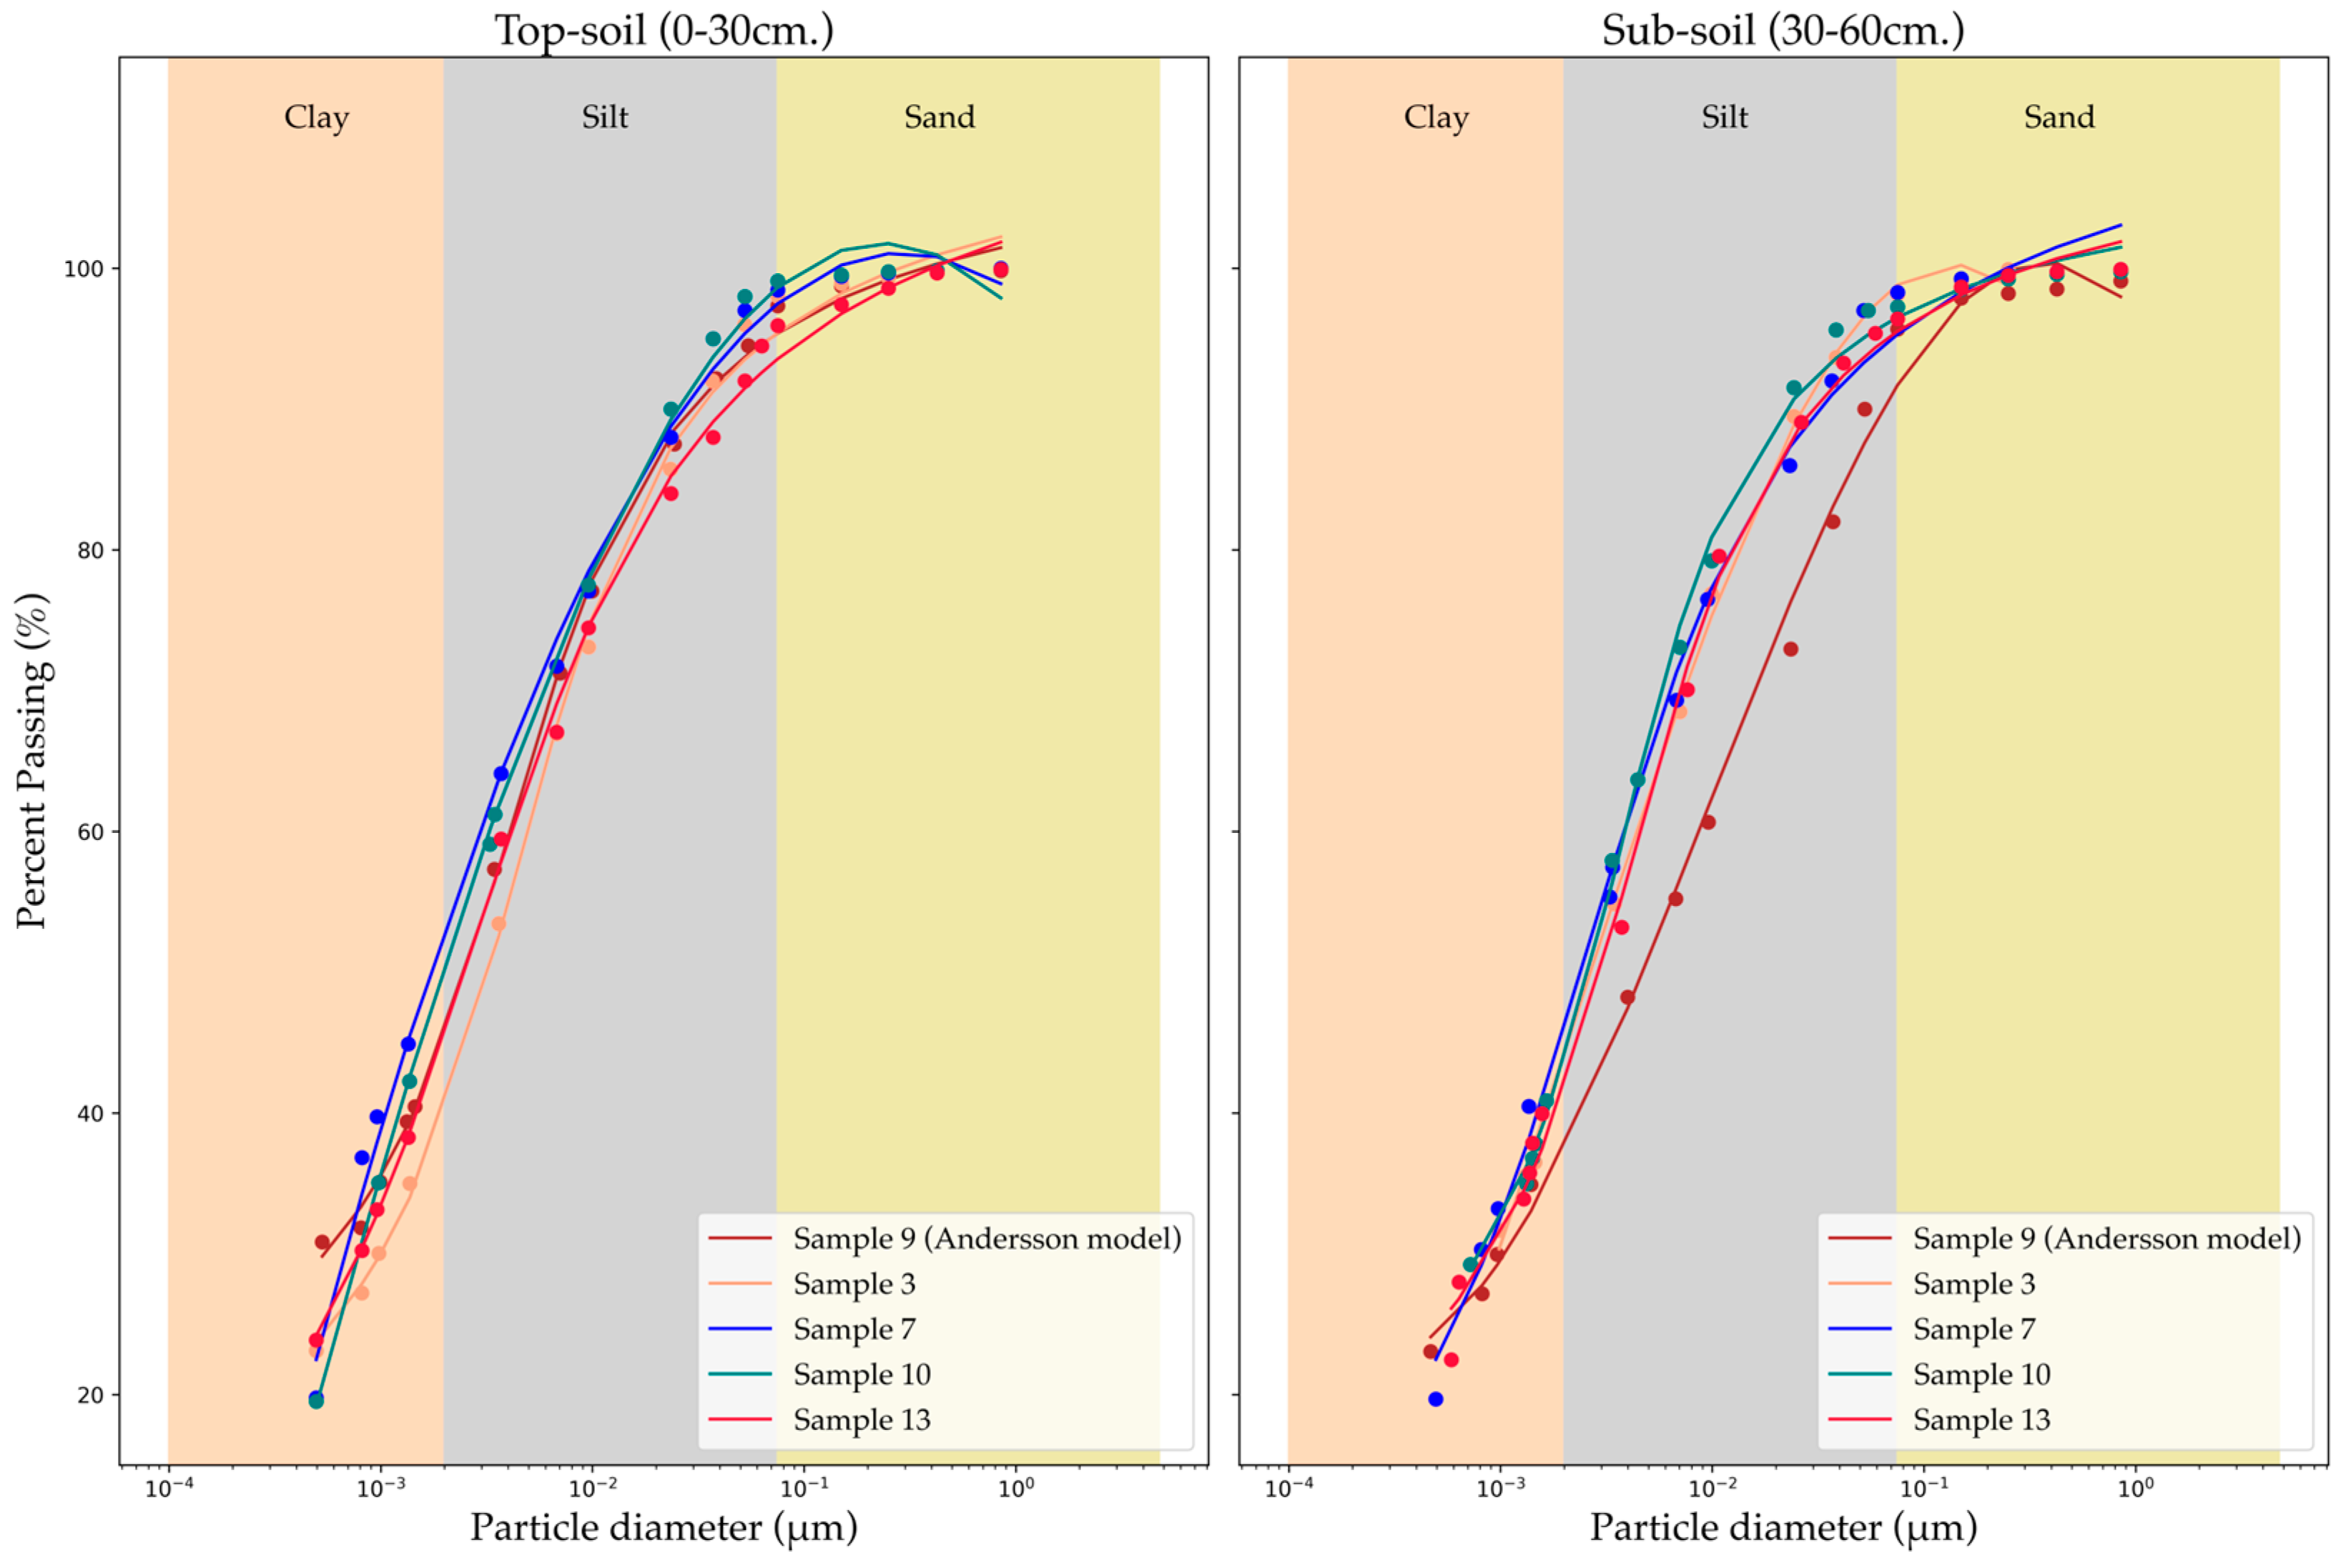
The distribution of soil texture within the experimental kiwifruit orchard can be characterized homogeneous as emerges from the particle size distribution curves both for top-soil (0–30 cm) and for sub-soil samples (Figure 6). Most of the particles between the soil samples lie in the silt part of the graph, with a small percentage of sand and a substantial clay content in each of them. The particle size experimental data are adequately fitted by the Andersson model, which provides the capability to classify them according to the USDA soil texture classification system.
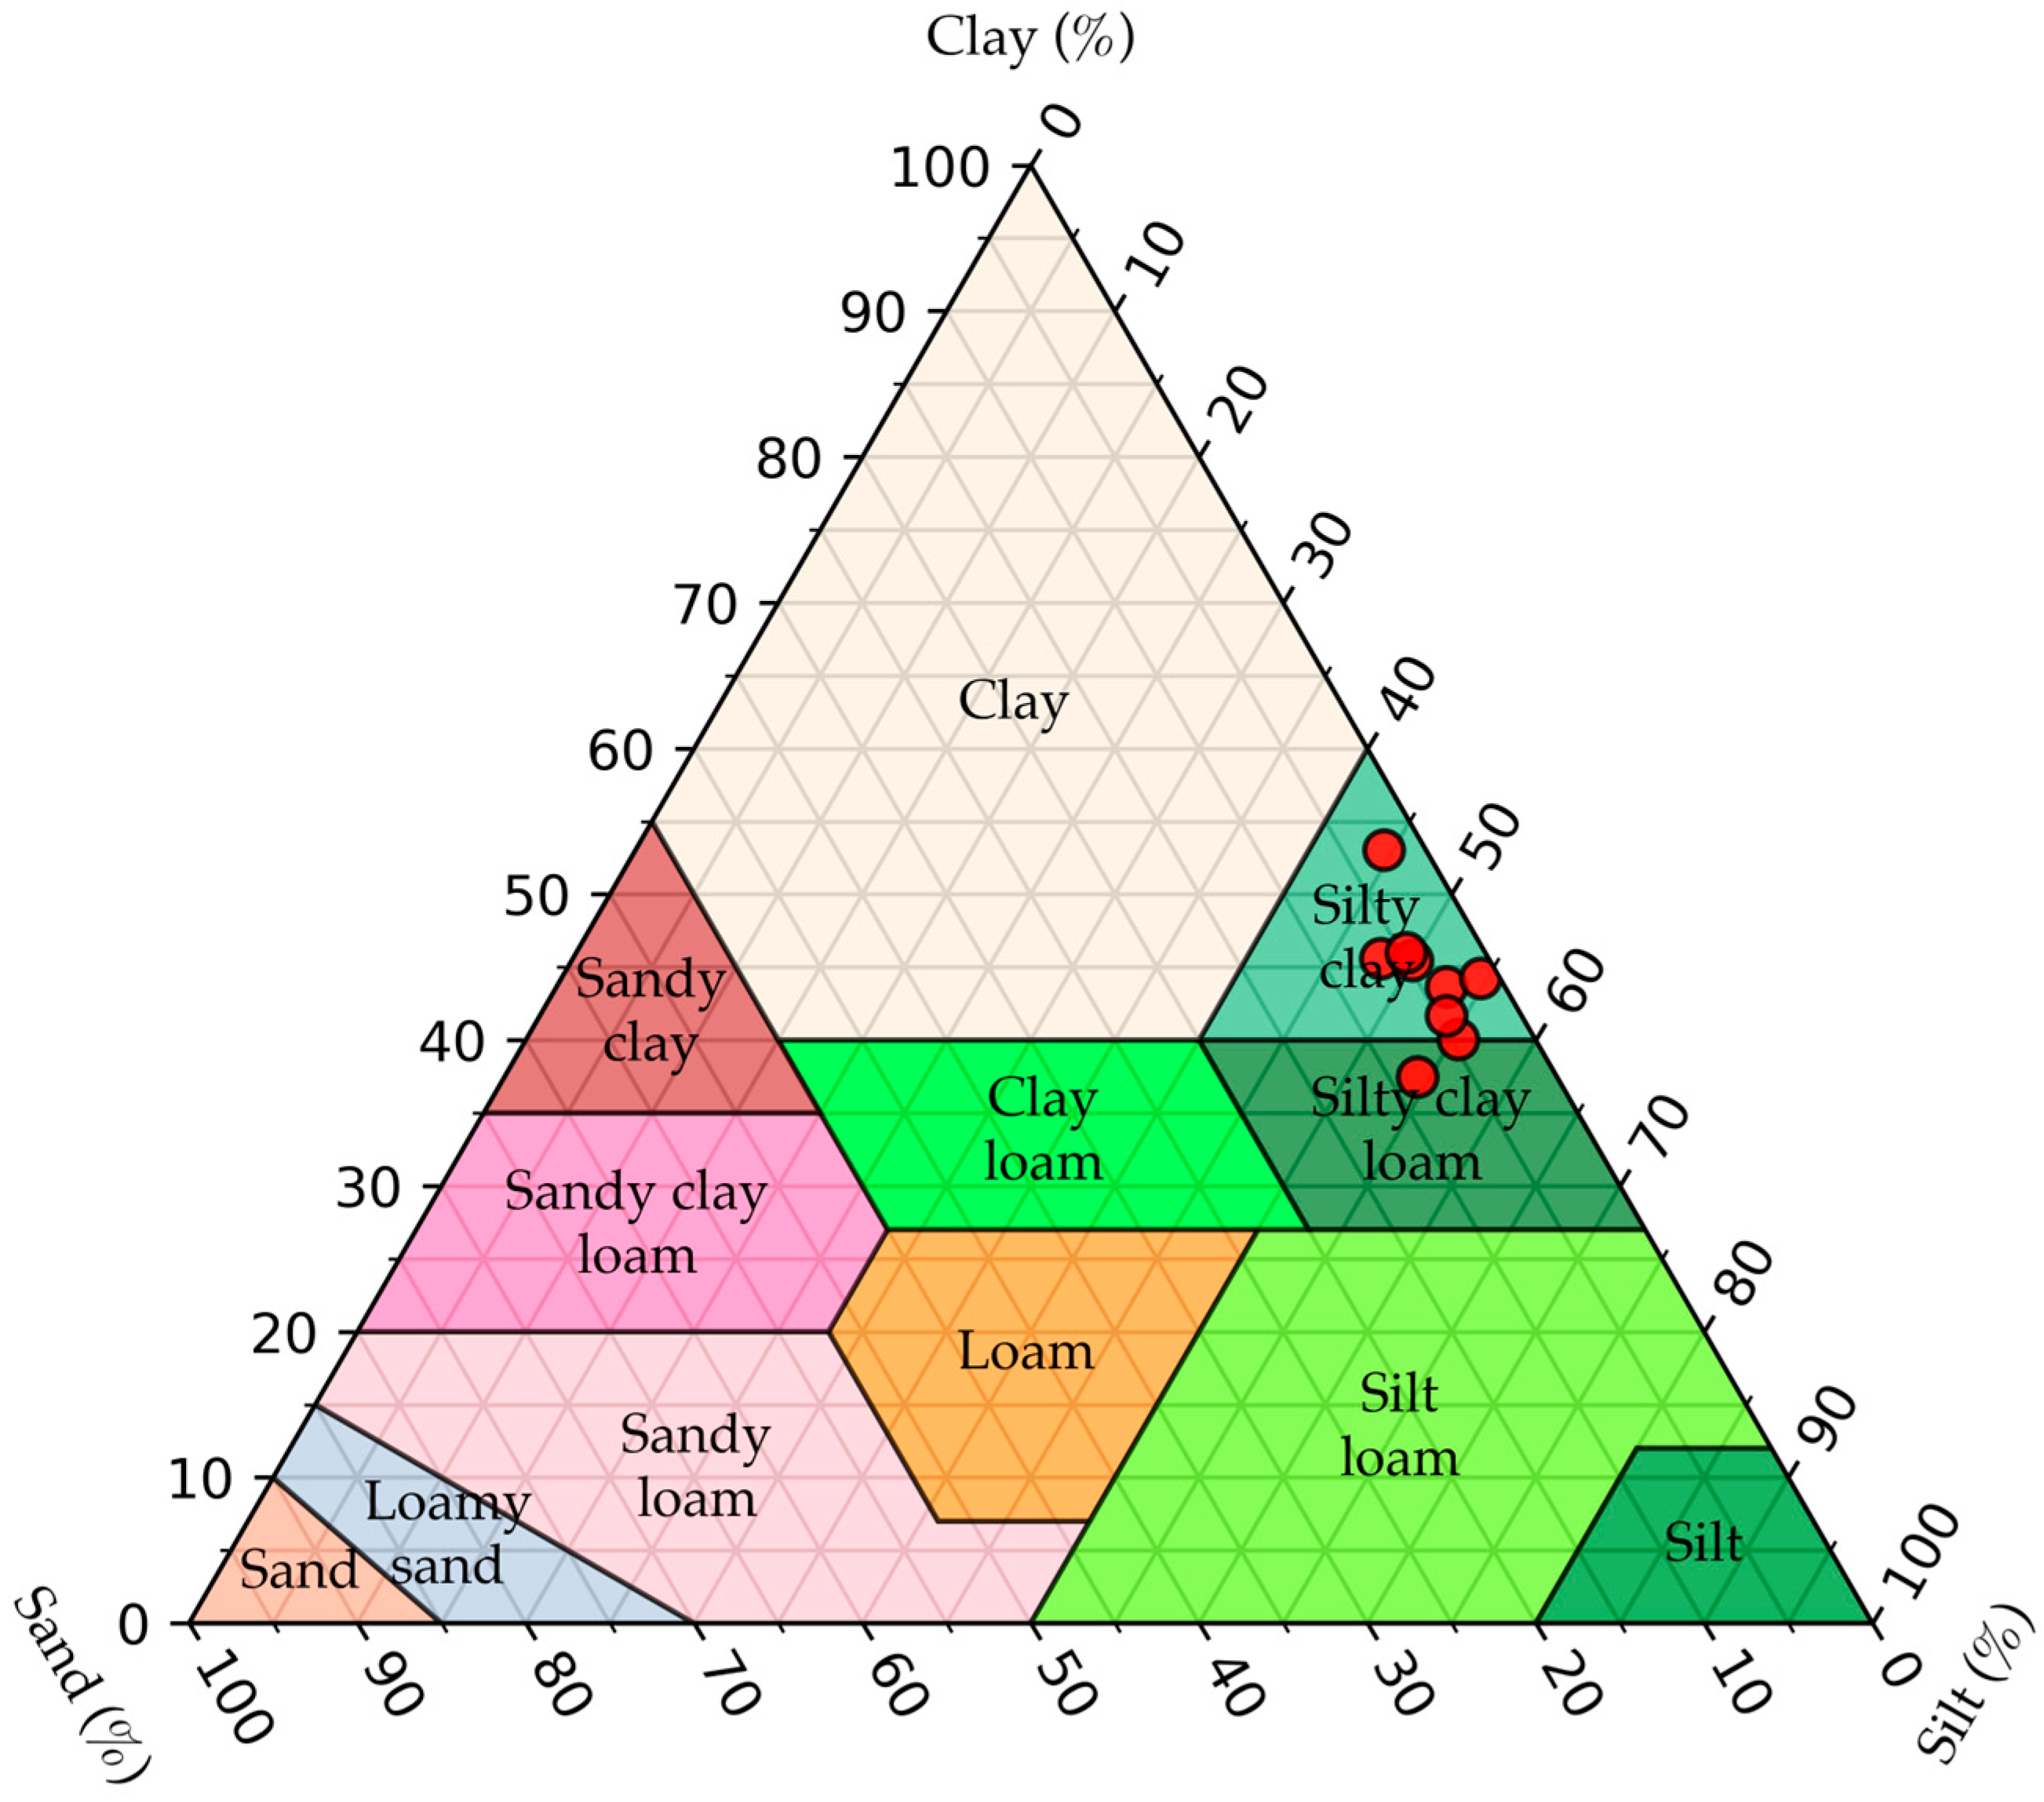
The majority of the samples collected from the experimental kiwifruit orchard from both top-soil and sub-soil horizon are classified as silty-clay soils (Figure 7). Only sub-soil sample 9 is characterized as silty-clay-loam, indicating that soil texture distribution within the field does not vary significantly. The soil texture classification of the experimental field as silty clay indicates that fine-textured soils are predominant within the field, affecting several hydrological processes, such as infiltration, drainage, and root water uptake. However, in agricultural soils with a substantial percentage of clay content, several structural pores are formed from environmental conditions, soil mineral composition, root distribution, biological activity in soil, and hydrological and climatic conditions [82,83]. For those reasons, apart from soil texture analysis, experiments which consider the effect of soil structure in the soil hydrological process should be conducted in the unsaturated zone for its efficient hydrologic description.

3.2. Field Infiltration Rates Modeling—Ksat Estimation

Double-ring and single-ring infiltration experiments conducted within the area of the experimental kiwifruit orchard could potentially reveal soil structural phenomena in respect to which Ksat [L/T] is changing. The infiltration rates from both double-ring and single-ring experiments were modeled from the two-term Philip equation and Kostiakov equation, revealing that the experimental data are adequately described from both models (Figure 8 and Figure 9). The infiltration rates were spatially varying in the experimental kiwifruit orchard, indicating that, although soil texture distribution is considered homogeneous, several aforementioned parameters influence the pore size and distribution within the soil matrix.
Ksat [L/T] was calculated through a recently proposed equation [43], in which Ksat [L/T] is correlated with Kostiakov’s parameters derived either from the parameters of Philip’s two-term equation with physical meaning [64] or from the regression of experimental data with the Kostiakov model. The values of the Kostiakov parameters based on each distinct calculation method do not significantly differ in double- and single-ring experiments (Table 2 and Table 3). The values of Kostiakov’s parameters derived through Philip’s parameters with physical meaning tend to be slightly lower than the parameters derived from the regression of the Kostiakov model in the cumulative infiltration data (Figure 8 and Figure 9). According to this observation, Ksat [m/day] estimation is overestimated using the Kostiakov regression parameters, in comparison with the Kostiakov parameters calculated from Philip’s two-term equation, suggesting that Ksat [m/day] calculation based on parameters with physical meaning corresponds to the literature boundaries of Ksat for fine-textured soils.
The results of Ksat [m/day] estimation in double- and single-ring experiments indicated that Ksat derived from double-ring experiments tends to be slightly higher than that estimated from single-ring experiments. The outcomes of this investigation are consistent with those of previous studies [41], stating that the modification of single-ring infiltration rates taking into consideration the lateral spread of infiltration around the ring could produce more representative results for each investigated soil. Double-ring infiltration experiments are employed to mitigate the effects of lateral flow in infiltration experiments; however, it has been noted that the double-ring infiltrometer can be significantly affected by flow divergence and lateral gradients [38].
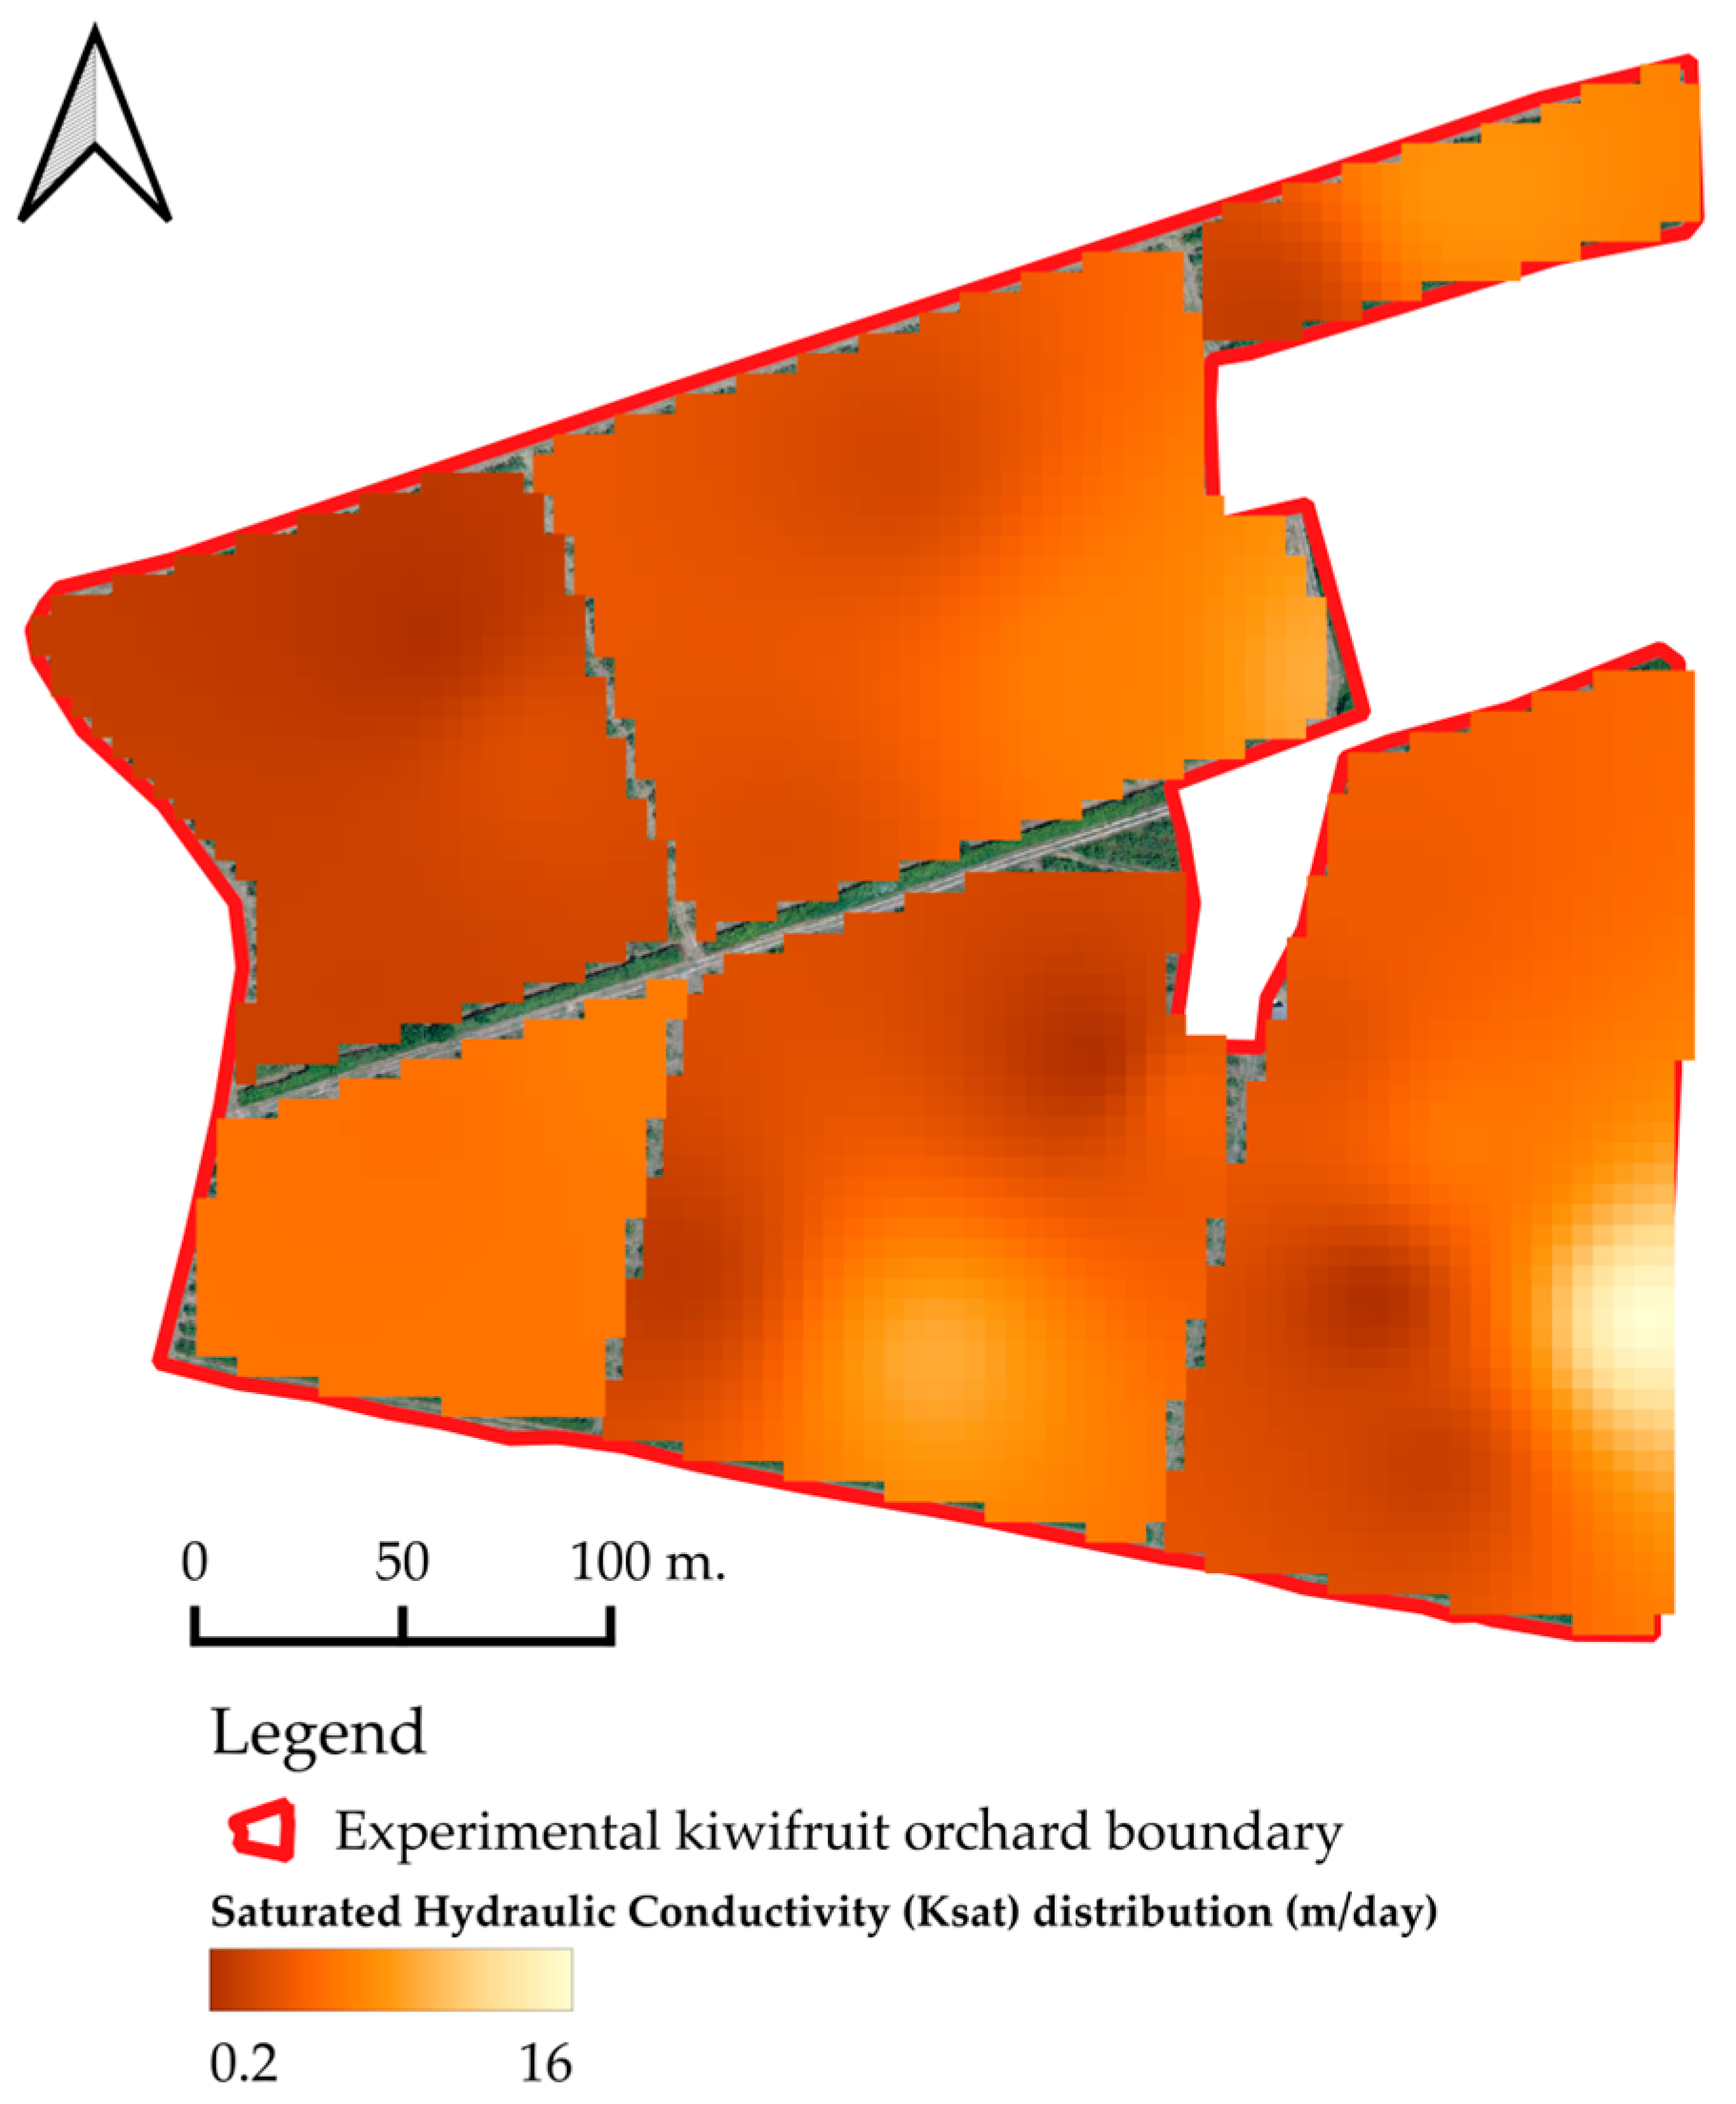
The outcomes of Ksat [m/day] estimation based on the modified Philip–Kostiakov equation, using Kostiakovs’ parameters derived from Philip’s two-term equation parameters, were interpolated to define the spatial distribution (0.2–16 m/day) in the experimental kiwifruit orchard. The spatial distribution of Ksat [m/day] in the field reveals distinct infiltration zones based on which zones were developed to simulate unsaturated zone flow (Figure 10).

3.3. Coupled Unsaturated Zone Flow and Groundwater Flow Modeling

The outcomes of soil experiments (soil texture analysis and infiltration experiments) were used to infer the hydraulic parameters of unsaturated zone flow models (UZF package and HYDRUS code) and the atmospheric boundary conditions were retrieved from the meteorological data. Each unsaturated zone simulation framework produced distinct infiltration fluxes for the modeling period, which were integrated in MODFLOW-2005 groundwater model to evaluate the evolution groundwater pressure head under each modeling method.
By comparing the simulated hydraulic head emerging from groundwater modeling to the observed values, the conclusion arises that the simulated hydraulic head under each unsaturated zone flow modeling framework is adequately correlated with the observed data of the monitoring well in the experimental kiwifruit orchards. Groundwater level fluctuations over the wet period, influenced by the precipitation events, and over the dry period, influenced by pumping, were simulated to an acceptable degree (Figure 11). According to the statistics that are presented in Table 4, the results suggested an acceptable agreement between measured and simulated hydraulic heads. More specifically, r suggests a linearity between observed and simulated values (r = 0.8 − 0.0803), considering a perfect linearity equal to 1. An R2 ranging from 0.64 to 0.645 is also considered acceptable (greater than 0.5 according to [84]) while small values of RMSE (0.186–0.187 m) indicate a good fit of the simulated to the observed values.
Although the statistical evaluation of the three models suggested similar performance, groundwater level fluctuation and volumetric budget at the end of each simulation indicated several differences between the three methods. Groundwater level fluctuation showed no significant differences between the two UZF approaches, while the HYDRUS model shows higher hydraulic values throughout the simulation. This outcome can also be derived by comparing the cumulative volumetric budget of each simulation presented in the following table (Table 5).
Taking into consideration the groundwater inflow–outflow budget at the end of the simulation period, a significant discrepancy between each unsaturated zone modeling framework in recharge inflows in the aquifer can be noticed. The groundwater simulation within the area of the experimental kiwifruit orchard using HYDRUS generated greater infiltration fluxes in the aquifer than the groundwater simulation with either of the UZF frameworks. This outcome can be attributed to the root water uptake modeling function of HYDRUS, which takes into consideration the crop root growth development stage and retrieves water according to the specific crop pattern and the soil water potential status. On the contrary, UZF implements evapotranspiration rates within a specified depth (EXTDP) in accordance with root growth development, resulting in overestimating evapotranspiration rates in the root zone. Furthermore, the gravity-driven unsaturated zone flow established by UZF cannot capture the flow from capillary phenomena which regulate upward and downward flow in the unsaturated zone, especially in aquifers with shallow groundwater tables [29].
Although both models’ performance was adequate and produced similar results, the HYDRUS model produced slightly better statistics and could provide a more reliable groundwater model for water level prediction, especially in an era when precision agriculture seems to be the future of agricultural water management.
To the best of our knowledge, this is one of the very few studies on conjunctive unsaturated zone and groundwater flow modeling with both the HYDRUS code and the UZF package, and this is the first research that incorporated field and laboratory measurements of the unsaturated zone in groundwater modeling. Our model results are in accordance with the research of [85], who also supported that the HYDRUS code produced slightly better results that the MODFLOW UZF package in terms of groundwater hydraulic heads.

4. Conclusions

In conclusion, this study has demonstrated the quantification of groundwater recharge under distinct unsaturated zone modeling frameworks in agricultural fields, with special reference to an experimental kiwifruit orchard. A thorough soil investigation was conducted in the field to identify the distribution of soil texture and infiltration within the area of the field. While soil texture can be homogeneous across soil horizons in agricultural fields, infiltration rates vary within the field since they are influenced by soil structure. In this study, double- and single-ring infiltration experiments were employed to quantify infiltration rates and estimate Ksat through a modeling process. The results of our research are in agreement with previous studies and showcase that modified single-ring infiltration rates, taking into consideration the divergence of flow, yield more reasonable values than double-ring infiltration rates for fine-textured soils. As for double-ring infiltrometers, there is no robust method for the elimination of lateral flow during the experiment; modified single-ring infiltration rates, removing the error of divergence of the measured infiltration, can yield representative infiltration rates without time-consuming and water-demanding experiments.
Both HYDRUS and UZF modeling frameworks produce satisfactory results when comparing observed and simulated hydraulic heads, and can serve as valuable tools for computing infiltration fluxes to the water table. The major difference between the two models lies in the implementation of root uptake and the capillary effect modeling of the HYDRUS code, phenomena that are neglected during UZF simulations, resulting in under-estimating groundwater recharge by UZF. More specifically, the HYDRUS code calculated a volume of groundwater recharge approximately 40% higher than the volume calculated with the UZF package. The gravity-driven modeling of unsaturated zone flow cannot capture every single hydrological process in shallow groundwater tables, where capillary flow is dominant.
The proposed framework points toward the efficient integration of field experimental data in subsurface modeling, choosing the most compatible experimental method and modeling framework for specific soil classification types. Furthermore, new insights are presented for the quantification of groundwater recharge in agricultural areas, using groundwater hydraulic head as an evaluation parameter through groundwater flow modeling, which is the only scientifically acclaimed way to determine groundwater fluctuations. While comprehensive evaluations of the coupling process between unsaturated zone flow models and groundwater flow models have been conducted in previous studies, this research paper contributes to the advanced understanding of the effects of governing flow equation solutions of UZF and HYDRUS in groundwater recharge.
The evaluation of distinct modeling frameworks within an agricultural field characterized by specific soil, hydrological, and hydrogeological properties facilitates the efficient selection of subsurface modeling schemes in future research. By understanding each framework, researchers can make more informed decisions on which approaches are most suitable for capturing subsurface dynamics in an agricultural field and optimizing water resource management.

Author Contributions

Conceptualization, E.C., M.P. and A.K.; methodology, E.C., M.P. and A.K.; software, E.C. and M.P.; validation, M.P. and A.K.; formal analysis, E.C. and M.P.; investigation, E.C. and K.M.; resources, E.C., M.P. and K.M.; data curation, E.C. and M.P.; writing—original draft preparation, E.C. and M.P.; writing—review and editing, E.C., M.P. and A.K.; visualization, E.C. and M.P.; supervision, A.K.; project administration, A.K.; funding acquisition, A.K. All authors have read and agreed to the published version of the manuscript.

Funding

This research received financial funding from the Operational Programme “Competitiveness, Entrepreneurship and Innovation 2014–2020 (EPAnEK)” (MIS 5047059).

Data Availability Statement

The datasets generated during and/or analyzed during the current study are available from the corresponding author on reasonable request. Meteorological data, groundwater monitoring data, and soil moisture monitoring data can be accessed through (https://openhi.net/en/) and (http://e-pyrros.gr/field-lab-gr/).

Acknowledgments

This research is part of the Project “e-Pyrros: Development of an integrated monitoring network for hydro-environmental parameters within the hydro-systems of Louros-Arachthos-Amvrakikos for the optimal management and improvement of agricultural production” (MIS 5047059) and received financial funding from the Operational Program “Competitiveness, Entrepreneurship and Innovation 2014–2020 (EPAnEK)”.

Conflicts of Interest

The authors declare no conflicts of interest.

References

  1. Wada, Y.; van Beek, L.P.H.; Bierkens, M.F.P. Nonsustainable Groundwater Sustaining Irrigation: A Global Assessment. Water Resour. Res. 2012, 48, W00L06. [Google Scholar] [CrossRef]
  2. Vörösmarty, C.J.; Douglas, E.M.; Green, P.A.; Revenga, C. Geospatial Indicators of Emerging Water Stress: An Application to Africa. AMBIO 2005, 34, 230–236. [Google Scholar] [CrossRef] [PubMed]
  3. Wang-Erlandsson, L.; Tobian, A.; van der Ent, R.J.; Fetzer, I.; te Wierik, S.; Porkka, M.; Staal, A.; Jaramillo, F.; Dahlmann, H.; Singh, C.; et al. A Planetary Boundary for Green Water. Nat. Rev. Earth Environ. 2022, 3, 380–392. [Google Scholar] [CrossRef]
  4. Vereecken, H.; Amelung, W.; Bauke, S.L.; Bogena, H.; Brüggemann, N.; Montzka, C.; Vanderborght, J.; Bechtold, M.; Blöschl, G.; Carminati, A.; et al. Soil Hydrology in the Earth System. Nat. Rev. Earth Environ. 2022, 3, 573–587. [Google Scholar] [CrossRef]
  5. Maréchal, J.C.; Dewandel, B.; Ahmed, S.; Galeazzi, L.; Zaidi, F.K. Combined Estimation of Specific Yield and Natural Recharge in a Semi-Arid Groundwater Basin with Irrigated Agriculture. J. Hydrol. 2006, 329, 281–293. [Google Scholar] [CrossRef]
  6. Scanlon, B.R.; Reedy, R.C.; Stonestrom, D.A.; Prudic, D.E.; Dennehy, K.F. Impact of Land Use and Land Cover Change on Groundwater Recharge and Quality in the Southwestern US. Glob. Chang. Biol. 2005, 11, 1577–1593. [Google Scholar] [CrossRef]
  7. Kendy, E.; Zhang, Y.; Liu, C.; Wang, J.; Steenhuis, T. Groundwater Recharge from Irrigated Cropland in the North China Plain: Case Study of Luancheng County, Hebei Province, 1949–2000. Hydrol. Process. 2004, 18, 2289–2302. [Google Scholar] [CrossRef]
  8. Meredith, E.; Blais, N. Quantifying Irrigation Recharge Sources Using Groundwater Modeling. Agric. Water Manag. 2019, 214, 9–16. [Google Scholar] [CrossRef]
  9. Nastev, M.; Rivera, A.; Lefebvre, R.; Martel, R.; Savard, M. Numerical Simulation of Groundwater Flow in Regional Rock Aquifers, Southwestern Quebec, Canada. Hydrogeol. J. 2005, 13, 835–848. [Google Scholar] [CrossRef]
  10. Krogulec, E. Evaluation of Infiltration Rates within the Vistula River Valley, Central Poland. Acta Geol. Pol. 2010, 60, 617–628. [Google Scholar]
  11. Gumuła-Kawęcka, A.; Jaworska-Szulc, B.; Szymkiewicz, A.; Gorczewska-Langner, W.; Pruszkowska-Caceres, M.; Angulo-Jaramillo, R.; Šimůnek, J. Estimation of Groundwater Recharge in a Shallow Sandy Aquifer Using Unsaturated Zone Modeling and Water Table Fluctuation Method. J. Hydrol. 2022, 605, 127283. [Google Scholar] [CrossRef]
  12. Pawlowicz, M.; Balis, B.; Szymkiewicz, A.; Šimůnek, J.; Gumuła-Kawęcka, A.; Jaworska-Szulc, B. HMSE: A Tool for Coupling MODFLOW and HYDRUS-1D Computer Programs. SoftwareX 2024, 26, 101680. [Google Scholar] [CrossRef]
  13. Mirlas, V.; Kulagin, V.; Ismagulova, A.; Anker, Y. MODFLOW and HYDRUS Modeling of Groundwater Supply Prospect Assessment for Distant Pastures in the Aksu River Middle Reaches. Sustainability 2022, 14, 16783. [Google Scholar] [CrossRef]
  14. Xiao, X.; Xu, X.; Ren, D.; Huang, Q.; Huang, G. Modeling the Behavior of Shallow Groundwater System in Sustaining Arid Agroecosystems with Fragmented Land Use. Agric. Water Manag. 2021, 249, 106811. [Google Scholar] [CrossRef]
  15. Carranza, C.; Nolet, C.; Pezij, M.; van der Ploeg, M. Root Zone Soil Moisture Estimation with Random Forest. J. Hydrol. 2021, 593, 125840. [Google Scholar] [CrossRef]
  16. Feddes, R.A.; Kabat, P.; Van Bakel, P.J.T.; Bronswijk, J.J.B.; Halbertsma, J. Modelling Soil Water Dynamics in the Unsaturated Zone—State of the Art. J. Hydrol. 1988, 100, 69–111. [Google Scholar] [CrossRef]
  17. Schaap, M.G.; Leij, F.J.; van Genuchten, M.T. Rosetta: A Computer Program for Estimating Soil Hydraulic Parameters with Hierarchical Pedotransfer Functions. J. Hydrol. 2001, 251, 163–176. [Google Scholar] [CrossRef]
  18. Tóth, B.; Weynants, M.; Nemes, A.; Makó, A.; Bilas, G.; Tóth, G. New Generation of Hydraulic Pedotransfer Functions for Europe. Eur. J. Soil Sci. 2015, 66, 226–238. [Google Scholar] [CrossRef]
  19. Van Looy, K.; Bouma, J.; Herbst, M.; Koestel, J.; Minasny, B.; Mishra, U.; Montzka, C.; Nemes, A.; Pachepsky, Y.A.; Padarian, J.; et al. Pedotransfer Functions in Earth System Science: Challenges and Perspectives. Rev. Geophys. 2017, 55, 1199–1256. [Google Scholar] [CrossRef]
  20. Zhang, Y.; Schaap, M.G. Weighted Recalibration of the Rosetta Pedotransfer Model with Improved Estimates of Hydraulic Parameter Distributions and Summary Statistics (Rosetta3). J. Hydrol. 2017, 547, 39–53. [Google Scholar] [CrossRef]
  21. Ritter, A.; Hupet, F.; Muñoz-Carpena, R.; Lambot, S.; Vanclooster, M. Using Inverse Methods for Estimating Soil Hydraulic Properties from Field Data as an Alternative to Direct Methods. Agric. Water Manag. 2003, 59, 77–96. [Google Scholar] [CrossRef]
  22. Farthing, M.W.; Ogden, F.L. Numerical Solution of Richards’ Equation: A Review of Advances and Challenges. Soil Sci. Soc. Am. J. 2017, 81, 1257–1269. [Google Scholar] [CrossRef]
  23. Richards, L.A. Capillary Conduction of Liquids through Porous Mediums. Physics 1931, 1, 318–333. [Google Scholar] [CrossRef]
  24. Or, D.; Lehmann, P.; Assouline, S. Natural Length Scales Define the Range of Applicability of the Richards Equation for Capillary Flows. Water Resour. Res. 2015, 51, 7130–7144. [Google Scholar] [CrossRef]
  25. Camporese, M.; Paniconi, C.; Putti, M.; Orlandini, S. Surface-Subsurface Flow Modeling with Path-Based Runoff Routing, Boundary Condition-Based Coupling, and Assimilation of Multisource Observation Data. Water Resour. Res. 2010, 46, W02512. [Google Scholar] [CrossRef]
  26. Kollet, S.J.; Maxwell, R.M. Integrated Surface–Groundwater Flow Modeling: A Free-Surface Overland Flow Boundary Condition in a Parallel Groundwater Flow Model. Adv. Water Resour. 2006, 29, 945–958. [Google Scholar] [CrossRef]
  27. Yeh, G.-T.; Shih, D.-S.; Cheng, J.-R.C. An Integrated Media, Integrated Processes Watershed Model. Comput. Fluids 2011, 45, 2–13. [Google Scholar] [CrossRef]
  28. Niswonger, R.G.; Prudic, D.E.; Regan, R.S. Documentation of the Unsaturated-Zone Flow (UZF1) Package for Modeling Unsaturated Flow Between the Land Surface and the Water Table with MODFLOW-2005; U.S. Geological Survey: Reston, VA, USA, 2006. [Google Scholar]
  29. Twarakavi, N.K.C.; Šimůnek, J.; Seo, S. Evaluating Interactions between Groundwater and Vadose Zone Using the HYDRUS-Based Flow Package for MODFLOW. Vadose Zone J. 2008, 7, 757–768. [Google Scholar] [CrossRef]
  30. Beegum, S.; Šimůnek, J.; Szymkiewicz, A.; Sudheer, K.P.; Nambi, I.M. Updating the Coupling Algorithm between HYDRUS and MODFLOW in the HYDRUS Package for MODFLOW. Vadose Zone J. 2018, 17, 180034. [Google Scholar] [CrossRef]
  31. Szymkiewicz, A.; Gumuła-Kawęcka, A.; Šimůnek, J.; Leterme, B.; Beegum, S.; Jaworska-Szulc, B.; Pruszkowska-Caceres, M.; Gorczewska-Langner, W.; Angulo-Jaramillo, R.; Jacques, D. Simulations of Freshwater Lens Recharge and Salt/Freshwater Interfaces Using the HYDRUS and SWI2 Packages for MODFLOW. J. Hydrol. Hydromech. 2018, 66, 246–256. [Google Scholar] [CrossRef]
  32. Xu, X.; Huang, G.; Zhan, H.; Qu, Z.; Huang, Q. Integration of SWAP and MODFLOW-2000 for Modeling Groundwater Dynamics in Shallow Water Table Areas. J. Hydrol. 2012, 412–413, 170–181. [Google Scholar] [CrossRef]
  33. Šimůnek, J.; Brunetti, G.; Jacques, D.; van Genuchten, M.T.; Šejna, M. Developments and Applications of the HYDRUS Computer Software Packages since 2016. Vadose Zone J. 2024, 23, e20310. [Google Scholar] [CrossRef]
  34. Celia, M.A.; Bouloutas, E.T.; Zarba, R.L. A General Mass-Conservative Numerical Solution for the Unsaturated Flow Equation. Water Resour. Res. 1990, 26, 1483–1496. [Google Scholar] [CrossRef]
  35. Collenteur, R.; Vremec, M.; Brunetti, G. Interfacing FORTAN Code with Python: An Example for the Hydrus-1D Model. In Proceedings of the EGU General Assembly 2020, Online, 4–8 May 2020. [Google Scholar]
  36. Zhang, X.; Wendroth, O.; Matocha, C.; Zhu, J.; Reyes, J. Assessing Field-Scale Variability of Soil Hydraulic Conductivity at and near Saturation. CATENA 2020, 187, 104335. [Google Scholar] [CrossRef]
  37. Mason, D.D.; Lutz, J.F.; Petersen, R.G. Hydraulic Conductivity as Related to Certain Soil Properties in a Number of Great Soil Groups—Sampling Errors Involved. Soil Sci. Soc. Am. J. 1957, 21, 554–560. [Google Scholar] [CrossRef]
  38. Öztekin, T.; Erşahin, S. Saturated Hydraulic Conductivity Variation in Cultivated and Virgin Soils. Turk. J. Agric. For. 2006, 30, 1–10. [Google Scholar]
  39. Nimmo, J.R.; Schmidt, K.M.; Perkins, K.S.; Stock, J.D. Rapid Measurement of Field-Saturated Hydraulic Conductivity for Areal Characterization. Vadose Zone J. 2009, 8, 142–149. [Google Scholar] [CrossRef]
  40. Gupta, S.; Hengl, T.; Lehmann, P.; Bonetti, S.; Or, D. SoilKsatDB: Global Database of Soil Saturated Hydraulic Conductivity Measurements for Geoscience Applications. Earth Syst. Sci. Data 2021, 13, 1593–1612. [Google Scholar] [CrossRef]
  41. Rice, R.; Milczarek, M.; Keller, J. A Critical Review of Single Ring Cylinder Infiltrometers with Lateral Flow Compensation. In Proceedings of the 14th Biennial Symposium on Managed Aquifer Recharge, Orange, CA, USA, 31 July–1 August 2014. [Google Scholar]
  42. Bouwer, H.; Back, J.T.; Oliver, J.M. Predicting Infiltration and Ground-Water Mounds for Artificial Recharge. J. Hydrol. Eng. 1999, 4, 350–357. [Google Scholar] [CrossRef]
  43. Su, L.; Wang, Q.; Shan, Y.; Zhou, B. Estimating Soil Saturated Hydraulic Conductivity Using the Kostiakov and Philip Infiltration Equations. Soil Sci. Soc. Am. J. 2016, 80, 1463–1475. [Google Scholar] [CrossRef]
  44. Bilas, G.; Dionysiou, N.; Karapetsas, N.; Silleos, N.; Kosmas, K.; Misopollinos, N. Development of a National Geodatabase (Greece) for Soil Surveys and Land Evaluation Using Space Technology and GIS. In Proceedings of the EGU General Assembly 2016, Vienna Austria, 17–22 April 2016; p. EPSC2016-12889. [Google Scholar]
  45. European Soil Data Centre (ESDAC) Soil Map of Greece—ESDAC—European Commission. Available online: https://esdac.jrc.ec.europa.eu/content/soil-map-greece-0 (accessed on 6 September 2024).
  46. Misopolinos, N.; Syllaios, N.; Zalidis, G.; Matsi, T.; Bilas, G.; Karapetsas, N.; Giannousios, A.; Tavakoglou, V.; Stratakis, G.; Dionusiou, O.; et al. Collection and Registration of Added Value Information; Final Report; Epirus region, Technological Institute 630 of Arta, Faculty of Agriculture, Forestry and Natural Environment Aristotele University of Thessaloniki: Thessaloniki, Greece, 2008. [Google Scholar]
  47. Kottek, M.; Grieser, J.; Beck, C.; Rudolf, B.; Rubel, F. World Map of the Köppen-Geiger Climate Classification Updated. Meteorol. Z. 2006, 15, 259–263. [Google Scholar] [CrossRef] [PubMed]
  48. Mamassis, N.; Mazi, K.; Dimitriou, E.; Kalogeras, D.; Malamos, N.; Lykoudis, S.; Koukouvinos, A.; Tsirogiannis, I.; Papageorgaki, I.; Papadopoulos, A.; et al. OpenHi.Net: A Synergistically Built, National-Scale Infrastructure for Monitoring the Surface Waters of Greece. Water 2021, 13, 2779. [Google Scholar] [CrossRef]
  49. Cipriani, G.; Messina, R.; Vizzotto, G.; Testolin, R. Harvest Time and Storage of ‘Soreli’ Kiwifruit (Actinidia chinensis Planch.). Acta Hortic. 2018, 1218, 459–464. [Google Scholar] [CrossRef]
  50. Dichio, B.; Tuzio, A.C.; Xiloyannis, C.; Rigo, G.; Lovato, R.; Comuzzo, G.; Frezza, R.; Macor, D.; Cipriani, G.; Testolin, R.; et al. The New Yellow-Fleshed Kiwifruit (Actinidia chinensis pl.) “Soreli”: Conclusions from Six Years of Cultivation in Different Climatic Areas. Acta Hortic. 2015, 1096, 149–154. [Google Scholar] [CrossRef]
  51. McAneney, K.J.; Judd, M.J. Observations on Kiwifruit (Actinidia chinensis Planch.) Root Exploration, Root Pressure, Hydraulic Conductivity, and Water Uptake. N. Z. J. Agric. Res. 1983, 26, 507–510. [Google Scholar] [CrossRef]
  52. Gandar, P.W.; Hughes, K.A. Kiwifruit Root Systems 1. Root-Length Densities. N. Z. J. Exp. Agric. 1988, 16, 35–46. [Google Scholar] [CrossRef]
  53. Hughes, K.A.; Wilde, R.H. The Effect of Poor Drainage on the Root Distribution of Kiwifruit Vines. N. Z. J. Crop Hortic. Sci. 1989, 17, 239–244. [Google Scholar] [CrossRef]
  54. Hughes, K.A.; De Willigen, P.; Gandar, P.W.; Clothier, B.E. Kiwifruit Root Systems: Structure & Function. Acta Hortic. 1992, 297, 383–390. [Google Scholar] [CrossRef]
  55. Bardet, J.-P. Experimental Soil Mechanics; Prentice Hall: Upper Saddle River, NJ, USA, 1997; ISBN 978-0-13-374935-9. [Google Scholar]
  56. Cisty, M.; Celar, L.; Minaric, P. Conversion Between Soil Texture Classification Systems Using the Random Forest Algorithm. Air Soil Water Res. 2020, 8, 67–75. [Google Scholar] [CrossRef]
  57. Shangguan, W.; Dai, Y.; García-Gutiérrez, C.; Yuan, H. Particle-Size Distribution Models for the Conversion of Chinese Data to FAO/USDA System. Sci. World J. 2014, 2014, 109310. [Google Scholar] [CrossRef]
  58. Esmaeelnejad, L.; Siavashi, F.; Seyedmohammadi, J.; Shabanpour, M. The Best Mathematical Models Describing Particle Size Distribution of Soils. Model. Earth Syst. Environ. 2016, 2, 1–11. [Google Scholar] [CrossRef]
  59. Burt, R.; Soil Survey Staff. Soil Survey Field and Laboratory Methods Manual; Soil Survey Investigations; U.S. Department of Agriculture, Natural Resources Conservation Service: Washington, DC, USA, 2014. [Google Scholar]
  60. Kostiakov, A.Ν. The Dynamics of the Coefficient of Water Percolation in Soils and the Necessity for Studying It from a Dynamic Point of View for Purpose of Amelioration. Soc. Soil Sci. 1932, 14, 17–21. [Google Scholar]
  61. Philip, J.R. The Theory of Infiltration: 1. The Infiltration Equation and Its Solution. Soil Sci. 1957, 83, 345. [Google Scholar] [CrossRef]
  62. Kahlon, M.S.; Lal, R.; Ann-Varughese, M. Twenty Two Years of Tillage and Mulching Impacts on Soil Physical Characteristics and Carbon Sequestration in Central Ohio. Soil Tillage Res. 2013, 126, 151–158. [Google Scholar] [CrossRef]
  63. Ma, D.; Wang, Q.; Shao, M. Analytical Method for Estimating Soil Hydraulic Parameters from Horizontal Absorption. Soil Sci. Soc. Am. J. 2009, 73, 727–736. [Google Scholar] [CrossRef]
  64. Ghosh, R.K. A Note on Lewis-Kostiakov’s Infiltration Equation. Soil Sci. 1985, 139, 193. [Google Scholar] [CrossRef]
  65. WIKA. Submersible Pressure Sensor High-Performance Model LH-20; WIKA: București, Romania, 2024. [Google Scholar]
  66. Pagano, A.; Croce, D.; Tinnirello, I.; Vitale, G. A Survey on LoRa for Smart Agriculture: Current Trends and Future Perspectives. IEEE Internet Things J. 2023, 10, 3664–3679. [Google Scholar] [CrossRef]
  67. Brooks, R.H.; Corey, A.T. Hydraulic Properties of Porous Media; Colorado State University: Fort Collins, CO, USA, 1964; Volume 3. [Google Scholar]
  68. Pan, T.; Hou, S.; Liu, Y.; Tan, Q. Comparison of Three Models Fitting the Soil Water Retention Curves in a Degraded Alpine Meadow Region. Sci. Rep. 2019, 9, 18407. [Google Scholar] [CrossRef]
  69. Memari, S.S.; Clement, T.P. PySWR—A Python Code for Fitting Soil Water Retention Functions. Comput. Geosci. 2021, 156, 104897. [Google Scholar] [CrossRef]
  70. Durner, W.; Priesack, E.; Vogel, H.-J.; Zurmühl, T. Determination of Parameters for Flexible Hydraulic Functions by Inverse Modeling. In Proceedings of the International Workshop on Characterization and Measurement of the Hydraulic Properties of Unsaturated Porous Media; University of California: Berkeley, CA, USA, 1999. [Google Scholar]
  71. Stankovich, J.M.; Lockington, D.A. Brooks-Corey and van Genuchten Soil-Water-Retention Models. J. Irrig. Drain. Eng. 1995, 121, 1–7. [Google Scholar] [CrossRef]
  72. Lenhard, R.J.; Parker, J.C.; Mishra, S. On the Correspondence between Brooks-Corey and van Genuchten Models. J. Irrig. Drain. Eng. 1989, 115, 744–751. [Google Scholar] [CrossRef]
  73. Fuentes, C.; Haverkamp, R.; Parlange, J.-Y. Parameter Constraints on Closed-Form Soilwater Relationships. J. Hydrol. 1992, 134, 117–142. [Google Scholar] [CrossRef]
  74. Rawls, W.J.; Brakensiek, D.L.; Saxtonn, K.E. Estimation of Soil Water Properties. Trans.-Am. Soc. Agric. Eng. 1982, 25, 1316–1320. [Google Scholar] [CrossRef]
  75. Vereecken, H.; Kamai, T.; Harter, T.; Kasteel, R.; Hopmans, J.; Vanderborght, J. Explaining Soil Moisture Variability as a Function of Mean Soil Moisture: A Stochastic Unsaturated Flow Perspective. Geophys. Res. Lett. 2007, 34, L22402. [Google Scholar] [CrossRef]
  76. Harbaugh, A.W. MODFLOW-2005: The U.S. Geological Survey Modular Ground-Water Model—The Ground-Water Flow Process. In Techniques and Methods; US Geological Survey: Reston, VI, USA, 2005. [Google Scholar] [CrossRef]
  77. Winston, R.B. ModelMuse Version 4: A Graphical User Interface for MODFLOW 6; U.S. Geological Survey: Reston, VI, USA, 2019. [Google Scholar]
  78. Pouliaris, C.; Kofakis, P.; Chrysanthopoulos, E.; Myriounis, C.; Markantonis, K.; Koltsida, E.; Pappa, D.; Kaliampakos, D.; Perdikaki, M.; Kallioras, A. Conflicting Ecosystem Services within Coastal Na.tural Hydrosystems. The Case of Louros-Arachthos-Amvrakikos, W. Greece. In Proceedings of the EGU22, the 24th EGU General Assembly, Vienna, Austria, 23–27 May 2022; p. EGU22-12011. [Google Scholar]
  79. Chrysanthopoulos, E.; Pouliaris, C.; Tsirogiannis, I.; Kofakis, P.; Kallioras, A. Development of Soil Moisture Model Based on Deep Learning. In Proceedings of the Recent Advances in Environmental Science from the Euro-Mediterranean and Surrounding Regions, 4th ed.; Ksibi, M., Sousa, A., Hentati, O., Chenchouni, H., Lopes Velho, J., Negm, A., Rodrigo-Comino, J., Hadji, R., Chakraborty, S., Ghorbal, A., Eds.; Springer Nature Switzerland: Cham, Switzerland, 2024; pp. 477–479. [Google Scholar]
  80. Koltsida, E.; Panagiotaropoulos, K.; Perdikaki, M.; Pouliaris, C.; Kallioras, A. Development of an Integrated Simulation Platform of the Agricultural Ecosystems and Hydrological Processes; Final Report. “e-Pyrros: Development of an Integrated Monitoring Network for Hydro-Environmental Parameters within the Hydro-Systems of Louros-Arachthos-Amvrakikos for the Optimal Management and Improvement of Agricultural Production.”; N.T.U.A. Research Committee: Athens, Greece, 2022. [Google Scholar]
  81. Moriasi, D.N.; Arnold, J.G.; Van Liew, M.W.; Bingner, R.L.; Harmel, R.D.; Veith, T.L. Model Evaluation Guidelines for Systematic Quantification of Accuracy in Watershed Simulations. Trans. ASABE 2007, 50, 885–900. [Google Scholar] [CrossRef]
  82. Lehmann, P.; Leshchinsky, B.; Gupta, S.; Mirus, B.B.; Bickel, S.; Lu, N.; Or, D. Clays Are Not Created Equal: How Clay Mineral Type Affects Soil Parameterization. Geophys. Res. Lett. 2021, 48, e2021GL095311. [Google Scholar] [CrossRef]
  83. Gerke, H.H.; van Genuchten, M.T. A Dual-Porosity Model for Simulating the Preferential Movement of Water and Solutes in Structured Porous Media. Water Resour. Res. 1993, 29, 305–319. [Google Scholar] [CrossRef]
  84. Van Liew, M.W.; Arnold, J.G.; Garbrecht, J.D. Hydrologic Simulation on Agricultural Watersheds: Choosing Between Two Models. Trans. ASABE 2003, 46, 1539–1551. [Google Scholar] [CrossRef]
  85. Leterme, B.; Gedeon, M.; Laloy, E.; Rogiers, B. Unsaturated Flow Modeling with HYDRUS and UZF: Calibration and Intercomparison. In Proceedings of the MODFLOW and More 2015: Modeling a Complex World, Golden, CO, USA, 31 May–3 June 2015. [Google Scholar]
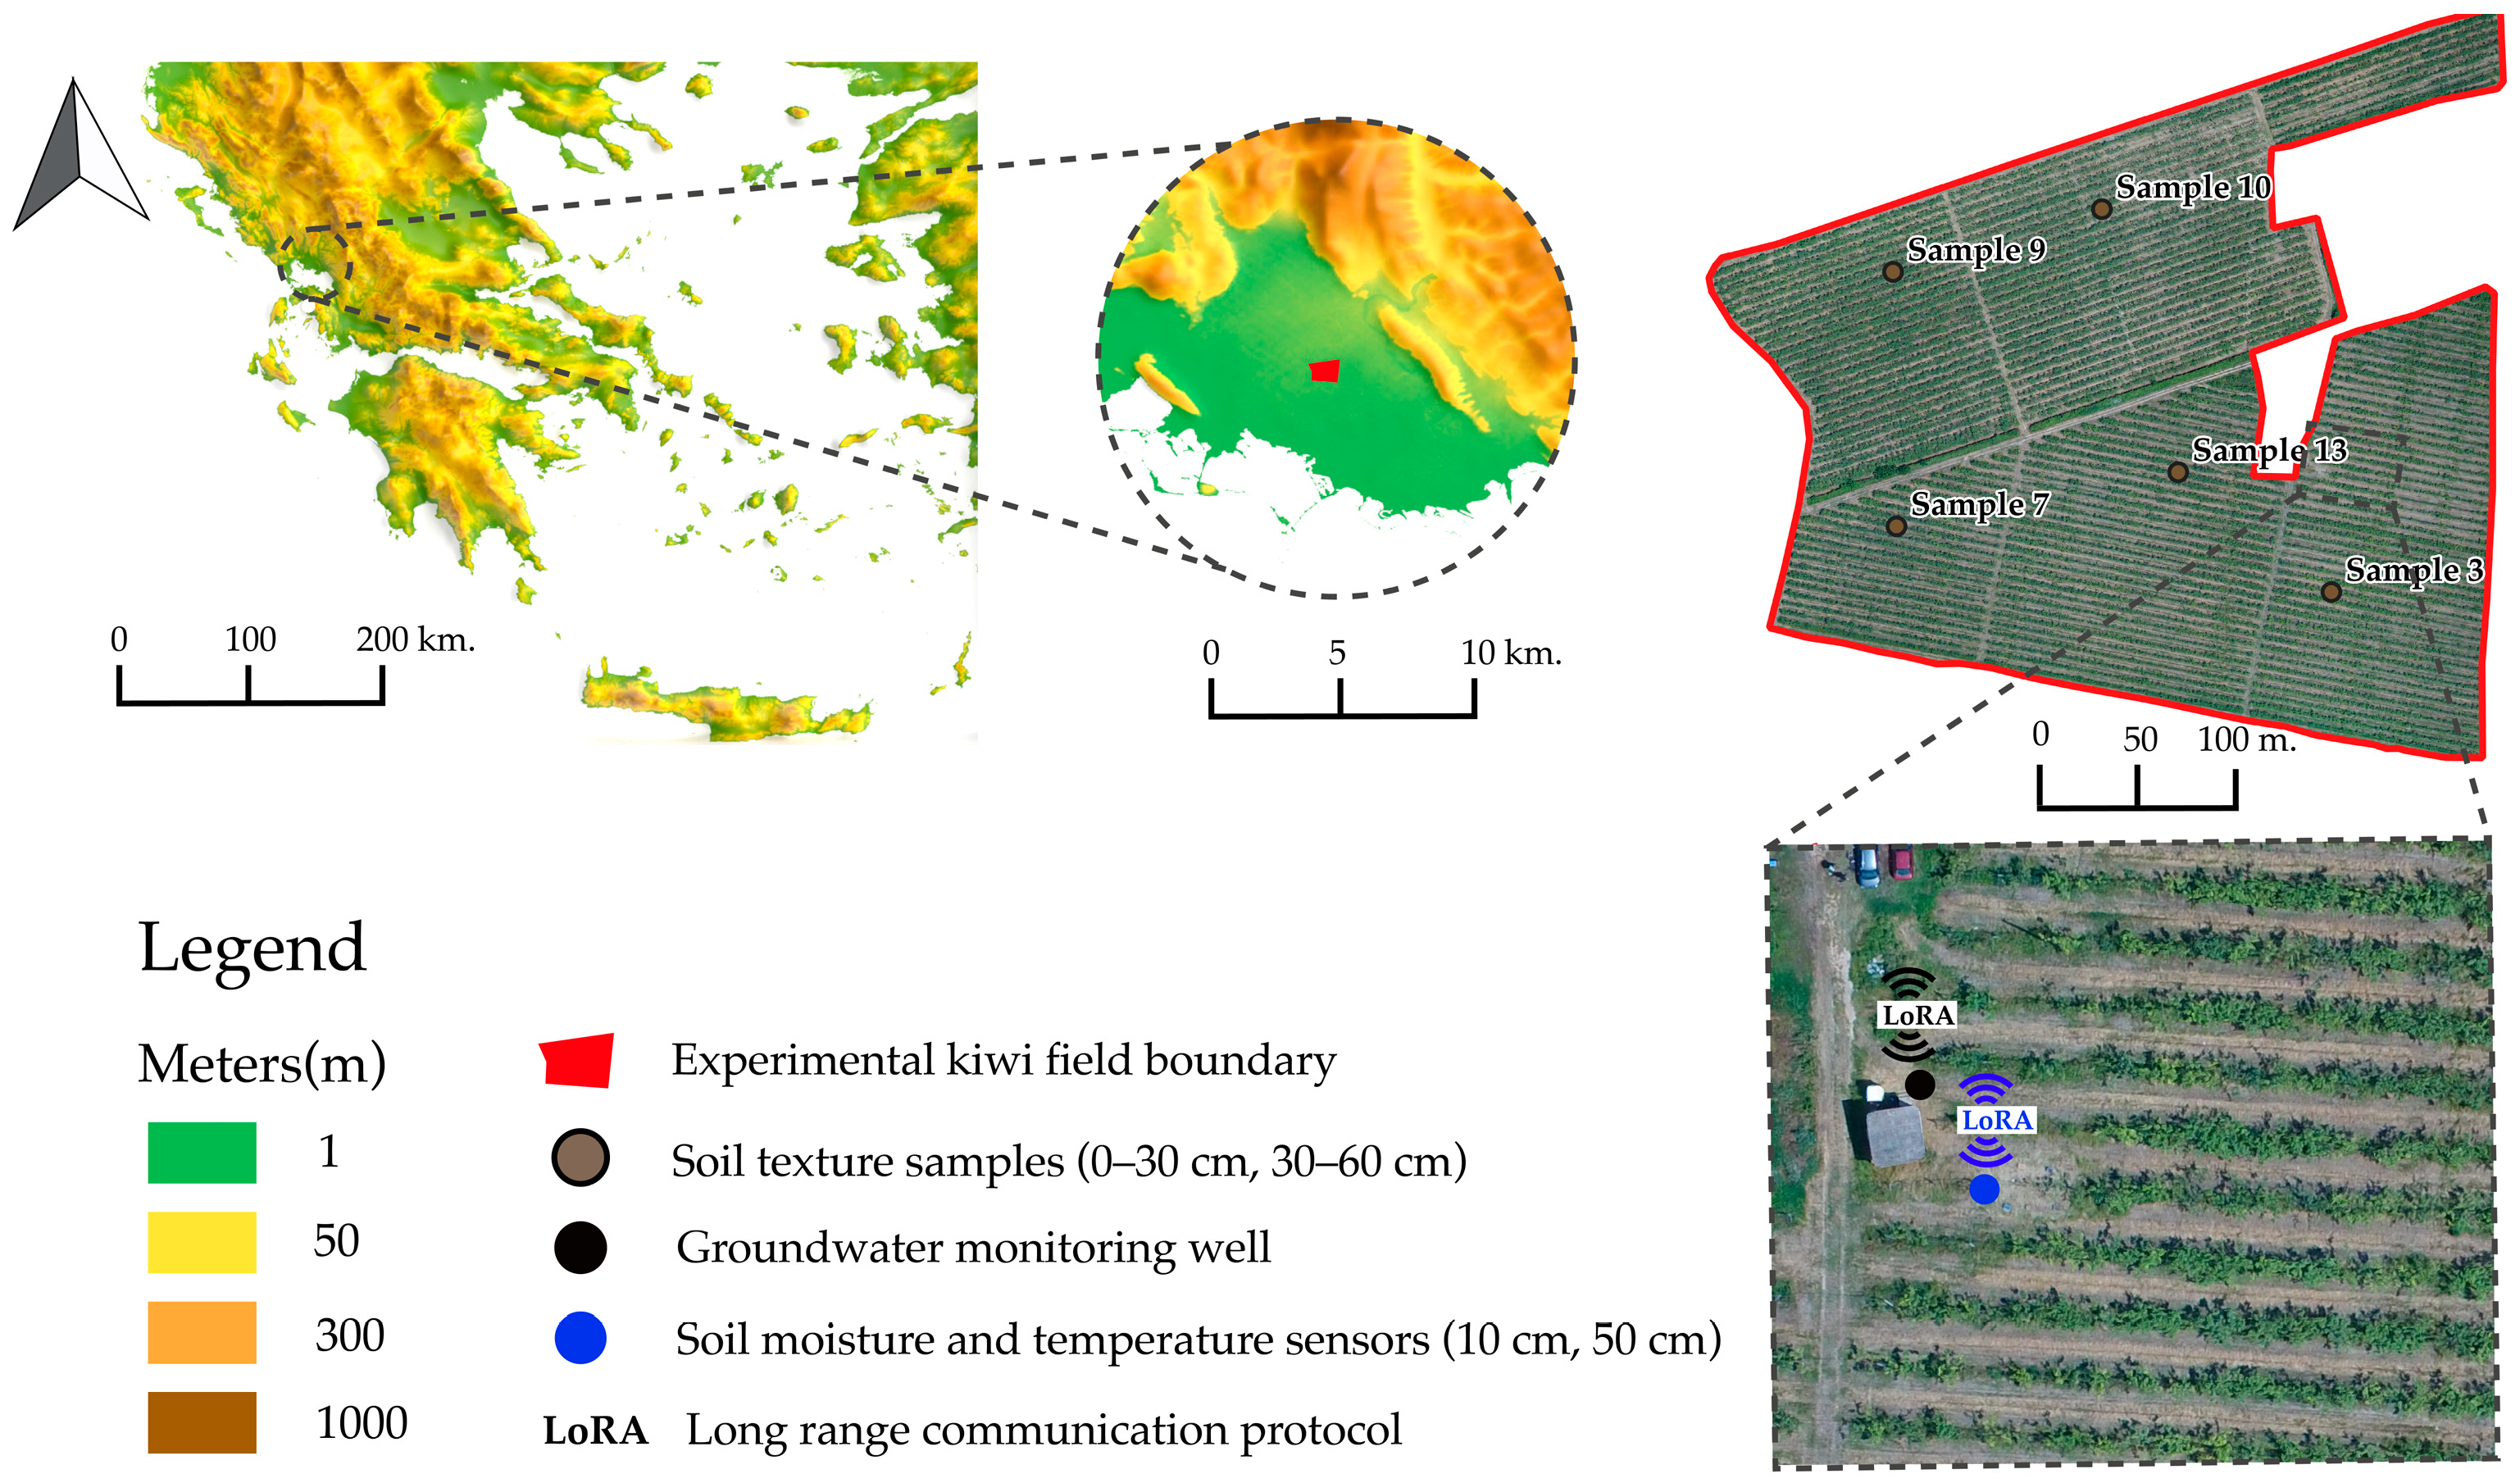
Figure 1. Description of the kiwifruit orchard area, the locations of soil texture samples from two soil horizons (0–30 cm, 30–60 cm), and the installed positions of soil moisture and temperature sensors along with a pressure level sensor in a monitoring groundwater well.
Water 16 03297 g001
Figure 2. Locations of single-ring and double-ring infiltration experiments within the area of the experimental kiwifruit orchard.
Water 16 03297 g002
Figure 3. Precipitation and irrigation fluxes in the vicinity of the experimental kiwifruit orchard along with soil moisture and groundwater level fluctuations within the modeling period.
Water 16 03297 g003
Figure 4. Visual flowchart of soil analysis data integration into the subsurface modeling process [74,75].
Water 16 03297 g004
Figure 5. Groundwater model boundary conditions.
Water 16 03297 g005
Figure 6. Particle soil distribution curves of soil samples in two soil horizons (top-soil 0–30 cm and sub-soil 30–60 cm).
Water 16 03297 g006
Figure 7. Soil texture classification triangle according to USDA. The red dots represent the different soil samples.
Water 16 03297 g007
Figure 8. Double-ring cumulative infiltration rates modeled from Philip’s two-term equation and Kostiakov’s equation in each location of the experiment.
Water 16 03297 g008
Figure 9. Single-ring cumulative infiltration rates modeled from Philip’s two-term equation and Kostiakov’s equation in each location of the experiment.
Water 16 03297 g009
Figure 10. Ksat [m/day] spatial distribution within the area of the experimental kiwifruit orchard.
Water 16 03297 g010
Figure 11. Groundwater MODFLOW simulation results under HYDRUS and UZF modeling frameworks [74].
Water 16 03297 g011
Table 1. MODFLOW input parameters.
ParameterParameter NameParameter Value
Horizontal Hydraulic Conductivity (Top Layer)HK_Lay15.2 m/day
Horizontal Hydraulic Conductivity (Bottom Layer)HK_Lay210.43 m/day
Specific Storage (Top Layer)SS_Lay10.00023 m−1
Specific Storage (Bottom Layer)SS_Lay22.1 × 10−5 m−1
Specific Yield (Top Layer)SY_Lay10.3
Specific Yield (Bottom Layer)SY_Lay20.2
Hydraulic Conductance (General Head Boundary)GHB_cond8.64 m/day
Table 2. Kostiakov parameters (m, n) based on different methods of calculation and Ksat (m/day) estimation for each set of parameters in respect of double-ring experiments.
Infiltration Pointsm (Kostiakov)n (Kostiakov)m *n *Ksat * (m/day)Ksat * (Kostiakov Parameters) (m/day)
DR114.0400.72814.0040.5766.37421.035
DR212.4150.82712.2050.6259.41717.489
DR314.2840.57317.0870.4956.23615.632
DR428.0320.58529.4700.5173.02114.437
DR526.9600.75224.2240.61016.23744.61
DR634.8610.59937.2350.5204.36921.064
DR71.7840.9801.010.9062.9376.4156
Note: * modified Philip–Kostiakov equation.
Table 3. Kostiakov parameters (m, n) based on different methods of calculation and Ksat (m/day) estimation for each set of parameters in respect of single-ring experiments.
Infiltration Pointsm (Kostiakov)n (Kostiakov)m *n *Ksat * (m/day)Ksat (Kostiakov) (m/day)
SR111.1630.69910.1980.5845.14414.180
SR216.2950.63016.1070.5413.89613.025
SR310.2640.7399.2560.6045.85416.003
SR44.1770.7534.2140.5842.1466.940
SR511.1600.58011.4540.5181.2555.388
SR62.1530.7912.1380.6051.3744.2065
SR715.0130.72812.6150.6209.29522.201
SR817.2910.51018.2250.4970.2581.001
SR90.5850.9720.3050.9290.9512.056
SR105.2970.8584.1050.7055.39413.205
SR112.0270.8281.8030.6481.6614.553
SR120.3770.8190.3160.6590.3148.189
SR1317.7950.68916.3070.5807.89721.415
SR142.0860.9121.3980.7862.676.171
SR154.170.7534.210.5842.1466.94
Note: * modified Philip–Kostiakov equation.
Table 4. Statistical evaluation between distinct unsaturated zone modeling frameworks coupled with MODFLOW.
HYDRUSUZF [18]UZF [74]
r0.80.8030.803
R20.640.6440.645
RMSE (m)0.1860.1870.187
Table 5. Groundwater modeling budget at the end of the modeling period.
MODFLOW-HYDRUSMODFLOW-UZF [74]MODFLOW-Toth [18]
Storage52,347.1259,834.62959,806.2
Head-Dependent Boundaries187,056.5242,706.64243,091
Recharge93,745.6855,290.0255,653.539
Storage−70,883.4−81,906.875−82,208.6
Pumping wells−98,831.2−98,831.156−98,831.156
Drains−8793.86−6427.26−6442.2241
Head-Dependent Boundaries−154,587−123,056.6−122,715
Evapotranspiration-−48,068.3−48,020.484
Disclaimer/Publisher’s Note: The statements, opinions and data contained in all publications are solely those of the individual author(s) and contributor(s) and not of MDPI and/or the editor(s). MDPI and/or the editor(s) disclaim responsibility for any injury to people or property resulting from any ideas, methods, instructions or products referred to in the content.