Article

Investigating the Element Geochemical Behavior and Provenance of Surface Sediments in the Offshore Area of Sierra Leone, Africa: Insights from Major and Trace Elements

1
Institute of Geophysical and Geochemical Exploration, Chinese Academy of Geological Sciences, Langfang 065000, China
2
Tianjin Research Institute for Water Transport Engineering, Ministry of Transport, Tianjin 300456, China
3
Qingdao Boyan Marine Environmental Science & Technology Co., Ltd., Qingdao 266114, China
*
Authors to whom correspondence should be addressed.
Water 2024, 16(23), 3540; https://doi.org/10.3390/w16233540
Submission received: 11 November 2024 / Revised: 2 December 2024 / Accepted: 6 December 2024 / Published: 9 December 2024
(This article belongs to the Special Issue Advanced Research on Marine Geology and Sedimentology)

Abstract

:
The element geochemical behavior and provenance of marine sediments are of significance to understanding the oceanic material cycle. Here, we tested the grain size and major and trace elements of 35 surface sediments in the offshore area of Sierra Leone, analyzed the content characteristics and controlling factors of the elements, discussed the material source of the sediments, and made a comparative study with the sediments in the offshore area of China. The results show that sandy silt is the main sediment type in the research area, and the average sediment mean grain size (Mz) is 4.15Φ. The content of Ca in the samples is the highest among the major elements (except Si), with an average of 5.1%. The content of Sr is the highest among the trace elements (except Ti, P, and Mn), with an average of 378.2 μg/g. The results of correlation analysis and factor analysis show that there are three main sources of sediments in the research area, namely, terrigenous weathering products, ilmenite-dominated ore, and oceanic biochemical substances. Compared with the sediments in China offshore, the sediments in the study area are more affected by marine biochemistry and have special ore input characteristics.

1. Introduction

The offshore of the continental shelf is an important hub connecting the land and the deep sea in the regional position, and the region is significantly affected by the land–sea interaction [1]. These unique factors make it play a vital role in the study of the global material cycle process [2,3]. Therefore, the discussion of sediment sources and sinks in the offshore of the continental shelf has become the focus of researchers [4,5,6,7,8,9]. There are numerous studies only on the offshore areas of China and surrounding countries, such as the Yellow River Delta [10,11], the Yangtze River Delta [12,13], the Pearl River Delta [14], and the Bengal sedimentary fan [15,16], which have all attracted much attention.
Marine sediment, classified by formation mode, mainly comes from cosmic, rocky, biological, or aquatic components [17]. In a series of processes of weathering, transportation, sedimentation, resuspension, and redeposition, the content of major and trace elements will change with it, so the content and combination characteristics of major and trace elements in sediments record a lot of information about the source-to-sink process and sedimentary environment [18,19]. The elements (e.g., Al, Fe, Mg, K, Na, etc.) are mainly controlled by rock-forming minerals, and their combination characteristics can reflect the composition of the parent rock in the source area [20,21,22,23]. The elements Ca and Sr are not only controlled by the source rock, but are also important indicators of biological processes in the ocean [24,25,26]. Elements, such as Cr, Cu, Mo, Fe, Mn, etc., are sensitive to the changes in redox conditions in the sedimentary environment, and are often used to explore the changes of redox state in the marine sedimentary environment [27,28,29,30,31]. Over the years, relatively stable elements in the surface environment (such as Ti, Al, Sc, Th, etc.) and their ratios have also become important indicators for exploring the source of marine sediments [32,33,34]. In addition, human exploitation of the ocean will also cause changes in the element contents in marine sediments, especially some heavy metals. Some metals are toxic to the environment (such as Co, Ni, Cd, Cu, As, Hg, Pb, etc.). It is of great significance to study the background concentration of and variation in these metal elements for marine environmental protection and development [35,36,37,38].
Although a large number of related studies have been carried out on the geochemical characteristics and provenance of marine sediments, these studies have some drawbacks. These are due to funding and other reasons: either the research area is large, but the data volume is small, or the data volume is large, but the area is small. And there is a large blank area of basic survey data in this research. Therefore, if we want to understand the characteristics of global marine sedimentation, we can only work together and enrich the basic survey data step by step. From this scientific perspective, we choose an offshore area with relatively poor water system development and relatively disadvantaged economic development. Sierra Leone is located on the west coast of Africa, bordering Guinea in the north and northeast, Liberia in the East and Southeast, and the Atlantic Ocean in the West and south. The terrain of Sierra Leone is characterized as high in the East and low in the West. It gradually transitions from a plain about 70 km wide along the coast to a plateau on the eastern border. Sierra Leone has a tropical monsoon climate and is one of the countries with the most rainfall in West Africa. In order to reveal the elemental geochemical behavior of the sediments in the offshore area of Sierra Leone, we tested the grain size and major and trace elements of 35 surface sediments in the research area, analyzed the content characteristics and controlling factors of the elements, discussed the material source of the sediments, and made a comparative study with the characteristics of the sediments in the offshore area of China. We aim to fill some gaps in the study of elemental chemistry in sediments. The research area and sampling stations are shown in Figure 1.

2. Materials and Methods

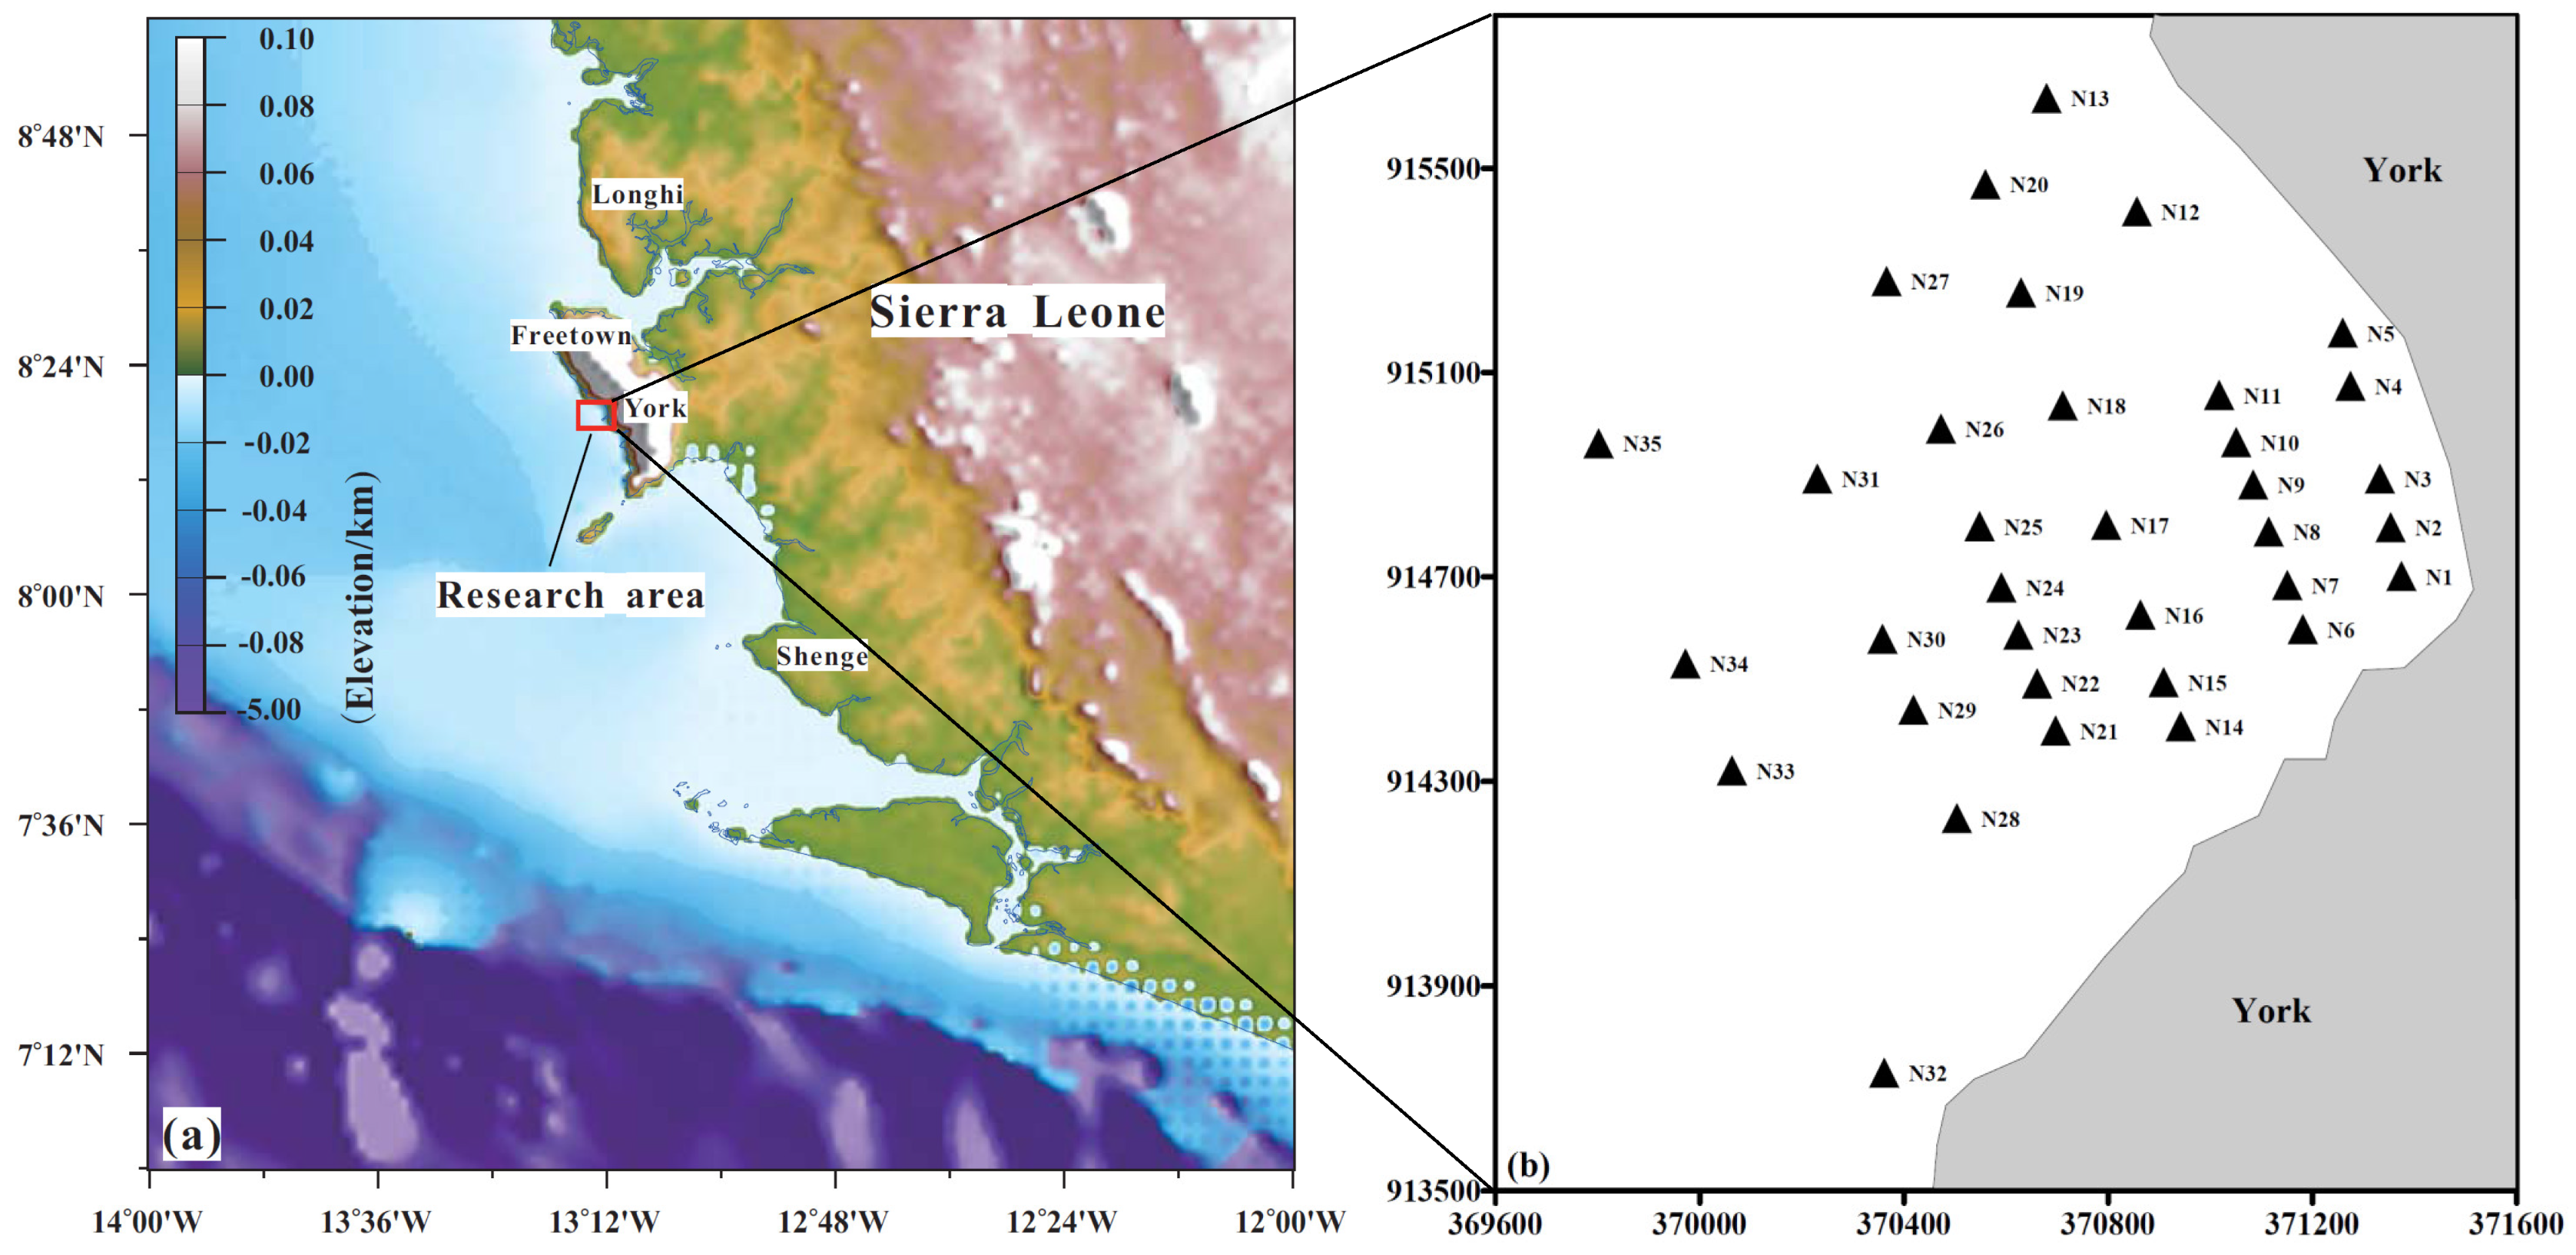
2.1. Sample Collection

The samples were collected from a western area offshore of Freetown, Sierra Leone (Figure 1a). A clam-type sediment sampler was used to collect these sediment samples at a depth of <20 cm. The sampling sites are shown in Figure 1b.

2.2. Grain Size Analyses

The particle size measurement of sediment was carried out using a laser particle size analyzer (Mastersizer 2000, Malvern Panalytical, Westborough, MA, USA), whose measurement range and resolution are 0.017–2000 μm and 0.1Φ, respectively. Organic matter and calcium components were removed by using hydrogen peroxide and hydrochloric acid before measurement. Afterwards, samples were rinsed several times with deionized water, then separated with sodium hexametaphosphate, and finally tested on the machine. The grain size parameters were calculated based on the moment method [39]. The measurements of these samples were completed at the Institute of Geophysical and Geochemical exploration, Chinese Academy of Geological Sciences.

2.3. Major and Trace Element Analyses

The content of major and trace elements in the sediments was tested by two instruments, with the major elements measured by ICP-OES (Inductively Coupled Plasma–Optical Emission Spectrometry, SPECTRO Analytical Instruments, Kleve, Germany) and the trace elements measured by ICP-MS (Inductively Coupled Plasma–Mass Spectrometry, Agilent Technologies, Santa Clara, CA, USA). After low-temperature drying, the sediment samples were ground to 200 mesh. After grinding, 0.05 g of the sample was weighed and placed in a polytetrafluoroethylene digestion tank, and then digested by adding twice-distilled hydrofluoric acid and nitric acid (volume ratio was 1:1). After digestion, the sample was placed in a 190 °C oven for 48 h, and then cooled and evaporated on an electric heating plate. Afterwards, about 3 mL of 50% HNO3 was added to the sample container, and then it was placed in a 150 °C oven to continue dissolving the sample for more than 8 h. After reaching a certain volume, we waited for testing. We conducted repeated analysis of several samples and standard sample (GSD-9) analysis to ensure testing accuracy and precision (relative error < 2%). These testing experiments were completed at the Institute of Geophysical and Geochemical Exploration, Chinese Academy of Geological Sciences.

3. Results

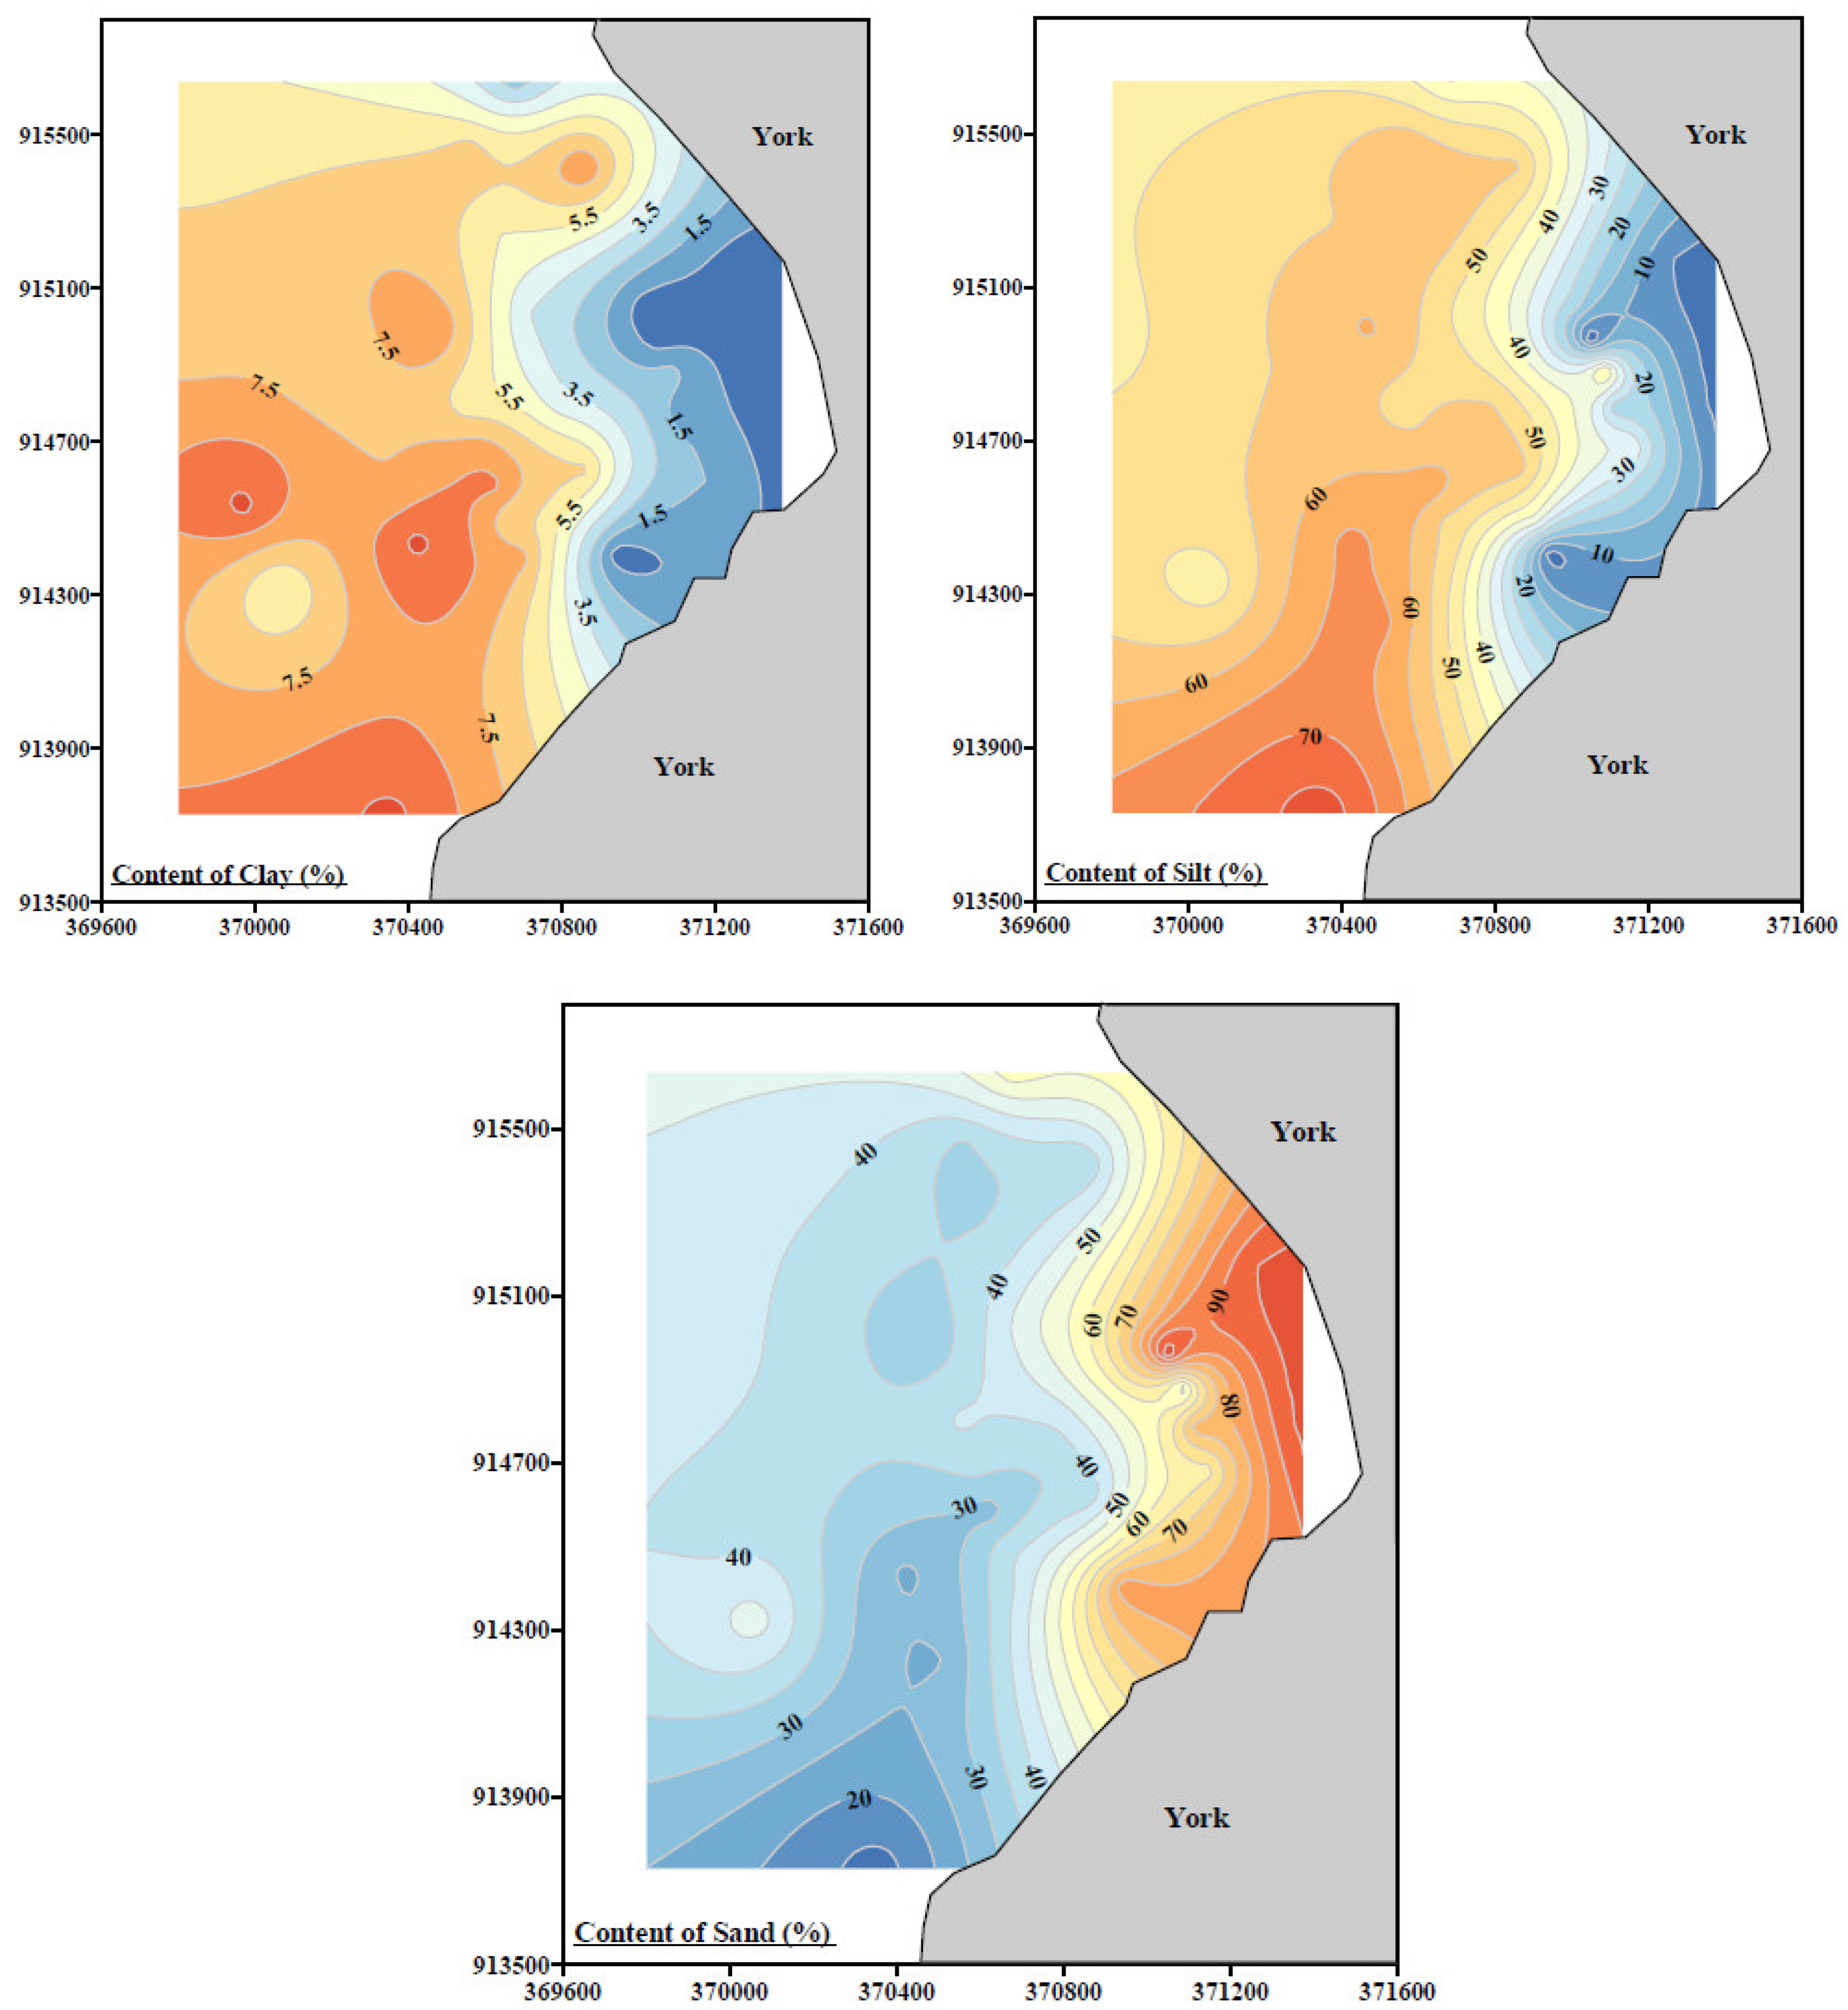
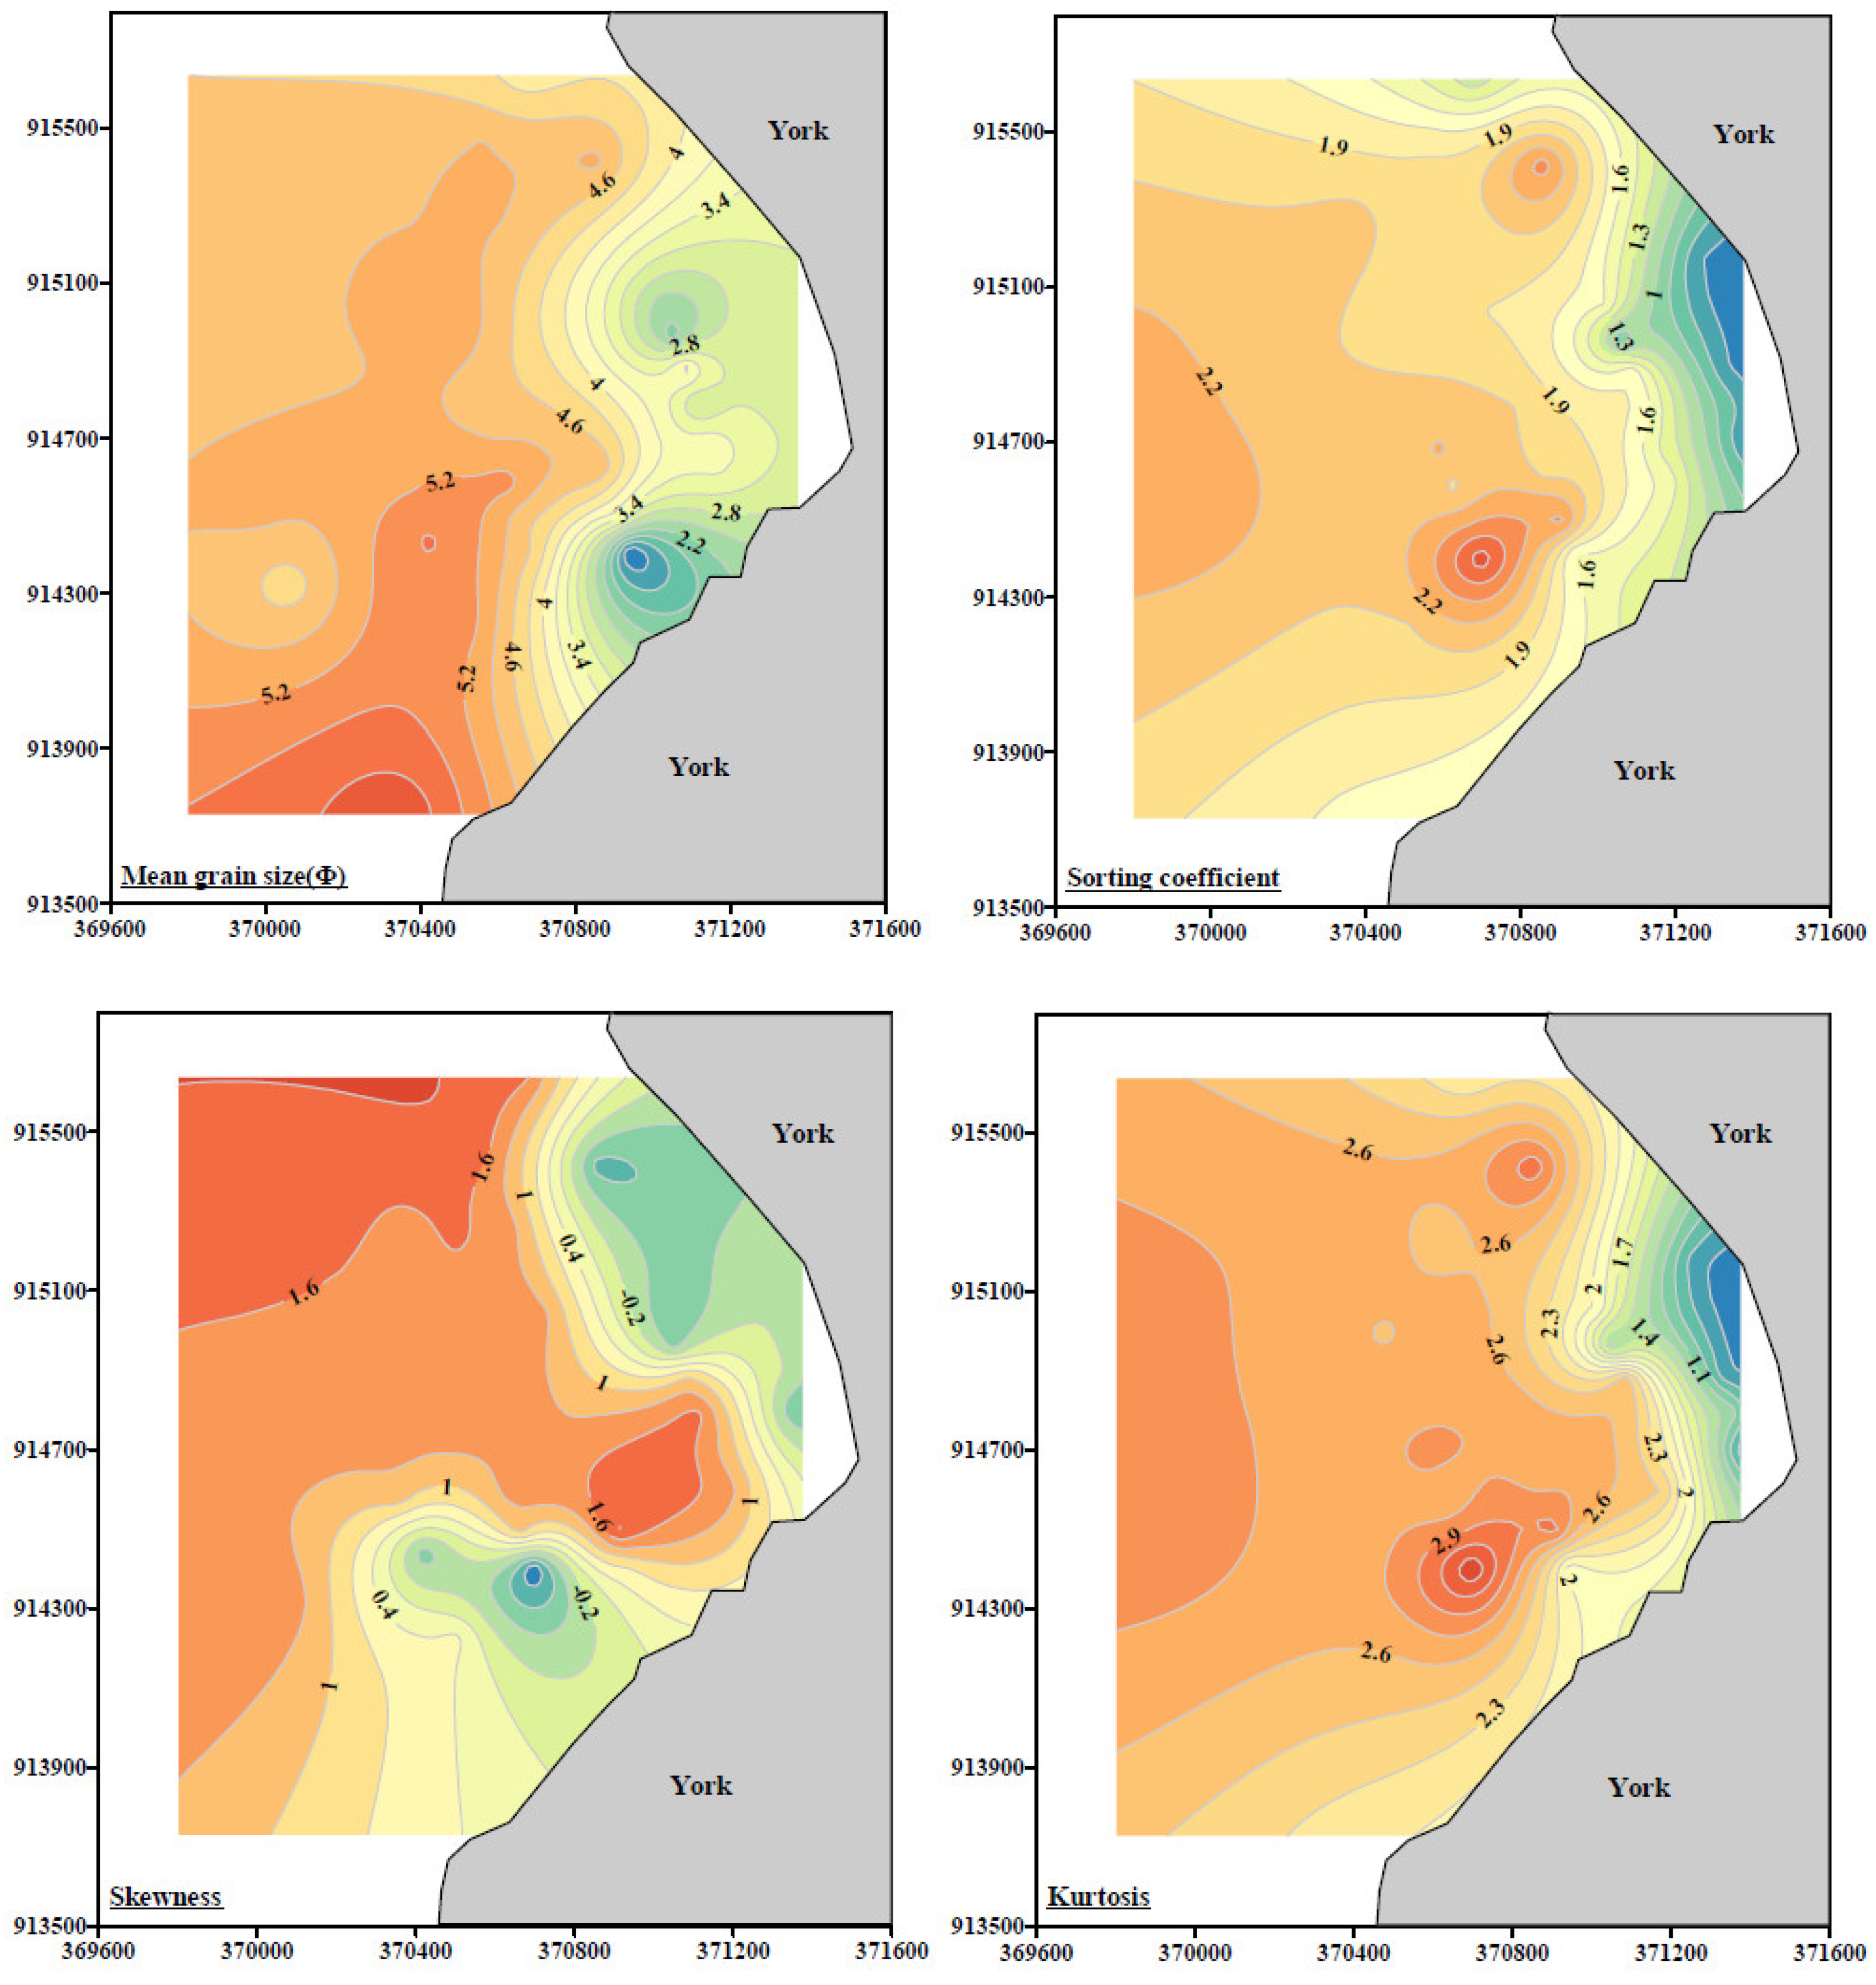
3.1. Grain Size Characteristics

Based on Folk and Ward [40], these samples can be divided into five types: sandy silt, silty sand, sand, gravelly muddy sand, and gravelly sand (Figure 2). And sandy silt is the main sediment type. From the nearshore to offshore, the content of clay and silt gradually increases, while the content of sand gradually decreases (Figure 3). The contents of the three particle size components in the sediment vary greatly, among which the average content of sand is 53.31% (varying from 12.6% to 99.47%), the average content of silt is 41.57% (varying from 0.53% to 77.66%), and the average content of clay content is 4.66% (varying from 0 to 9.79%) (see details in Table 1).
The average mean grain size (Mz) of the samples is 4.15Φ (varying from 0.96 to 6.03Φ). The average sorting coefficient (δ) is 1.75 (varies from 0.57 to 2.74). The average skewness (Sk) is 0.8 (varies from −1.37 to 1.91). The average kurtosis (Ku) is 2.32 (varies from 0.72 to 3.34). Overall, these four parameters increase gradually from the nearshore to offshore area (Figure 4).

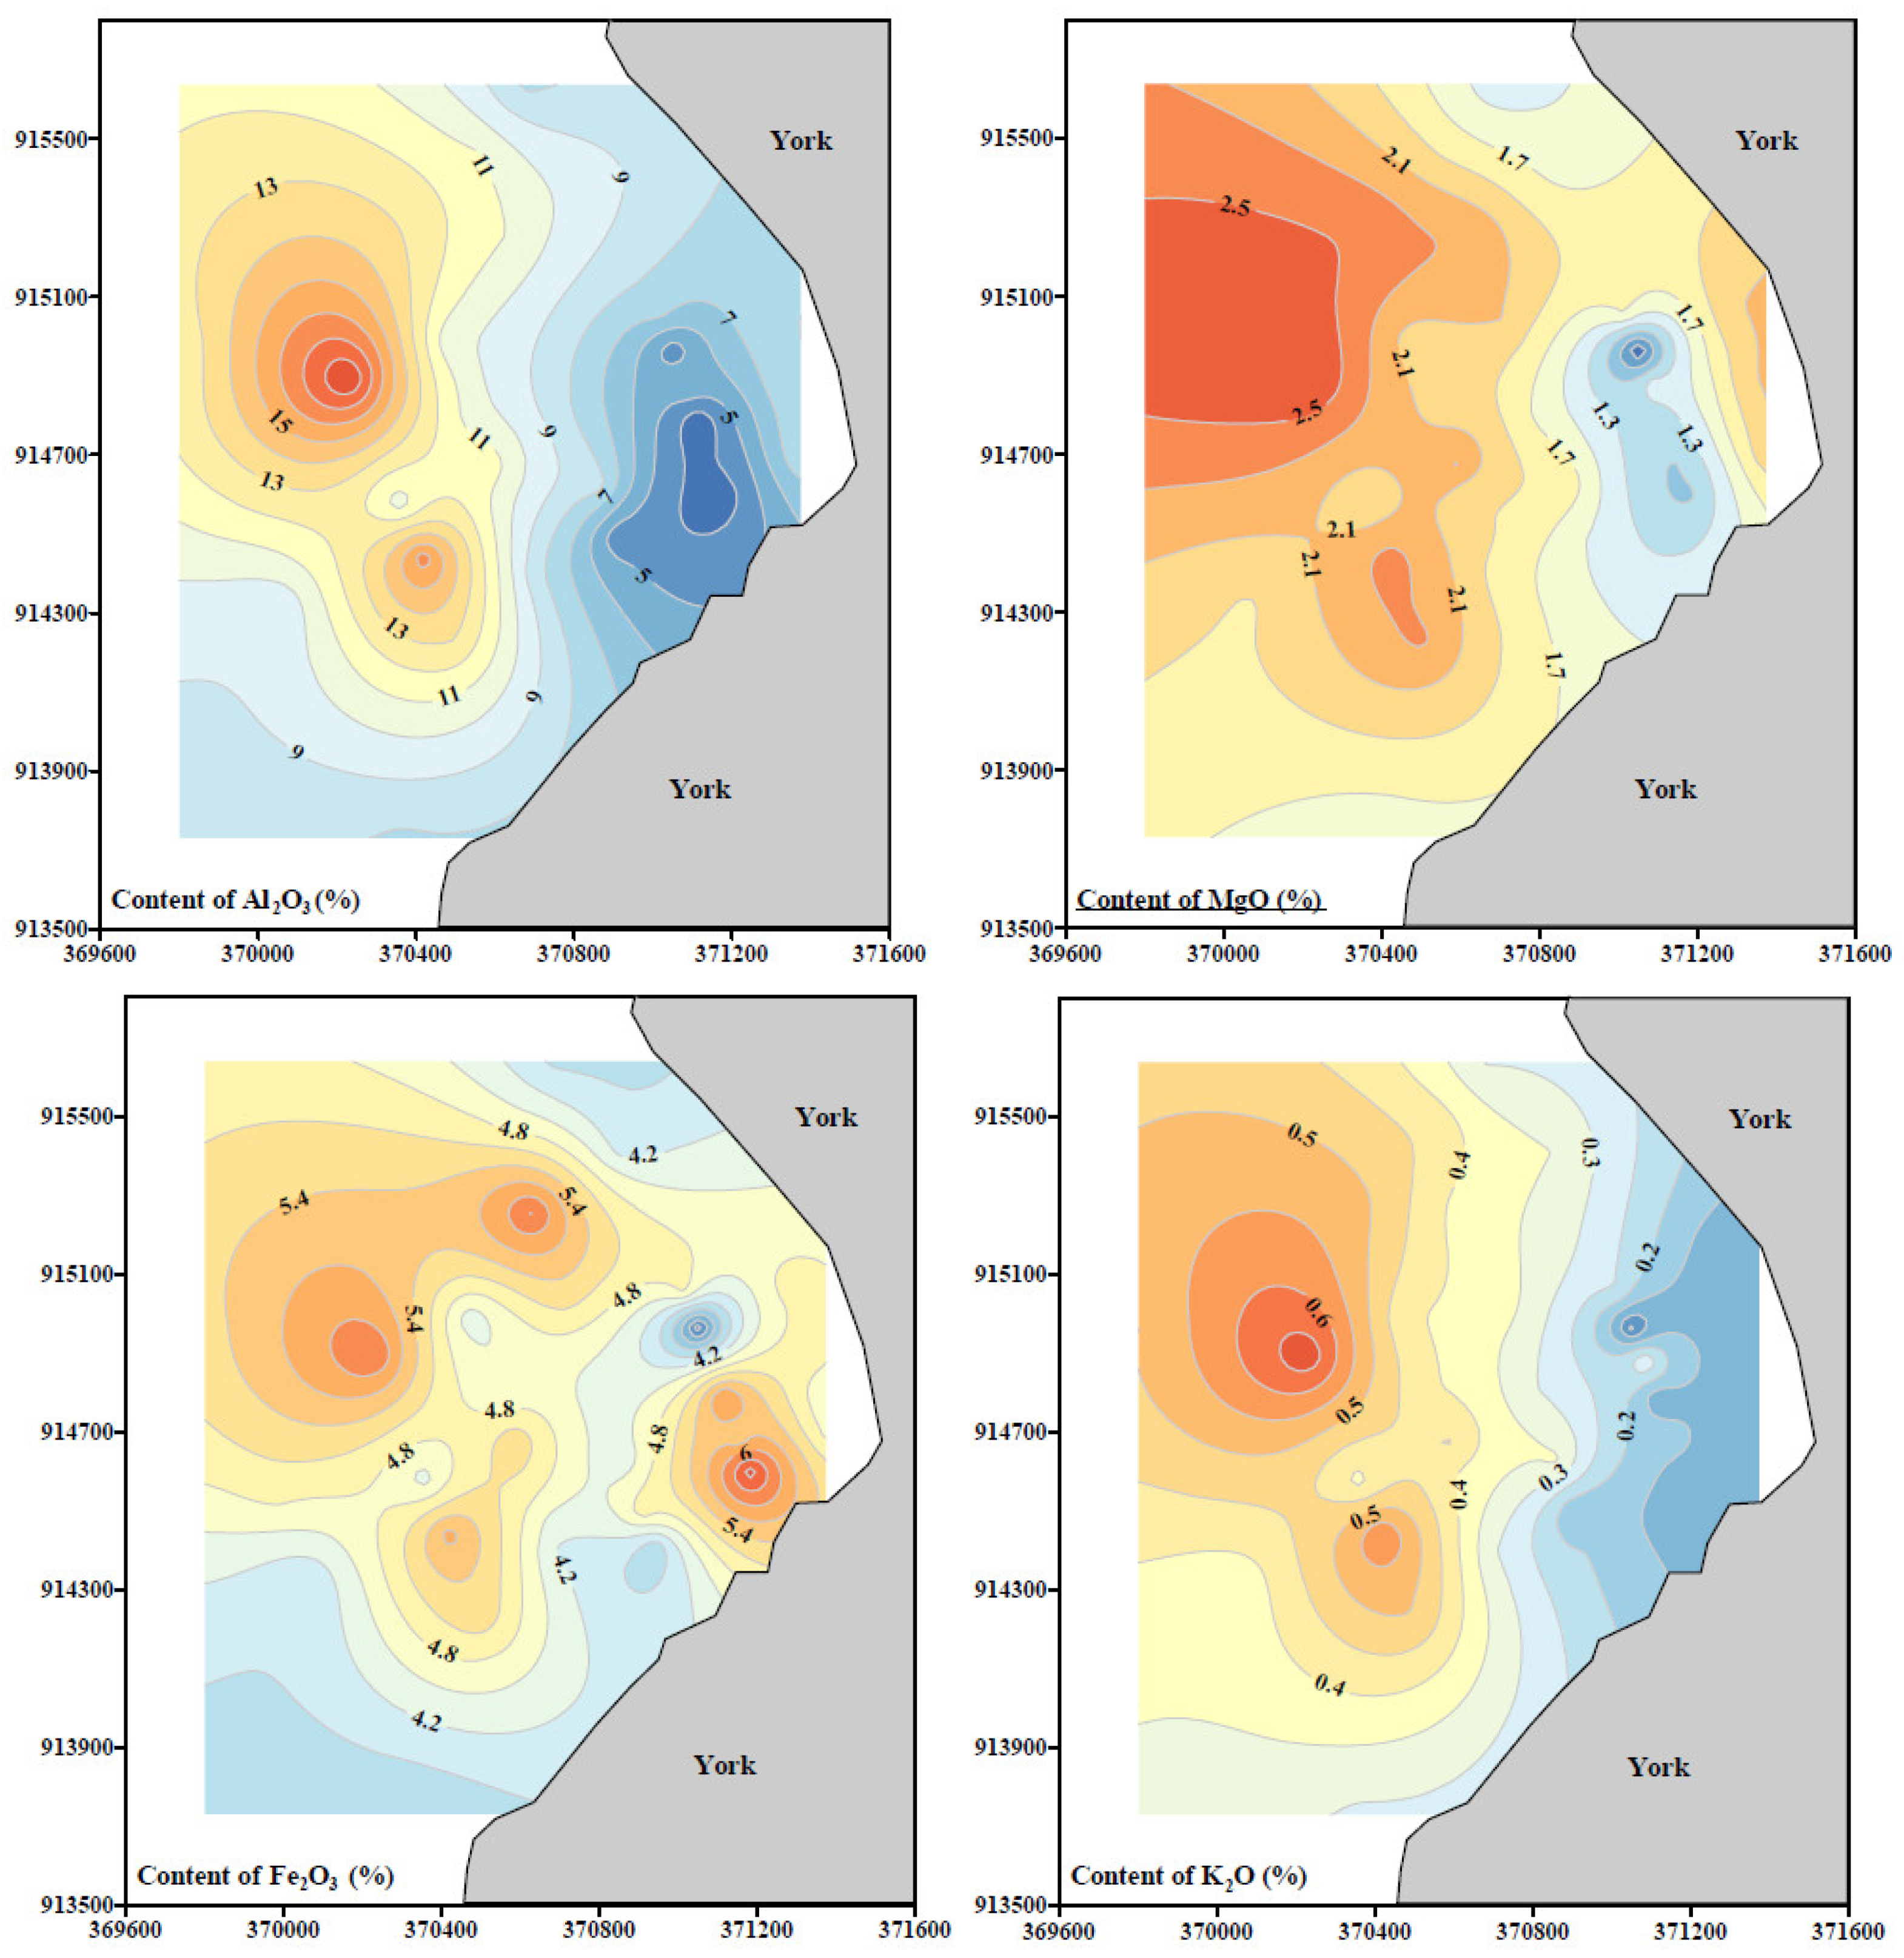
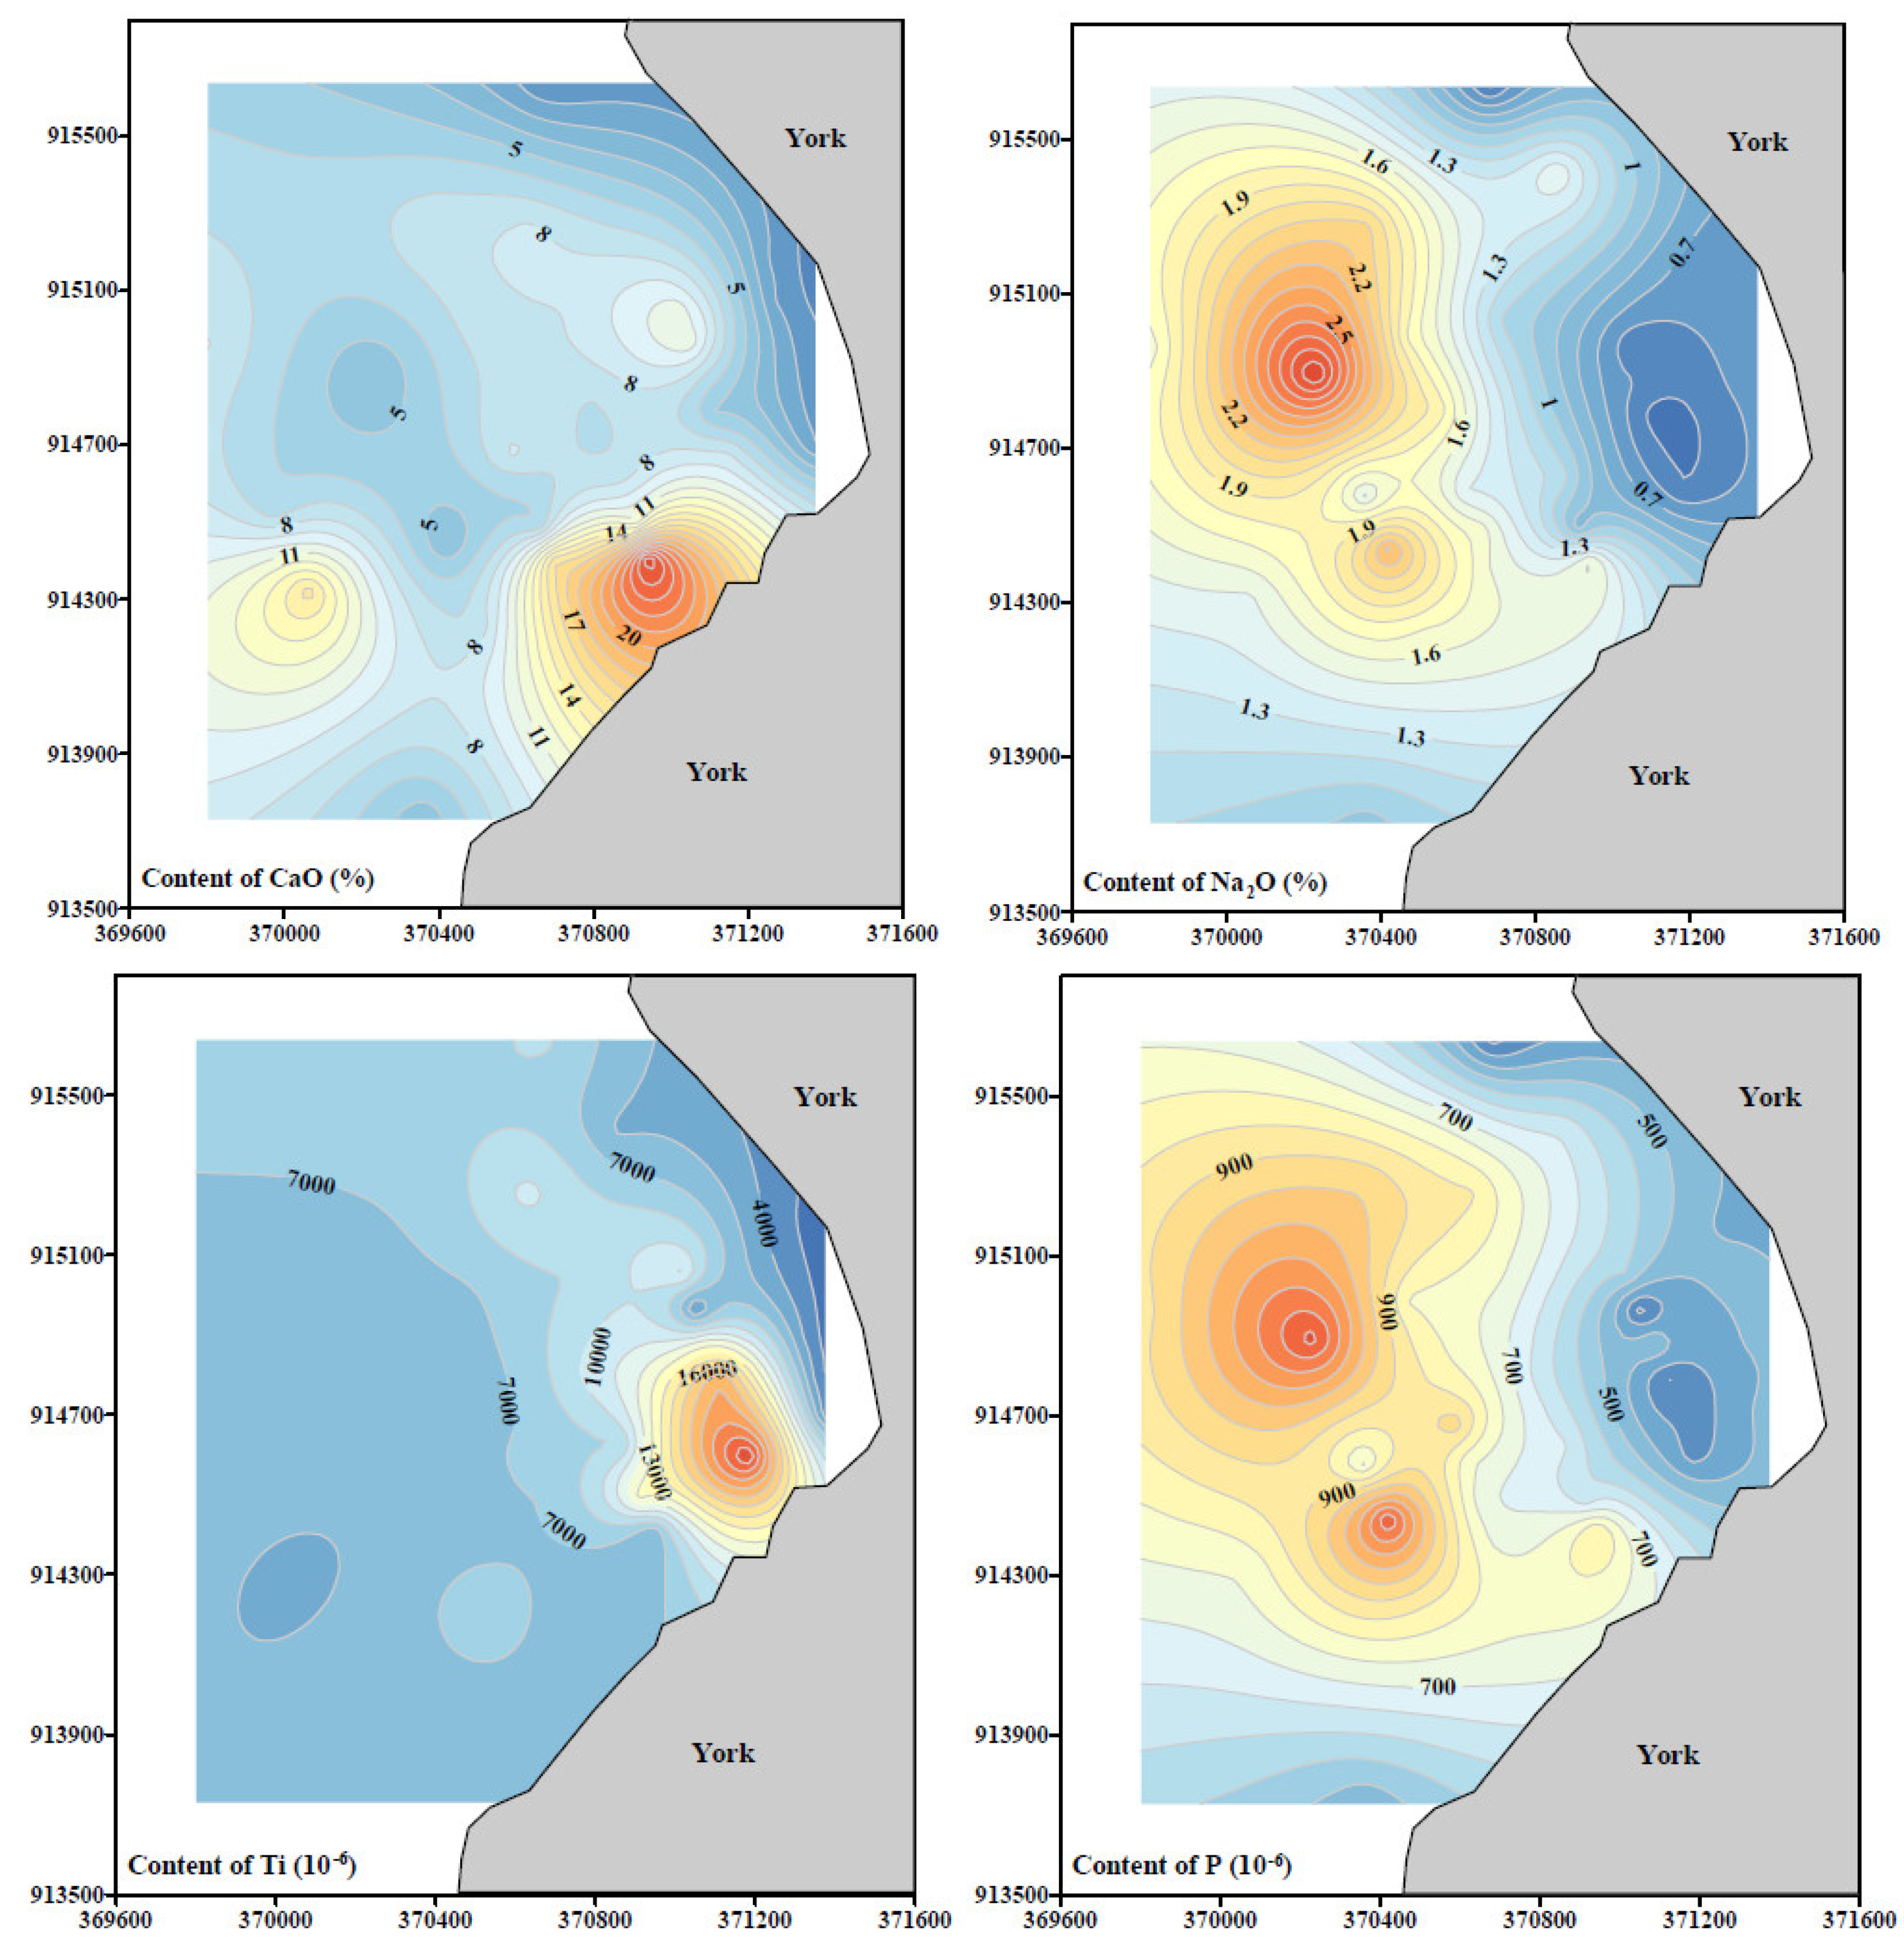
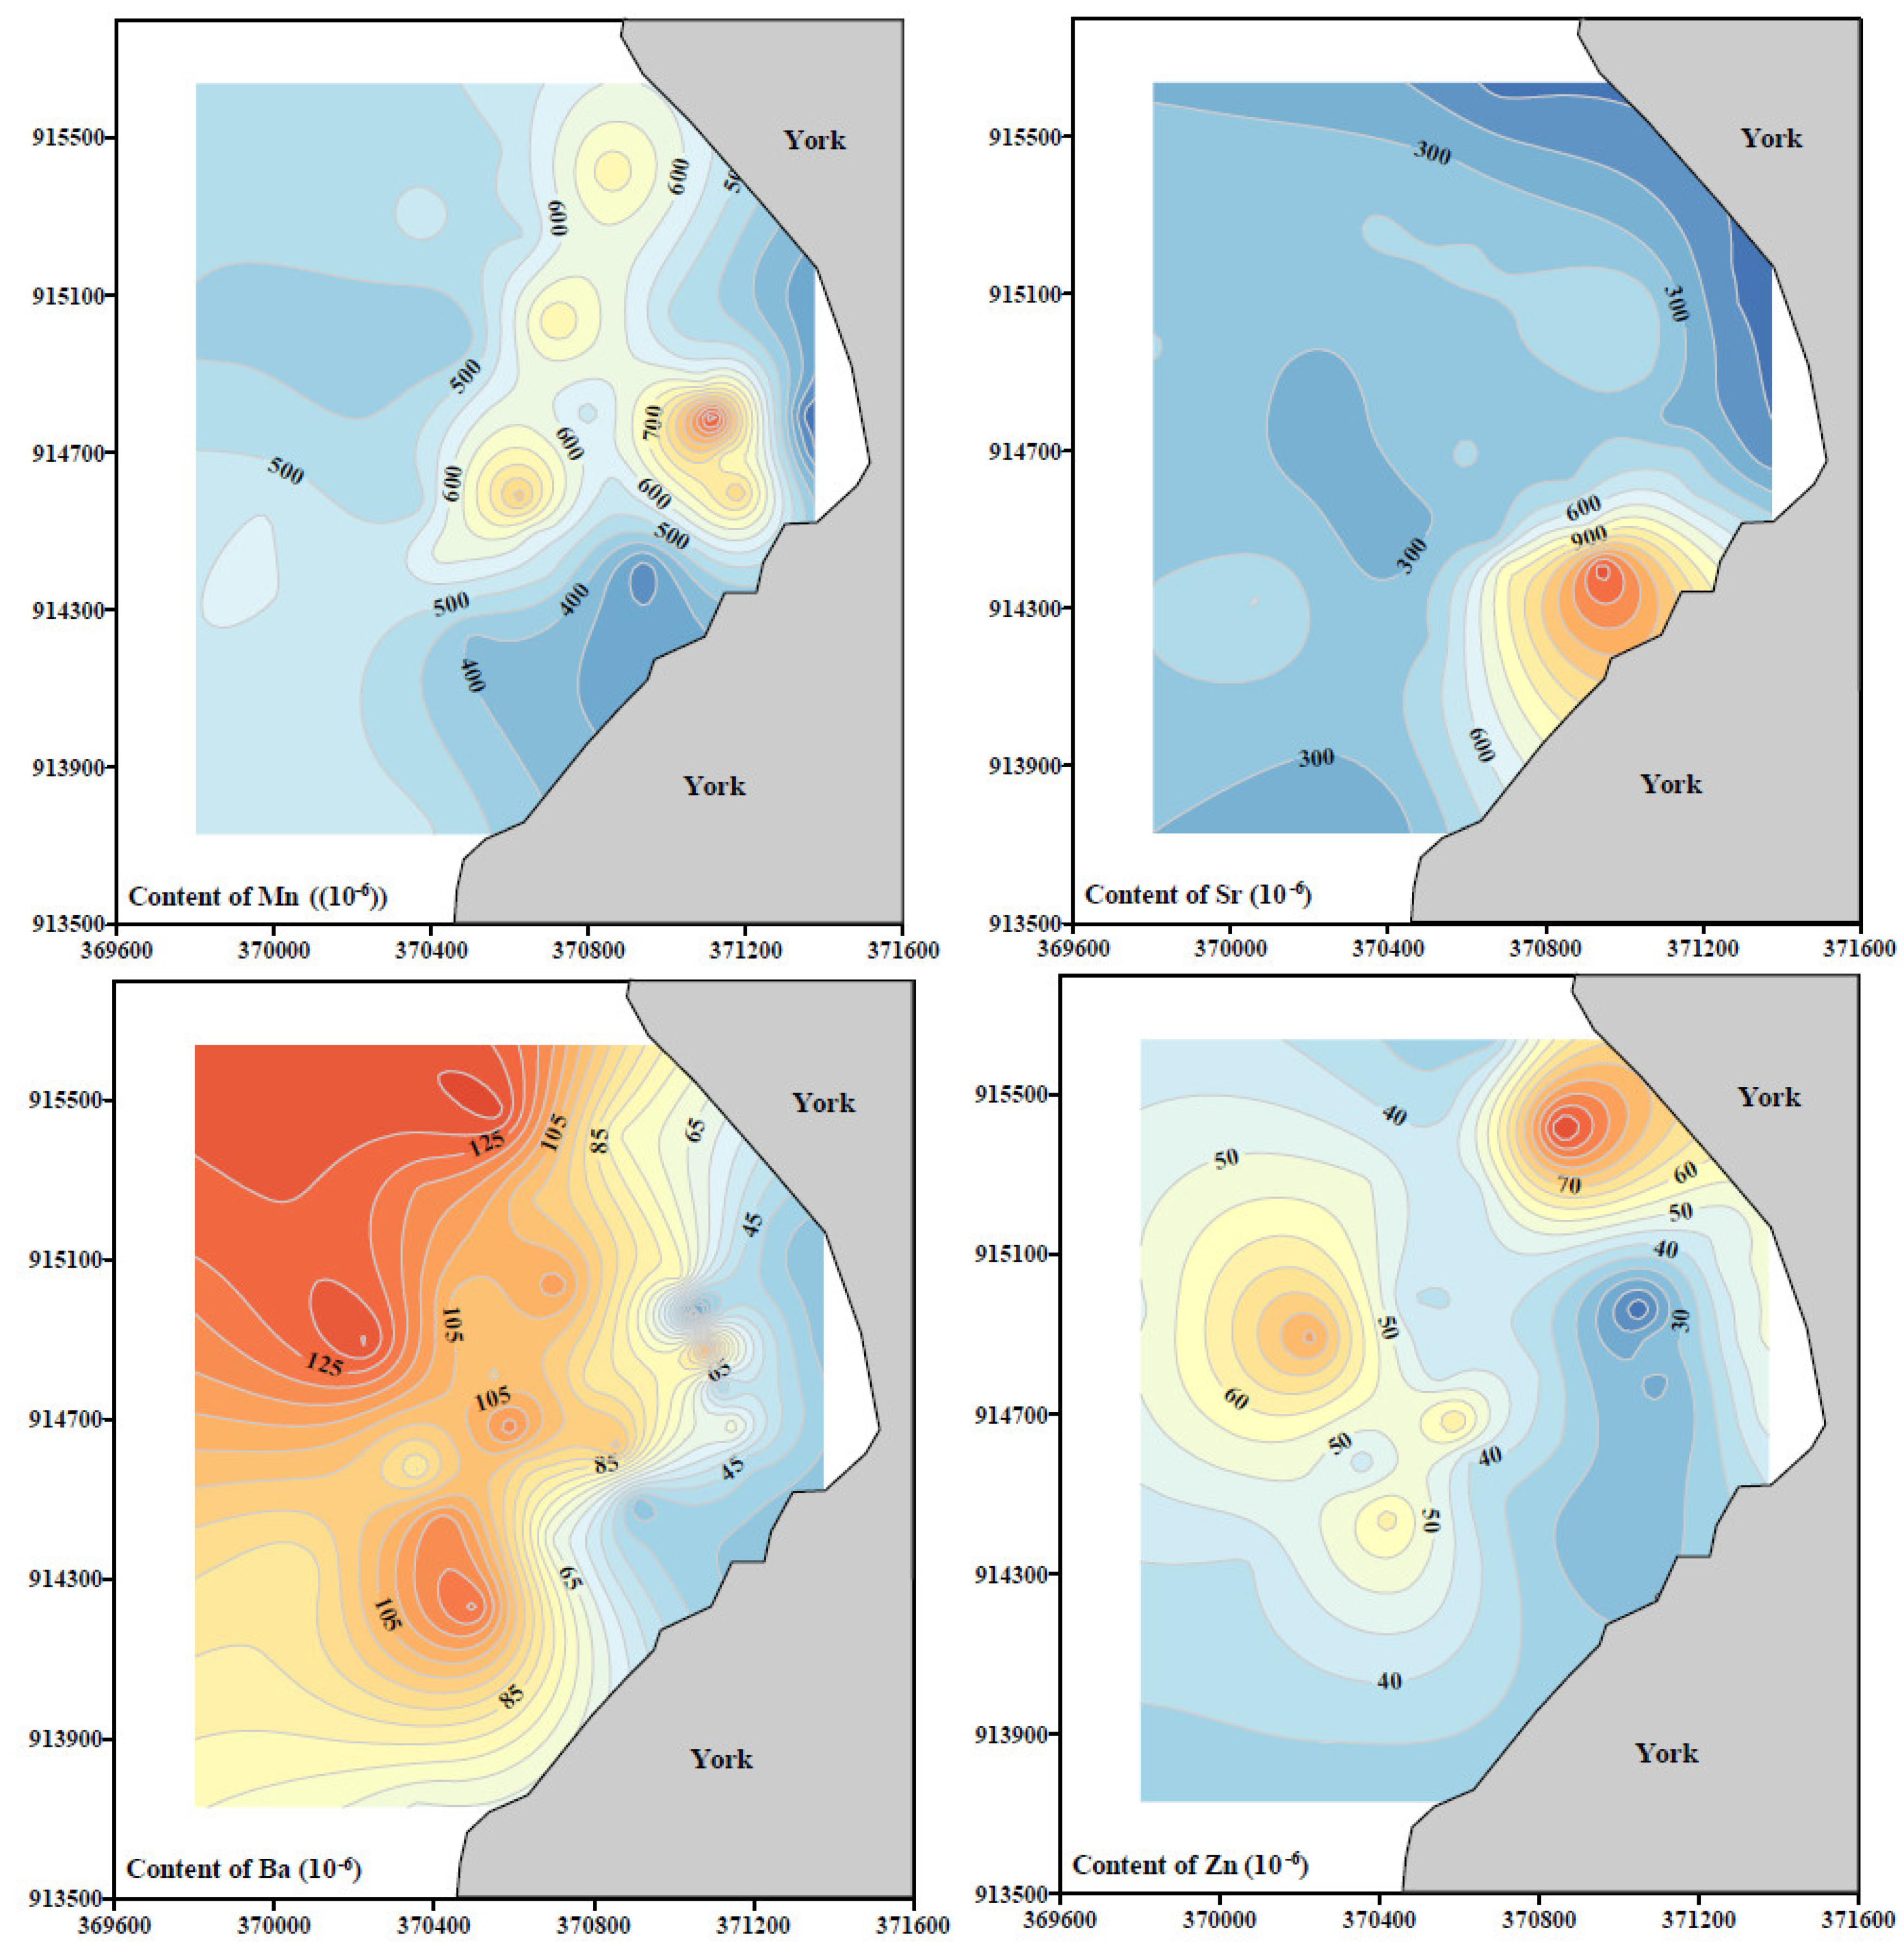
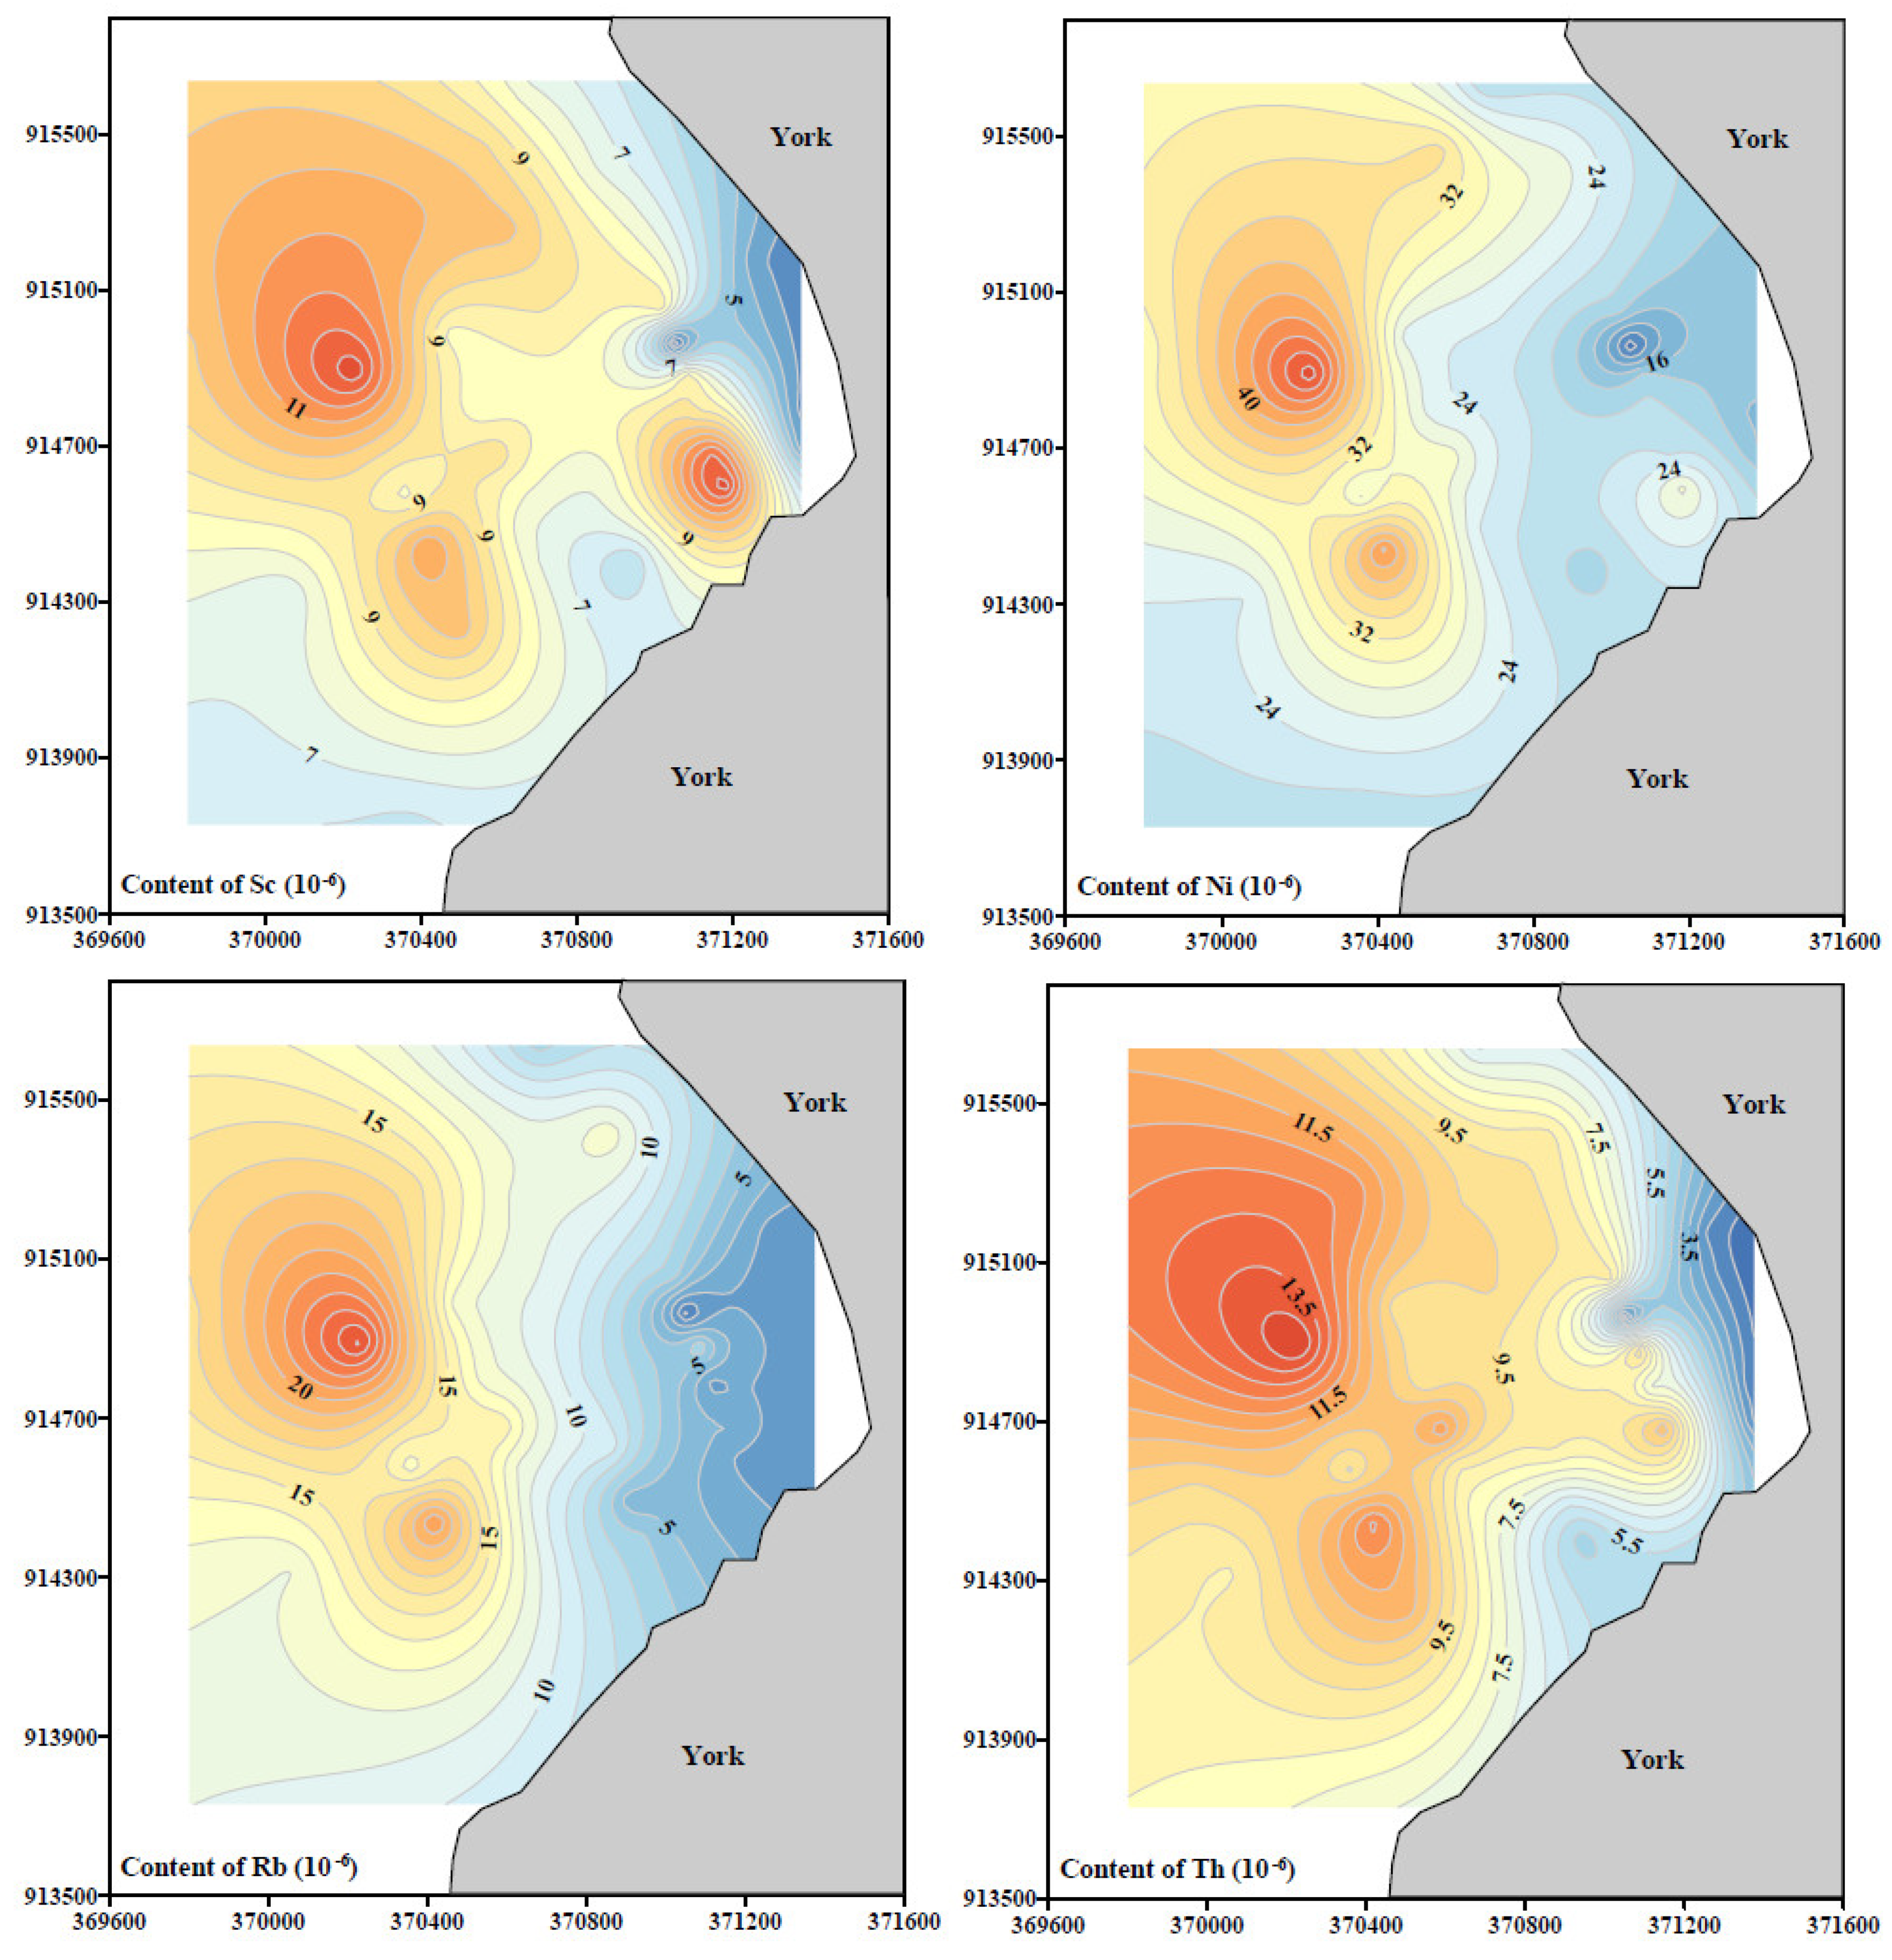
3.2. Major and Trace Element Contents

The statistics of the content of constant and trace elements in sediments are presented in Table 2. Unlike in China’s coastal areas, the content of Ca is the highest among the major elements, with an average of 5.1% (varying from 0.7% to 18.4%), except for silicon. The content of Al ranks only second, with an average of 4.8% (varying from 1.7% to 10.1%). Like the major elements, the trace element content of sediments in the research area is also significantly different from that in China’s coastal areas. The content of Sr in the sediments is the highest, with an average value of 378.2 μg/g (varying from 63.5 to 1566.1 μg/g), among all trace elements (except for Ti, P, Mn). The Ba content is the second highest, with an average of 81.2 μg/g (varying from 6.8 to 137.1 μg/g).
Figure 5 shows the distribution of major and trace elements of the sediments. Except for Ca, Ti, Sr, and Mn, the content of most elements shows a decreasing trend from the nearshore to offshore area. The contents of Ca are relatively stable except for a few stations. The distribution patterns of Ti and Sr are similar, with some stations showing high content and others showing little change. The Mn content in the sediment of the research area does not change significantly, and there is no obvious distribution pattern (Figure 5).

4. Discussion

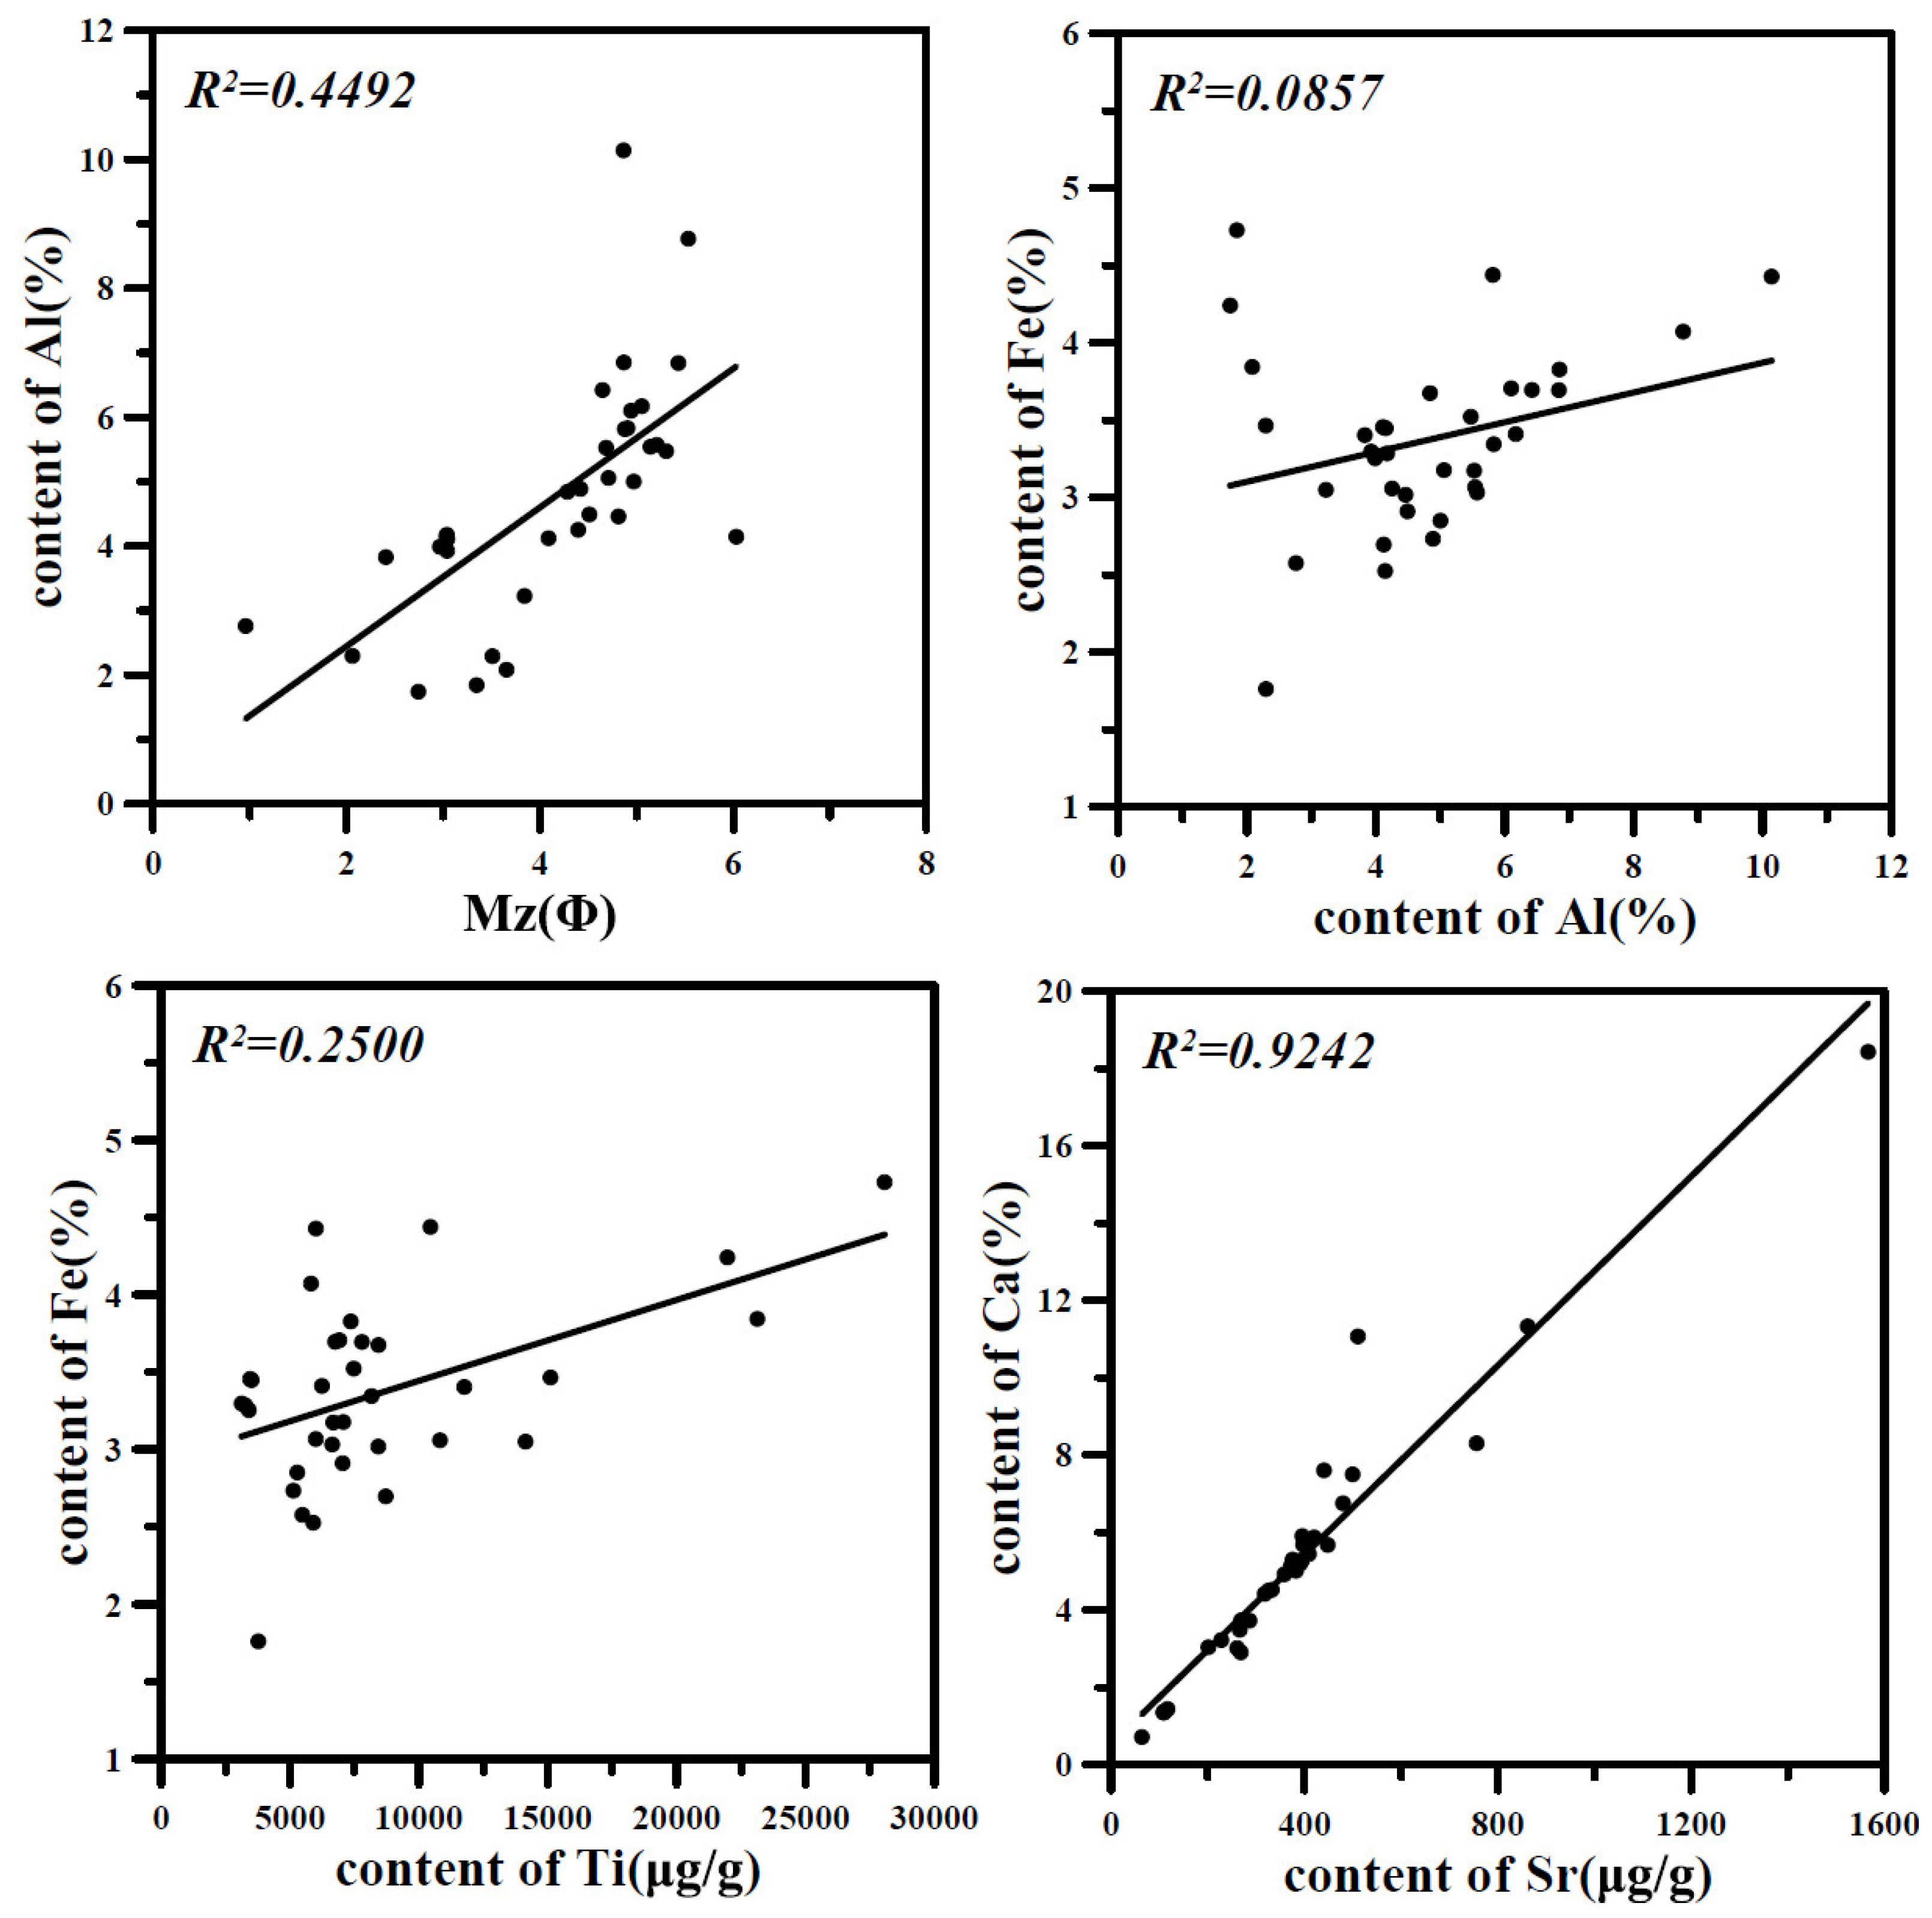
4.1. Correlation Analysis

We use software (SPSS 25.0) to analyze the correlation of element contents and grain size parameters of the sediment samples. Table 3 shows the correlation coefficients between all indicators. Mean grain size (Mz) is highly correlated with clay components (>8Φ) and silt components (4Φ~8Φ), with correlation coefficients (r) of 0.91 and 0.93, respectively, and is highly negatively correlated (r = −0.91) with sand components (−1Φ~4Φ). The correlation coefficient (r) between sediment element content and Mz varies greatly, from −0.3 to 0.77. The content of most elements (except Ca, Ti, and Sr) is positively correlated with Mz, which indicates that the elements are more enriched in fine particle components. Due to the large amount of SiO2 in the sand component, the content of other elements is relatively diluted.
The correlation between the elements of typical terrigenous weathering products (Al, Mg, K, Na, Rb, etc.) is high (r > 0.84), which indicates the terrigenous characteristics of sediments in the research area. The correlation between the content of Ca and terrestrial weathering products elements (Al, Mg, etc.) is very poor, while the correlation between Ca and Sr content is very high (r = 0.96), indicating that Ca and Sr have homologous characteristics, and are likely to be affected by marine biochemistry. Although Fe is also a typical terrigenous weathering product element, its content is not highly correlated with other terrigenous representative elements (Al, Mg, K, Na, Rb, etc.), indicating that terrigenous input is not the main source of Fe. Although there is a positive correlation between Fe and Mn, the correlation is not high (r = 0.33), indicating that Fe-Mn nodules have a limited impact on the content of Fe in sediments of the research area. Among all elements, only Fe has a relatively high correlation with Ti (r = 0.5), indicating that Fe may be affected by the input of ilmenite. In conclusion, Fe may be carried in by multiple sources. The correlation between Mn and all elements is not high, but the correlation between Mn and Ti is the largest, reaching 0.61. This indicates that the Mn content may be controlled by symbiosis with ilmenite. In conclusion, the materials in the research area may be the result of the joint action of terrigenous weathering products, ilmenite, and marine biochemistry. See Figure 6.

4.2. Factor Analysis and Provenance Discussion

To discuss the controlling factors, R-type factor analysis is conducted on the element contents in the samples by the statistical software (SPSS 25.0). Based on the method and covariance matrix, common factors (eigenvalues >1) are extracted. In this analysis, the Kaiser–Meyer–Olkin value and p-value of Bartlett’s spherical test are 0.60 (≥0.5) and 4.2 × 10−184 (<0.001), respectively. The values of these two statistical parameters indicate that the analysis method is appropriate and the statistical results have a high level of confidence [44]. We extract three common factors from the statistical data, accounting for 86.19% of the total variance (Table 4). Therefore, we believe that the contents of major and trace elements of sediment in the research area are mainly controlled by three factors.
Factor 1 accounts for 48.69% of the total variance, and we believe it is the determining factor for element content in the sediments. In Factor 1, most element contents have a high load. In particular, the load factor of typical terrestrial weathering product elements (Al, Na, K, Rb, etc.) reaches more than 0.9. Although Fe and Ti are also the main elements in terrigenous weathering products, the load factor of Fe in Factor 1 is only 0.30, and the load factor of Ti is negative (−0.38). The results show that Fe is not only affected by terrigenous weathering products, but also by other sources, and Ti is even diluted by terrigenous weathering products. To sum up, Factor 1 represents the input of terrigenous weathering products.
Factor 2 accounts for 23.14% of the total variance with high load factors of Fe, Ti, Mn, etc. The load factor of Ti in Factor 2 is even as high as 0.90, which is in sharp contrast to the load factor (−0.38) in Factor 1, indicating that Factor 2 may be related to the genesis of Ti-related ores. As we all know, Sierra Leone is a country rich in minerals, of which iron ore is its largest output [46]. However, the load factor of Fe in Factor 2 is not high enough compared with Ti, and the source of iron ore cannot represent Factor 2. Ilmenite often exists in iron ore in the form of accessory minerals, so the input of ilmenite may represent Factor 2. At the same time, Fe2+ and Mn2+ in ilmenite can be completely replaced by isomorphism, which also explains why the Mn element load in Factor 2 is as high as 0.72. In conclusion, Factor 2 can be interpreted as ore input dominated by ilmenite.
Factor 3 explains 14.36% of the total variance with high load factors of Ca and Sr. The load factors of Ca and Sr in Factor 3 are as high as 0.98 and 0.97, respectively, while the load factors of other elements are very low (<0.3), which indicates that Factor 3 may represent the input of marine biochemical substances. Sr and Ca belong to the second main group of elements, with similar chemical properties and frequent isomorphic substitution. After the death of marine organisms, the organic matter of the corpses is completely decomposed, and only the biological shells or bones rich in Ca and Sr are crushed under the physical action of marine dynamics (waves and currents). The deposition of these substances increases the contents of Ca and Sr in marine sediments. In conclusion, Factor 3 represents the input of marine biochemical substances.

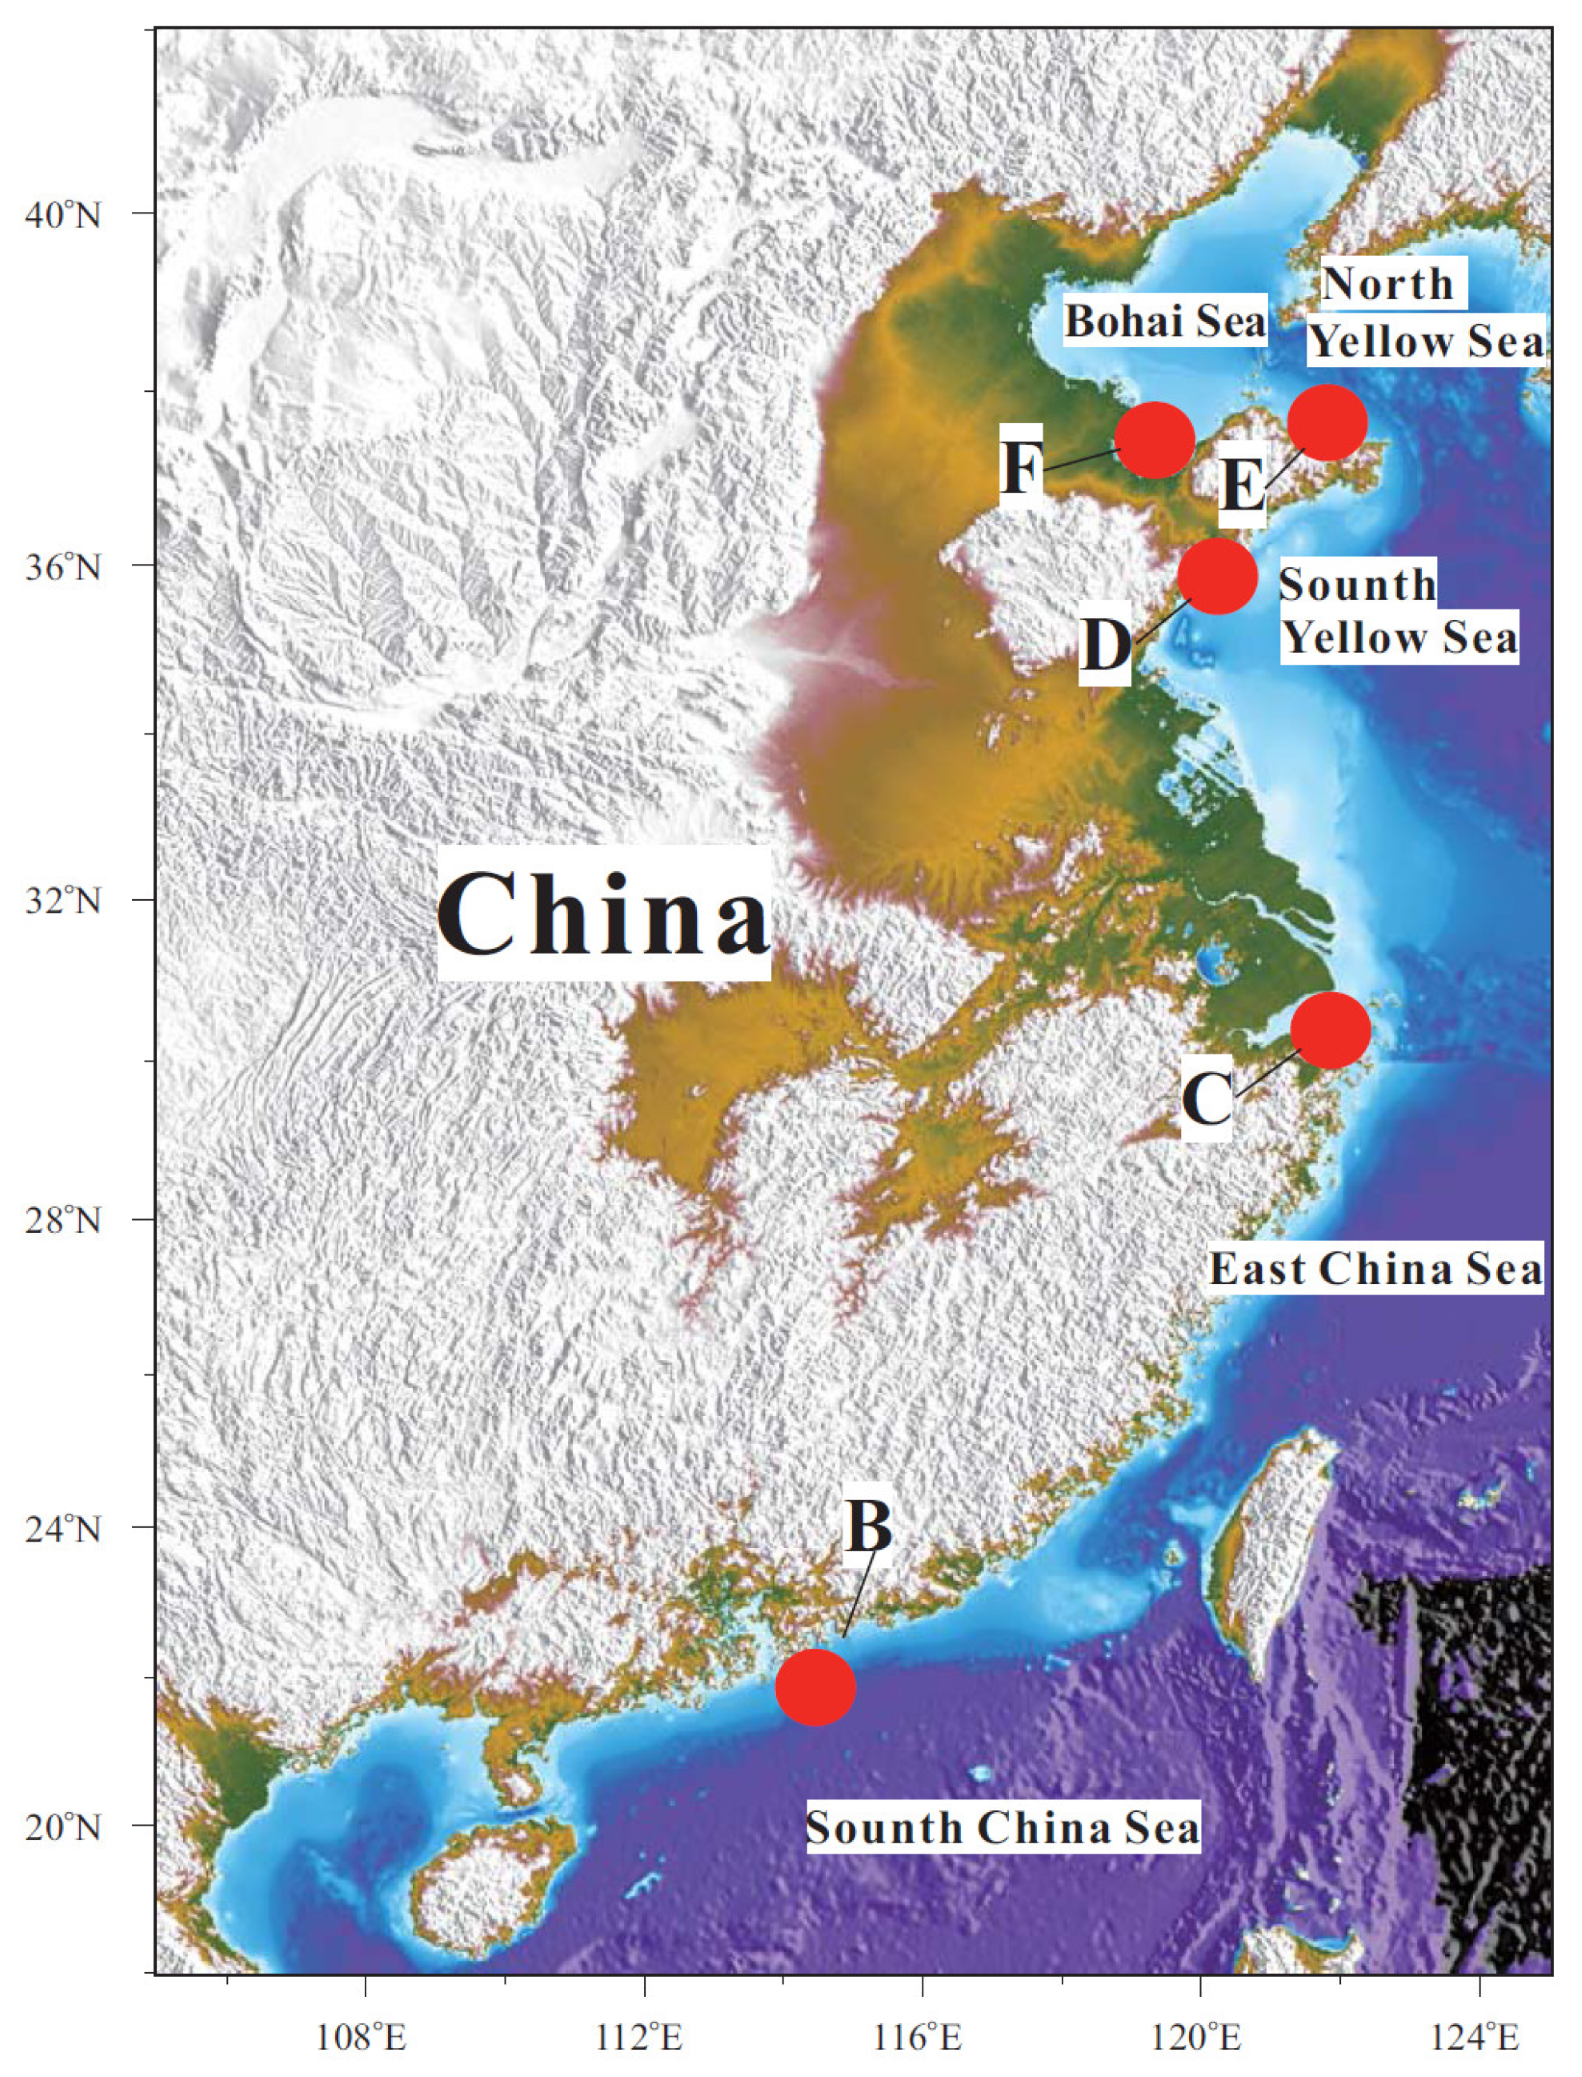
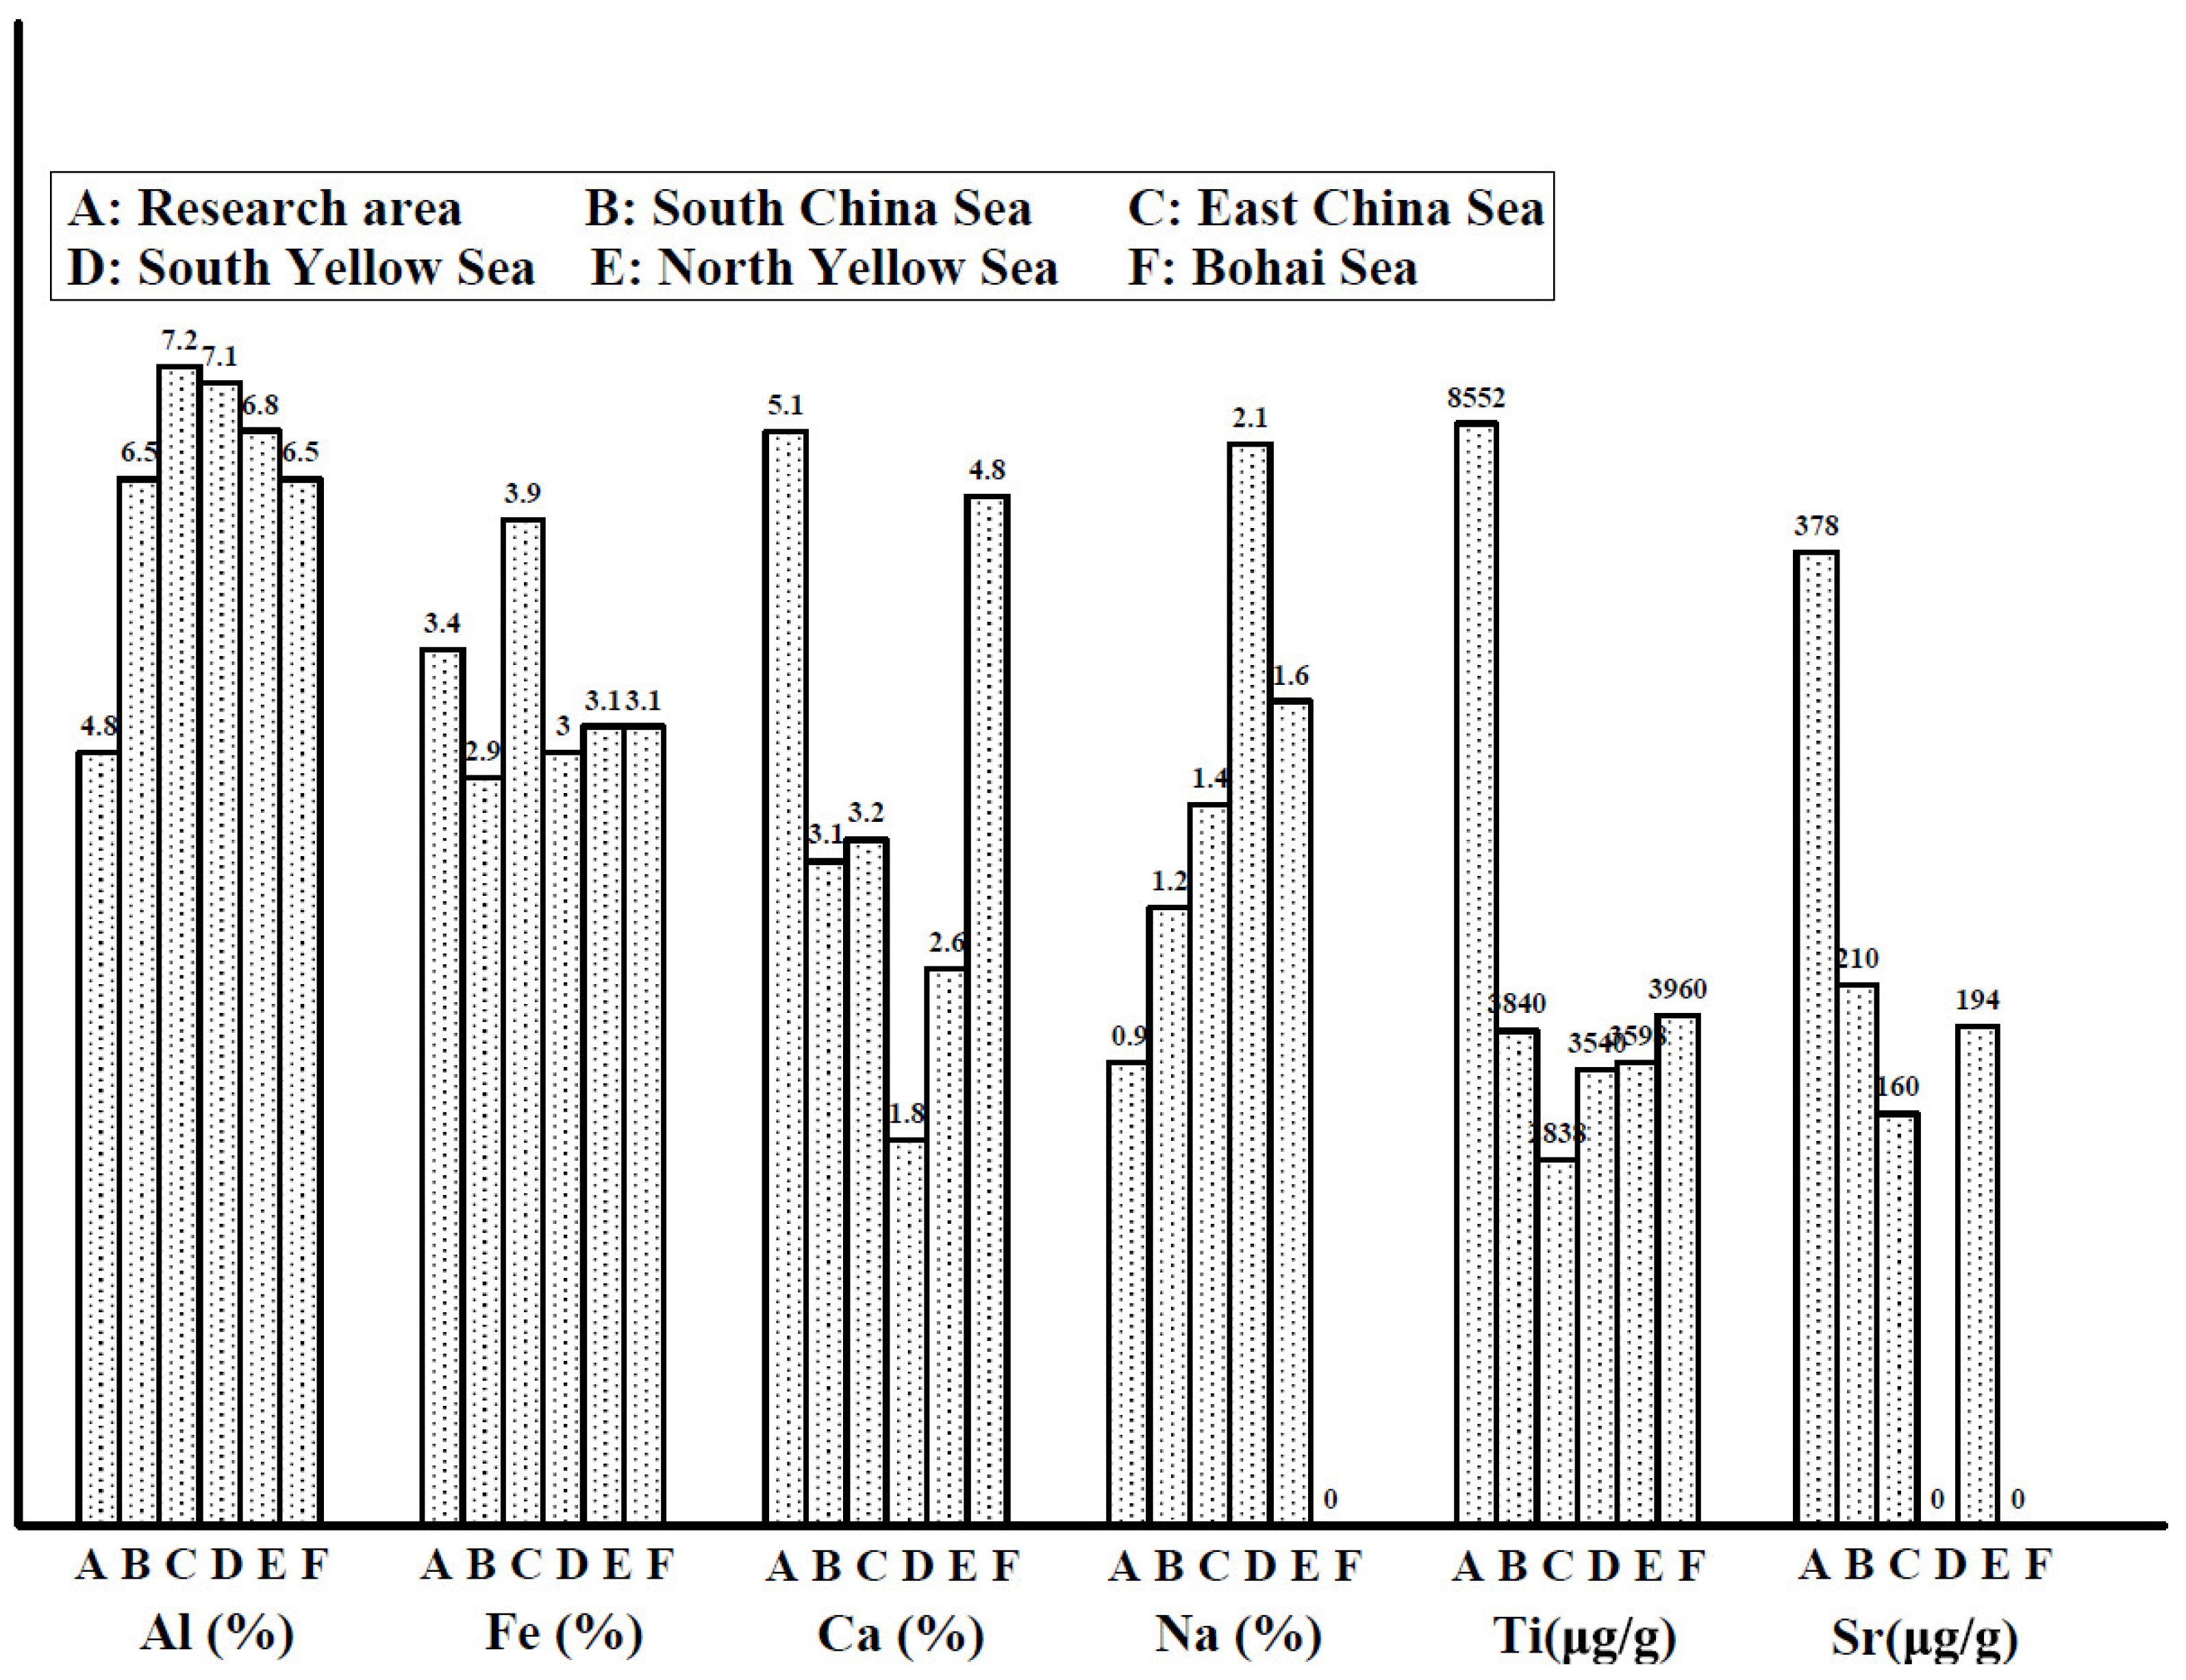
4.3. Comparison of Element Contents in Sediments from the Research Area and the Offshore Area of China

To better understand the elemental geochemical behavior of the sediments in the research area, we select the surface sediment elements of five typical areas in China offshore to compare with them. They are located in the South China Sea (taking the northern coastal waters of the South China Sea as an example) [41], the East China Sea (taking the coastal waters of Zhejiang Province as an example) [42], the Southern Yellow Sea (taking the Jiaozhou Bay as an example) [43], the Northern Yellow Sea (taking the Weihai Bay as an example) [44], and the Bohai Sea (taking the Laizhou Bay as an example) [45]. Through comparison, we find that the contents of Al, K, and Na in the study area are significantly lower than those in the coastal waters of China, but the contents of Fe, Ca, Ti, and Sr are significantly higher (Table 3, Figure 7). This feature corresponds to the analysis results of provenance in the research area. Compared with West Africa, China’s river system is developed, and the river sediment flux into the sea is larger [47]. The terrigenous materials carried by rivers into the sea make the content of terrigenous elements (Al, K, Na, etc.) in the sediments of offshore China relatively high. On the contrary, the continental shelf width of the research area is smaller, the water depth is larger, and the ecosystem is more developed compared with China [48]. In addition, the input of terrigenous sediments in the study area is relatively small, which also leads to the relative increase in marine biological materials. This phenomenon is embodied in the high content of Ca and Sr. At the same time, Sierra Leone’s rich ore resources (especially ilmenite, a bymineral of iron ore) also have a great impact on the supply of sediments. The content of Fe and Ti in the sediments of the research area is much higher than that in the sediments of offshore China. The element content of sediments in the research area is very different from that in the offshore of China, but its unique sediment source characteristics have great reference value for the elemental geochemistry of sediments in the offshore of China and even the whole world. See Figure 8.

5. Conclusions

To fill some gaps in the study of elemental chemistry, we chose less popular areas to carry out this supplementary research. Based on 35 surface sediments in the offshore area of Sierra Leone, we tested the grain size and major and trace elements, analyzed the content characteristics and controlling factors of the elements, discussed the material source of the sediments, and made a comparative study with the characteristics of the sediments in the offshore area of China. The results show that sandy silt is the main sediment type in the research area, and the average sediment mean grain size (Mz) is 4.15Φ. The content of Ca in the sediments is the highest, with an average of 5.1%. The content of Sr is the highest among the trace elements (except Ti, P, and Mn), with an average of 378.2 μg/g. There are three main sources of sediments in the research area, namely, terrigenous weathering products, ilmenite-dominated ore, and oceanic biochemical substances, based on factor analysis. The element content of sediments in the research area is very different from that in the offshore of China, but its unique sediment source characteristics have great reference value for the elemental geochemistry of sediments in the offshore of China and even the whole world.

Author Contributions

Conceptualization, M.H. and Y.Z.; methodology, M.H., Y.Z. and P.Z.; formal analysis, M.H.; investigation, B.Y. and R.J.; resources, Y.Z., B.Y. and R.J.; data curation, M.H. and C.H.; writing—original draft preparation, M.H.; writing—Review and Editing, Y.Z., W.C. and C.H.; visualization, M.H. and Y.Z.; supervision, B.Y.; project administration, M.H. and Y.Z.; funding acquisition, M.H. and Y.Z. All authors have read and agreed to the published version of the manuscript.

Funding

This research was funded by (1) China’s National Key R&D Program (No. 2022YFB3207400), (2) the basic scientific research business cost project of the Institute of Geophysical and Geochemical Exploration, Chinese Academy of Geological Sciences (No. AS2022J07), and (3) Research Funds for the Central Universities (No. TKS20230205).

Data Availability Statement

Data are contained within the article.

Acknowledgments

We thank Mingyang Liu and Bo Liu from Tianjin Research Institute for Water Transport Engineering, Ministry of Transport, for their assistance with paper writing.

Conflicts of Interest

Author Wenliang Chen was employed by the company Qingdao Boyan Marine Environmental Science & Technology Co., Ltd. The remaining authors declare that the research was conducted in the absence of any commercial or financial relationships that could be construed as a potential conflict of interest.

References

  1. Martin, J.; Zhang, J.; Shi, M.; Zhou, Q. Actual flux of the Huanghe (yellow river) sediments to the Western Pacific Ocean. Neth. J. Sea Res. 1993, 31, 243–254. [Google Scholar] [CrossRef]
  2. Yang, S.; Jung, H.; Lim, D.; Li, C. A review on the provenance discrimination of sediments in the Yellow Sea. Earth Sci. Rev. 2003, 63, 93–120. [Google Scholar] [CrossRef]
  3. Lim, D.; Kim, J.; Xu, Z.; Jung, H.; Yoo, D.; Choi, M.; Kim, S. Quantitative reconstruction of Holocene sediment source variations in the Yellow and northern East China Seas and their forcings. Mar. Geol. 2020, 430, 106345. [Google Scholar] [CrossRef]
  4. Li, T.; Rao, W.; Wang, S.; Mao, C. Identifying the clay-size sediment provenance of the radial sand ridges in the southwestern yellow sea using geochemical and Sr-Nd isotopic tracers. Mar. Geol. 2023, 455, 106957. [Google Scholar] [CrossRef]
  5. Xu, F.; Hu, B.; Dou, Y.; Liu, X.; Wan, S.; Xu, Z.; Tian, X.; Liu, Z.; Yin, X.; Li, A. Sediment provenance and paleoenvironmental changes in the northwestern shelf mud area of the South China Sea since the mid-Holocene. Cont. Shelf Res. 2017, 144, 21–30. [Google Scholar] [CrossRef]
  6. Zhu, X.; Shen, C.; Zhou, R.; Xu, J.; Zhao, J.; Wang, L.; Ge, X. Paleogene sediment provenance and paleogeographic reconstruction of the South Yellow Sea basin, East China: Constraints from detrital zircon U Pb geochronology and heavy mineral assemblages. Palaeogeogr. Palaeoecl. 2020, 553, 109776. [Google Scholar] [CrossRef]
  7. Li, M.; Zhu, S.; Ouyang, T.; Tang, J.; He, C. Magnetic fingerprints of surface sediment in the Bohai Sea, China. Mar. Geol. 2020, 427, 106226. [Google Scholar] [CrossRef]
  8. He, C.; Ouyang, T.; Li, M.; Zhu, S.; Yu, M.; Peng, S.; Zhu, Z.; Wang, Y.; Chen, H.; Tian, C. Nonnegligible contribution of terrigenous sediment inputs from local small watersheds to west regions of the Pearl River Estuary, northern South China Sea shelf. Mar. Geol. 2024, 475, 107369. [Google Scholar] [CrossRef]
  9. Li, M.; Zeng, Y.; Liu, S.; Tang, M.; Chen, L.; Chen, J.; Amorosi, A.; Ouyang, T. Provenance and sediment dispersal in Pearl River Estuary, southern China unraveled by magnetic properties. Mar. Geol. 2024, 478, 107431. [Google Scholar] [CrossRef]
  10. Yan, J.; Geng, J.; Su, F. Estimation of the ecosystem service value of the yellow river delta-Laizhou Bay coastal zone considering regional differences and social development. Environ. Manag. 2024, 74, 192–205. [Google Scholar] [CrossRef]
  11. Lin, C.; Bao, R.; Zhu, L.; Hu, R.; Ji, J.; Yu, S. Surface sediment erosion characteristics and influencing factors in the subaqueous delta of the abandoned yellow river estuary. Mar. Geol. 2024, 468, 107219. [Google Scholar] [CrossRef]
  12. Wang, F.; Zhang, W.; Nian, X.; Roberts, A.; Zhao, X.; Shang, Y.; Dong, Y. Magnetic evidence for yellow river sediment in the late Holocene deposit of the Yangtze River Delta, China. Mar. Geol. 2020, 427, 106274. [Google Scholar] [CrossRef]
  13. Saito, Y.; Yang, Z.; Hori, K. The Huanghe (Yellow River) and Changjiang (Yangtze River) deltas: A review on their characteristics, evolution and sediment discharge during the Holocene. Geomorphology 2001, 41, 219–231. [Google Scholar] [CrossRef]
  14. Wei, X.; Wu, C.; Ni, P.; Mo, W. Holocene delta evolution and sediment flux of the Pearl River, southern China. J. Quaternary Sci. 2016, 31, 484–494. [Google Scholar] [CrossRef]
  15. Weber, M.E.; Wiedicke, M.H.; Kudrass, H.R.; Hübscher, C.; Erlenkeuser, H. Active growth of the Bengal Fan during sea-level rise and highstand. Geology 1997, 25, 315–318. [Google Scholar] [CrossRef]
  16. Sun, X.; Liu, S.; Li, J.; Zhang, H.; Shi, X. Major and trace element compositions of surface sediments from the lower Bengal Fan: Implications for provenance discrimination and sedimentary environment. J. Asian Earth Sci. 2019, 184, 104000. [Google Scholar] [CrossRef]
  17. Yang, S.; Li, C.; Jung, H.; Lee, H. Discrimination of geochemical compositions between the Changjiang and the Huanghe sediments and its application for the identification of sediment source in the Jiangsu coastal plain. China Mar. Geol. 2002, 186, 229–241. [Google Scholar] [CrossRef]
  18. Liu, J.; Saito, Y.; Kong, X.; Wang, H.; Zhao, L. Geochemical characteristics of sediments as indicators of post-glacial environmental changes off the Shandong peninsula in the Yellow Sea. Cont. Shelf Res. 2009, 29, 846–855. [Google Scholar] [CrossRef]
  19. Zhu, Y.; Bao, R.; Zhu, L.; Jiang, S.; Chen, H.; Zhang, L.; Zhou, Y. Investigating the provenances and transport mechanisms of surface sediments in the offshore muddy area of Shandong Peninsula: Insights from REE analyses. J. Mar. Syst. 2022, 226, 103671. [Google Scholar] [CrossRef]
  20. Cheng, P. Sediment Characteristics and Transport Processes of Fine-Grained Material over the Northern Yellow Sea. Ph.D. Thesis, Institute of Oceanology, Qingdao, China, 2000. [Google Scholar]
  21. Lim, D.; Jung, H.; Choi, J. REE partitioning in riverine sediments around the Yellow Sea and its importance in shelf sediment provenance. Mar. Geol. 2014, 357, 12–24. [Google Scholar] [CrossRef]
  22. Lan, X.; Chen, X.; Mi, B.; Li, R.; Qin, Y.; Wang, Z. Distribution pattern and source of major and trace elements in the central North Yellow Sea since late Pleistocene. Mar. Geol. Quat. Geol. 2015, 35, 1–10. (In Chinese) [Google Scholar]
  23. Fang, H.; Huang, P.; Zhou, Y.; Zhang, J.; Li, A.; Yan, J. Distribution and controlling factors of the major elements in surface sediments of the North Yellow Sea. Mar. Sci. 2015, 39, 108–116. (In Chinese) [Google Scholar]
  24. Li, J.; Liu, S.; Feng, X.; Sun, X.; Shi, X. Major and trace element geochemistry of the mid-Bay of Bengal surface sediments: Implications for provenance. Acta Oceanol. Sin. 2017, 36, 82–90. [Google Scholar] [CrossRef]
  25. Yang, S.; Youn, J. Geochemical compositions and provenance discrimination of the central south Yellow Sea sediments. Mar. Geol. 2007, 243, 229–241. [Google Scholar] [CrossRef]
  26. Risgaard-Petersen, N.; Revil, A.; Meister, P.; Nielsen, L. Sulfur, iron-, and calcium cycling associated with natural electric currents running through marine sediment. Geochim. Cosmochim. Acta 2012, 92, 1–13. [Google Scholar] [CrossRef]
  27. Calvert, S.; Pedersen, T. Geochemistry of recent oxic and anoxic marine sediments: Implications for the geological record. Mar. Geol. 1993, 113, 67–88. [Google Scholar] [CrossRef]
  28. Dean, W.; Gardner, J.; Piter, D. Inorganic geochemical indicators of glacial-interglacial changes in productivity and anoxia on the California continental margin. Geochim. Cosmochim. Acta 1997, 61, 4507–4518. [Google Scholar] [CrossRef]
  29. Moskovchenko, D.; Soromotin, A.; Khoroshavin, V.; Prikhodko, N.; Kirillov, V.; Koveshnikov, M.; Krylova, E.; Krasnenko, A.; Pechkin, A. Climate change and the Ob River: A reassessment of major and trace element fluxes to the Arctic Ocean. Water 2024, 16, 2112. [Google Scholar] [CrossRef]
  30. Grosbois, C.; Desmet, M.; Zhang, M.; Gassama, N.; Battaglia, F. Trace element contamination in one of the Yangtze tributaries (Hunan, China)—Source review and potential release from sediments. Water 2021, 13, 271. [Google Scholar] [CrossRef]
  31. Bilinski, H. Geochemical fractionation and risk assessment of potentially toxic elements in sediments from Kupa River, Croatia. Water 2020, 12, 2024. [Google Scholar] [CrossRef]
  32. Cho, Y.; Lee, C.; Cho, M. Geochemistry of surface sediments off the southern and western coasts of Korea. Mar. Geol. 1999, 159, 111–129. [Google Scholar] [CrossRef]
  33. Lim, D.; Jung, H.; Choi, J.; Yang, S.; Ahn, K. Geochemical compositions of river and shelf sediments in the Yellow Sea: Grain-size normalization and sediment provenance. Cont. Shelf Res. 2006, 26, 15–24. [Google Scholar] [CrossRef]
  34. Rao, W.; Mao, C.; Wang, Y.; Su, J.; Balsam, W.; Ji, J. Geochemical constraints on the provenance of surface sediments of radial sand ridges off the Jiangsu coastal zone, east China. Mar. Geol. 2015, 359, 35–49. [Google Scholar] [CrossRef]
  35. Sundaray, S.; Nayak, B.; Lin, S.; Bhatta, D. Geochemical speciation and risk assessment of heavy metals in the river estuarine sediments—A case study: Mahanadi basin, India. J. Hazard. Mater. 2011, 186, 1837–1846. [Google Scholar] [CrossRef]
  36. Liu, Y.; Kuang, W.; Xu, J.; Chen, J.; Sun, X.; Lin, C.; Lin, H. Distribution, source and risk assessment of heavy metals in the seawater, sediments, and organisms of the Daya Bay, China. Mar. Pollut. Bull. 2022, 174, 113297. [Google Scholar] [CrossRef]
  37. Liu, T.; Zhu, L.; Bao, R.; Hu, R.; Jiang, S.; Zhu, Y.; Song, J. Hydrodynamically–driven distribution and remobilization of heavy metals in surface sediments around the coastal area of Shandong Peninsula, China. Sci. Total Environ. 2023, 857, 159286. [Google Scholar] [CrossRef]
  38. Lin, H.; Lan, W.; Feng, Q.; Zhu, X.; Zhao, B. Pollution and ecological risk assessment, and source identification of heavy metals in sediment from the Beibu Gulf, South China Sea. Mar. Pollut. Bull. 2021, 168, 112403. [Google Scholar] [CrossRef]
  39. McManus, J.; Berelson, W.; Klinkhammer, G.; Johnson, K.; Rushdi, A. Geochemistry of barium in marine sediments: Implications for its use as a paleoproxy. Geochim. Cosmochim. Acta 1999, 62, 3453–3473. [Google Scholar] [CrossRef]
  40. Folk, R.; Ward, A. Brazos River bar: A study in the significance of grain size parameters. J. Sediment. Res. 1957, 27, 3–26. [Google Scholar] [CrossRef]
  41. Zhao, J. Elements Geochemistry Spatial Multiscale Variability of Surface Sediments and Its Mechanism in Northwest of the South China Sea. Ph.D. Thesis, China University of Geosciences, Wuhan, China, 2016. [Google Scholar]
  42. Dou, Y. Characteristics of Sediment Granularity, Element Geochemistry and Their Significance for Identifying Sedimentary Environment in the Contiguous Sea Areas of Changjiang River Estuary. Master’s Thesis, First Institute of Oceanography SOA, Qingdao, China, 2007. [Google Scholar]
  43. Wang, Q.; Wang, J.; Dong, J.; Zou, L.; Wang, R.; Xie, Y.; Xu, M.; Xie, X.; Zhou, X. Geochemical characteristics and controlling factors of surface sediments in Jiaozhou Bay. Mar. Geol. Front. 2023, 39, 8–19. (In Chinese) [Google Scholar]
  44. Zhu, Y.; Feng, X.; Zhu, L.; Zhong, W. Origin and geochemistry of surface sediments in the mud deposit area off shore the Shandong Peninsula, China. J. Oceanol. Limnol. 2021, 39, 483–499. [Google Scholar] [CrossRef]
  45. Lei, Z.; Liu, R.; Hu, R.; Qiu, J.; Zhu, L.; Zhu, F.; Zhang, X. Controlling factors and distribution of geochemical characteristics of the surface sediments in the Yellow River Delta. Mar. Geol. Quat. Geol. 2022, 42, 104–118. (In Chinese) [Google Scholar]
  46. Jiang, J.; Hu, P.; Zhang, H.; Chen, X.; Wang, J.; Xiang, W. The iron ore resource feature and metallogenic regularity in western Africa. Geol. Bull. China 2023, 42, 1276–1290. [Google Scholar]
  47. Li, Y.; Yan, H.; Rong, Y.; Lin, J.; Xue, W. The distribution characteristics of mercury species in the estuaries of the ten main rivers in China and flux of mercury from rivers to the ocean. Acta Sci. Circumst. 2022, 42, 323–331. (In Chinese) [Google Scholar]
  48. Zhang, Z. Evaluation of Sustainable Utilization of Fishery Resources in the Coast of West Africa and Its Development Countermeasures. Ph.D. Thesis, Shanghai Ocean University, Shanghai, China, 2024. [Google Scholar]
Figure 1. Location map of research area (a) and sampling sites (b). The coordinate system of (b) is CGCS2000, and the central longitude is 12° W.
Water 16 03540 g001
Figure 2. Grain size classification and sediment type distribution. (N11 (gravelly muddy sand) and N14 (gravelly sand) stations are not shown in the left figure).
Water 16 03540 g002
Figure 3. Content distribution of particle size component.
Water 16 03540 g003
Figure 4. Distribution of particle size parameter.
Water 16 03540 g004
Figure 5. Distribution of major and trace elements of sediments in research area.
Water 16 03540 g005aWater 16 03540 g005bWater 16 03540 g005cWater 16 03540 g005d
Figure 6. Correlations of content of Al, Fe, Ti, Ca, Sr, and Mz.
Water 16 03540 g006
Figure 7. Selected locations in China offshore area.
Water 16 03540 g007
Figure 8. Comparison of element contents in sediments of different regions (“0” means no data).
Water 16 03540 g008
Table 1. Particle size parameters and fraction content of sediments (n = 35).
Content of Fractions (%)Particle Size Parameters
ClaySiltSandMz(φ)δSkKu
Max9.7977.6699.476.032.741.913.34
Min0.000.5312.600.960.57−1.370.72
Ave4.6641.5753.314.151.750.802.32
STD3.5522.5025.101.130.600.960.72
C. V. (%)76.0854.1447.0827.3033.99120.3631.29
Note: “Ave” means “average”, “STD” means “standard deviation”, and “C. V.” means “coefficient of variation”.
Table 2. The major and trace element content in sediments of research area and the offshore area of China.
ElementsResearch AreaChina Sea
MaxMinAveSTDC.V.(%)South China SeaEast China SeaSouth Yellow SeaNorth Yellow SeaBohai Sea
Al *10.11.74.81.838.36.57.27.16.86.5
Mg *1.60.31.10.325.11.11.51.11.41.4
Fe *4.71.83.40.617.82.93.93.03.13.1
K *0.600.30.149.21.72.22.32.12.1
Ca *18.40.75.13.4663.13.21.82.64.8
Na *2.20.30.90.5501.21.42.11.60.0
Ti28,064.33124.58551.85714.166.83840.02838.03540.03598.03960.0
P1221.8330670.9229.334.2480.3279.4523.9586.0393.0
Mn1159.2227.2541.1187.634.7542.3565.5774.6637.0**
Sr1566.163.5378.2266.970.6209.7159.9**194.4**
Ba137.16.881.235.944.2**426.9**457.0**
Li105.78.947.120.643.8****39.338.4**
Zn101.910.142.516.639.171.186.3**80.6**
Sc12.938.12.530.4******11.7**
Co17.93.48.12.733.6**14.912.013.2**
Rb25.40.79.65.860.1******113.2**
Th14.61.98.33.340**********
Note: The unit for elements with “*” is “wt.%” and that of the others is “μg/g”. The data of the South China Sea are from [41], the data of the East China Sea are from [42], the data of the South Yellow Sea are from [43], the data of the North Yellow Sea are from [44], and the data of the Bohai Sea are from [45]. “**” means no data.
Table 3. Correlation coefficients between some indicators of samples (n = 35).
MzClaySiltSandAlMgFeKCaNaTiPMnSrBaLiZnScCoRbTh
Mz1.00
Clay0.911.00
Silt0.930.911.00
Sand−0.91−0.93−0.991.00
Al0.670.680.59−0.601.00
Mg0.500.480.38−0.390.841.00
Fe0.170.070.13−0.100.290.411.00
K0.770.810.80−0.820.910.710.281.00
Ca−0.30−0.02−0.05−0.02−0.23−0.24−0.22−0.031.00
Na0.570.730.61−0.660.860.680.210.880.181.00
Ti−0.14−0.210.000.03−0.48−0.490.50−0.230.13−0.351.00
P0.530.680.58−0.630.860.740.310.880.220.95−0.321.00
Mn0.190.180.28−0.25−0.18−0.320.330.05−0.03−0.100.61−0.101.00
Sr−0.34−0.04−0.080.00−0.23−0.21−0.16−0.040.960.190.160.24−0.081.00
Ba0.720.660.77−0.760.740.570.270.91−0.110.63−0.070.660.13−0.131.00
Li0.680.740.61−0.640.960.840.290.90−0.100.91−0.450.90−0.14−0.100.661.00
Zn0.430.430.29−0.300.670.630.280.53−0.350.55−0.380.52−0.05−0.320.370.691.00
Sc0.460.440.59−0.570.410.240.700.630.080.470.580.500.450.100.670.410.191.00
Co0.070.000.18−0.15−0.11−0.160.750.090.05−0.040.900.010.540.100.20−0.10−0.090.811.00
Rb0.750.820.77−0.800.910.690.280.980.000.93−0.260.910.05−0.010.810.940.590.610.071.00
Th0.680.690.80−0.800.620.420.460.860.090.680.250.700.370.070.840.640.340.890.490.831.00
Table 4. Results of factor analysis (n = 35).
ElementsFactor 1Factor 2Factor 3ElementsFactor 1Factor 2Factor 3
Al0.95−0.09−0.22Sr0.000.000.97
Mg0.82−0.17−0.28Ba0.790.29−0.07
Fe0.300.71−0.27Li0.97−0.08−0.11
K0.960.150.00Zn0.64−0.09−0.42
Ca−0.01−0.010.98Sc0.520.830.11
Na0.94−0.040.20Co−0.020.960.07
Ti−0.380.900.15Rb0.970.120.03
P0.950.000.23Th0.750.570.12
Mn−0.110.72−0.04
Variance/%48.6923.1414.36Variance/%48.6923.1414.36
Disclaimer/Publisher’s Note: The statements, opinions and data contained in all publications are solely those of the individual author(s) and contributor(s) and not of MDPI and/or the editor(s). MDPI and/or the editor(s) disclaim responsibility for any injury to people or property resulting from any ideas, methods, instructions or products referred to in the content.

