Article

Effects of Underwater Lighting Time on the Growth of Vallisneria spinulosa Yan and Its Water Restoration Process

1
College of Life and Environmental Science, Wenzhou University, Wenzhou 325000, China
2
National and Local Joint Engineering Research Center of Ecological Treatment Technology for Urban Water Pollution, Wenzhou University, Wenzhou 325000, China
3
Institute for Eco-Environmental Research of Sanyang Wetland, Wenzhou University, Wenzhou 325014, China
4
Jinhua Municipal Sanitation Service Center, Jinhua 321000, China
5
Wenzhou Municipal Motor Vehicle Exhaust Pollution Prevention and Control Management Center, Wenzhou 325000, China
*
Authors to whom correspondence should be addressed.
These authors contributed equally to this work.
Water 2024, 16(24), 3697; https://doi.org/10.3390/w16243697 (registering DOI)
Submission received: 11 November 2024 / Revised: 6 December 2024 / Accepted: 18 December 2024 / Published: 21 December 2024
(This article belongs to the Special Issue Ecological Wastewater Treatment and Resource Utilization)

Abstract

:
Submerged macrophytes play a crucial role in the ecological restoration of water bodies, and their restoration capacity is closely related to the underwater lighting conditions. This study explored the effects of underwater lighting time on the growth characteristics of Vallisneria spinulosa Yan (V. spinulosa) and its water restoration process. V. spinulosa achieved a higher Fv/Fm (0.64), ETRmax (10.43), chlorophyll content (0.85 mg/g), and removal efficiency of total phosphorus (0.37 × 10⁻³ g m−3 d−1) and a lower algal abundance with a longer lighting time (18 h every day). However, a higher removal efficiency of NH4+–N and TN was obtained with a shorter lighting time (6–12 h every day). The lighting time showed a significance influence on the microbial community of the V. spinulosa growth system, and the influence was significantly different in different regions. Temperature and electrical conductivity were the main environmental impact factors for the microbial community under different lighting times. The abundances of Proteobacteria, Bacteroidota, and Verrucomicrobia exhibited a great positive correlation with each other and a strong positive correlation with the two factors. In addition, the lighting time had a strongly significant correlation with the physical and chemical characteristics of the water environment (p < 0.001) and a significant correlation with the growth characteristics of V. spinulosa (p < 0.05).

1. Introduction

Water restoration is widely used in many aspects of processes aimed at removing selected forms of water pollution [1]. Submerged macrophytes play a vital role in maintaining the ecological environment of shallow lakes. In studies of shallow lakes, the advantages of submerged plants over phytoplankton have been extensively discussed [2]. In the aquatic ecosystem of shallow lakes, the turbidity of the water affects the structure and function of the lake ecosystem [3]. It comes from both biotic (e.g., phytoplankton) and abiotic (e.g., sediment) factors [4]. It also greatly regulates the quantity and quality of photo−submerged plants in aquatic ecosystems. They can improve water quality by absorbing nutrients in water [5,6] and can stabilize the sediment to avoid resuspension [7,8]. In addition, they provide food and shelter for aquatic organisms and reduce phytoplankton biomass through allelopathy [9,10,11]. However, lake eutrophication has caused the loss of submerged macrophytes and even their disappearance from water bodies [12,13]. The corresponding decline mechanism is still unclear, resulting in the difficult recovery of submerged macrophytes [13].
In aquatic ecosystems, the surface of submerged macroplants releases a large source of available carbon, making them a hotspot for interactions with polytrophic microbial communities [14,15]. The growth and reproduction of submerged macrophytes are affected by abiotic and biotic factors such as light, nutrients, temperature, water depth, and phytoplankton growth [16]. Among them, the light condition is a key factor [17,18,19]. The decline in underwater light availability limits the growth of submerged macrophytes [20,21]. Light absorption by submerged macrophytes can promote their acquisition of inorganic carbon, photosynthesis, and growth. At the same time, the polytrophic microbial communities formed by submerged plants can construct complex microbial food webs through trophic cascades, which promote the degradation and mineralization of carbon, nitrogen, and phosphorus [22]. The oxygen evolution is also regulated to accommodate anoxic sediment through oxygen secretion by the roots [23,24]. However, microbial communities can affect the stress resistance to turbidity by influencing the primary producers in the aquatic ecosystem, resulting in a reduction in the stress resistance of submerged plants [25]. Therefore, exploring the response of submerged macrophytes to underwater light conditions is crucial for the ecological restoration of aquatic ecosystems.
In general, plants can regulate photosynthesis and respiration from strong to weak light, achieving a lower light compensation point under weak light [26,27]. When plants are stressed by strong light, the occurrence of photoinhibition is due to the fact that the photoremediation of photosystem (PS) II lags behind the damage to the reaction center proteins [28]. Photoinhibition of submerged macrophytes includes the photosynthetic response, as well as growth and reproduction. Zefferman found that the biomass, relative growth rate (RGR), and length of Elodea nuttallii were inhibited under full light conditions [29]. Similarly, under shallow water (>50% full light) conditions, the mass, RGR, and height of V. natans and Myriophyllum spicatum were significantly negatively affected. The root mass and root length of M. spicatum were significantly inhibited by strong light [30]. However, the leaf growth of V. natans was greatly damaged by strong light. In low light environments, submerged macrophytes usually develop more biomass to increase plant height for capturing more light. Nonetheless, submerged macrophytes (such as V. natans) develop a higher leaf mass and branch height [31] and show a relatively low metabolic rate of C/N and a high C pool [32]. Under 2.8% ambient light intensity, V. natans can still grow normally and expand population size. However, due to the decrease in the photosynthetic intensity and light energy utilization rate, the contents of SC, starch, and TC decrease [33]. In summary, light availability is crucial for the growth, reproduction, and metabolism of submerged macrophytes, which is a key factor affecting their morphology and biomass allocation pattern.
V. spinulosa, as a common kind of submerged macrophyte in freshwater lakes, is the dominant species in many shallow lakes due to its fast growth and reproduction [34]. It is often selected as a pioneer species for lake restoration. It grows slowly in the spring, followed by rapid reproduction in the summer, and usually reaches a maximum biomass in September. In addition, V. spinulosa has a strong adaptability to low light conditions and can be colonized in oligotrophic and eutrophic freshwater bodies [32,35]. Although the effect of light intensity on the growth of submerged macrophytes has been widely recognized, the comprehensive effect of light duration on the growth of underwater large plants needs to be discussed in more detail. To understand this research gap, it is necessary to consider the effects of different light duration ratios on the growth, reproduction, and physiological metabolism of submerged macrophytes. Therefore, in this study, V. spinulosa was used as the research object, and a 49-day outdoor ecological experiment was carried out along the direction of an increasing light ratio gradient (without additional light 0:24, low 6:18, medium 12:12, and high 18:6; four light duration ratios). The purposes of this study are (1) to study the effects of different underwater light duration ratios on the physiological and biochemical characteristics of V. spinulosa and the water purification effect of the system and to screen out the most suitable underwater auxiliary light duration ratio for the growth of V. spinulosa; (2) to evaluate whether the increase in the light ratio of the underwater auxiliary light source can promote the normal growth of V. spinulosa, thereby accelerating the process of water restoration; and (3) on the basis of the physiological metabolism, to discuss the response of V. spinulosa to underwater light and to analyze the differential distribution of the microbial community structure and functional microorganisms of V. spinulosa under four light ratios. This study is of great significance for lake restoration engineers and decision makers to evaluate underwater light conditions and use simplified indicators to determine the potential suitable areas for underwater large−scale plant restoration.

2. Materials and Methods

2.1. Experimental Materials

In the experiment, V. spinulosa with similar growth status was selected as the research object, and healthy, complete, and uniform size (no progeny ramets) plants were selected and washed for use. The growth substrate of V. spinulosa was taken from the planting soil of the Ecological Botanical Garden of Wenzhou University. After drying, the large gravel and impurities such as animals and plants were removed by sieve mesh and mixed well for later use. The experimental water was simulated lake water, which was prepared by adding ammonium chloride (Sinopharm Chemical Reagent Co., Ltd., Shanghai, China), potassium nitrate (Sinopharm Chemical Reagent Co., Ltd., Shanghai, China), potassium dihydrogen phosphate (Sinopharm Chemical Reagent Co., Ltd., Shanghai, China), sodium acetate (Sinopharm Chemical Reagent Co., Ltd., Shanghai, China), and other reagents to tap water after dechlorination treatment. The water quality was total nitrogen 2 mg/L, total phosphorus 0.2 mg/L, and COD 40 mg/L, and the purity of all the chemicals used was AR. The LED light source used in the experiment is a 4000K LED light band with a power of 12 W/m (Zhongshan Jiuzhu Illumination Electric Appliance Co., Ltd., Zhongshan, China).

2.2. Experimental Design

This experiment was carried out in the natural environment of the Ecological Botanical Garden on the campus of Wenzhou University (120.69 E, 27.92 N) in Zhejiang Province. The simulated V. spinulosa growth system used in this study was a cuboid device made of polyethylene plastic (L × W × H = 40 cm × 20 cm × 80 cm) with a 10 cm thick soil matrix and a water depth of 60 cm. The planting density of V. spinulosa in each device was 18 strains/m2, the hydraulic retention time was set to 7 days, and the total duration of the experiment was 42 days. In this experiment, the light duration ratio of the underwater auxiliary light source was set as a variable. The light source with a length of 3 m was fixed along the inner wall of the device at a distance of 10 cm from the surface of the sediment. Four treatment groups with light duration ratios of 0:24, 6:18, 12:12, and 18:6 were set up. Each treatment group was set up with 3 replicates, for a total of 12 processing units (Table 1). The water quality (water temperature, dissolved oxygen, pH, conductivity, TN, TP, PO43−–P, NO3–N, and NH4+–N) and the physiological and growth indexes (chlorophyll concentration, Fv/Fm, ETRmax, plant height, root length, and biomass) of each device were measured every 7 days. At the end of the experiment, the microorganisms on the leaf surface, water body, and sediment of V. spinulosa were collected for community composition analysis.

2.3. Monitoring Method

2.3.1. Water Sample Test

The dissolved oxygen (DO), water temperature (WT), pH, and electricl conductivity (EC) of the influent and effluent were measured on-site using a YSI ProQuatro, (HACH, Loveland, CO, USA). The water samples in and out of each device were collected in a 0.5 L sampling bottle. Basic potassium persulfate digestion ultraviolet spectrophotometry [36], ammonium molybdate spectrophotometry [37], nitrate nitrogen determination ultraviolet spectrophotometry [38], Nessler’s reagent spectrophotometry [39], and hash rapid digestion spectrophotometry were used to measure TN, TP, PO43−–P, NO3–N, and NH4+−N, respectively.

2.3.2. Physiological and Growth Characteristics of V. spinulosa

The primary light energy conversion efficiency (Fv/Fm) and ETRmax of PSII in the leaves of V. spinulosa were measured by a chlorophyll fluorescence imaging system (Image–Pam, WALZ, Bayern, Germany) every 7 days. In the initial stage of the experiment, 36 strains of V. spinulosa were selected, and the plant height, root length, and leaf width were accurately measured by vernier calipers. At the end of the experiment, the soil was gently removed from the device, and the soil on the surface was cleaned. Each treatment device selected 30 strains of V. spinulosa to measure the plant height, root length, and leaf width. The V. spinulosa of each treatment device was dried at 80 °C until it was very heavy, and the biomass was calculated.

2.3.3. CLSM Determination

Plant leaves were collected and cut into small pieces of 5 mm × 5 mm and then placed in a 24−well microplate containing 2.5% glutaraldehyde (0.1 M PBS, pH = 7.2) phosphate buffer for 24 h. After washing 3–5 times with 0.1 M PBS solution (pH = 7.2) (Shanghai Macklin Biochemical Technology Co., Ltd., Shanghai, China), the DNA, extracellular polysaccharides, and proteins were labeled with the fluorescent dyes DAPI, Con A−Texas red conjugate solution (Invitrogen, San Diego, CA, USA), and FITC (Shanghai Macklin Biochemical Technology Co., Ltd., Shanghai, China), respectively. The cells were stained with 10 μg/mL DAPI (Meryer Technologies Co., Ltd., Shanghai, China) solution for 45 min, washed with 0.1 M PBS solution (pH = 7.2) for 3–5 times, and further stained with 10 μg/mL Con A−Texas red solution for 30 min. After washing with 0.1 M PBS solution (pH = 7.2) for 3–5 times, the cells were further stained with 10 μg/mL FITC solution for 30 min. The stained leaves were then visualized under a laser confocal microscope (ZEISS LSM 800, CarlZeiss, Oberkochen, Germany) after the washing process. ZEN 2 (ZEISS, Oberkochen, Germany) software was used to process the generated images.

2.3.4. Microbial Sequencing

  • DNA Extraction and PCR Amplification
The total DNA from the microbial community was extracted according to the instructions of the E.Z.N.A.® soil DNA kit (Omega Bio−tek, Norcross, GA, USA). The quality of the DNA extraction was detected by 1% agarose gel electrophoresis, and the concentration and purity of DNA were determined by a NanoDrop 2000. The V3–V4 variable region of the 16S rRNA gene was amplified by PCR using 338F (5′–ACTCCTACGGGAGGCAGCAG–3′) and 806R (5′–GGACTACHVGGGTWTCTAAT–3′). Each sample had 3 replicates.
2.
Illumina Miseq sequencing
The PCR products of the same sample were mixed and recovered by 2% agarose gel. The recovered products were purified by the AxyPrep DNA Gel Extraction Kit (Axygen Biosciences, Union City, CA, USA), detected by 2% agarose gel electrophoresis, and quantified by a Quantus TM Fluorometer (Promega, Madison, WI, USA). The library was constructed using the NEXTflexTM Rapid DNA–Seq Kit (Bioo Scientific, Austin, TX, USA). Sequencing was performed using Illumina’s Miseq PE300/NovaSeq PE250 platform (Shanghai Meiji Biomedical Technology Co., Ltd., Shanghai, China). The original data were uploaded to the NCBI SRA database.

2.4. Data Analysis

SPSS24.0 software was used for statistical analysis of the data, and one−way ANOVA was used to test the significance of the difference between different light duration groups. The differences between two groups were tested by multiple comparisons. The α diversity index (Sobs, Ace, Chao, Shannon, Simpson, Coverage) was calculated using the vegan package (https://www.r−project.org/) in R4.0.0. Principal coordinate analysis (PCoA) was performed on microbial community differences using R [40].
The linear discriminant analysis (LDA) effect size pipeline (LEfSe) program was used to study the significant discriminant groups under different light duration ratios. In the LEfSe analysis, OTUs with LDA values > 2.0 were considered to be significantly distinguished taxa. The RDA function of the vegan package in R4.3.0 was used to explain the possible relationship between the microbial community composition and environmental factor variables.

3. Results and Discussion

3.1. The Effect of the Light Duration Ratio on the Water Purification Effect of the System

3.1.1. Physical and Chemical Environment of Water Body

The average EC of each experimental group was V ((1.14 ± 0.16) × 102 μs/cm), LV ((1.13 ± 0.16) × 102 μs/cm), MV ((1.11 ± 0.16) ×102 μs/cm), and HV ((1.07 ± 0.18) × 102 μs/cm) (Figure 1a). T was between 17.46 and 30.16 °C. It can be seen from Figure S1a,b that there was no significant difference in the EC and T between the different groups, and the trend of EC and T in the different groups was roughly the same, which gradually decreased with the experiment. Comparing the results of Figure S1c, it was found that the pH of HV was significantly higher than that of the other experimental groups. This is due to the fact that the plants in the system carried out more photosynthesis, removed CO2 from the water, and increased the pH of the water body. From the results of Figure S1d, it can be seen that the change trend of DO is basically the same as that of the pH, and there is a significant correlation between DO and pH (p < 0.01). There is a significant difference in DO between the experimental groups with different light duration ratios (p < 0.05). The DO concentration results from both its photosynthetic production and consumption. The order of DO is HV (4.89 ± 2.20 mg/L) > MV (2.72 ± 1.86 mg/L) > LV (1.32 ± 1.24 mg/L) > V (0.48 ± 0.37 mg/L) (Figure 1d). Combined with the Fv/Fm value and the ETRmax value of the leaves of V. spinulosa in the experimental group, it may be that a higher light duration ratio can better promote the photosynthesis of V. spinulosa and the accumulation of bioenergy.

3.1.2. Removal of N and P

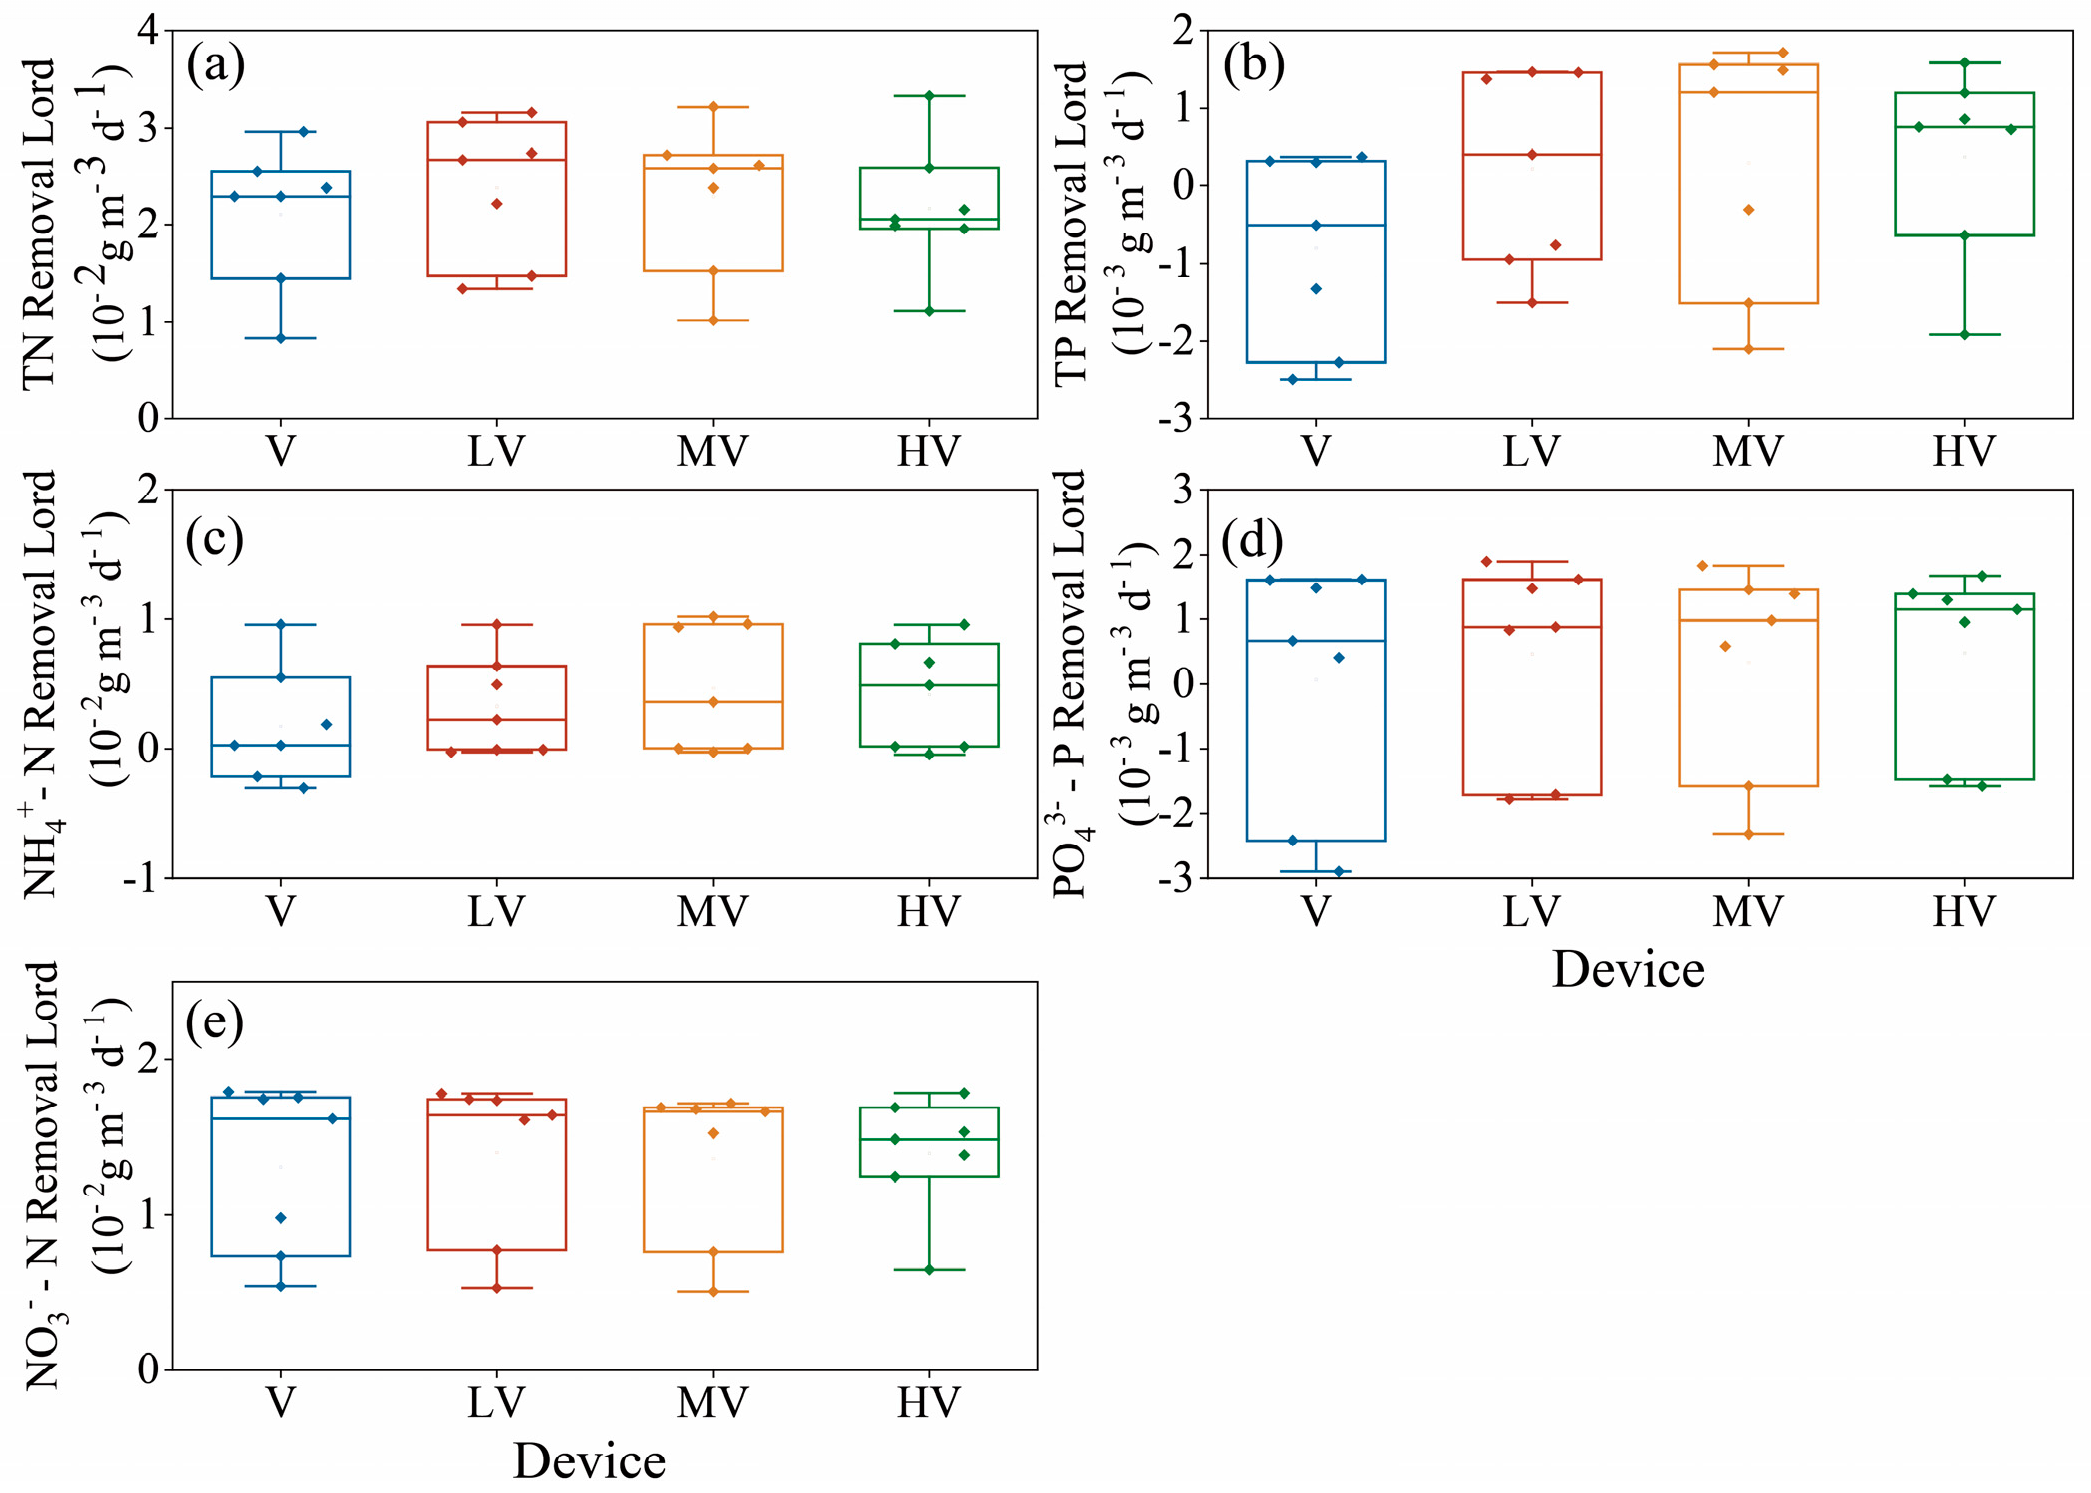
The presence of V. spinulosa will affect the concentrations of N and P in the water. The changes in the water quality index concentration under different treatment conditions are shown in Figure S2. During the 49 d experiment, the effluent TN presented an average concentration of 0.44–0.66 mg/L, and the different light duration ratios had an insignificant effect on the removal load of TN in the water body. The average removal load was 2.11–2.38 × 10⁻² g m−3 d−1 (Figure S2a and Figure 2a). However, the average TN removal load of each experimental group was LV ((2.38 ± 0.73) × 10−2 g m−3 d−1) > HV ((2.29 ± 0.76) × 10−2 g m−3 d−1) > MV ((2.17 ± 0.67) × 10−2 g m−3 d−1) > V ((2.11 ± 0.72) × 10−2 g m−3 d−1), which indicated that the low light duration ratio could promote the removal of TN and that the high light duration ratio inhibited its effect, but the removal effect of the auxiliary light source group was better than that of the non−auxiliary light source group.
The average removal load of NH4+−N in V was different from that of the other devices (p < 0.05), as can be seen from the NH4+−N removal load in Figure 2c. The average removal load of NH4+−N in each experimental group was MV ((4.70 ± 4.91) × 10−1 g m−3 d−1) > HV ((4.21 ± 1.80) × 10−1 g m−3 d−1) > LV ((3.30 ± 3.83) × 10−1 g m−3 d−1) > V ((1.80 ± 4.44) × 10−1 g m−3 d−1), indicating that a certain light duration ratio can promote the removal of NH4+–N, but too high is counterproductive. As the research progressed, the NH4+–N removal load of V became lower and lower. The possible reason was that the photosynthetic capacity of V. spinulosa Yan decreased, and the leaves may have even rotted. According to the classical transformation and removal pathway of nitrogen, the removal of ammonia depends on nitrification [41], which inhibits the nitrification of aerobic nitrifying bacteria and leads to a decrease in the removal rate of NH4+–N [42].
Figure 2e reveals that there was no significant difference in the NO3–N removal load of any of the experimental groups under various settings. The possible reason is that there are enough anaerobic denitrifying bacteria in the anaerobic experimental group (V group) with DO < 0.5 mg/L to remove nitrate nitrogen [43]. In the experimental group with DO > 0.5 mg/L, NO3–N may be removed by the absorption of NO3–N from the soil by V. spinulosa.
With the progress of the experiment, the overall change trend of TP is roughly the same, and different light duration ratios have no significant effect on the removal load of total nitrogen in water. The average TP removal load of each experimental group was HV ((3.70 ± 1.22) × 10−1 g m−3 d−1) > MV ((2.90 ± 1.59) × 10−1 g m−3 d−1) > LV ((2.10 ± 1.28) × 10−1 g m−3 d−1) > V ((−8.00 ± 1.24) × 10−1 g m−3 d−1), indicating that a high light duration ratio can significantly promote TP removal. From Figure 2b, most of the treatment groups exhibit the phenomenon that the TP concentration is less than 0 in the early stage of the experiment, and the TP concentration is greater than the influent at the end of the cycle. The adsorption of P by soil is mainly through the formation of complexes composed of orthophosphate anions and metal cations on the surface of soil solid components. Clay minerals are one of the most active solid components for the adsorption of orthophosphates and other chemicals [44]. Therefore, the exposed soil under the impact of water flow may release P fixed in the soil, thus affecting the removal of P in the device. In the later stage of the experiment, the TP removal rates of LV, MV, and HV were improved. On the 21st day, the water quality changed significantly under the combined action of plant growth and biofilm development due to the decrease in temperature and the sharp increase in DO. With the increase in plant biomass, the ability of V. spinulosa Yan to prevent sediment resuspension was enhanced. In addition, the aerobic environment in the device provides favorable conditions for phosphorus−accumulating microorganisms in water to absorb P. The average PO43−−P removal load of LV, MV, and HV was much higher than that of V (6.75 × 10⁻⁵ g m−3 d−1), and the removal degree was also close, with mean values of (4.60 ± 15.5) × 10−4, (3.37 ± 16.2) × 10−4, and (4.88 ± 14) × 10−4 g m−3 d−1, respectively. Since the V was in an anaerobic environment, the phosphorus−accumulating microorganisms in the water of the device decomposed the phosphorus into inorganic phosphorus and released it into the water, which reduced the PO43−−P removal rate of the experimental group (Figure 2d).

3.2. The Effect of the Light Duration Ratio on the Photosynthetic System of V. spinulosa

3.2.1. Fv/Fm and ETRmax of V. spinulosa

The Fv/Fm value is the ratio of variable fluorescence to maximum fluorescence, which is the maximum efficiency of PSII. This value can be used to estimate the potential efficiency of PSII by dark adaptation measurements, reflecting the light use efficiency in plants [45]. Figure 3a reveals that the Fv/Fm value of the leaves of V. spinulosa is influenced by the light duration ratio of the auxiliary light source. The mean Fv/Fm value of V. spinulosa leaves in each group was HV (0.64 ± 0.08) > MV (0.62 ± 0.13) > LV (0.55 ± 0.11) > V (0.53 ± 0.09). At the beginning of the experiment, each group may be affected by the stress from the high turbidity, and the Fv/Fm value of V. spinulosa decreased slightly. With the increase in the light duration ratio, the Fv/Fm of the leaves in each device increased rapidly. Among them, the Fv/Fm of MV and HV continued to increase, indicating that they were healthier. Similar to the results of previous studies, when the plant is in a favorable stress−free environment, the Fv/Fm of HV plants is almost unchanged [34]. Although the Fv/Fm value of V. spinulosa in V without an auxiliary light source also gradually increased, the number of surviving plants or those reaching the threshold led to the extinction of the population of V. spinulosa in the device.
The ETR can reflect the adaptability of plants to changes in the light environment, and the greater the ETR, the stronger is the adaptability of leaves [46]. ETRmax is related to Calvin cycle metabolism, which can reflect the vitality of plants [47]. As can be seen from Figure 3b, the photosynthetic capacity of LV and MV decreased significantly in the early stage. which may be due to the great influence of turbidity on V. spinulosa Yan in the early stage of the experiment. The photosynthesis of V. spinulosa Yan in HV increased faster and then decreased after reaching the maximum value of 7.87. The possible reason was that the maximum light ratio created sufficient light conditions around V. spinulosa Yan so that V. spinulosa Yan could harvest enough light intensity for photosynthesis, resulting in an increase in ETRmax. The photosynthetic capacity of V. spinulosa in MV increased slowly, with a maximum value of 9.38. After reaching the maximum value, the photosynthetic capacity gradually decreased and was higher than that of HV and LV in the same time period, indicating that MV could still maintain a relatively high photosynthetic intensity and that the vitality of V. spinulosa was high and it grew well. The photosynthetic capacity of V. spinulosa in LV increased the slowest and continued to fluctuate until the end of the experiment.

3.2.2. Chlorophyll Content in Leaves of V. spinulosa

Photosynthetic pigments (chlorophyll and carotenoids) are the core part of the photosynthetic system of green plants, and any significant changes in them may affect the whole metabolism of plants [48]. The chlorophyll of the leaves of V. spinulosa was measured at intervals, and the results are shown in Figure 4. The results showed that the addition of an auxiliary light source affected the chlorophyll content of V. spinulosa. Figure 4a shows that the average chlorophyll contents of different light duration ratios are V (0.66 ± 0.25 mg/g), LV (0.51 ± 0.07 mg/g), MV (0.70 ± 0.32 mg/g), and HV (0.85 ± 0.21 mg/g). Under the influence of no auxiliary light source, the growth of V. spinulosa in V was inhibited, the chloroplast was deformed, and the chlorophyll content was reduced. The chlorophyll (Chl) cycle is a metabolic pathway in which Chl a and Chl b are converted into each other. In this pathway, Chl b is synthesized from Chl a through the catalysis of chlorophyll a oxygenase (CAO) [49]. During the senescence process with the low light duration, Chl b in the leaves of V. spinulosa Yan in V was overproduced, and the plant was not able to produce reductase to degrade Chl b during the senescence process, resulting in excessive Chl production in the plant and the accumulation of Chl metabolites and non−programmed cell death in the leaves. The analysis showed that there was a significant difference between HV and LV (p < 0.05). The results may indicate that a higher light duration ratio within a day can increase the chlorophyll content of V. spinulosa leaves, while a lower light duration ratio will reduce the chlorophyll content of V. spinulosa leaves. The increase in the total chlorophyll content indicates that photosynthesis is promoted and that the accumulation of soluble carbohydrates and biomass in plants is increased.
Carotenoids are a large family of lipid−soluble antioxidants. They should act as free radical scavengers by electron transfer into their double bond structure and play a role in protecting chlorophyll pigments by quenching the triplet excited state of chlorophyll and singlet oxygen to replace the peroxidation and collapse of the chloroplast membrane [50]. Figure 4b shows that the carotenoid content of V. spinulosa varies significantly depending on the light duration ratio; the average content of each group, from high to low, is HV (0.14 mg/g) > MV (0.13 mg/g) > V (0.11 mg/g) > LV (0.08 mg/g). Carotenoids can absorb different light and can be used as an auxiliary light source to capture light energy. The results show that the high daily light duration ratio promotes the growth of carotenoids in the leaves of V. spinulosa and promotes the photosynthesis of the leaves of V. spinulosa. Too low a light duration reduced the content of carotenoids in the leaves of V. spinulosa. The decrease in carotenoids may make chlorophyll fragile, resulting in a decrease in chlorophyll, thereby reducing the photosynthesis of leaves and the accumulation of biomass of V. spinulosa.

3.3. The Effect of the Light Duration Ratio on the Biomass of V. spinulosa

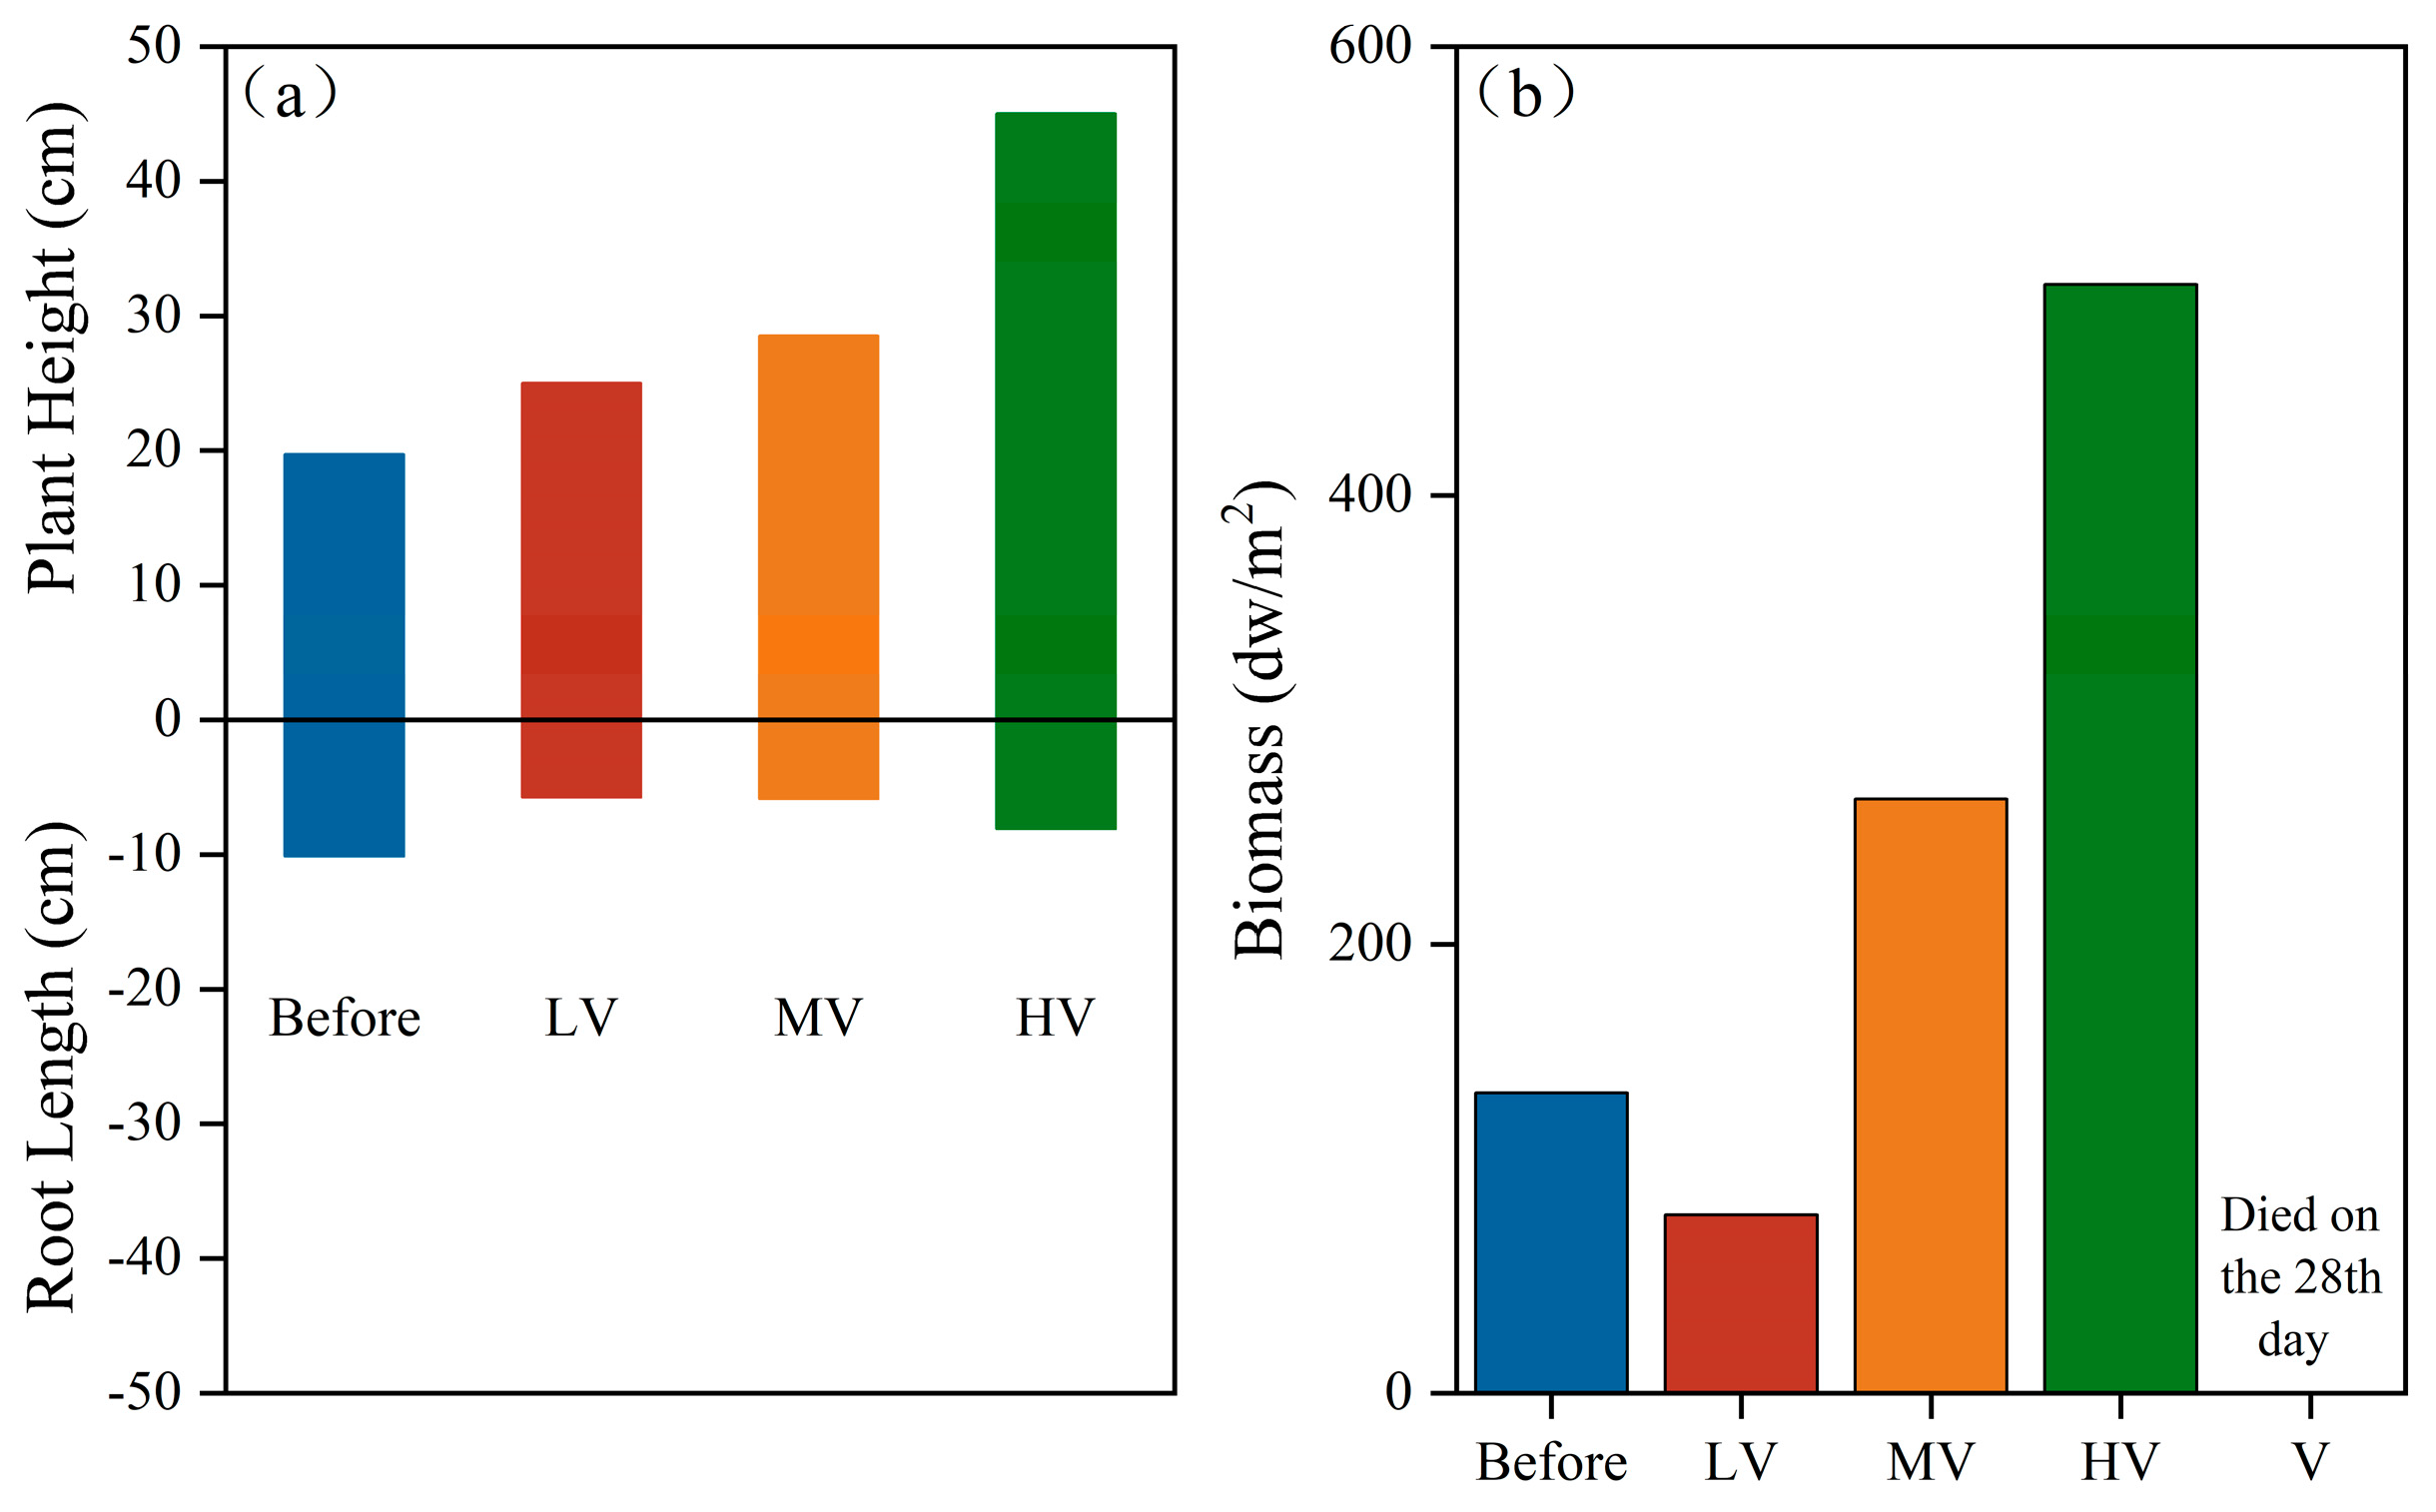
After 49 days of the experiment, the plant height with the treatment device increased significantly, and the plant height with the HV treatment device was the highest (plant height = 45.02 cm). The plant heights of MV and LV were also similar, at 28.50 cm and 25 cm, respectively (Figure 5a). The results showed that a higher light duration allowed V. spinulosa to perform photosynthesis for longer and promoted the growth of V. spinulosa. From the perspective of biomass, V. spinulosa died on the 28th day of the experiment. The biomass of V. spinulosa in LV decreased from 133.75 to 79.40 dw/m2 at the beginning of the experiment, and it basically lost its viability. The data also showed that a lower light ratio was not conducive to the growth of V. spinulosa. The biomasses of MV and LV were 264.70 and 493.97 dw/m2, respectively (Figure 5b), and previous studies found that when the PAR received by plants was in the range of 109–224.9 μmol m−2 s−1, the plant biomass increased with an increase in the light duration ratio. The analysis shows that large plants with different light duration ratios have different coping strategies to light. V. spinulosa growing in LV and MV mainly responded to low and medium light duration by regulating the biomass allocation of leaves and roots, while plants growing in HV responded to the high light duration by rapidly growing and multiplying to expand the population.

3.4. The Effect of the Light Duration Ratio on the Leaf Surface of V. spinulosa

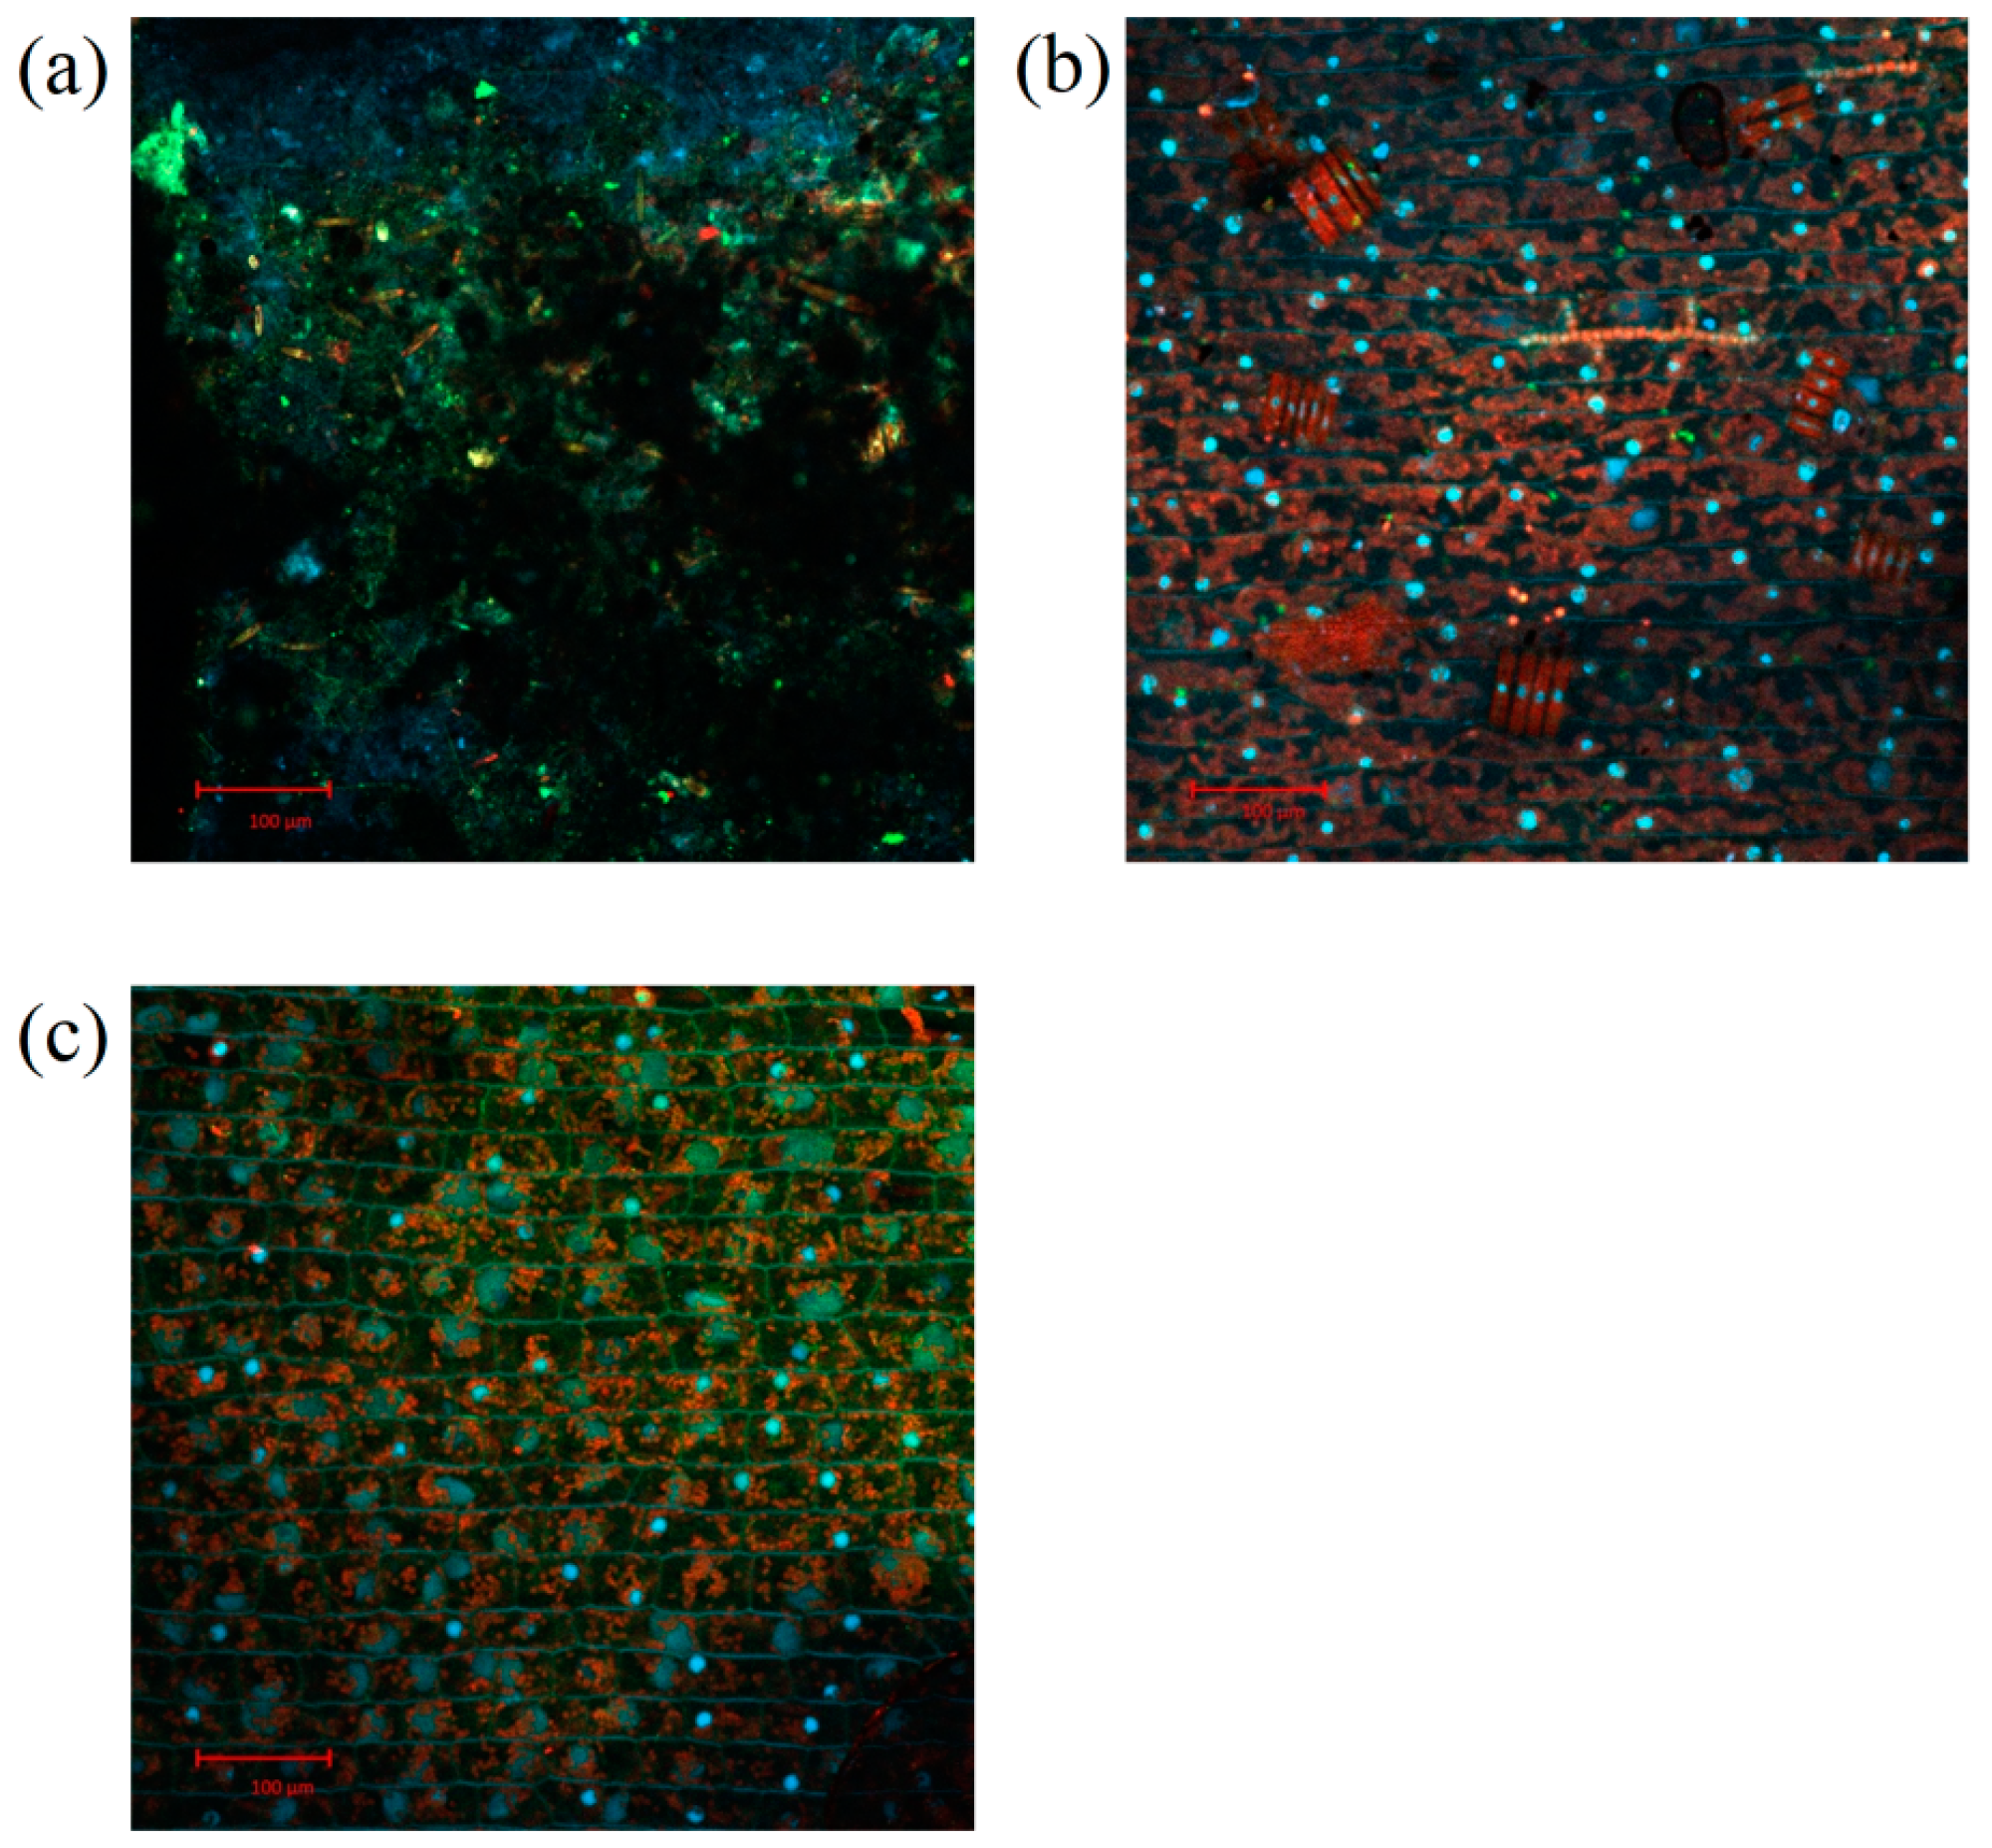
As shown in Figure 6, the epiphytic biofilm morphology on the leaf surface of V. spinulosa changed significantly. The LV, MV, and HV groups were stained with DAPI, FITC, and concanavalin Texas red. The combination of concanavalin Texas red dye and polysaccharide causes the polymeric substances (EPS) in the biofilm to exhibit red fluorescence, while protein and DNA can form green and bright blue by FITC and DAPI staining, respectively. Therefore, the mitochondrial and nuclear DNAs in the cells were shown as bright spots by DAPI staining. Compared with LV and MV, there were more obvious mitochondria and DNA in the leaf cells of HV, but the protein distribution was less, and the leaf surface had obvious algae attached to it (Figure 6c).
Compared with V, the leaf surface in LV formed a thicker biofilm. From the distribution of DNA and protein, it can be found that the biofilm on the leaf surface was mainly formed by microorganisms and algae, not just soil (Figure 6a). The surface of V. spinulosa leaves in MV had a dense distribution of EPS red fluorescent spots (Figure 6b). We observed that the algae abundance in the device was the lowest (Figure S3). The possible reason was that V. spinulosa Yan could secrete some polysaccharides to inhibit the growth of algae [51]. The most interesting thing is that different light duration ratios have a significant effect on the cell abundance of algae (Figure S4). The cell abundance of algae in the MV group is as high as 2.14 × 10⁸ cells/L. Perhaps the 12:12 light duration is more suitable for the growth and reproduction of individual algae, while the two light duration ratios under HV and LV cause the algae in the device to be unable to reproduce rapidly. This may be due to the sufficient amount of V. spinulosa further inhibiting the growth of algae.

3.5. The Difference in the Microbial Community in the System Under Different Light Duration Ratios

3.5.1. Changes in Microbial Community Abundance and Diversity

  • α−Diversity Analysis
Biofilm activities and their interactions with physical, chemical, and biological processes are closely related to the functions of many ecosystems, affecting the hydrological landscape, water quality, and health of aquatic ecosystems [52]. In order to analyze the microbial diversity of biofilms, α−diversity analysis was performed (Table 2). The Sobs, Ace, and Chao indexes reflect the richness of microbial communities. The Shannon index and Simpson index reflect the diversity of the microbial community. The Coverage was greater than 0.95, indicating that these results reflected the true composition of the community. The higher the Sobs, Ace, and Chao indexes, the more species there are in the community, while the Shannon index is proportional to the community diversity, and the Simpson index is inversely proportional to the community diversity [53].
From these six indexes, it can be found that the microbial abundance changes between the water body, leaf surface, and sediment are different. For the Sobs, Ace, and Chao indexes, the water body and leaf surface in LV were the highest, but the Sobs, Ace, and Chao indexes of the sediment in HV were higher than those in HV, MV, and V. This indicates that a certain light duration will increase the abundance of microbial communities in the water and leaf surface, but too high a duration will inhibit the number of species of microbial communities in the water and leaf surface. However, the microbial richness of the sediment increased with the increase in light duration. The Shannon and Simpson indexes also showed a similar situation. The higher the ratio of light duration is, the higher the Shannon index of the sediment, the lower the Simpson index, and the higher the microbial diversity. The above data indicate that different light durations have different effects on the water, leaf surface, and sediment microorganisms.
2.
Classification distribution at phylum and genus levels
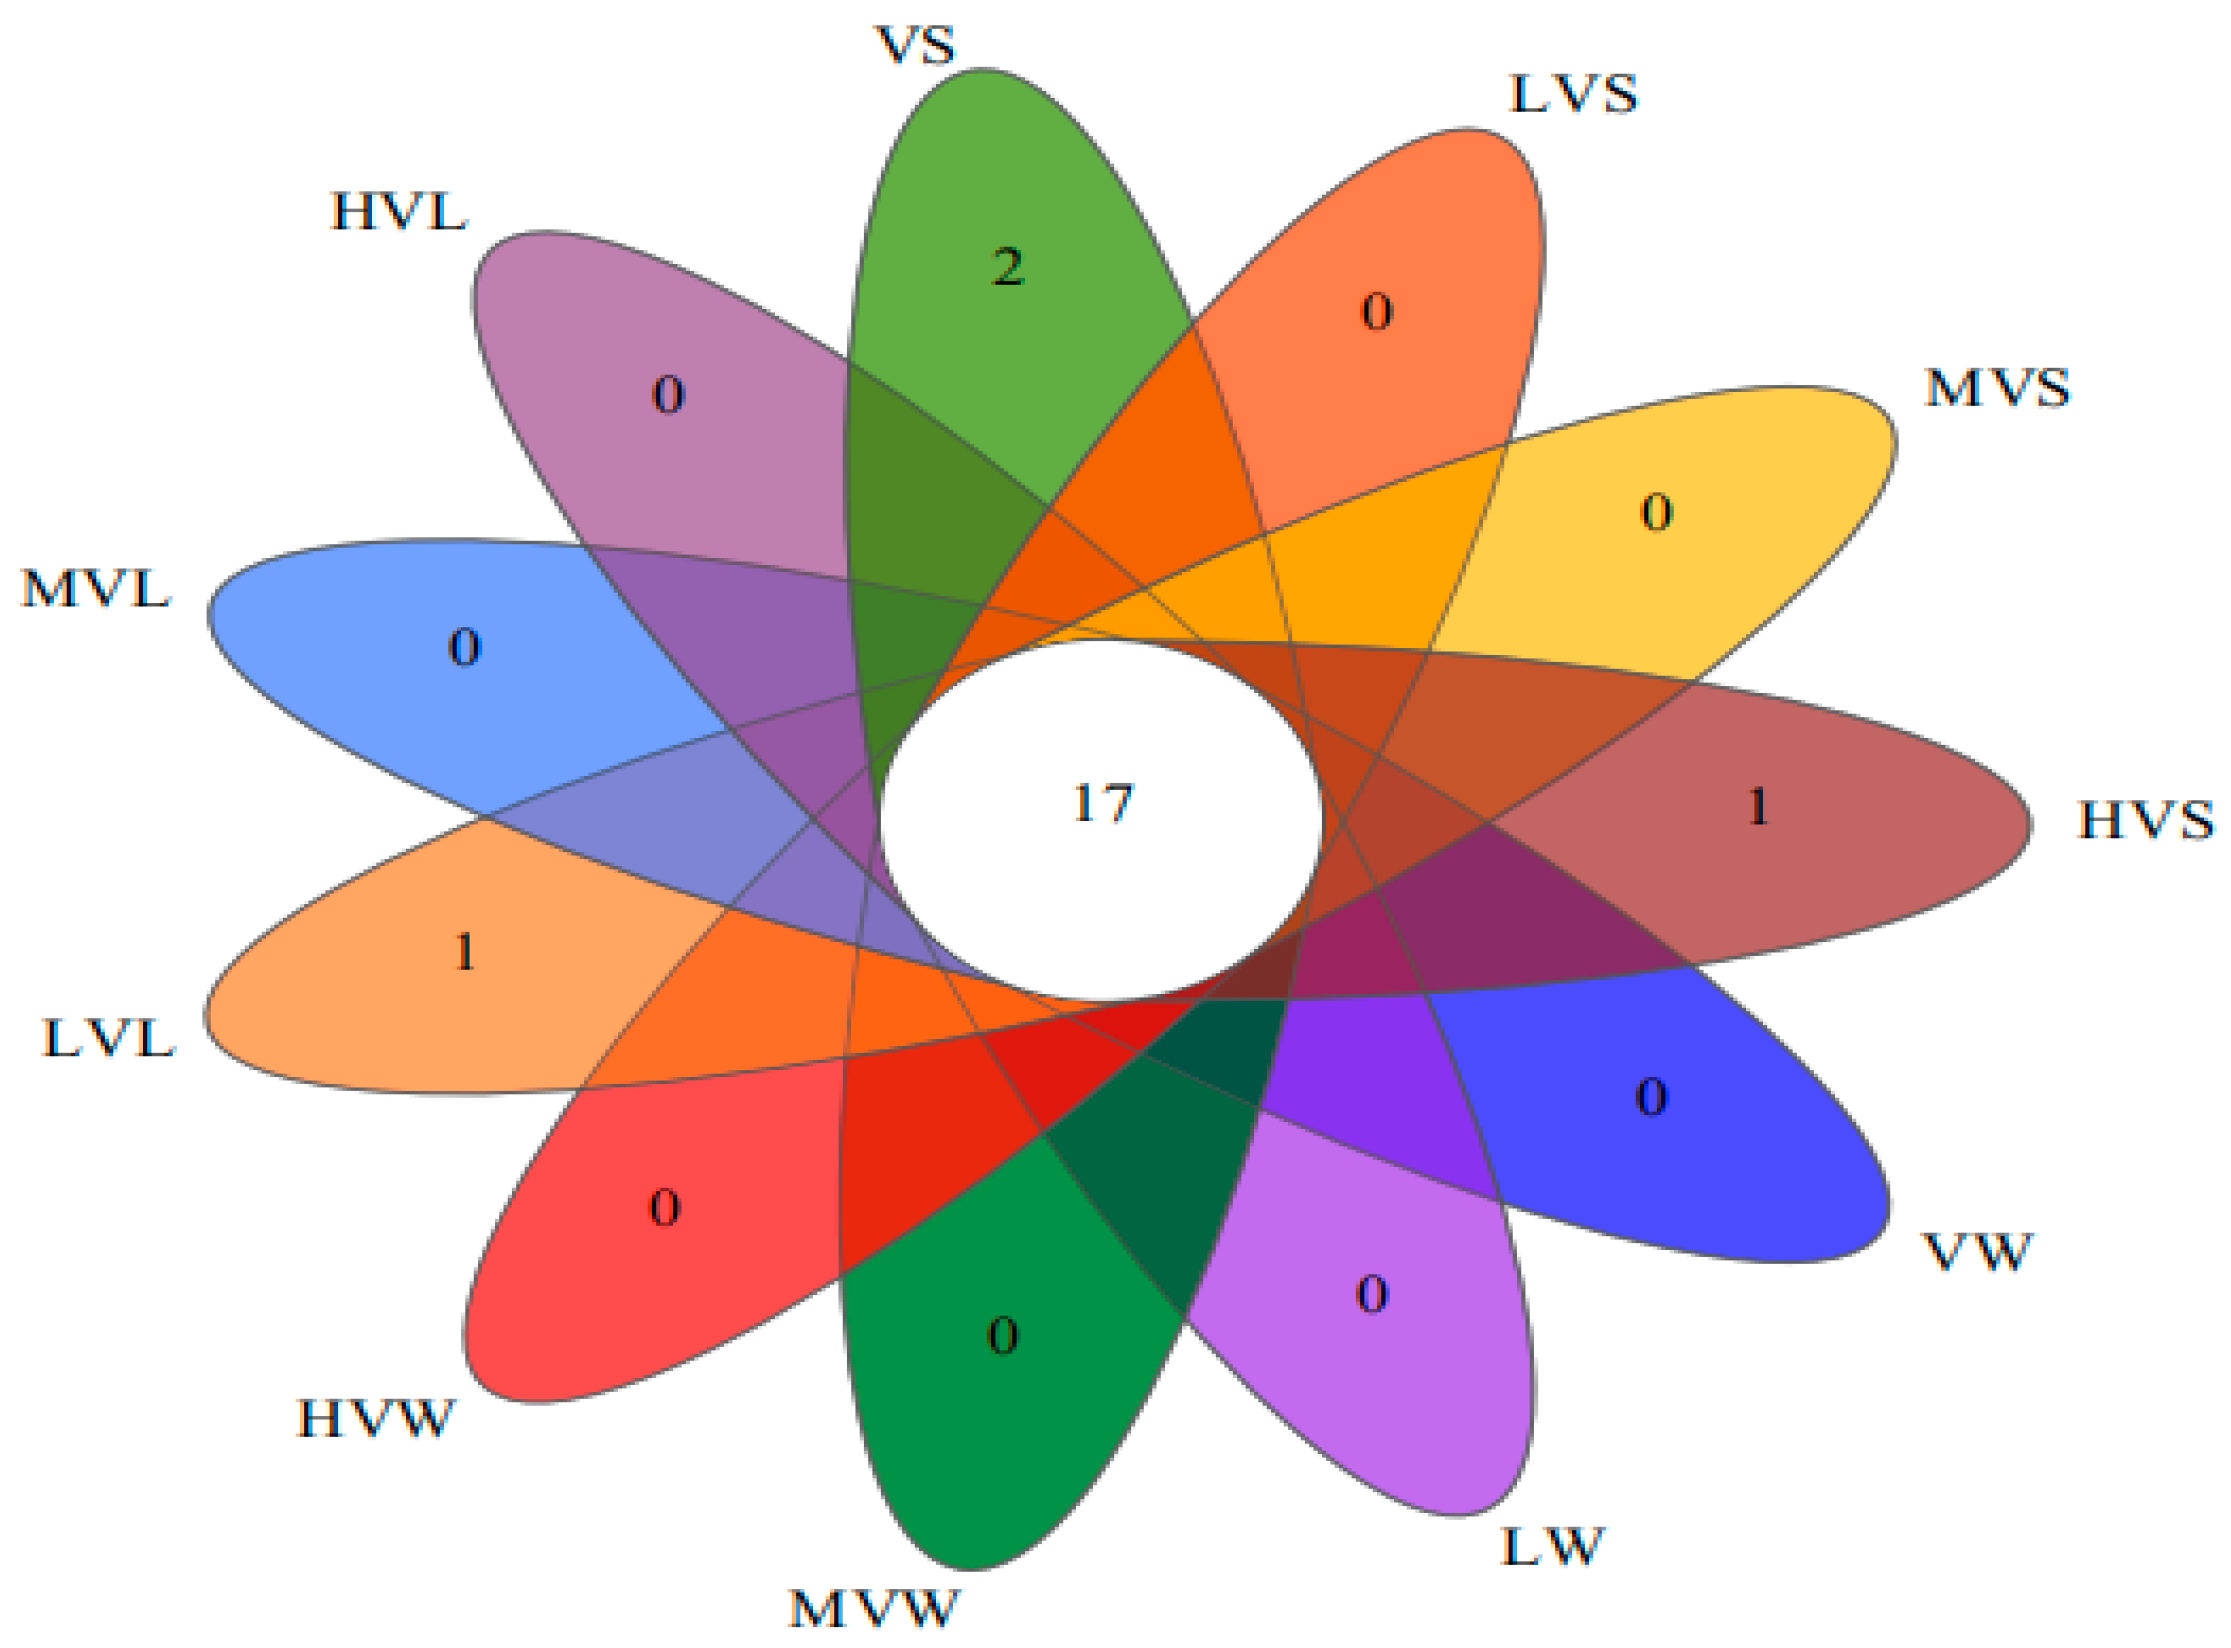
From the Venn diagram analysis, it can be seen that the V group showed the most species. It is worth noting that the number of species did not change significantly with the increase in light duration (Figure 7). There were 17 identical microbial species in the biofilms of each group, indicating that the microorganisms in the biofilms of the high light duration group could also be found in the low light duration group.
Figure 8a shows the most important gates of all samples, as can be seen. The dominant phyla of all experimental systems were mainly Proteobacteria, Cyanobacteria, Bacteroidota, Actinobacteriota, Chloroflexi, Verrucomicrobiota, Firmicutes, Acidobacteria, Desulfobacterota, Myxococcota, Patescibacteria, Bdellovibrionota, Gemmatimonadota, Armatimonadota, Spirochaetota, and Methylomirota.
The relative abundances of the dominant phyla in the water were Proteobacteria (44.76–58.94%), Bacteroidota (19.84–43.87%), Verrucomicrobiota (0.14–9.49%), Actinobacteriota (0.27–8.93%), Cyanobacteria (0.25–6.71%), Bdellovibrionota (0.06–5.35%), Patescibacteria (0.22–2.20%), Desulfobacterota (0–2.15%), Firmicutes (0–2.12%), Acidobacteriota (0.11–2.05%), and Myxococcota (0–1.98%). Among them, the relative abundance of Proteobacteria was the highest, followed by Bacteroidetes, which was consistent with previous studies [54]. The content of Proteobacteria was in the order water > leaf surface > sediment. The surface of the water and the V. spinulosa leaves had a high abundance of Bacteroidetes, but the content of Bacteroidetes in water was the highest, which was 3.90 times higher than that of the leaf surface and 7.98 times higher than that of the sediment area. With the increase in the light duration ratio, the relative abundances of Proteobacteria, Firmicutes, and Desulfobacterota in water gradually decreased, while the relative abundances of Bacteroidetes and Verrucomicrobia gradually increased. The results showed that Bacteroidetes and Verrucomicrobia were more adaptable to a high light duration than other bacteria. The content of Actinobacteriota in each group for the water was LV (8.93%) > V (1.8%) > MV (0.45%) > HV (0.27%), and Acidobacteriota and Patescibacteria also showed the same trend, which indicated that these three phyla were more able to adapt to a low light duration, and once the light duration ratio was too high, their growth was inhibited, even to levels lower than that without an auxiliary light source.
The relative abundances of the dominant phyla on the leaf surface of V. spinulosa were Proteobacteria (32.25–54.24%), Cyanobacteria (26.27–43.80%), Bacteroidota (4.18–12.96%), Verrucomicrobiota (1.27–8.40%), Chloroflexi (0.10–2.59%), Acidobacteriota (0.24–2.27%), Actinobacteriota (0.26–1.60%), Firmicutes (0.15–1.53%), Armatimonadota (0.16–1.51%), Desulfobacterota (0–1.20%), and Patescibacteria (0–1.10%). Both the leaf surface and sediment had higher Cyanobacteria, but compared with other regions, the abundance of Cyanobacteria on the leaf surface of V. spinulosa was the highest, which was 2.42 times that of the sediment area and 9.18 times that of the water body. Cyanobacteria can fix nitrogen from the atmosphere, alter their buoyancy, and secrete toxins as a defense mechanism, which makes cyanobacteria particularly hard to treat [55]. In static water bodies, algae change rapidly when there is a sufficient light source. With the increase in the light duration ratio, the relative abundances of Actinobacteriota, Chloroflexi, Desulfobacterota, Myxococcota, and Patescibacteria gradually decreased. The content of Verrucomicrobiota in each group on the leaf surface was MV (8.40%) > HV (1.67%) > LV (1.27%), and Armatimonadota also showed the same trend, indicating that too high or too low a light duration ratio will inhibit the growth of these two phyla. Notably, the content of Gemmatimonadota (0.35%) on the leaf surface of the HV group is the same as that in MV, which is 0.06% greater than that in LV. This suggests that this phylum is promoted by a rise in the light duration ratio but that this promotion is limited.
The relative abundances of Proteobacteria (27.85–43.72%) and Cyanobacteria (1.54–28.15%) were the highest in the sediment area, followed by Actinobacteriota (3.66–13.39%), Chloroflexi (5.60–11.17%), Acidobacteriota (3.20–10.74%), and Firmicutes (3.67–9.69%). Proteobacteria, Firmicutes, and Acidobacteriota are advantageous in that they participate in the processes of anammox oxidation and denitrification [56,57]. The content of Bacteroidota in each group was MV (5.56%) > HV (4.12%) > LV (3.01%) > V (2.52%), which could increase with the increase in the light duration ratio in a certain range, but the high light duration ratio reduced the abundance. Recent analyses of plant microbiota have identified the phylum Bacteroidota as a major bacterial group in the plant rhizosphere [58]. The content of Cyanobacteria in each group in the sediment area was LV (28.15%) > MV (16.27%) > V (3.8%) > HV (1.54%), which was negatively correlated with the light duration ratio. Once the light duration ratio was too high, the growth of Cyanobacteria was greatly inhibited, and even the abundance was lower than that without an auxiliary light source. The content of Verrucomicrobiota was LV (1.77%) > MV (1.02%) > HV (0.88%) > V (0.76%), and it was also negatively correlated with the light duration ratio, but the difference was that the abundance of each group under different light duration ratios was higher than that in the group without an auxiliary light source (i.e., the V group). This shows that the sediment area is the same but that not all bacteria can adapt to the high light duration environment.
The abundance of each phylum in different experimental groups and different sampling areas was quite different, and the effect of light duration was also different. Proteobacteria was the most common phylum in all populations, with a higher content in LV (49.78%), but the difference between MV (35.74%) and HV (38.17%) was not significant. In every group, the percentage of Bacteroidota was LV (9.01%) < HV (17.28%) < MV (20.32%), whereas the percentage of Chloroflexi was LV (2.81%) < HV (3.61%) < MV (3.83%). The relative abundance of these two species progressively rose as the light duration ratio increased. The contents of Acidobacteriota (LV: 2.51% < HV: 2.59% < MV: 3.70%) and Myxococcota (LV: 0.81% < HV: 0.88% < MV: 1.19%) were not significantly different in the low and medium light duration ratio groups (LV and MV) but significantly increased in the high light duration ratio group. The content of Patescibacteria in each group was LV (1.38%) > HV (1.09%) > MV (0.50%), and the relative abundance decreased gradually with the increase in the light duration ratio. Cyanobacteria and Desulfobacterota could neither adapt to the environment of high light duration nor reproduce in large quantities under low light, but their abundances were the highest in the MV group.
In the analysis of microbial composition at the genus level, blue represents high abundance, and red represents low abundance (Figure 8b). Similar to the analysis results at the gate level, the relative abundances of Dechloromonas, Methylocystis, Bdellovibrio, and Terrimonas in water were V > LV > MV > HV, which decreased with the increase in light duration. Novosphingobium, Lacibacter, Flavobacterium, Runella, and Roseococcus showed the opposite trend. The relative abundance of Sediminibacterium was MV > HV > LV > V, and the relative abundance of Ramlibacter was MV > LV > HV > V. The abundance under the medium light duration ratio was higher than that under other light duration ratio conditions. Limnohabitans, g_unclassified_f_Comamonadaceae, and g_CL500−29_marine_group had the highest content in LV but decreased with the increase in light duration, and the abundances in the HV group were even lower than the abundances in the V group without an auxiliary light source.
Similarly, the relative abundances of Acinetobacter, Pseudorhodobacter, and Methylotenera on the leaf surface area of V. spinulosa were proportional to the duration of light, while Vogesella, Dechloromonas, Methylocystis, and Terrimonas were inversely proportional to the duration of light. Compared with other genera, Pseudomonas had the highest content in LV, but the contents in MV and HV were not significantly different, indicating that the auxiliary light source could promote its abundance, but the increase in light duration had no significant effect. The relative abundances of Luteolibacter, Lacihabitans, and Methylophilus were not high in HV and LV but were the highest in MV, indicating that too high or too low a light duration ratio was not conducive to their reproduction and growth.
In the system with a low light duration ratio, the abundance of Pseudomonas bacteria in the sediment increased significantly and decreased with the increase in light duration but was higher than that of the V group. Luteolibacter and Lacibacter also had the same trend. The genus Pseudomonas not only harbors plant−damaging bacteria but also accommodates species that promote plant growth, degrade xenobiotic compounds, antagonize plant pathogenic fungi, or induce resistance in plants [59,60,61]. The abundance of Dechloromonas bacteria in the sediment was also high, and Dechlorobacter decreased with the increase in the light duration ratio.

3.5.2. Changes and Differences in Microbial Community Structure

PLS−DA analysis was performed on the microorganisms in the water, leaf surface, and sediment (Figure 9) to explore the similarities or differences in the community composition between different groups of samples. The degree of difference in the species structure distribution between samples can be quantified by the statistical distance. It can be seen from the diagram that the distance between each sample of LV, MV, and HV is close, but the distance between each point of V and the rest is far. This indicates that the microbial communities between V and LV, MV, and HV are significantly different, while the microbial distribution of MV and LV is similar, with almost no difference. For LV, MV, and HV, the microorganisms on the surface of the water around V. spinulosa and its leaves were similar. The distribution distance of microorganisms in the sediment of the experimental group with different light durations is far, indicating that it has significant differences. In addition, it can be seen that the microorganisms in the water and sediment areas of V are also different.
In order to further find the taxa with significant differences between the experimental groups with different light duration ratios, LEfSe was used for biomarker analysis. The results showed that there were 19 bacterial differentiation branches with statistically significant differences. The LDA threshold was two, and the identified differential species included 1 class, 2 orders, 4 families and 12 genera (Figure 10a). Among them, 15 bacterial differentiation branches were significantly enriched in LV, 3 bacterial differentiation branches were significantly enriched in HV, and 1 bacterial differentiation branch was enriched in MV.
As shown in Figure 10b, LV had the most differential microbial groups, which were mainly distributed in Microgenomatia at the class level; SR−FBR−L83 at the family level; and Methylomonas, Deinococcus, Zoogloea, Rubellimicrobium, Niveibacterium, and some unclassified species at the genus level. In contrast, the differential microorganisms in the MV group were the least, exhibiting only Silanimonas, which was a biomarker. The HV group, which had the largest light ratio, mainly had differential microbial groups distributed in Flavobacteriaceae and Moraxellaceae at the family level and Candidatus_Paenicardinium at the genus level. Among these significantly different taxa, Methylomonas in LV is one of the main methanotrophs, Zoogloea is a bacterium that can fix nitrogen and form glutamic acid, and Niveibacterium is a new type of nitrogen−fixing bacteria belonging to the family Zoogloeaceae. It has been found that in the enrichment system with methane as the sole carbon source, the aerobic methane–oxidizing bacteria Methylomonas, methylotrophic bacteria Methylophilus, and heterotrophic bacteria Pseudomonas constitute a methane oxidation functional group. Under oxygen–limited conditions, iron oxide is used as an alternative electron acceptor to oxidize methane. In this functional group, the aerobic methane–oxidizing bacteria Methylomonas converts methane into small molecular organic matter such as acetic acid through pyruvate fermentation to provide a carbon source for heterotrophic bacteria [62]. Combined with Figure 6, it can be clearly found that there are fewer mitochondria and DNA in the leaf cells of V. Deinococcus is the most radiation−resistant bacteria found so far, which can resist a variety of pressures and repair DNA damage efficiently [63]. It has great application prospects in environmental governance. Heterotrophic bacteria are considered to be a key control factor in the primary production that drives the microbial cycle. Deinococcus, as a key species of the LV group, belongs to the photosynthetic heterotrophic bacteria. Flavobacteriaceae in HV is a Gram–negative rod–shaped aerobic bacterium, which is the largest family in Bacteroidetes, including a group of quite complex halophilic and psychrophilic species, and its members thrive in various habitats. Interestingly, Figure 8 shows that there are both aerobic and facultative anaerobic microorganisms in LV, and the relative abundances of Dechloromonas and Bdellovibrio are high, indicating that the surface of V. spinulosa has formed a perfect biofilm structure and that the biofilm has the dominant bacteria related to water purification.

3.6. The Relationship Between Light Duration, Microbial Community, and Environmental Variables

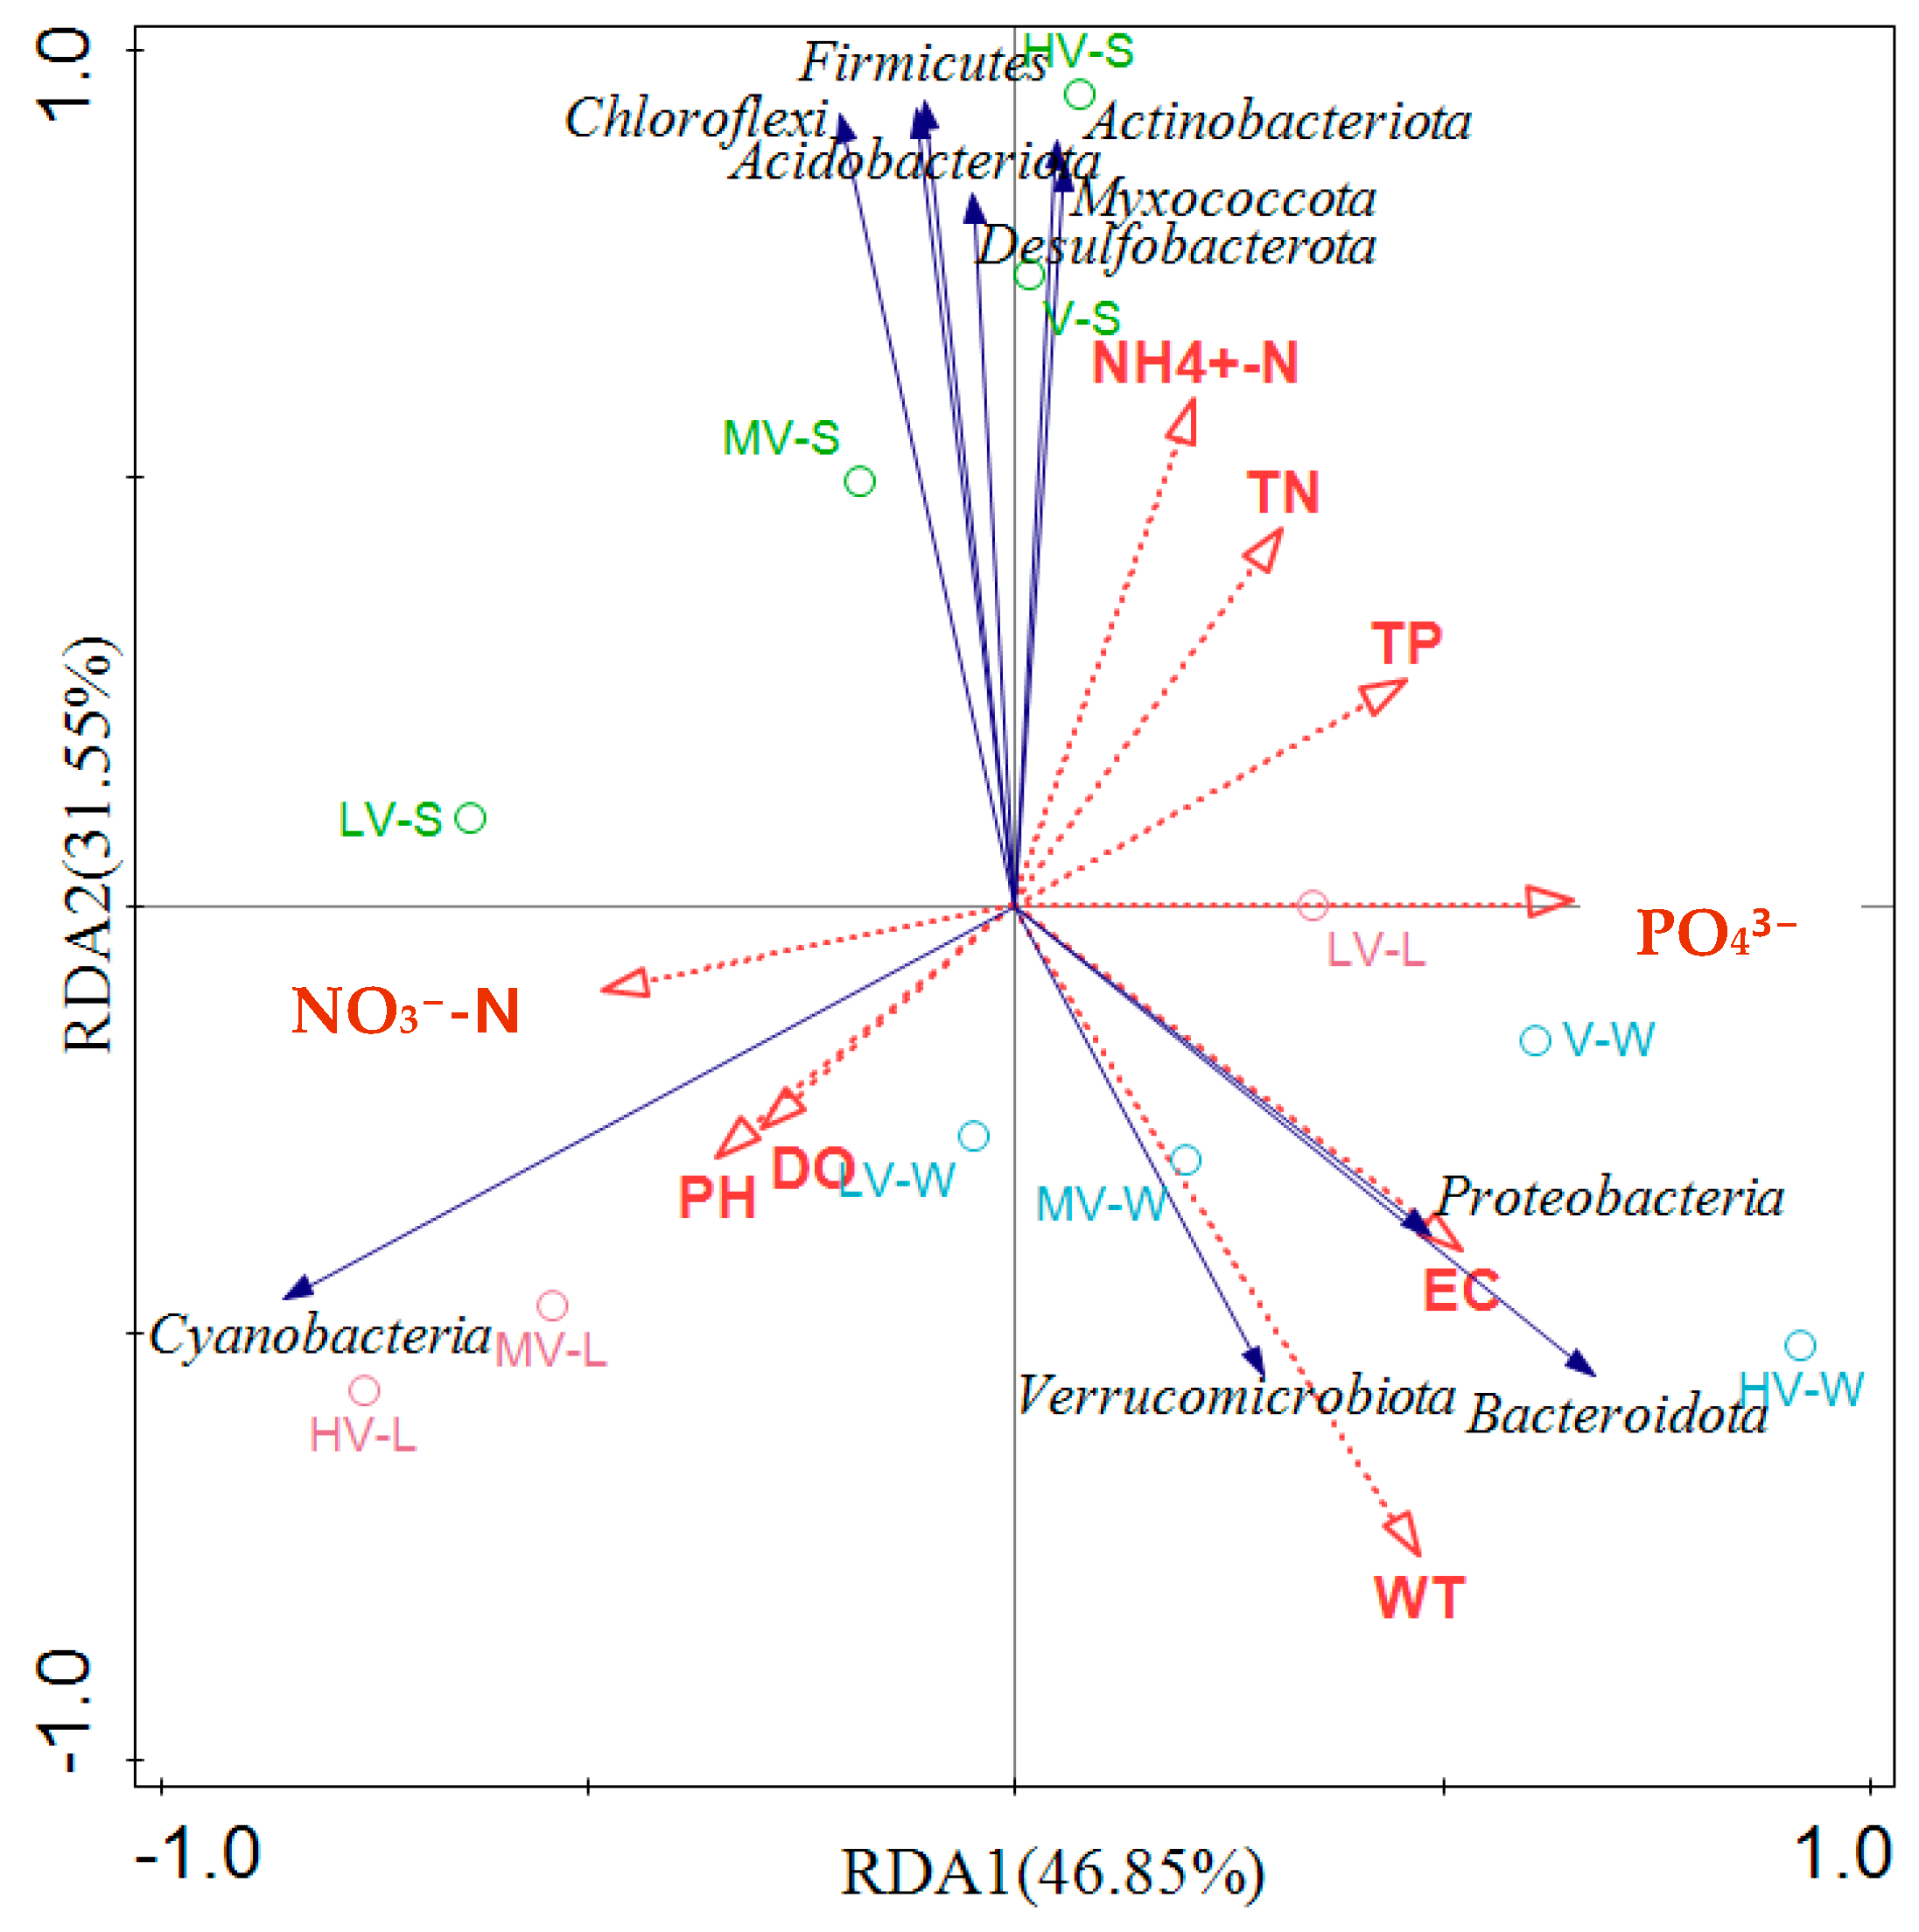
Environmental factors are the main drivers of microbial community structure [64], and RDA was performed to identify possible relationships between the microbial community composition and environmental parameters (Figure 11). According to the RDA results of 10 dominant species and 9 environmental factors, the correlation between the first axis species and the environmental factors was 0.9226, and the correlation between the second axis species and the environment was 0.9990. The interpretation rates of RDA1 and RDA2 were 46.85% and 31.55%, respectively, and the two axes could explain 78.40% of the difference information. Temperature and EC were the two main environmental factors affecting the bacterial communities of the four light duration ratios. The representative species Proteobacteria, Bacteroidota, and Verrucomicrobia and the environmental factors T and EC have the characteristics of the same quadrant, long ray extension, and a small angle, which indicates that they have a strong positive correlation, and T and EC have a strong positive correlation with the species abundance of these three phyla, that is, within a certain range, the species abundances of these three phyla increase with the increase in T and EC. In addition, Cyanobacteria was positively correlated with the water quality parameters (NO3–N, pH, and DO). NH4+–N, TN, and TP were positively correlated with Actinobacteriota, Chloroflexi, Firmicutes, Acidobacteria, Desulfobacterota, and Myxococcota.
From the previous results, different light duration ratios caused changes in the physical and chemical environment of the water bodies, water quality, characteristics of V. spinulosa, and microbial communities. In order to explore the relationship between latent variables such as the water quality, physical and chemical environment of water bodies, photosynthetic characteristics of V. spinulosa, and microbial communities, we used the PLS–PM model to perform path analysis on the attributes of four latent variables. It was observed that different light duration ratios had a very significant correlation with the physical and chemical environment of the water body (p < 0.001) and had a significant correlation with the characteristics of V. spinulosa (p < 0.05). Other environmental variables also affect the biomass of submerged macrophytes, and this effect varies from condition to condition. Different light duration ratios have no significant effect on the water quality. From the path coefficient in Figure 12, we can speculate that the system mainly improves the photosynthesis ability of V. spinulosa leaves by adapting to different light duration ratios, removes CO2 in water, and increases the pH of the water. After improving the physical and chemical environment of the water body, the purpose of promoting the clonal reproduction and biomass increase of V. spinulosa was achieved, which was also conducive to the removal of N and P in the water by the system. The change in water properties and the difference in the light duration ratio also affect the change in microorganisms in the system.

4. Conclusions

In this paper, the growth and physiological characteristics of V. spinulosa and the water purification of the system were studied under four different light time ratios of an underwater auxiliary light source. The changes in the epiphytic biofilm and dominant bacteria in the system were further studied, which provided a theoretical basis for the application of submerged plant ecological management in lakes. The findings are as follows:
(1)
There was no significant difference in T and EC between different light duration ratios of auxiliary light sources, but there was a significant difference in DO. A high light duration promoted more photosynthesis of plants, removed CO2 from the water, and increased the pH of the water. Although different light duration ratios had no significant effect on the purification capacity of the water quality in the system, low and medium light duration ratios could promote the removal of NH4+–N and TN, and TP had the highest removal load under the high light duration ratio. Compared with the group without an auxiliary light source (i.e., the light duration ratio is 0:24), the removal efficiency of each water quality index in the group with an auxiliary light source is better.
(2)
The different light duration ratios of the auxiliary light source have a significant effect on the growth of V. spinulosa. When the light duration ratio is 18:6, V. spinulosa has the highest Fv/Fm and ETRmax, the highest chlorophyll content, the highest plant height and biomass growth rate, and the lowest algae abundance.
(3)
Under different light duration ratios, the sediment area in the 18:6 light group had the highest bacterial abundance and diversity, while the water and leaf surface in the 6:18 light group had the highest bacterial abundance and diversity. There were significant differences in the bacterial communities between the group without additional light ratio (V group 0:24) and the groups with low, medium, and high light duration ratios (LV group 6:18, MV group 12:12, HV group 18:6). The response of various dominant phyla to different light duration ratios in different locations (water, leaf surface, and sediment area) was significantly different. The addition of high light duration resulted in significantly different taxa, including Flavobacteriaceae, Moraxellaceae, and Candidatus Paenicardinium, in the habitat of V. spinulosa. The number of differential microbial groups was the largest in the LV group, and the number of differential microorganisms was the least in the MV group, with only Silanimonas, which was a biomarker. The V. spinulosa without additional light ratio group had a more mature biofilm, and the relative abundances of Dechloromonas and Bdellovibrio were higher.
(4)
T and EC were the two main environmental factors affecting the bacterial community of the four light duration ratios. The representative species Proteobacteria, Bacteroidota, and Verrucomicrobia have a strong positive correlation, and T and EC have a strong positive correlation with the species abundance of these three phyla, that is, within a certain range, the species abundances of these three phyla increase with the increase in temperature and conductivity. Cyanobacteria was positively correlated with water quality parameters (NO3–N, pH, and DO), while NH4+–N, TN, and TP were positively correlated with six phyla, such as Actinobacteriota and Chloroflexi.
(5)
Path analysis showed that different light duration ratios had a very significant correlation with the physical and chemical environment of water (p < 0.001) and had a significant correlation with the characteristics of V. spinulosa (p < 0.05). According to conjecture, the system mainly improves the photosynthesis ability of V. spinulosa leaves by adapting to different light duration ratios, removes CO2 in water, and increases the pH of water. After improving the physical and chemical environment of the water body, the purpose of promoting the clonal reproduction and biomass increase of V. spinulosa was achieved, which was also conducive to the removal of N and P in the water by the system. The change in water properties and the difference in the light duration ratio also affect the change in microorganisms in the system.

Supplementary Materials

The following supporting information can be downloaded at: https://www.mdpi.com/article/10.3390/w16243697/s1, Figure S1: The changes in water (a) EC, (b) T, (c) pH, and (d) DO in each experimental group in different periods; Figure S2: The changes in (a) TN, (b) TP, (c) NH4+−N, (d) PO43−−P, and (e) NO3−N in each experimental group in different periods; Figure S3: Differences in the percentage of algae cells in the experimental group under different light duration ratios; Figure S4: Difference in the abundance of algae cells in the experimental group under different light duration ratios.

Author Contributions

Conceptualization, M.W., J.Z., and X.Z. (Xiaolin Zhou); methodology, M.W., J.Z., and X.Z. (Xiaolin Zhou); software, M.W., J.Z., and X.Z. (Xiaolin Zhou); validation, F.L., Y.T., and C.Y.; formal analysis, M.W., J.Z., and X.Z. (Xiaolin Zhou); investigation, M.W., J.Z., and X.Z. (Xiaolin Zhou); resources, M.W., J.Z., and X.Z. (Xiaolin Zhou); data curation, M.W., J.Z., and X.Z. (Xiaolin Zhou); writing—original draft preparation, M.W., J.Z., and X.Z. (Xiaolin Zhou); writing—review and editing, M.Z., X.Z. (Xiangyong Zheng), and S.W.; visualization, F.L., Y.T., and C.Y.; supervision, Z.J. and S.W.; project administration, M.W., J.Z., and M.Z.; funding acquisition, X.Z. (Xiangyong Zheng), Z.J., and S.W. All authors have read and agreed to the published version of the manuscript.

Funding

This research was funded by the National Key R&D Program of China (No. 2022YFE0106200) and the Wenzhou Ecological Park Research Project (grant number SY2022ZD-1002-02).

Data Availability Statement

The data presented in this study are available on request from the corresponding author. The data are not publicly available due to funder restrictions.

Acknowledgments

The authors express their sincere gratitude for the work of the editor and the anonymous reviewers.

Conflicts of Interest

The authors declare no conflicts of interest.

References

  1. Mazur, R. Lakes Restoration: Analysis of terminology incorrectly used in the scientific literature. Acta Sci. Pol. Form. Circumiectus 2019, 18, 135–146. [Google Scholar] [CrossRef]
  2. Zhao, Y.; Wang, R.; Jeppesen, E.; Zhang, E. Submerged macrophytes can counterbalance the negative effects of rising temperature and eutrophication by inhibiting the photosynthetic activity of cyanobacteria and adjusting their morphology and physiology. Freshw. Biol. 2024, 69, 1842–1856. [Google Scholar] [CrossRef]
  3. Zhang, X.; Mei, X.; Gulati, R.D. Effects of Omnivorous tilapia on water turbidity and primary production dynamics in shallow lakes: Implications for ecosystem management. Rev. Fish. Biol. Fish. 2016, 27, 245–254. [Google Scholar] [CrossRef]
  4. Parra, L.; Rocher, J.; Escrivá, J.; Lloret, J. Design and development of low cost smart turbidity sensor for water quality monitoring in fish farms. Aquac. Eng. 2018, 81, 10–18. [Google Scholar] [CrossRef]
  5. Liu, Z.; Hu, J.; Zhong, P.; Zhang, X.; Ning, J.; Chen, D.; Gao, Y.; He, H.; Jeppesen, E. Successful restoration of a tropical shallow eutrophic lake: Strong bottom−up but weak top−down effects recorded. Water Res. 2018, 146, 88–97. [Google Scholar] [CrossRef] [PubMed]
  6. Zhang, Y.; Liu, X.; Qin, B.; Shi, K.; Deng, J.; Zhou, Y. Aquatic vegetation in response to increased eutrophication and degraded light climate in Eastern Lake Taihu: Implications for lake ecological restoration. Sci. Rep. 2016, 6, 23867. [Google Scholar] [CrossRef] [PubMed]
  7. Schulz, M.; Kozerski, H.P.; Pluntke, T.; Rinke, K. The influence of macrophytes on sedimentation and nutrient retention in the lower River Spree (Germany). Water Res. 2003, 37, 569–578. [Google Scholar] [CrossRef] [PubMed]
  8. Wu, D.; Hua, Z. The effect of vegetation on sediment resuspension and phosphorus release under hydrodynamic disturbance in shallow lakes. Ecol. Eng. 2014, 69, 55–62. [Google Scholar] [CrossRef]
  9. Blindow, I.; Hargeby, A.; Hilt, S. Facilitation of clear−water conditions in shallow lakes by macrophytes: Differences between charophyte and angiosperm dominance. Hydrobiologia 2014, 737, 99–110. [Google Scholar] [CrossRef]
  10. Choudhury, M.I.; Urrutia−Corderoc, P.; HuanZhang Ekvall, M.K.; Medeiros, L.R.; Hanssona, L. Charophytes collapse beyond a critical warming and brownification threshold in shallow lake systems. Sci. Total Environ. 2019, 661, 148–154. [Google Scholar] [CrossRef] [PubMed]
  11. Wang, S.; Gao, Y.; Li, Q.; Gao, J.; Zhai, S.; Zhou, Y.; Cheng, Y. Long−term and inter−monthly dynamics of aquatic vegetation and its relation with environmental factors in Taihu Lake, China. Sci. Total Environ. 2019, 651, 367–380. [Google Scholar] [CrossRef]
  12. Geist, J. Integrative freshwater ecology and biodiversity conservation. Ecol. Indic. 2011, 11, 1507–1516. [Google Scholar] [CrossRef]
  13. Zhang, Y.; Jeppesen, E.; Liu, X.; Qin, B.; Shi, K.; Zhou, Y.; Thomaz, S.M.; Deng, J. Global loss of aquatic vegetation in lakes. Earth−Sci. Rev. 2017, 173, 259–265. [Google Scholar] [CrossRef]
  14. He, D.; Ren, L.; Wu, Q.L. Contrasting diversity of epibiotic bacteria and surrounding bacterioplankton of a common submerged macrophyte, Potamogeton crispus, in freshwater lakes. FEMS Microbiol. Ecol. 2014, 90, 551–562. [Google Scholar] [CrossRef]
  15. Yan, L.; Mu, X.; Han, B.; Zhang, S.; Qiu, C.; Ohore, O.E. Ammonium loading disturbed the microbial food webs in biofilms attached to submersed macrophyte Vallisneria natans. Sci. Total Environ. 2019, 659, 691–698. [Google Scholar] [CrossRef] [PubMed]
  16. Lacoul, P.; Freedman, B. Environmental influences on aquatic plants in freshwater ecosystems. Environ. Rev. 2006, 14, 89–136. [Google Scholar] [CrossRef]
  17. Arthaud, F.; Mousset, M.; Vallod, D.; Robin, J.; Wezel, A. Gudrunbornette Effect of light stress from phytoplankton on the relationship between aquatic vegetation and the propagule bank in shallow lakes. Freshw. Biol. 2012, 57, 666–675. [Google Scholar] [CrossRef]
  18. Chen, J.; Liu, Z.; Xiao, S.; Chen, R.; Luo, C.; Zhu, T.; Cao, T.; Ni, L.; Xie, P.; Su, H.; et al. Effects of benthivorous fish disturbance on chlorophyll a contents in water and the growth of two submersed macrophytes with different growth forms under two light regimes. Sci. Total Environ. 2020, 704, 135269. [Google Scholar] [CrossRef] [PubMed]
  19. Xie, D.; Yu, D.; You, W.; Wang, L. Algae mediate submerged macrophyte response to nutrient and dissolved inorganic carbon loading: A mesocosm study on different species. Chemosphere 2013, 93, 1301–1308. [Google Scholar] [CrossRef]
  20. Chen, J.; Cao, T.; Zhang, X.; Xi, Y.; Ni, L.; Jeppesen, E. Differential photosynthetic and morphological adaptations to low light affect depth distribution of two submersed macrophytes in lakes. Sci. Rep. 2016, 6, 34028. [Google Scholar] [CrossRef] [PubMed]
  21. Liu, H.; Zhou, W.; Li, X.; Chu, Q.; Tang, N.; Shu, B.; Liu, G.; Xing, W. How many submerged macrophyte species are needed to improve water clarity and quality in Yangtze floodplain lakes? Sci. Total Environ. 2020, 724, 138267. [Google Scholar] [CrossRef] [PubMed]
  22. Waiters, M.; Erken, M.; Majdi, N.; Arndt, H.; Norf, H.; Reinshagen, M.; Traunspurger, W.; Walterscheid, A.; Wey, J.K. The food web perspective on aquatic biofilms. Ecol. Monogr. 2018, 88, 543–559. [Google Scholar]
  23. Sorrell, B.K. Regulation of Root Anaerobiosis and Carbon Translocation by Light and Root Aeration in Isoetes Alpinus. Plant Cell Environ. 2004, 27, 1102–1111. [Google Scholar] [CrossRef]
  24. Xie, Y.; Luo, W.; Ren, B.; Li, F. Morphological and physiological responses to sediment type and light availability in roots of the submerged plant Myriophyllum spicatum. Ann. Bot. 2007, 100, 1517–1523. [Google Scholar] [CrossRef]
  25. Zhang, W.; Zhou, P.; Pan, S.; Li, Y.; Lin, L.; Niu, L.; Wang, L.; Zhang, H. The role of microbial communities on primary producers in aquatic ecosystems: Implications in turbidity stress resistance. Environ. Res. 2022, 215, 114353. [Google Scholar] [CrossRef] [PubMed]
  26. Niinemets, U.; Cescatti, A.; Rodeghiero, M.; Tosens, T. Complex adjustments of photosynthetic potentials and internal diffusion conductance to current and previous light availabilities and leaf age in Mediterranean evergreen species Quercus ilex. Plant Cell Environ. 2006, 29, 1159–1178. [Google Scholar] [CrossRef]
  27. Thompson, W.A.; Huang, L.K.; Kriedemann, P.E. Photosynthetic Response to Light and Nutrients in Sun−tolerant and Shade−tolerant Rainforest Trees. II.* Leaf Gas Exchange and Component Processes of Photosynthesis. Funct. Plant Biol. 1992, 19, 19–42. [Google Scholar] [CrossRef]
  28. Hanelt, D.; Hawes, I.; Rae, R. Reduction of UV−B radiation causes an enhancement of photoinhibition in high light stressed aquatic plants from New Zealand lakes. J. Photochem. Photobiol. B 2006, 84, 89–102. [Google Scholar] [CrossRef] [PubMed]
  29. Zefferman, E. Increasing canopy shading reduces growth but not establishment of Elodea nuttallii and Myriophyllum spicatum in stream channels. Hydrobiologia 2014, 734, 159–170. [Google Scholar] [CrossRef]
  30. Yuan, J.; Bai, Z.; Ye, S.; Liu, H.; Wang, Y.; Li, F.; Xie, Y.; Gao, A.; Wu, A. High−light inhibition of two submerged macrophytes in a shallow water experiment. AoB Plants 2022, 14, plac009. [Google Scholar] [CrossRef]
  31. Fu, H.; Yuan, G.; Cao, T.; Ni, L.; Zhang, M.; Wang, S. An alternative mechanism for shade adaptation: Implication of allometric responses of three submersed macrophytes to water depth. Ecol. Res. 2012, 27, 1087–1094. [Google Scholar] [CrossRef]
  32. Yuan, G.; Fu, H.; Zhong, J.; Lou, Q.; Ni, L.; Cao, T. Growth and C/N metabolism of three submersed macrophytes in response to water depths. Environ. Exp. Bot. 2016, 122, 94–99. [Google Scholar] [CrossRef]
  33. Chen, J.; Chou, Q.; Ren, W.; Su, H.; Zhang, M.; Cao, T.; Zhu, T.; Ni, L.; Liu, Z.; Xie, P. Growth, morphology and C/N metabolism responses of a model submersed macrophyte, Vallisneria natans, to various light regimes. Ecol. Indic. 2022, 136, 18652. [Google Scholar] [CrossRef]
  34. Yan, X.; Yu, D.; Li, Y. The effects of elevated CO2 on clonal growth and nutrient content of submerge plant Vallisneria spinulosa. Chemosphere 2006, 62, 595–601. [Google Scholar] [CrossRef] [PubMed]
  35. Chen, J.; Ren, W.; Chou, Q.; Su, H.; Ni, L.; Zhang, M.; Liu, Z.; Xie, P. Alterations in biomass allocation indicate the adaptation of submersed macrophytes to low−light stress. Ecol. Indic. 2020, 113, 106235. [Google Scholar] [CrossRef]
  36. HJ 636−2012; Water Quality−Determination of Total Nitrogen−Alkaline Potassium Persulfate Digestion UV Spectrophotometric Method[S]. Ministry of Ecology and Environment: Beijing, China, 2012.
  37. GB 11893−89; Water Quality—Determination of Total Phosphorus–Ammonium Molybdate Spectrophotometric method[S]. Ministry of Ecology and Environment: Beijing, China, 1989.
  38. HJ/T 346−2007; Water Quality—Determination of Nitrate–Nitrogen–Ultraviolet Spectrophotometry[S]. Ministry of Ecology and Environment: Beijing, China, 2007.
  39. HJ 534—2009; Ambient Air—Determination of Ammonia—Sodium Hypochlorite–Salicylic Acid Spectrophotometry[S]. Ministry of Ecology and Environment: Beijing, China, 2009.
  40. Chae, S.S.; DuBien, J.L.; Warde, W.D. A method of predicting the number of clusters using Rand’s statistic. Comput. Stat. Data Anal. 2006, 50, 3531–3546. [Google Scholar] [CrossRef]
  41. Huang, L.; Wang, N.; Deng, C.; Liang, Y.; Wang, Q.; Liu, M.; Chen, Y. Interactive effect of carbon source with influent COD/N on nitrogen removal and microbial community structure in subsurface flow constructed wetlands. J. Environ. Manag. 2019, 250, 109491. [Google Scholar] [CrossRef]
  42. Fan, J.; Wang, W.; Zhang, B.; Guo, Y.; Ngo, H.H.; Guo, W.; Zhang, J.; Wu, H. Nitrogen removal in intermittently aerated vertical flow constructed wetlands: Impact of influent COD/N ratios. Bioresour. Technol. 2013, 143, 461–466. [Google Scholar] [CrossRef]
  43. Rajta, A.; Bhatia, R.; Setia, H.; Pathani, P. Role of heterotrophic aerobic denitrifying bacteria in nitrate removal from wastewater. J. Appl. Microbiol. 2020, 128, 1261–1278. [Google Scholar] [CrossRef] [PubMed]
  44. Copetti, D.; Valsecchi, L.; Tartari, G.; Mingazzini, M.; Palumbo, M.T. Phosphate adsorption by riverborne clay sediments in a southern−Italy Mediterranean reservoir: Insights from a “natural geo−engineering”experiment. Sci. Total Environ. 2023, 856, 159225. [Google Scholar] [CrossRef]
  45. Hazrati, S.; Tahmasebi−Sarvestani, Z.; Modarres−Sanavy, S.A.M.; Nicola, S. Effects of water stress and light intensity on chlorophyll fluorescence parameters and pigments of Aloe vera L. Plant Physiol. Biochem. 2016, 106, 141–148. [Google Scholar] [CrossRef] [PubMed]
  46. Wu, X.; Pan, J.; Ren, W.; Yang, J.; Luo, L. The effects of water depth on the growth of two submerged macrophytes in an in situ experiment. J. Freshw. Ecol. 2021, 36, 271–284. [Google Scholar] [CrossRef]
  47. Wang, J.; Wu, S.; Yang, Q.; Gu, Y.; Wang, P.; Li, Z.; Li, L. Performance and mechanism of the in situ restoration effect on VHCs in the polluted river water based on the orthogonal experiment: Photosynthetic fluorescence characteristics and microbial community analysis. Environ. Sci. Pollut. Res. 2022, 29, 43004–43018. [Google Scholar] [CrossRef]
  48. Mishra, S.; Agrawal, S.B. Interactive effects between supplemental ultraviolet−B radiation and heavy metals on the growth and biochemical characteristics of Spinacia oleracea L. Braz. J. Plant Physiol. 2006, 18, 307–314. [Google Scholar]
  49. Zhao, X.; Jia, T.; Hu, X. HCAR Is a Limitation Factor for Chlorophyll Cycle and Chlorophyll b Degradation in Chlorophyll−b−Overproducing Plants. Biomolecules 2020, 10, 1639. [Google Scholar] [CrossRef] [PubMed]
  50. Conde−Álvarez, R.M.; Bañares−España, E.; Nieto−Caldera, J.M.; Flores−Moya, A.; Figueroa, F.L. Photosynthetic performance of the aquatic macrophyte Althenia orientalis to solar radiation along its vertical stems. Oecologia 2011, 166, 853–862. [Google Scholar] [CrossRef] [PubMed]
  51. Li, Q.; Gu, P.; Luo, X.; Zhang, H.; Huang, S.; Zhang, J.; Zheng, Z. Pilot−scale study on the effects of cyanobacterial blooms on Vallisneria natans and biofilms at different phosphorus concentrations. Environ. Pollut. 2020, 265, 114996. [Google Scholar] [CrossRef] [PubMed]
  52. Gerbersdorf, S.U.; Koca, K.; de Beer, D.; Chennu, A.; Noss, C.; Risse−Buhl, U.; Weitere, M.; Eiff, O.; Wagner, M.; Aberle, J.; et al. Exploring flow−biofilm−sediment interactions: Assessment of current status and future challenges. Water Res. 2020, 185, 116182. [Google Scholar] [CrossRef]
  53. Shi, L.; Huang, Y.; Zhang, M.; Yu, Y.; Lu, Y.; Kong, F. Bacterial community dynamics and functional variation during the long−term decomposition of cyanobacterial blooms in−vitro. Sci. Total Environ. 2017, 598, 77–86. [Google Scholar] [CrossRef]
  54. Zhu, L.; Xu, H.; Xiao, W.; Lu, J.; Di Lu Chen, X.; Zheng, X.; Jeppesen, E.; Zhang, W.; Wang, L. Ecotoxicological effects of sulfonamide on and its removal by the submerged plant Vallisneria natans (Lour.) Hara. Water Res. 2020, 170, 115354. [Google Scholar] [CrossRef] [PubMed]
  55. Kordahi, M.A.; Ayoub, G.M.; Zayyat, R.M. A critical review of current research on cyanobacterial cells and associated toxins in aquatic environments: Occurrence, impact, and treatment methods. J. Environ. Chem. Eng. 2024, 12, 113931. [Google Scholar] [CrossRef]
  56. Fang, S.; Cao, W.; Wu, Q.; Cheng, S.; Yang, Y.; Liu, J.; Wu, Y.; Fang, F.; Feng, Q.; Cao, J.; et al. Multifaceted roles of methylisothiazolinone intervention in sludge disintegration and acidogenic and methanogenic pathways for efficient carboxylate production during anaerobic fermentation. Chem. Eng. J. 2023, 472, 145022. [Google Scholar] [CrossRef]
  57. Huang, Z.; Jiang, B.; Yang, H.; Wang, B.; Zhang, N.; Dou, H.; Wei, G.; Sun, Y.; Zhang, L. Investigation of glycerol−derived binary and ternary systems in CO2 capture process. Fuel 2017, 210, 836–843. [Google Scholar] [CrossRef]
  58. Seo, H.; Kim, J.H.; Lee, S.M.; Lee, S.W. The plant−associated flavobacterium: A hidden helper for improving plant health. Plant Pathol. 2024, 40, 251–260. [Google Scholar] [CrossRef] [PubMed]
  59. Compant, S.; Duffy, B.; Nowak, J.; Clement, C.; Barka, E.A. Use of plant growth−promoting bacteria for biocontrol of plant diseases: Principles, mechanisms of action, and future prospects. Appl. Environ. Microbiol. 2005, 71, 4951–4959. [Google Scholar] [CrossRef] [PubMed]
  60. Haas, D.; Défago, G. Biological control of soil−borne pathogens by fluorescent pseudomonads. Nat. Rev. Microbiol. 2005, 3, 307–319. [Google Scholar] [CrossRef]
  61. Pieterse, C.M.J.; Van Wees, S.C.M.; Ton, J.; Van Pelt, J.A.; Van Loon, L.C. Signaling in rhizobacteria−induced systemic resistance in Arabidopsis thaliana. Plant Biol. 2002, 4, 535–544. [Google Scholar] [CrossRef]
  62. Li, B.; Tao, Y.; Mao, Z.; Gu, Q.; Han, Y.; Hu, B.; Wang, H.; Lai, A.; Xing, P.; Wu, Q.L. Iron oxides act as an alternative electron acceptor for aerobic methanotrophs in anoxic lake sediments. Water Res. 2023, 234, 119833. [Google Scholar] [CrossRef] [PubMed]
  63. Gerber, E.; Bernard, R.; Castang, S.; Chabot, N.; Coze, F.; Dreux−Zigha, A.; Hauser, E.; Hivin, P.; Joseph, P.; CLazarelli, G.L.J.O. Deinococcus as new chassis for industrial biotechnology: Biology, physiology and tools. J. Appl. Microbiol. 2015, 119, 1–10. [Google Scholar] [CrossRef] [PubMed]
  64. Haller, L.; Tonolla, M.; Zopfi, J.; Peduzzi, R.; Wildi, W.; Poté, J. Composition of bacterial and archaeal communities in freshwater sediments with different contamination levels (Lake Geneva, Switzerland). Water Res. 2011, 45, 1213–1228. [Google Scholar] [CrossRef] [PubMed]
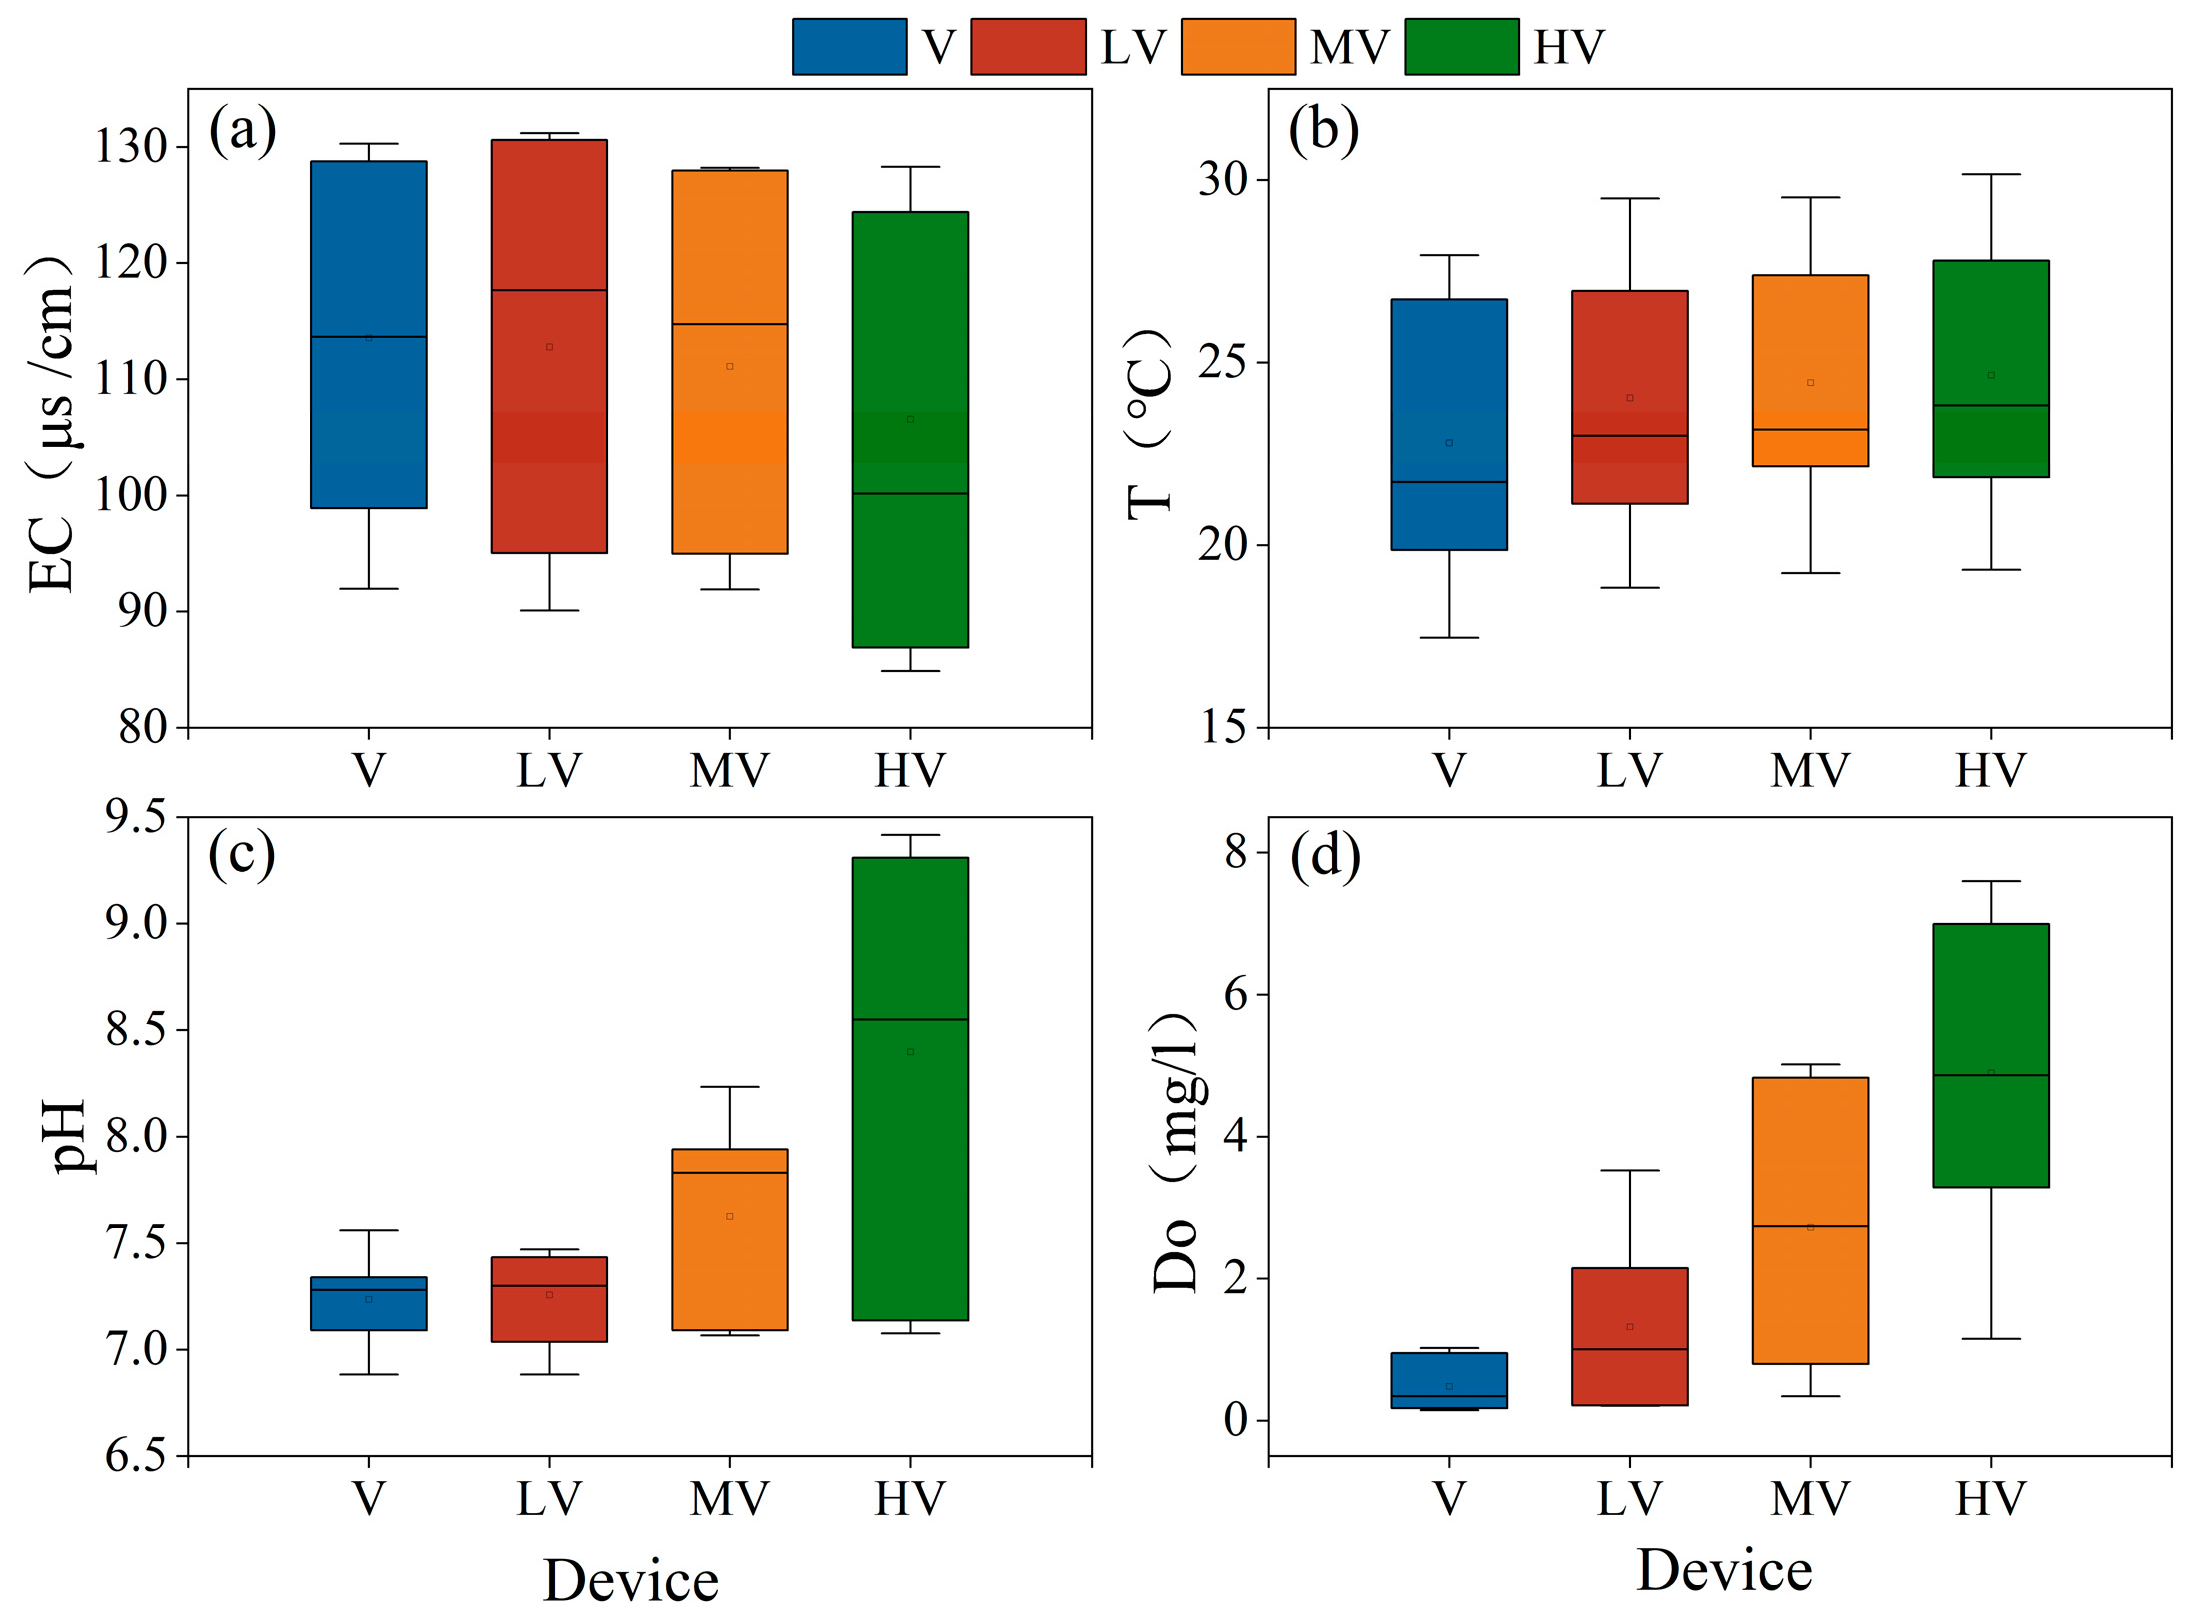
Figure 1. Mean value of water properties in different treatment groups: (a) EC, (b) T, (c) pH, (d) DO. (V: V. spinulosa without auxiliary light source; LV: V. spinulosa + low light duration ratio; MV: V. spinulosa + medium light duration ratio; HV: V. spinulosa + high light duration ratio).
Water 16 03697 g001
Figure 2. The difference in removal load of (a) TN, (b) TP, (c) NH4+–N, (d) PO43−–P, and (e) NO3–N in each experimental group under different light duration ratios. (V: V. spinulosa without auxiliary light source; LV: V. spinulosa + low light duration ratio; MV: V. spinulosa + medium light duration ratio; HV: V. spinulosa + high light duration ratio).
Water 16 03697 g002
Figure 3. The changes in (a) Fv/Fm and (b) ETRmax in each experimental group under different light duration ratios. (V: V. spinulosa without auxiliary light source; LV: V. spinulosa + low light duration ratio; MV: V. spinulosa + medium light duration ratio; HV: V. spinulosa + high light duration ratio).
Water 16 03697 g003
Figure 4. The changes in (a) Chl a + b content and (b) carotenoid content in each experimental group under different light duration ratios (V: V. spinulosa without auxiliary light source; LV: V. spinulosa + low light duration ratio; MV: V. spinulosa + medium light duration ratio; HV: V. spinulosa + high light duration ratio).
Water 16 03697 g004
Figure 5. The changes in (a) plant height, root length, and (b) biomass in each experimental group under different light duration ratios. (V: V. spinulosa without auxiliary light source; LV: V. spinulosa + low light duration ratio; MV: V. spinulosa + medium light duration ratio; HV: V. spinulosa + high light duration ratio).
Water 16 03697 g005
Figure 6. CLSM diagram of leaf–biofilm complex in different light duration ratios. (a) LV: V. spinulosa + low light duration ratio, (b) MV: V. spinulosa + medium light duration ratio, and (c) HV: V. spinulosa + high light duration ratio. Red is EPS polysaccharide stained with Texas red, green is protein stained with FITC, and bright blue is DNA stained with DAPI.
Water 16 03697 g006
Figure 7. Venn diagram of gate distribution in different samples. (VW: V–Water, LVW: LV–Water, MVW: MV–Water, HVW: HV–Water, LVL: LV–Leaf surface, MVL: MV–Leaf surface, HVL: HV–Leaf surface, VS: V–Sediment, LVS: LV–Sediment, MVS: MV–Sediment, HVS: HV–Sediment).
Water 16 03697 g007
Figure 8. Microbial community analysis: (a) the percentage of community abundance at the phylum level; (b) heatmap of bacterial community at the genus level.
Water 16 03697 g008
Figure 9. Microbial PLS−DA analysis (gate level).
Water 16 03697 g009
Figure 10. (a) LEfSe analysis of microbial abundance in LV, MV, and HV and (b) microbial markers (LDA threshold > 2).
Water 16 03697 g010
Figure 11. RDA analysis of microbial community structure and environmental factors.
Water 16 03697 g011
Figure 12. Partial least squares path model (PLS–PM) of PSII between water characteristics, water nutrients, V. spinulosa characteristics, and microorganisms. The blue and red lines represent positive and negative paths, respectively, and the solid and dotted lines represent significant and non–significant correlations, respectively. The significance level is represented by an asterisk: *** p ≤ 0.001, ** 0.001 < p ≤ 0.01, * 0.01 < p ≤ 0.05. The latent variable (red square) is represented by a measurement variable (yellow square). The values are their respective weights.
Water 16 03697 g012
Table 1. Experimental design of four groups.
GroupSetting ConditionLight Duration Ratio (h/h)
VV. spinulosa without auxiliary light source0:24
LVV. spinulosa + low light duration ratio6:18
MVV. spinulosa + medium light duration ratio12:12
HVV. spinulosa + high light duration ratio18:16
Table 2. Microbial diversity indexes in water, leaf surface, and sediment of each group under different light source durations. (V: V. spinulosa without auxiliary light source; LV: V. spinulosa + low light duration ratio; MV: V. spinulosa + medium light duration ratio; HV: V. spinulosa + high light duration ratio).
NumberSampleSobsAceChaoShannonSimpsonCoverage
VWV–Water9751346.57691274.75563.94560.05730.9946
LVWLV–Water13641713.44911687.94714.60540.02480.9939
MVWMV–Water7801019.81951005.62403.60980.07030.9959
HVWHV–Water7151016.6226970.04843.48430.05690.9959
LVLLV–Leaf surface28953983.03103753.05814.17030.12700.9812
MVLMV–Leaf surface22613189.39553043.46074.49750.04730.9864
HVLHV–Leaf surface8631129.97151076.68923.62450.12060.9961
VSV–Sediment49736459.32546147.58576.19700.02350.9713
LVSLV–Sediment41735726.02285431.61284.47520.12590.9720
MVSMV–Sediment53156690.48536222.67346.62120.01660.9630
HVSHV–Sediment65197953.29897437.16607.32830.00490.9691
Disclaimer/Publisher’s Note: The statements, opinions and data contained in all publications are solely those of the individual author(s) and contributor(s) and not of MDPI and/or the editor(s). MDPI and/or the editor(s) disclaim responsibility for any injury to people or property resulting from any ideas, methods, instructions or products referred to in the content.