Article

Assessment of Water Resource Utilization and Analysis of Driving Factors in Zhoushan City Based on Water Footprint Theory and LMDI Model

1
School of Marine Science and Technology, Zhejiang Ocean University, Zhoushan 316022, China
2
Ningbo Zhoushan Port Iron Ore Storage and Transportation Co., Ltd., Zhoushan 316000, China
*
Author to whom correspondence should be addressed.
Water 2024, 16(3), 385; https://doi.org/10.3390/w16030385
Submission received: 28 December 2023 / Revised: 20 January 2024 / Accepted: 22 January 2024 / Published: 24 January 2024

Abstract

:
Accurately analyzing the water system’s status in a region is crucial for mitigating water resource constraints on the development of island areas. This study centers on Zhoushan, an archipelago city, and employs the water footprint theory (WFT) and the logarithmic mean Divisia index (LMDI) model to scrutinize the evolution of water footprints from 2010 to 2020. It also dissects the impacts of economic, technological, and population factors on these changes. The findings are as follows: From 2010 to 2020, Zhoushan’s total water footprint has remained relatively stable, but its structure is imbalanced, indicating an unhealthy development. The agricultural water footprint dominates, though its proportion has steadily declined from 64% to 28%, while the imported water footprint has significantly increased from 2% to 29%. The skewed distribution of internal and external water consumption contributes to this imbalance, with internal water use accounting for a staggering 86.43%. The ecological security of water resources appears bleak, with average water scarcity and pressure indices reaching 0.42 and 0.41, respectively, indicating an overloaded state of water resources. Despite a 144.50% growth in water footprint efficiency from 2010 to 2020, the average water resource sustainability index merely stands at 0.531, and its sustainability remains precarious. The LMDI model results unveil that technological factors are the primary negative driving factors, contributing to 47.06% of the changes in Zhoushan’s water resource utilization. Conversely, economic and population factors play positive roles, contributing 42.29% and 10.65%, respectively. Therefore, in the course of development, there should be a focus on promoting water-saving tec-nologies, and continuously enhancing the efficiency of water resource utilization. Simultaneously, attention should be given to the development of the tertiary sector and the water resource pressure resulting from the mobile population, aiming to achieve sustainable water resource utilization and further ensure the ecological security of Zhoushan City.

1. Introduction

As a critical natural resource, water plays an important role in aspects of human survival, socio-economic development, and ecological environments [1]. Not only is water resources one of the 17 Sustainable Development Goals for 2023 set by the United Nations [2], but it also serves as a fundamental cornerstone for the Paris Agreement. Over the past century, global water usage has steadily increased by approximately 1% each year, driven by factors like population growth, economic development, and shifts in consumption patterns. In China, national water consumption has exhibited a slow upward trend since 1997. The rapidly expanding economy and escalating water use in agriculture and industrial production have imposed substantial pressure on China’s water quantity and aquatic environment. In 2020, China consumed 581.29 billion m3 [3] (National Bureau of Statistics of China, 2021), while Zhoushan City in Zhejiang Province utilized 93.63 million m3 of water resources [4] (Zhoushan Water Resources Bureau, 2022).
Especially as an island city, Zhoushan City in Zhejiang Province faces dual pressures on water resources from both natural and societal aspects. On the one hand, as an archipelago, Zhoushan City encounters challenges with its short and swiftly flowing surface water, coupled with unfavorable conditions for groundwater occurrence [5]. On the other hand, from residents’ daily lives to industrial development, the demand for water is high, leading to a prominent contradiction between water supply and demand. Clearly understanding the utilization status of water resources and the influencing factors is crucial for addressing the relationship between the growing pressures of productive activities and the increasing demand for water resources. As water is one of the primary public resources where the government plays an important role, a precise understanding of water consumption will facilitate the government in effectively managing water resources and formulating pertinent policies related to water resource utilization.
This study endeavors to integrate the water footprint theory (WFT) with the logarithmic mean Divisia index (LMDI) model for a comprehensive evaluation of the urban water system, emphasizing the paper’s strengths in understanding the overall utilization of urban water resources. We chose Zhoushan City, a coastal island city grappling with severe water scarcity, as the research area. Our calculations covered regional water consumption, assessed water resource utilization, and analyzed influencing factors. The aim is to furnish a more scientifically sound theoretical foundation for regional water resource utilization and management.
WFT has evolved from the concept of virtual water, introduced by British scholar Tony Allan in 1993 [6]. Allan proposed the concept of “virtual water”, highlighting that water resource consumption is embedded in the virtual water of products and services [7]. In 2002, Hoekstra further developed this idea, introducing the concept of a “water footprint” based on virtual water theory [8]. The water footprint aims to analyze the connection between human consumption and the freshwater required for the products consumed [9]. This theory not only accounts for physical water consumption but also reflects the conditions of virtual water and its trade [10]. It provides an indirect understanding of regional water resource allocation and consumption, offering a more comprehensive and objective assessment of water resource utilization [11]. Various methods are currently employed for water footprint assessment, focusing primarily on the spatial Dubin model [12], the gravity model [13], structural decomposition analysis (SDA) [14,15], the Generalized Divisia Index Method (GDIM) index decomposition [16], and the Budyko framework [17], among others. For the decomposition of driving factors, Vaninsky [18] applied the GDIM index decomposition to explain the economic implications of changes in carbon dioxide emissions precisely. Many scholars couple the SDA model with the multi-region input–output (MRIO) model to explore the impact of driving factors at different spatial scales and research fields [19]. Compared to other driving factor decomposition methods, the logarithmic mean Divisia index (LMDI) effectively addresses the problem of decomposition residuals [20] and handles zero values in the data. It is characterized by a simple calculation, intuitive decomposition results, and increased model persuasiveness [21]. Due to its unique advantages, such as ease of use, decomposability, and aggregation consistency, LMDI has gained widespread adoption [22]. Through a comprehensive analysis, it is evident that most scholars concentrate on the overall changes in provincial or industrial water footprints and the analysis of driving factors, lacking detailed water footprint analysis at the sub-provincial administrative level. Zhoushan City, as one of the prefecture-level cities in Zhejiang Province, possesses unique geographical features [23], with numerous islands emphasizing the importance of water resources [24]. With continuous economic and social development, the tourism industry and marine-related industries are rapidly growing, leading to a severe freshwater shortage in Zhoushan City, presenting a significant challenge [25].

2. Overview of the Study Area and Data Source

2.1. An Overview of the Study Area

Zhoushan City is situated on the southern side of the Yangtze River estuary, along the outer edge of Hangzhou Bay (Figure 1). It encompasses a total of 2085 islands, making it the largest archipelago city in China. In 2020, Zhoushan City had a permanent population of 1.159 million, with an annual tourism influx reaching 70 million visitors. The urbanization rate stood at 71.89%, ranking fourth in Zhejiang Province. Over the years, Zhoushan City has maintained an economic structure where the three sectors (primary industry: the section of industry that provides raw materials to be made into goods, secondary industry: the section of industry that uses raw materials to make goods, and tertiary industry: the part of a country’s economy that provides services) have averaged a ratio of 10:35:55. The proportion of the primary sector has been steadily decreasing, while the tertiary sector has shown the opposite trend, and the secondary sector has remained relatively stable. The topography is primarily characterized by low hills and hillocks, limited land area, and challenges in generating significant runoff. Rivers are small with short lengths, and freshwater has a short surface residence time due to poor closure conditions, resulting in approximately 85% of precipitation being discharged into the sea [26]. The total water resources are limited, and groundwater utilization is challenging. With social and economic development, there has been an increased demand for production and domestic water, exacerbating the regional water supply–demand imbalance. In 2020, Zhoushan City received an annual precipitation of 1438.7 mm, which is lower than the average of 1701.0 mm in Zhejiang Province. The total water resources amounted to 973.23 million m3/year, with a per capita water resource availability of 840.6 m3/inhab. year, significantly lower than the Chinese national average of 2239.8 m3/inhab. day [27].

2.2. Data Source

The data for Zhoushan City from 2010 to 2020, including annual total agricultural production, import and export trade volume, gross domestic product (GDP), permanent population, and land area, were sourced from the Zhoushan Statistical Yearbook covering the years 2011 to 2021. The data regarding total water resources, water usage per CNY 10,000 of GDP, agricultural water usage, industrial water usage, and domestic and ecological water usage from 2010 to 2020 were obtained from the Zhoushan City Water Resources Bulletin for the same period. The data are derived from the portal website of Zhoushan People’s Government, Zhoushan Water Conservancy Network, and Zhoushan Bureau of Statistics.

3. Research Method

3.1. Calculation Method of Water Footprints

The approach used for regional water footprint calculation in this study is based on early research [28]. The total water footprint (WT·108 m3) can be categorized into internal water footprint (WI·108 m3) and external water footprint (WE·108 m3) [29], with the calculation equation outlined as follows [30]:
W T = W I + W E
The internal water footprint comprises five components: agricultural water footprint (Wa·108 m3), industrial water footprint (Wi·108 m3), domestic water footprint (Wd·108 m3), ecological water footprint (We·108 m3), and export water footprint (Wex·108 m3). The respective formulas for their calculation are as follows:
W I = W a + W i + W d + W e W e x
where the agricultural water footprint is computed by multiplying the virtual water content per unit of a product by the agricultural product yields. To reflect Zhoushan’s agricultural production structure, nine representative agricultural and livestock products were selected for the calculation of Zhoushan’s agricultural water footprint. The unit virtual water content of agricultural products is determined based on prior research findings [31,32], as presented in Table 1.
The industrial water footprint, domestic water footprint, and ecological water footprint are all determined based on the sum of industrial water usage, urban public water usage, and domestic water usage, as reported in the Zhoushan City Water Resources Bulletin.
The external water footprint, specifically the import water footprint (WE), is calculated as follows:
W E = W G t × T t
where WGt represents water usage per CNY 10,000 of GDP, and Tt denotes the import and export trade. The virtual water footprint of imports encompasses the total water usage associated with products and services entering and leaving the region. It is calculated as the product of water usage per CNY 10,000 of GDP and the import and export trade, representing the import water footprint (WE) [33,34].

3.2. Analysis of Water Footprint Driving Factors Using the LMDI Model

The LMDI model, a logarithmic decomposition method, is employed to disentangle a research subject into its various influencing factors [17]. It finds extensive application in assessing how different factors impact the research subject and in conducting an analysis of their driving forces [34,35].
In this study, in accordance with the LMDI model, we break down the driving factors behind water footprint changes in Zhoushan City into three key aspects: population effect (Pe), economic effect (Ae), and technological effect (Te). The specific expressions are as follows:
W T = t W T t = t P t × G t P t × W T t G t
Δ W t = W T t W T 0 = P e + A e + T e
P e = Δ W t t ( ln P t ln P 0 ) / ln W T t W T 0
A e = Δ W t t ( ln G t P t ln G 0 P 0 ) / ln W T t W T 0
T e = Δ W t t ( ln W T t G t ln W T 0 G 0 ) / ln W T t W T 0
where WTt represents the water footprint in year t, Pt represents the population in year t, Gt represents the GDP in year t, and ΔWt represents the change in water footprint from the base year to year t. Pe represents the population effect intensity, Ae represents the economic effect, and Te represents the technological effect. Positive values for Pe, Ae, and Te indicate a positive driving effect, while negative values indicate a negative driving effect. Considering the regional socioeconomic characteristics, the analysis of population factors also takes into account the influence of the floating population on the research area. This involves including data on the tourist population within the population driving factor of the LMDI model.

3.3. Indicator System for Evaluating Water Resource Utilization

Drawing from the research of Qi et al. [35] and taking into account the WFT and the specific circumstances of Zhoushan City, 12 indicators are chosen in this study. These indicators are used to construct an evaluation framework for water resource utilization in Zhoushan City, focusing on four key aspects: water footprint structure, efficiency, ecological security, and sustainability. Details of each indicator, along with their calculation methods and meanings, are presented in Table 2.

4. Result Analysis

4.1. Analysis of Water Footprint Changes

The water footprint calculations for Zhoushan City from 2010 to 2020 are presented in Table 3. Over the study period, the total regional water footprint remained relatively stable, with an average total water footprint of 3.41 × 10⁸ m3. The variation was relatively small, staying within a range of 19.54%. Compared to the changes in total water footprints in other cities, Zhoushan City’s changes were relatively modest [36].
As illustrated in Figure 2, Zhoushan City initially had a significant internal water footprint, which peaked in 2012 and then gradually declined. Conversely, the external water footprint showed an upward trend, increasing from 13.57% to 43.47%. Nevertheless, Zhoushan City continued to rely heavily on its internal water footprint for water resource utilization. Given the ongoing scarcity of local water resources, it is clear that the water resource challenges in the region remain severe. Up until 2016, Zhoushan City maintained a relatively high self-sufficiency rate for water resources, averaging 96.99%, with a low level of dependence on imports. However, after 2016, there was a significant decrease in the internal water footprint and a notable increase in the external water footprint. This change is closely associated with the development of the Third Phase of the Mainland Water Diversion Project in Zhoushan, which has bolstered the island’s water resource security. Consequently, the self-sufficiency rate for water resources has declined, and the dependence on imports has continued to rise, providing some relief for the local water resource pressures.

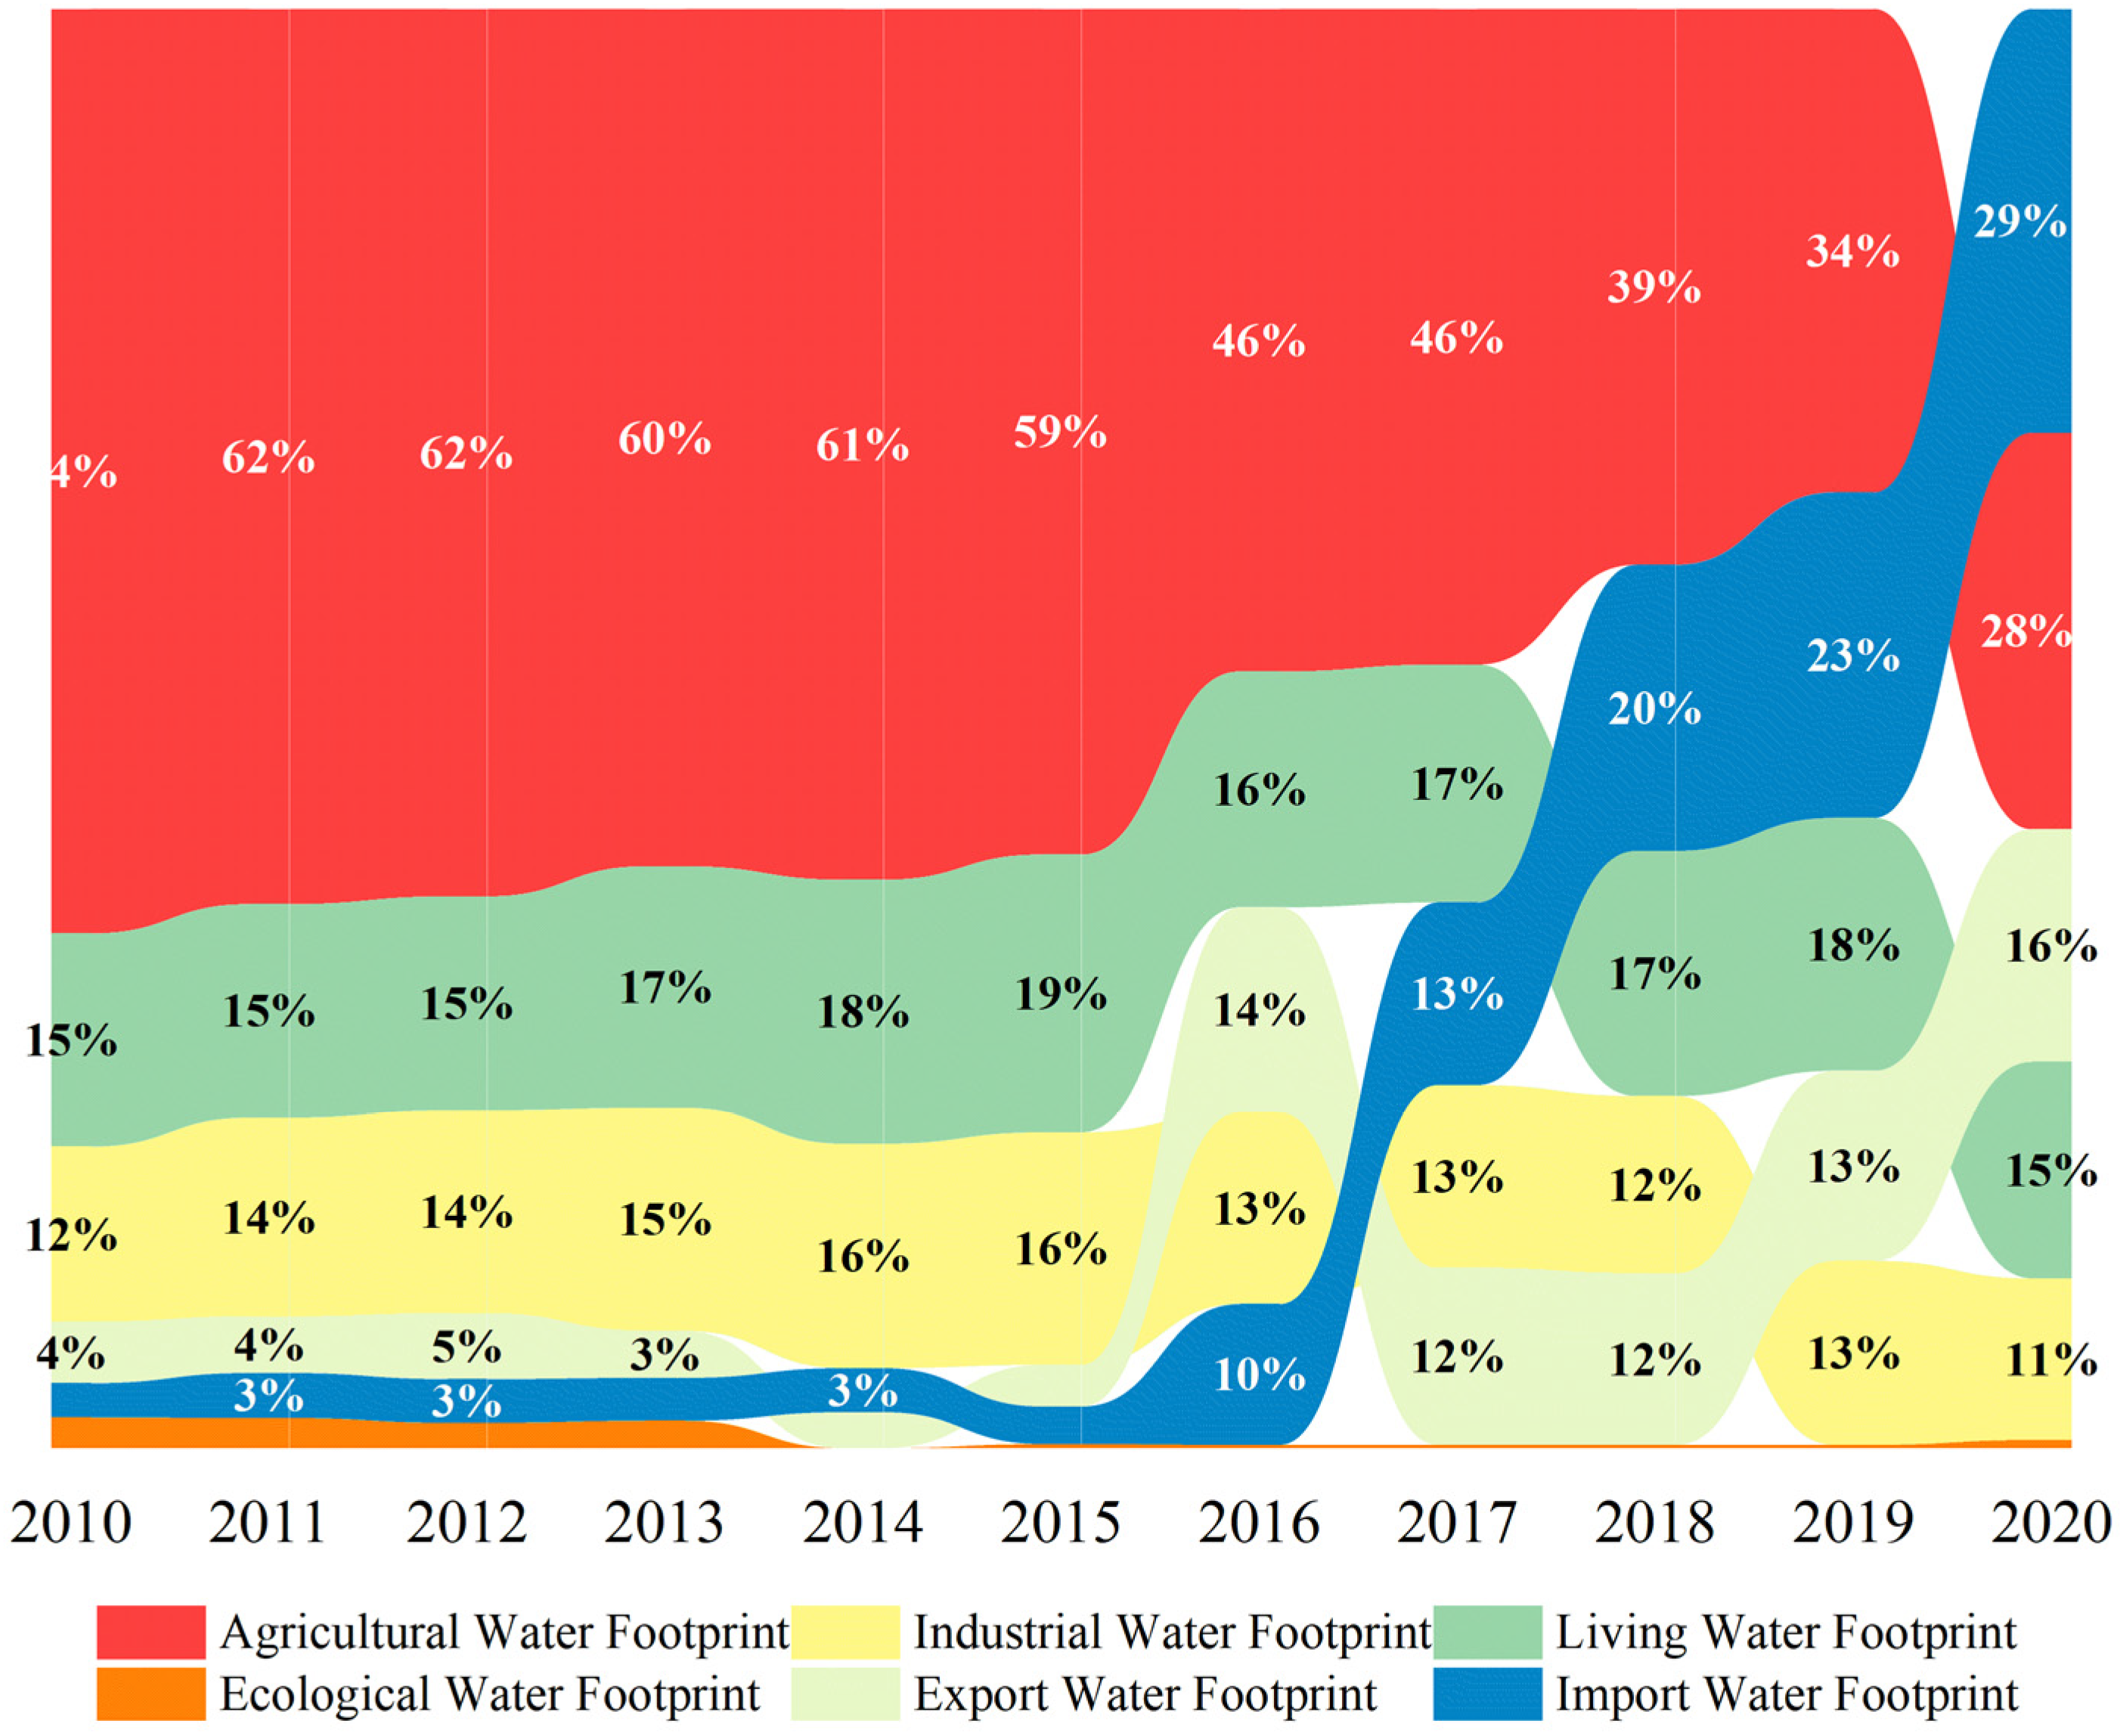
4.2. Analysis of Water Footprint Structure

From 2010 to 2020, the overall structure of Zhoushan City’s water footprint remained largely stable, with relatively minor fluctuations. The total water footprint was further segmented into six components: agricultural water footprint, industrial water footprint, domestic water footprint, ecological water footprint, export water footprint, and import water footprint. Figure 3 reveals significant changes in the agricultural water footprint, import water footprint, and export water footprint.
The agricultural water footprint consistently accounted for an average of 49.4% of the total water footprint. Although its proportion within the total water footprint decreased during the 2010–2020 period, it still constituted the majority. Within this category, fruit water footprint accounted for 38.70%, while the water footprint of aquatic products represented 19.85%. Considering the geographical features of Zhoushan City, characterized by multiple islands, the fishing industry holds a prominent position and contributes to 29.11% of the total fishery production in Zhejiang Province. This explains why the water footprint of aquatic products is the second largest after that of fruits.
While the import and export water footprints constitute a relatively small portion of the total water footprint, both experienced a notable increase in 2016. This change is closely linked to the formal commissioning of the Second Phase of the Mainland Water Diversion Project in Zhoushan in 2016. Daily water diversion increased from the initial 80,000 tons per day to 250,000 tons per day, relieving local water resource pressures. This improvement created a more favorable development environment for local industries, and the increase in trade volume led to a corresponding rise in import and export water footprints. From 2010 to 2017, Zhoushan City’s export trade exceeded its import trade. However, starting in 2018, Zhoushan City fully leveraged its status as an experimental free trade zone and vigorously promoted import trade. Imported goods primarily consisted of petroleum and iron ore, resulting in the import of virtual water surpassing the export of virtual water. The industrial water footprint of Zhoushan City was lower than its agricultural water footprint, with relatively stable year-to-year variations. On average, it accounted for 16.5% of the total water footprint. The domestic water footprint showed an upward trend, though the changes were not substantial. The ecological water footprint exhibited a declining trend. In 2010, ecological water usage was 8.15 million m3, reduced to 2.63 million m3 by 2020, marking a 67.73% decrease. This indicated that the decrease in water input for the construction of an ecological environment had led to substantial pressure.

4.3. Water Resource Utilization Assessment

This paper evaluates the utilization of water resources in Zhoushan City through an analysis of water footprint efficiency, ecological security, and sustainability. Water footprint efficiency refers to the spatial distribution of water footprint per capita, per unit of economic output, and per unit of consumption within a region, as well as the proportion of wastewater discharge relative to the water footprint. Influencing factors encompass economic development level, industrial structure, urbanization, and more [22,37,38,39,40,41,42]. This study investigates water footprint efficiency from both internal and external perspectives. The ecological security of water resources is analyzed from an ecological standpoint, considering water scarcity and indices of water resource pressure. The sustainability analysis of a water footprint combines three indicators: water footprint growth index, available water resource growth index, and water resource sustainability index, providing an assessment of the current status and capacity of water resource sustainability in Zhoushan City.

4.3.1. Analysis of Water Footprint Efficiency

Table 4 reveals that the population density per ten thousand tons of water footprint in Zhoushan City has experienced slight fluctuations over the years, generally hovering around 33.90 (10,000 tons per individual). However, for consumption and production, the population supplied by ten thousand tons of water resources in Zhoushan City is significantly lower than in other regions [43]. The water footprint land density did not exhibit notable changes between 2010 and 2020, averaging approximately 1.54 thousand m3/km2. Water footprint economic efficiency, aside from a slight decline between 2016 and 2017, has predominantly shown an upward trend, increasing by approximately 1.5 times. This indicates a continuous improvement in the economic output of water resources and an enhanced utilization rate. Zhoushan City’s tertiary industry accounts for 53.16%, with rapid recent growth in sectors such as marine tourism, catering, accommodation, and related industries. In comparison to primary and secondary industries, the tertiary industry can achieve higher economic returns with a relatively small water resource consumption, significantly boosting regional water footprint efficiency.
The net water footprint trade witnessed a declining trend from 2016 to 2020, which can be attributed to Zhoushan City’s introduction of external water resources to supplement its local water resources. Between 2010 and 2016, Zhoushan City primarily engaged in the export of local virtual water, but from 2016 to 2020, it became a net importer of water footprint trade, indicating an inflow of water resources from external regions. Similarly, Zhoushan City’s water resource contribution rate shows a parallel trend with the net trade of the water footprint. From 2017 to 2020, the contribution rate of external water resources became negative, highlighting a significant dependence on internal water resources supply in the structure of Zhoushan City’s water usage.

4.3.2. Analysis of Water Resource Ecological Security

Zhoushan City experiences significant variations in water scarcity, with an average scarcity index of 0.42. Figure 4 illustrates a negative correlation between water scarcity and the total water resources. In years with higher total water resources, the water scarcity index is lower. Notably, during five years within the period of 2010–2011, 2013–2014, and 2018, the total water resource was relatively small, averaging 646 million m3, resulting in a water scarcity index exceeding 0.4 [44]. The year 2011 recorded the highest water scarcity index, with Zhoushan City receiving 1096.40 mm of precipitation, which was 14% lower than the annual average. This year also had the lowest total water resource during the study period, leading to its classification as a biased year. The year 2019 marked the lowest water scarcity index, with a total water resource of 1.5036 billion m3, an increase of 1.07773 billion m3 compared to 2011. Additionally, precipitation was 47.8% higher than the annual average, making it an abundant water year.
The curves of the water scarcity index and water resource pressure index in Zhoushan City closely coincide, indicating that in virtual water trade, the proportion of export water footprint is relatively small. Both indices exceed the critical development threshold of 0.4 [44]. The situation of water resource ecological security in Zhoushan City is not optimistic; it is in a state of overload. However, both indices show a declining trend, suggesting that in recent years, the Zhoushan government has implemented relatively effective measures for water resource management. Nevertheless, due to the limited total water resources available in Zhoushan City, external water supplementation is still necessary. Zhoushan City should continue to focus on the rational allocation and optimization of water resources. This can be achieved by optimizing the structure of product import and export, reducing the consumption of internal water resources, relying on imported virtual water, and improving water resource utilization to alleviate water supply pressure.

4.3.3. Analysis and Evaluation of Water Footprint Sustainability

The analysis of water footprint sustainability pertains to the study of the current state of regional water resource development and utilization, water resource characteristics, and their interrelationships. This analysis not only contributes to the enhancement and supplementation of the theoretical framework for sustainable development but also serves as a reference for government policies and planning related to water resource allocation, management, and industrial structure adjustments [45]. The important indicators for assessing the sustainability of water resources include the water footprint growth index, available water resource growth index, and water resource sustainability index. When the product of the water footprint growth index and the available water resource growth index is less than 0, it indicates an absolute judgment state, and there is no need to consider the water resource sustainability index. However, when the product of the water footprint growth index and the available water resource growth index is greater than 0, the assessment of sustainability status should be performed in conjunction with the water resource sustainability index. The assessment method and results are illustrated in Figure 4.
Figure 5 and Table 5 reveals that the water footprint growth index was positive during the years 2013–2016 and 2019, whereas it was negative in other years. This indirectly indicates that while the total water footprint in Zhoushan City is not extensive, it has experienced notable fluctuations over the years. The available water resource growth index displays substantial variations, with both positive and negative values, although negative values predominate. This suggests that Zhoushan City’s water environment is relatively fragile and highly susceptible to climate impacts, resulting in unstable water resources. The overall level of water resource sustainability in Zhoushan City is relatively low, with the peak occurring in 2016. In that year, there was a significant amount of rainfall, making it a wet year with abundant water resources. Furthermore, in 2016, Zhoushan City undertook various ecological and environmental remediation projects, including temporary suspensions or shutdowns of heavily polluting industries in agriculture and manufacturing. These measures significantly contributed to addressing environmental pollution and emphasizing the importance of ecological preservation, ultimately leading to a healthier water environment.
Taking into account the assessment process and sustainability indicators for Zhoushan City’s water resources, it can be concluded that the years 2011–2013, 2017–2018, and 2020 were characterized by an unsustainable state, accounting for more than half of the study period. It is worth noting that in recent years, there has been a reduction in the unsustainable status, indicating that Zhoushan City is gradually improving its structure of water usage, adjusting the utilization rates of water resources across various industries, and mitigating the unsustainable state of water resources.

4.4. Analysis of Water Footprint Driving Factors

Table 6 reveals that the technological factor holds the most significant weight among the driving factors of Zhoushan City’s water footprint, averaging 47.06%. The economic factor comes next, with an average proportion of 42.29%, while the population factor has the smallest driving influence, accounting for only 10.65%. Both the economic and technological factors show a consistent upward trend over the study period, whereas the population factor while experiencing some growth, has remained relatively stable in recent years.
The economic and population factors demonstrate positive driving effects. The permanent population of Zhoushan City remains relatively stable, averaging around 1.15 million people, and while there is a slight upward trend in domestic water consumption, the increase is minimal. Through a comparison between population effects considering only permanent residents and those including the added tourist population, the proportion increased from 2.98% to 10.65%. However, the overall proportion change in driving effects remained relatively small. Thus, the impact of the tourist population, due to its mobility and seasonality, has a relatively weak effect on Zhoushan City’s water resources. Therefore, population factors contribute to the growth of Zhoushan City’s water footprint, but their influence is relatively small. The primary reason for the increase in the water footprint is economic development, particularly the expansion of the aquatic industry. The industry of aquatic processing holds a crucial position in the economic development of Zhoushan City. Currently, many small-scale production enterprises primarily use water for washing and cooking, resulting in excessive water usage and the generation of a significant amount of wastewater. Since water resources in Zhoushan City are primarily utilized to support economic development, the economic effect is a key driving factor for changes in Zhoushan City’s water footprint.
The technological factor contributes an average annual rate of 47.06% and exhibits a negative driving effect. In recent years, the continuous improvement in the production technology of Zhoushan City’s secondary and tertiary industries has significantly reduced resource consumption, especially in wastewater recycling and treatment technology. This maximizes the efficiency of water resource utilization and reduces water resource consumption. Therefore, the technological factor plays a restraining role in the growth of Zhoushan City’s water footprint. The negative driving effect of the technological factor is greater than the positive driving effect of the economic and population factors, resulting in an overall negative effect. Consequently, the total water footprint of Zhoushan City remains relatively stable and shows a declining trend in some years.
The socioeconomic and technological advancements in Zhoushan City can benefit from insights gleaned from the water footprint driving factors. Both residents and tourists should adhere to water conservation initiatives, heeding the government’s call and beginning with small lifestyle changes that can contribute significantly to water conservation. While industrial enterprises should prioritize profitability, they must also emphasize water efficiency. By integrating cutting-edge production and processing methods, these enterprises can achieve a balance between water conservation and economic benefits. The Zhoushan government could bolster the growth of novel technologies by actively introducing talent-friendly policies, enhancing the living standards for tech professionals, and fostering swift progress in water conservation techniques in the city. Such measures could significantly enhance the water resource landscape in Zhoushan City.

5. Conclusions

Zhoushan serves as a crucial maritime gateway for river–sea transportation and the Yangtze River Delta. Water resources play a vital role in limiting its sustainable socioeconomic development. A thorough analysis of water resource utilization in Zhoushan holds significant importance for the scientific management of these resources and the harmonization of economic development with water resource utilization.
(1)
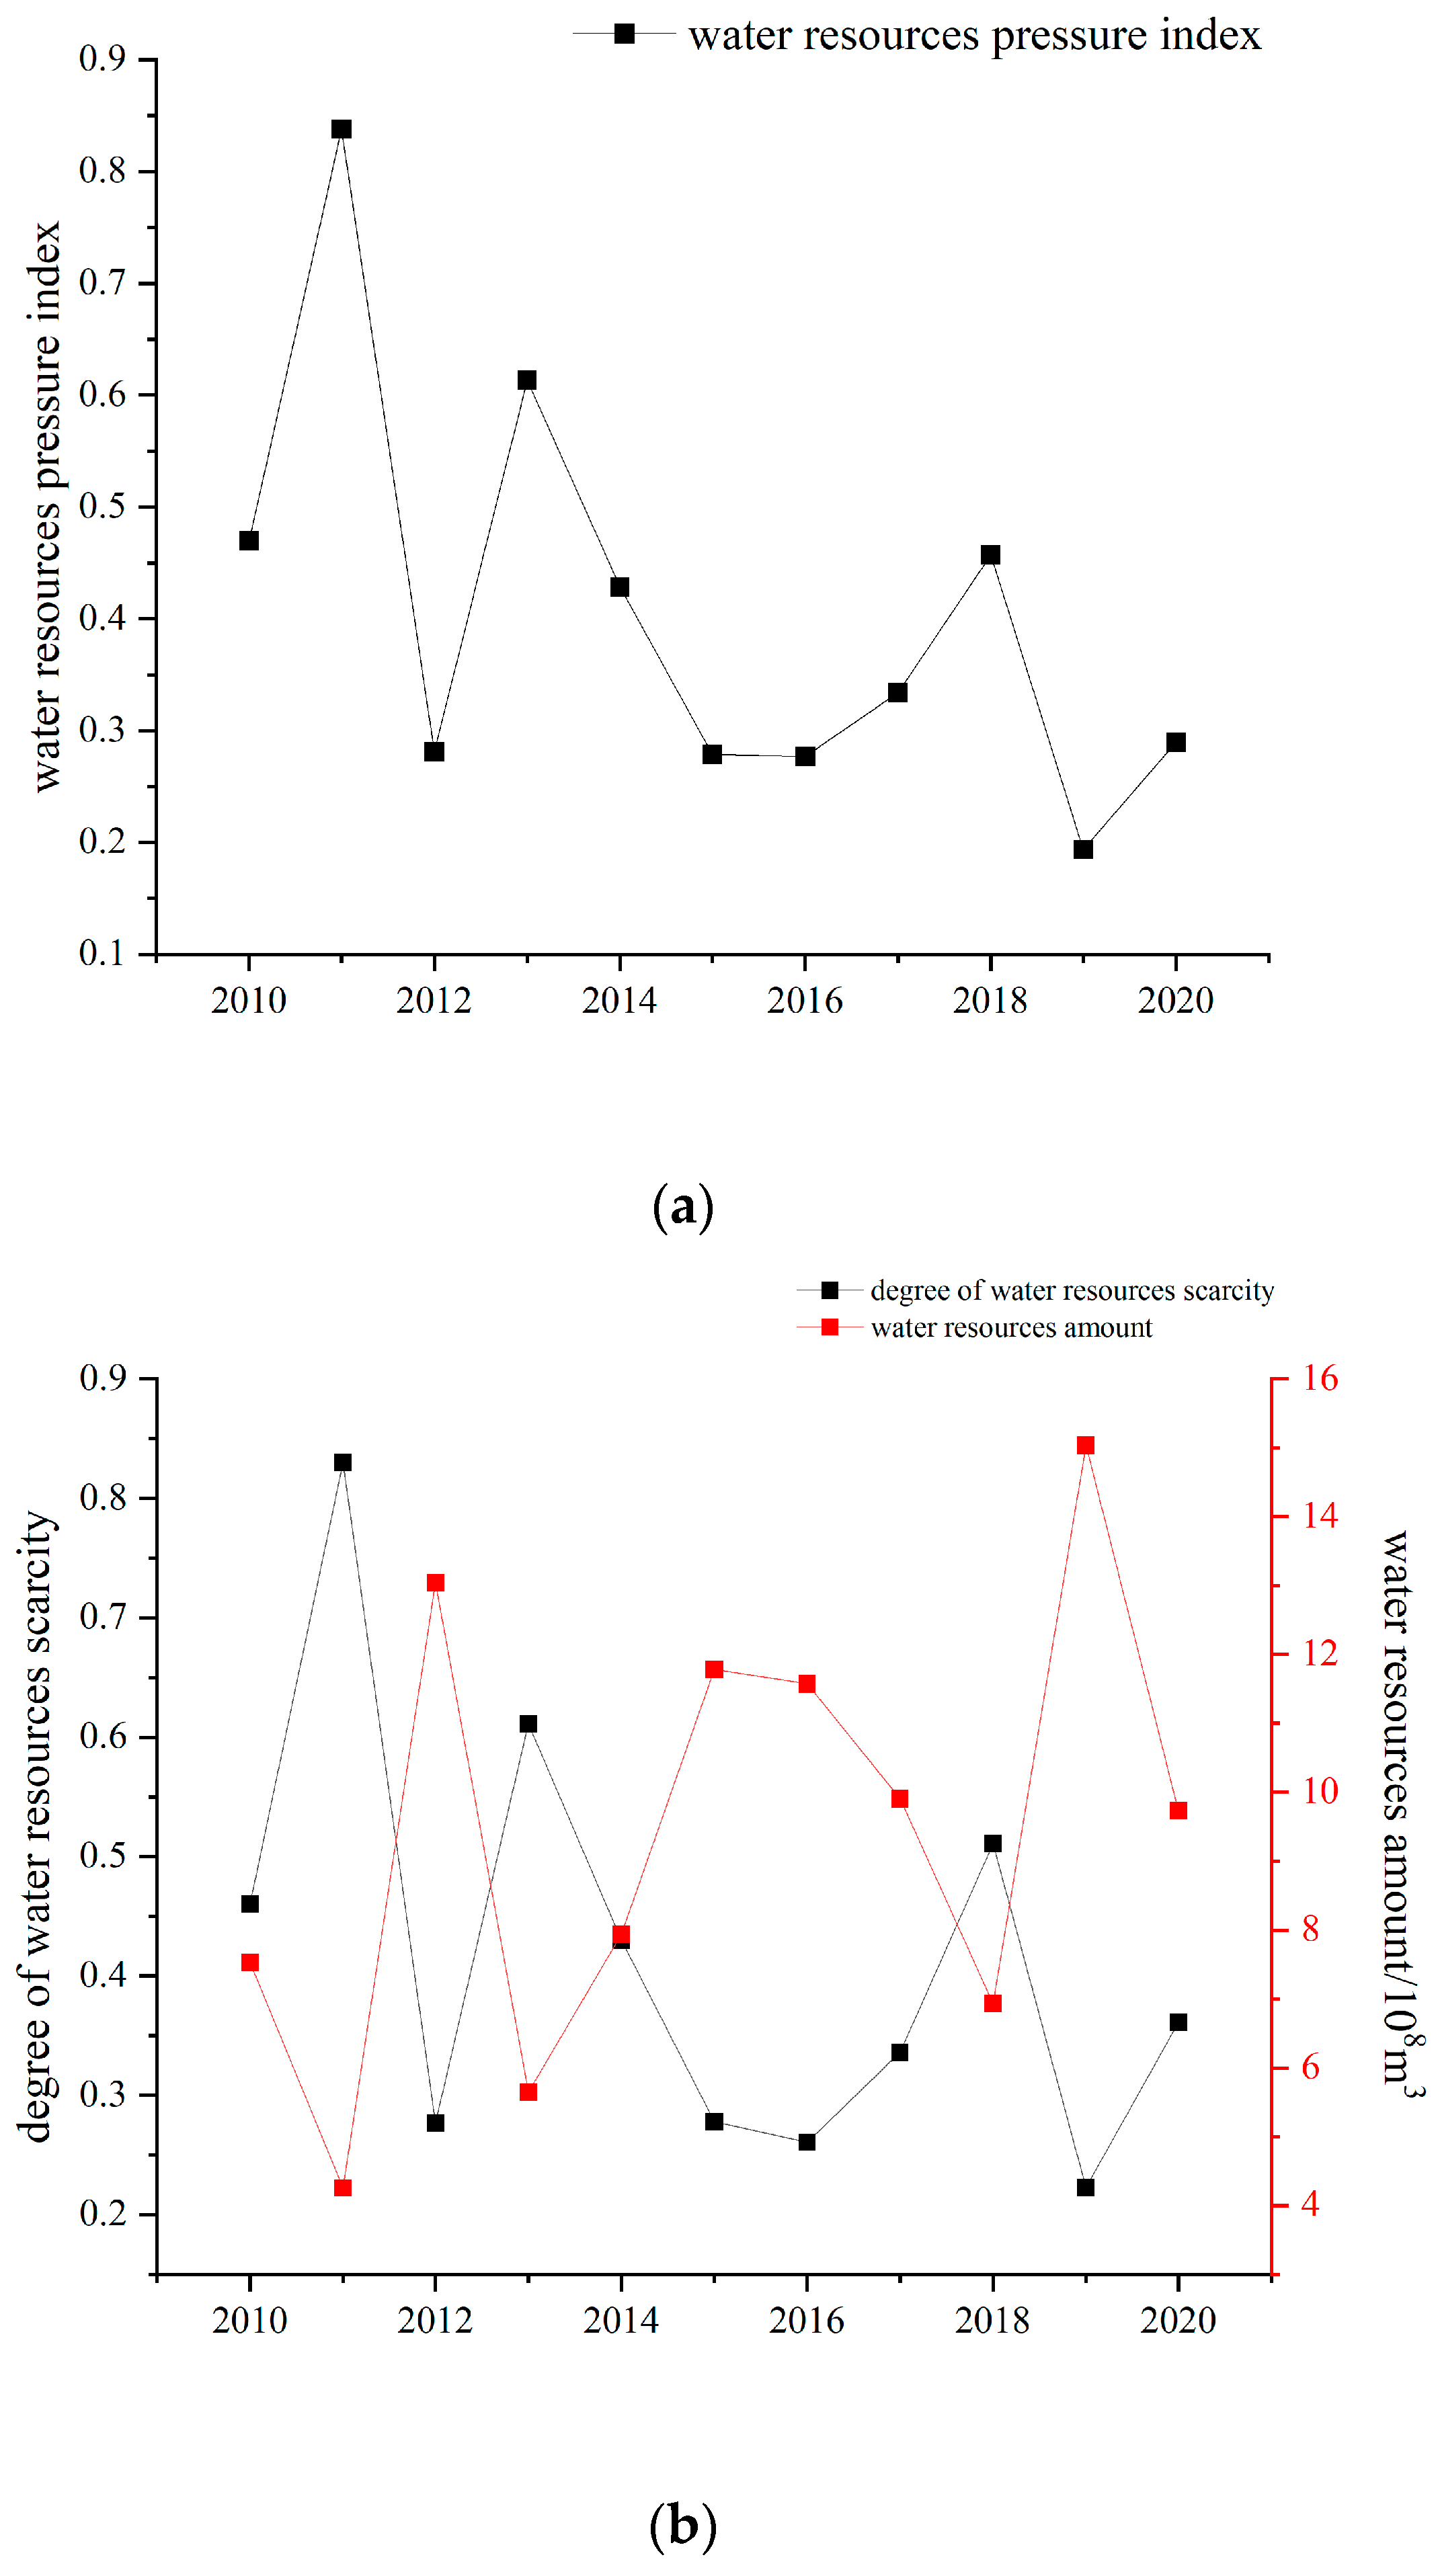
Based on the WFT analysis, it is observed that the total water footprint of Zhoushan City has experienced minimal changes, while the internal structure has undergone significant transformations in recent years. This reflects the city’s frequent exchange of water resources with the external environment, indicating a close correlation with Zhoushan’s economic development. The water scarcity index and pressure index consistently exhibit a fluctuating downward trend, with 45% of the years surpassing the 0.4 threshold for water resource development and utilization. The average values for these indices are 0.42 and 0.41, respectively, signifying a considerable risk to the ecological security of water resources. The trade structure was found to be imbalanced, with the water footprint of exported products exceeding that of imported ones. To address this issue, it is crucial to rigorously control the virtual water content of both imported and exported products, striving for higher imports of virtual water compared to exports. To alleviate local water resource pressure, several measures can be taken, including optimizing the industrial structure, improving water use efficiency in the primary sector, promoting water-saving agricultural practices, adopting cleaner production methods in the secondary sector, emphasizing recycling and sustainable development, and implementing a service-oriented approach in the tertiary sector, particularly in the use of drinking and domestic water. Changing consumption patterns and launching widespread water-saving campaigns are also essential steps to mitigate local water resource pressure and ensure the sustainable utilization of water resources in Zhoushan while safeguarding ecological security.
(2)
According to the LMDI model, the factor decomposition indicates that technological effects have the greatest impact, followed by economic effects and population effects. Technological factors emerge as the decisive and counteractive driving factor, contributing to a substantial 47.06% of the total impact and playing a pivotal role in decreasing Zhoushan’s total water footprint. Conversely, economic and population effects, acting as positive driving factors, exhibit the smallest contributions, underscoring that rapid economic growth and population expansion are intensifying water resource pressures in the region. In the course of development, Zhoushan should harness the counteractive influence of technological factors to curtail the growth of the water footprint. Achieving this necessitates the vigorous development and adoption of water-saving technologies, along with enhancements in the utilization efficiency of water resources within production. Moreover, in addition to improving the efficiency of introducing and utilizing external water resources in nearshore regions, it is crucial to extend internal water resource development and utilization technologies to offshore areas. This strategy enables Zhoushan to strike a balance between the efficient utilization and distribution of both external and internal water resources, ensuring sustainability while effectively harnessing external water resources.
(3)
This study employs a quantitative analysis by integrating WFT and the LMDI model to evaluate water resource utilization in Zhoushan City. The objective assessment reveals the primary driving factors influencing the sustainability of water resource utilization in Zhoushan City, offering valuable insights for formulating practical strategies in water resource management. However, considering the multitude of aspects within the water system, this study focuses on areas closely linked to urban development, yet there are additional directions beyond those outlined. In future research, the evaluation scope of the water system can be broadened, and the selection of water resource evaluation indicators can be further diversified and refined. With the ongoing evolution of the evaluation system, novel models and methods for water system evaluation are emerging. Subsequent research can explore different models to decompose and evaluate Zhoushan’s water system, aiming to develop evaluation methods that accentuate the unique features of water resource utilization in island regions.

6. Suggestion

  • Zhoushan City should continue to focus on the rational allocation and optimization of water resources. This can be achieved by optimizing the structure of product import and export, reducing the consumption of internal water resources, relying on imported virtual water, and improving water resource utilization to alleviate water supply pressure.
  • Zhoushan City should gradually improve its structure of water usage, adjusting the utilization rates of water resources across various industries, and mitigating the unsustainable state of water resources.
  • The Zhoushan government could bolster the growth of novel technologies by actively introducing talent-friendly policies, enhancing living standards for tech professionals, and fostering swift progress in water conservation techniques in the city. Such measures could significantly enhance the water resource landscape in Zhoushan City.

Author Contributions

Writing—review and editing, J.F.; writing—original draft, C.G.; investigation, S.L.; data curation, L.W.; funding acquisition, F.G.; supervision, S.Z.; investigation, B.Z. All authors have read and agreed to the published version of the manuscript.

Funding

National Key Research and Development Program of China (2017YFA0604902).

Data Availability Statement

Data are contained within the article.

Conflicts of Interest

Author Bin Zhang was employed by the company Ningbo Zhoushan Port iron ore storage and transportation Co., Ltd. The remaining authors declare that the research was conducted in the absence of any commercial or financial relationships that could be construed as a potential conflict of interest.

References

  1. Zhang, G.P.; Hoekstra, A.Y.; Mathews, R.E. Water Footprint Assessment (WFA) for better water governance and sustainable development. Water Resour. Ind. 2013, 1, 1–6. [Google Scholar] [CrossRef]
  2. Liu, Z.; Fan, Y.; Liu, M.; Yin, Z.; Li, X.; Yin, L.; Zheng, W. Remote sensing and geostatistics in urban water-resource monitoring: A review. Mar. Freshw. Res. 2023, 74, 747–765. [Google Scholar] [CrossRef]
  3. National Bureau of Statistics of China. China Statistical Yearbook; China Statistic Press: Beijing, China, 2020. (In Chinese)
  4. Zhoushan Water Resources Bureau. Zhoushan Statistical Yearbook; China Statistic Press: Beijing, China, 2022. (In Chinese)
  5. Xu, X.Y.; Li, Y.L.; Li, J.Q.; Li, Y.Y. Study on the development, utilization and protection of island water resources. China Water Resour. 2020, 23, 44–46. [Google Scholar]
  6. Allan, J.A. Fortunately there are substitutes for water otherwise our hydro-political futures would be impossible. Priorities Water Resour. Alloc. Manag. 1993, 13, 26. [Google Scholar]
  7. Antonelli, M.; Sartori, M. Unfolding the potential of the virtual water concept. What is still under debate? Environ. Sci. Policy 2015, 50, 240–251. [Google Scholar] [CrossRef]
  8. Chapagain, A.K.; Hoekstra, A.Y. Virtual Water Trade: Aquantifcation of Virtual Water Flows between Nations Inrelation to International Trade of Livestock and Livestock Products. In Virtual Water Trade Proceedings of the International Expert Meeting on Virtual Water Trade, Value of Water Research Report Series; Hoekstra, A.Y., Ed.; No. 12; UNESCO-IHE: Delft, The Netherlands, 2003. [Google Scholar]
  9. Hoekstra, A.Y. The Water Footprint of Modern Consumer Society; Routledge: London, UK, 2013. [Google Scholar]
  10. Hoekstra, A.Y.; Chapagain, A.K. Globalization of Water: Sharing the Planet’s Freshwater Resources; Blackwell Publishing: Oxford, UK, 2008. [Google Scholar]
  11. Hoekstra, A.Y.; Chapagain, A.K.; Aldaya, M.M.; Mekonnen, M.M. The Water Footprint Assessment Manual: Setting the Global Standard; Earthscan: London, UK, 2011. [Google Scholar]
  12. Zhang, F.F.; Zhang, Q.N.; Li, F.D.; Fu, H.Y.; Yang, X.H. The spatial correlation pattern of water footprint intensity and its driving factors in China. J. Nat. Resour. 2019, 34, 934–944. [Google Scholar] [CrossRef]
  13. Sun, C.Z.; Wang, Z.H. Driving factors for virtual water trade of agricultural products between China and countries along “Belt and Road”. J. Econ. Water Resour. 2020, 38, 1–7+28+85. [Google Scholar]
  14. Jang, W.Q.; Li, X.Y.; Liu, C.J.; Sun, Q. Impact of residents’ diet changes on water resource demand in China: From the perspective of nutritional balance. Resour. Sci. 2021, 43, 1662–1674. [Google Scholar] [CrossRef]
  15. Wang, H.; Small, M.J.; Dzombak, D.A. Factors Governing Change in Water Withdrawals for U.S. Industrial Sectors from 1997 to 2002. Environ. Sci. Technol. 2014, 48, 3420–3429. [Google Scholar] [CrossRef]
  16. Li, W.; Wen, H.; Nie, P. Prediction of China’s Industrial Carbon Peak: Based on GDIM-MC Model and LSTM-NN model. Energy Strategy Rev. 2023, 50, 101240. [Google Scholar] [CrossRef]
  17. Wu, B.; Quan, Q.; Yang, S.; Yang, D. A social-ecological coupling model for evaluating the human-water relationship in basins within the Budyko framework. J. Hydrol. 2023, 619, 129361. [Google Scholar] [CrossRef]
  18. Vaninsky, A. Factorial decomposition of CO2 emissions: A generalized Divisia index approach. Energy Econ. 2014, 45, 389–400. [Google Scholar] [CrossRef]
  19. Zheng, J.W.; Sun, C.Z. Driving factors of China’s water resources flow pattern based on MRIO and GTWR. Sci. Geogr. Sin. 2023, 43, 1837–1850. [Google Scholar]
  20. Ang, B.W. Decomposition analysis for policymaking in energy: Which is the preferred method? Energy Pol. 2004, 32, 1131–1139. [Google Scholar] [CrossRef]
  21. Hao, Q.T.; Huang, M.X.; Bao, G. Study on Carbon Emission Calculation Methods Overview and Its Comparison. Chin. J. Environ. Manag. 2011, 4, 51. [Google Scholar]
  22. Ang, B.W. The LMDI approach to decomposition analysis: A practical guide. Energy Policy 2005, 33, 867–871. [Google Scholar] [CrossRef]
  23. Xi, H.; Cui, W.; Cai, L.; Chen, M.; Xu, C. Evaluation and prediction of ecosystem service value in the Zhoushan Islands based on LUCC. Sustainability 2021, 13, 2302. [Google Scholar] [CrossRef]
  24. Chen, J.; Pan, D.; Mao, Z.; Chen, N.; Zhao, J.; Liu, M. Land-Cover Reconstruction and Change Analysis Using Multisource Remotely Sensed Imageries in Zhoushan Islands since 1970. J. Coast. Res. 2014, 294, 272–282. [Google Scholar] [CrossRef]
  25. Gu, H.; Guo, Q.; Lin, P.; Bai, L.; Yang, S.; Sitharam, T.G.; Liu, J. Feasibility study of coastal reservoirs in the Zhoushan Islands, China. J. Coast. Res. 2018, 35, 835. [Google Scholar] [CrossRef]
  26. Compilation Committee of China’s Island Records. China’s Island Records; Zhejiang Volume. Volume 2, Southern Part of Zhoushan City; Ocean Press: Beijing, China, 2014. [Google Scholar]
  27. Liu, C.H.; Jin, W.L.; Sun, Y.J.; Kang-li, C.H.E.N. Evaluation of Water Resources Utilization in the Taihu Basin from the Perspective of Water Footprint. China Rural. Water Hydropower 2022, 8, 70–77. [Google Scholar]
  28. Zeng, W.; Qiu, Y.L.; Cao, X.C. Driving forces of agricultural water use change in Jiangsu Province based on water footprint and LMDI. Jiangsu Water Resour. 2021, 12, 28–35. [Google Scholar]
  29. Hoekstra, A.Y. The Water Footprint Assessment Manual Setting the Global Standard; Science Press: Beijing, China, 2012. [Google Scholar]
  30. Chapagain, A.K.; Hoekstra, A.Y. Water Footprints of Nations. J. Bank. Financ. 2004. Available online: https://research.utwente.nl/en/publications/water-footprints-of-nations (accessed on 21 January 2024).
  31. Sun, C.Z.; Zhang, L. Changes in Spatial and Temporal Differences of Agricultural Product Virtual Water Versus Cultivated Land in China. Resour. Sci. 2009, 31, 84–93. [Google Scholar]
  32. Chapagain, A.K.; Hoekstra, A.Y. Water Footprints of Nations; Value of Water Research Report Series No.16; UNESCO-IHE: Delft, The Netherlnds, 2004. [Google Scholar]
  33. Shang, Q.K.; Yin, K.X.; Mi, W.B. Assessing water resources in Qinghai province based on theory of water footprint. J. Arid. Land Resour. Environ. 2020, 34, 70–77. [Google Scholar]
  34. Ang, B.W.; Zhang, F.Q.; Choi, K.-H. Factorizing changes in energy and environmental indicators through decomposition. Energy 1998, 23, 489–495. [Google Scholar] [CrossRef]
  35. Ding, L. Influencing Factors Decomposition of Industrial Air Pollutants Emissions in Zhejiang Province Based on LMDI. Sci-Tech Innov. Product. 2022, 8, 56–63. [Google Scholar]
  36. Li, J.; Wang, Z.; Wu, X.; Xu, C.Y.; Guo, S.; Chen, X. Toward Monitoring Short-Term Droughts Using a Novel Daily-Scale, Standardized Antecedent Precipitation Evapotranspiration Index. J. Hydrometeorol. 2020, 21, 891–908. [Google Scholar] [CrossRef]
  37. Qi, R.; Geng, Y.; Zhu, Q.H. Evaluation of Regional Water Resources Utilization Based on Water Footprint Method. J. Nat. Resour. 2011, 26, 486–495. [Google Scholar]
  38. Zhang, Y.; Huang, K.; Yu, Y.; Hu, T.; Wei, J. Impact of climate change and drought regime o ater footprint of crop production: The case of Lake Dianchi Basin, China. Nat. Hazard. 2015, 79, 549–566. [Google Scholar] [CrossRef]
  39. Paolo, M.P.; Leo, D.; Federica, T.P. Environmental Kuznets curve and the water footprint: An empirical analysis. Water Environ. J. 2016, 1, 1–11. [Google Scholar]
  40. Ali, A.B.; Hong, L.; Elshaikh, N.A.; Haofang, Y. Assessing impacts of water harvesting techniques on the water footprint of sorghum in Western Sudan. Outlook Agric. 2016, 45, 185–191. [Google Scholar] [CrossRef]
  41. Yang, Z.W.; Liu, H.L.; Xu, X.Y.; Yang, T.T. Applying the water footprint and dynamic structural decomposition analysis on the growing water use in China during 1997–2007. Ecol. Indic. 2016, 60, 634–643. [Google Scholar] [CrossRef]
  42. Zhu, Q.R.; Yang, L.; Liu, X. Water footprint of China’s export trade and trade structure optimization. Quant. Econ. Technol. Econ. Res. 2016, 12, 42–60. [Google Scholar]
  43. Yuan, C.; Li, Q.; Nie, W.; Ye, C. A depth information-based method to enhance rainfall-induced landslide deformation area identification. Measurement 2023, 219, 113288. [Google Scholar] [CrossRef]
  44. Xie, X.M.; Zhang, T.T.; Wang, M.; Huang, Z. Impact of shale gas development on regional water resources in China from water footprint assessment view. Sci. Total Environ. 2019, 679, 317–327. [Google Scholar] [CrossRef]
  45. Wang, W.; Zhuo, L.; Li, M.; Liu, Y.L.; Wu, P.T. The effect of development in water–saving irrigation techniques on spatial–temporal variations in crop water footprint and benchmarking. J. Hydrol. 2019, 577, 1–13. [Google Scholar] [CrossRef]
Figure 1. Location map of the study area (original).
Water 16 00385 g001
Figure 2. Water footprint of Zhoushan City from 2010 to 2020.
Water 16 00385 g002
Figure 3. Water footprint structure map of Zhoushan City from 2010 to 2020.
Water 16 00385 g003
Figure 4. (a) Water resources pressure index of Zhoushan City from 2010 to 2020; (b) water resource ecological security index of Zhoushan City from 2010 to 2020.
Water 16 00385 g004
Figure 5. Water resource sustainability diagram of Zhoushan City.
Water 16 00385 g005
Table 1. Virtual water content per unit of agricultural products.
ProductGrainCottonVegetableFruitPork
Virtual water content (m3/kg)1.134.980.112.21
ProductBeefMuttonPoultry eggAquatic product
Virtual water content (m3/kg)12.565.23.555
Table 2. Evaluation index system of water resources utilization in Zhoushan City.
Evaluation Structure Evaluation IndicatorsCalculation EquationBasic Meaning
Water footprint structure Self-sufficiency rate of water resources/% (WSS)(WI/WT) × 100%Degree of local water resource utilization. Reflects the extent to which a region uses local water resources: the greater the percentage, the more dependent the region is on its own water resources.
Water resource import dependency/% (WD)(WE/WT) × 100%Dependency on external water resources. Reflects the extent to which a region is dependent on external water resources: the greater the percentage, the greater the region’s dependence on imported water resources.
Water footprint benefitsIndicators of internal benefitWater footprint population density per ten thousand tons/(10,000 tons per individual)P/WTPopulation supported by water footprint. Reflecting the number of populations supplied by the regional water footprint of 10,000 tons, the higher the index, the more population supported by the regional water footprint, and the more effective force played by water resources in the region
Water footprint economic benefits/(CNY/m3)G/WTEconomic efficiency of water resource utilization reflects the level of economic benefits brought by water footprint consumption, the higher the index value, the greater the economic benefits generated by water footprint in the region, and the higher the level of water resources utilization.
Water footprint land density/(m3/km2)WT/ALand area covered by water footprint. The higher the index, the greater the water resources consumed per unit area.
Indicators of external benefit Net water footprint trade /100 million m3Wex − WEWater resource trade.
Water resource contribution rate/%(Wex − WE)/WAContribution to water resources in other regions. It indicates the contribution level of available water resources in the region (outside the region) to water resources consumption in other regions (within the region).
Water resource ecological security Water resource scarcity index (WS)/%(WT/WA) × 100%Water resource scarcity. It reflects the shortage of water resources.
Water resource pressure index (WP)/%(WI + Wex)/WA × 100%Effect intensity on available water resources. It reflects the effect of water demand for products and services produced in a region on the amount of available water resources.
Water footprint sustainability Water footprint growth index (WFPR)/%(W1 − W0)/W0Change in regional water usage. It reflects the change in amplitude of regional water resources consumption in a certain period, and its magnitude indicates the speed of regional water footprint increase or decrease.
Available water resource growth index (WAR)/%(WA1 − WA2)/WA1Change in regional available water resources. It reflects the change range of regional available water resources in a certain period, and its magnitude indicates the speed of the increase and decrease in regional available water resources.
Water resource sustainability index (WSI)|WFPR|/|WAR|Sustainability of regional water resource utilization. Quantification reflects the sustainable utilization capacity of water resources in a region
Note: WSS represents the self-sufficiency rate of water resources, WD represents the water resource import dependency, WS represents the water resource scarcity index, WP represents the water resource pressure index, WFPR represents the water footprint growth index, WAR represents the available water resource growth index, WSI represents the water resource sustainability index, WA represents the total available regional water resources, WA2 represents the available water resources for the last year, and WA1 represents the available water resources for the previous year.
Table 3. Composition of water footprint in Zhoushan City from 2010 to 2020 (108 m3).
YearAgricultural Water FootprintIndustrial Water FootprintDomestic Water FootprintEcological Water FootprintExport Water FootprintImport Water FootprintTotal Water Footprint
20102.430.460.560.080.160.093.46
20112.390.530.570.080.150.123.53
20122.450.560.590.070.180.123.61
20132.200.570.620.070.120.113.45
20142.180.560.660.000.090.113.41
20152.040.560.670.010.100.093.27
20161.940.560.690.010.600.413.02
20172.010.560.730.010.540.563.33
20181.790.570.790.010.550.923.54
20191.530.580.800.010.601.033.35
20201.430.580.780.030.841.533.52
Table 4. Benefits of the water footprint in Zhoushan City from 2010 to 2020.
YearInternal BenefitsExternal Benefits
Population Density for Ten Thousand Tons of Water Footprint/(10,000 Tons per Individual)Economic Efficiency of the Water Footprint/(CNY/m3)Water Footprint per Unit of Land Area/(m3/km2)Net Trade Value of the Water Footprint/100-million m3Contribution to Water Resources/%
201032.36175.921.560.070.94%
201132.17195.041.590.030.81%
201231.58209.431.630.060.45%
201333.20238.181.550.010.20%
201433.68259.481.54−0.01−0.16%
201535.31284.351.470.010.09%
201638.59356.741.360.191.64%
201735.20339.511.50−0.02−0.21%
201833.12352.141.60−0.37−5.36%
201934.77406.691.51−0.44−2.92%
202032.97430.121.58−0.70−7.17%
Table 5. Sustainable status of water resources in Zhoushan City from 2010 to 2020.
YearWater Footprint Growth Index (WFPR)Available Water Resource Growth Index (WAR)Water Resource Sustainability Index (WSI)Status
20110.02−0.430.05Unsustainable
20120.022.060.01Unsustainable
2013−0.04−0.57−0.08Unsustainable
2014−0.010.41−0.02Sustainable
2015−0.040.48−0.09Sustainable
2016−0.08−0.024.42Sustainable
20170.10−0.140.71Unsustainable
20180.06−0.300.22Unsustainable
2019−0.051.17−0.05Sustainable
20200.05−0.350.14Unsustainable
Table 6. Decomposition effect of the water footprint in Zhoushan City from 2011 to 2020.
YearPopulation FactorEconomic FactorTechnological FactorTotal
20110.470.38−0.360.49
20121.131.09−0.981.24
20131.942.02−2.011.95
20142.223.21−3.332.1
20152.444.47−4.882.03
20162.276.01−6.981.3
20171.458.25−9.550.15
20181.4910.87−12.290.07
20192.0813.18−14.810.45
20201.1416.55−18.29−0.6
Average1.666.60−7.350.91
Proportion/%10.65%42.29%47.06%100%
Disclaimer/Publisher’s Note: The statements, opinions and data contained in all publications are solely those of the individual author(s) and contributor(s) and not of MDPI and/or the editor(s). MDPI and/or the editor(s) disclaim responsibility for any injury to people or property resulting from any ideas, methods, instructions or products referred to in the content.

