Abstract
Policy guidance is a key driving force for improving the business performance of marine resource enterprises. This study establishes a DEA-fsQCA model, selects 42 listed marine resource enterprises as samples, analyzes the business performance improvement paths of marine resource enterprises, and proposes relevant policy recommendations for the government to guide marine resource enterprises to improve their business performance. The result shows that there are three different path models for the high business performance of marine resource enterprises based on their scale and property-right attributes: the “private green innovation” type, the “private green concentration” type, and the “state-owned incentive decentralized” type. According to the research results, this study suggests that, in the process of promoting the improvement of the business performance of marine resource enterprises, the Chinese government should promote the green development of enterprises, stimulate the technological innovation vitality of private marine resource enterprises, optimize enterprise executive incentive policies, and deepen the reform of mixed ownership in state-owned enterprises. Compared with previous studies, this article presents a fresh perspective on researching marine resource enterprises from a macro perspective and constructs a policy system for improving the business performance of different types of marine resource enterprises, providing valuable reference and guidance for the high-quality development of marine resource enterprises and the overall marine economy.
1. Introduction
Marine economic activities have been recognized as the key driving force for global economic growth in recent years [1]. The development level of the marine economy represents a country’s overall national strength [2,3]. As the micro-carriers of the marine industry, marine resource enterprises have a net expansionary effect on the marine economy [4]. Marine resource enterprises are involved in various sea-related activities and services, such as aquaculture, fisheries, marine transportation, and marine chemical engineering [5]. Improving the input–output efficiency and business performance of marine enterprises is of great significance for promoting the development of the marine economy [6]. However, due to the limitations of market regulation and the complexity of the marine economy, relying solely on the efforts of individual companies cannot effectively promote the sustainable development of marine resource enterprises. It is necessary for the government to play a guiding role by formulating relevant policies that encourage marine resource enterprises to improve their business performance and total factor productivity [7].
The 20th National Congress of the Communist Party of China proposed the strategic requirement of “building a maritime power”, which must promote the stable development of marine resource enterprises and unleash the blue vitality of our ocean. The 21st century Maritime Silk Road provides important opportunities and platforms for Chinese marine resource enterprises to strengthen their cooperation with other countries along the route [8]. The Chinese government has taken multiple proactive measures to promote the sustainable development of marine resource enterprises. However, the overall framework of China’s marine policy still needs further improvement to ensure a synergistic effect between environmental protection policy, research and development policy, talent policy, and equity policy, in order to adapt to the development of different types of marine resource enterprises. Therefore, regarding the government, how to identify the key factors that affect the improvement of business performance of marine resource enterprises, clarify the specific mechanisms behind these factors, and construct a comprehensive policy system that can improve the business performance of marine resource enterprises are the core issues that this study needs to address.
Currently, numerous scholars have confirmed the positive impact of government policy guidance on improving the performance of marine resource enterprises at a macro level [9,10], but there are still some research gaps. Firstly, existing research tends to analyze the economic performance, social performance, innovation performance, and environmental performance of marine resource enterprises separately, lacking exploration of the overall business performance of these enterprises [6,11,12]. In addition, in terms of research methods, existing studies often use multiple regression and fuzzy comprehensive evaluation methods to evaluate the performance of marine resource enterprises [6,13], which cannot objectively evaluate the performance of marine resource enterprises from the perspective of input–output. Secondly, previous research has focused on the impact of a single indicator on the performance of marine resource enterprises [14], without considering the interaction between indicators in terms of performance impact and policy formulation, making the research conclusions unconvincing. Finally, there are differences in business objectives, available resources, management values, and stakeholder participation among enterprises of different sizes and property-right attributes [15,16,17], and government policies can have varying degrees of impact on their operations [18,19,20]. However, current policy research is relatively general and does not classify marine resource enterprises based on their specific characteristics, resulting in a lack of targeted and differentiated policy recommendations.
Given the research gaps discussed above, this study establishes a DEA-fsQCA model, selects 42 listed marine resource companies as samples, analyzes the business performance improvement paths of marine resource companies, and proposes relevant policy recommendations for the government to guide marine resource companies to improve their business performance. This study aims to answer two key research questions: (1) What is the business efficiency level of marine resource enterprises? (2) What are the variables and configurations that affect the improvement of the business performance of marine resource enterprises? By answering the above questions, this article can not only help the government understand the current business performance status of marine resource enterprises, but also provide reference for the government to formulate relevant policies from the perspectives of environmental protection, R&D intensity, talent incentives, and equity structure. This is highly significant for propelling the steady and high-quality development of China’s marine economy and realizing the strategy of becoming a maritime power.
2. Materials and Methods
This study takes data of Chinese A-share-listed marine resource companies from 2019 to 2022 as samples. After eliminating ST (special treatment) companies, as well as those with missing data, extreme values, and abnormal values, the data of 42 companies were obtained.
ST refers to a company that has suffered losses for two consecutive years [21], and the extreme and abnormal value refers to a data point that significantly deviates from the rest of the observations in a dataset [22]. The operating data were obtained from the annual reports of listed marine resource companies. Due to the high volatility in the growth of A-share-listed companies, in order to improve the stability of the data, we use the average of the company’s four-year data to measure each variable.
2.1. Construction of DEA Model for Performance Evaluation of Marine Resource Enterprises
2.1.1. DEA Model
DEA is a mature, non-parametric (linear programming) method [23] that has been widely used in marine industry research to estimate a series of productivity indicators, such as marine green economy efficiency [24], the ecological efficiency (EF) of marine ranching [25], and the sustainable efficiency of the marine supply chain [26]. The basic principle of this method is mainly to determine the relatively effective production frontier through mathematical programming methods, while keeping the input or output of the decision-making unit (DMU) unchanged. Then, each decision unit is projected onto the production frontier of the DEA and evaluate its efficiency by comparing the degree to which the decision units deviate from the DEA frontier [27]. This method is suitable for evaluating the efficiency of decision-making units with multiple inputs and multiple outputs, providing information for decision-making subjects [28]. In this study, each sampled marine company is regarded as a production decision-making unit that transforms multiple inputs into multiple outputs. DEA’s rationale is to make a hypothesis that there are n decision-making units, each DMU has K inputs = (, , ,…, , = 1, 2,…, k) and outputs = (, , ,…, ), = 1, 2,…, , and the comprehensive business efficiency of the company is . The formula is as follows:
where is the weight of decision variables, is the relaxation variable of the th input, is the remaining variable of the th output, and is the non-Archimedes infinitesimal quantity.
The DEA-BCC model was initially introduced by Banker et al. (1984) [29]. In this study, we chose the DEA-BCC model to measure the business efficiency of marine resource enterprises for the following reasons: Firstly, the operational activities of enterprises involve various input and output factors, encompassing multiple variables and dimensions. The DEA-BCC method has unique advantages in relative effectiveness evaluation, as it does not require dimensionless data processing before model setup. Secondly, the DEA-BCC method does not require any weight assumptions, but instead obtains the optimal weights from the actual data inputs and outputs of the decision-making unit, eliminating many subjective factors. Thirdly, considering the research objectives and the operational characteristics of the marine industry, we assume that returns to scale are not fixed, allowing for variations in the scale of operations. Lastly, the core explanatory variable of this study is the business efficiency of marine resource enterprises. Drawing on the research conducted by Li et al. [30], the comprehensive efficiency derived from DEA-BCC analysis can serve as the outcome variable for subsequent model analysis. Therefore, the DEA-BCC method is the most suitable approach for measuring the business efficiency of marine resource enterprises [31,32].
2.1.2. Input and Output Indicators of DEA Model
When selecting input–output indicators for the business performance of marine resource enterprises, this study not only considers the correlation of input–output variables and the relationship between their diversity and validity, but also considers whether the selected indicators can achieve an objective and comprehensive evaluation of performance. Therefore, two principles should be followed when selecting input–output variables. Firstly, the selected variables should meet the requirements of performance evaluation for marine resource enterprises and can reflect their performance level scientifically. Secondly, from the management level, variables that can be controlled by management should be selected.
Through reviewing the literature, we found that scholars generally set input variables from three categories: manpower, financial resources, and physical resources [33]. And the selection of output variables is based on income and profit perspectives [34]. Considering the availability of data on marine resource enterprises, we selected five indicators to comprehensively evaluate enterprise business performance (Table 1).

Table 1.
Evaluation index system of marine resource enterprise business performance.
- (1)
- Input indicators
Enterprise operation is inseparable from considerable financial and labor investments [33]. Therefore, drawing on the research of Gong et al. (2018) [35], Nguyen and Simioni (2015) [36], and Cui et al. (2016) [37], we set the input indicators as the main business cost, net fixed assets, and the total number of employees. The main business cost refers to the cost of business activities such as selling products or providing services to the outside world, which reflects the cost of input to obtain the main business income of the enterprise. Fixed assets are the basis for the production and operation of marine resource enterprises, and the use and depreciation of fixed assets can play a significant role in the business performance of marine resource enterprises. The total number of employees reflects the investment of human resources in the business process of marine resource enterprises, and the employees are the most direct contactors and achievers of enterprise value.
- (2)
- Output indicators
Drawing on the research of Du et al. (2022) [38], Cui et al. (2016) [37], and Horvat et al. (2023) [39], we set the output indicators as the main business revenue and earnings before interest and tax. The main business revenue refers to the business income generated by the production and operation activities of the enterprise, which can effectively measure the competitiveness of the marine resource enterprises and is the support of the profit of the marine resource enterprises with development potential. Enterprise profit reflects the results of business operations and is a key factor in the high-quality development of enterprises. It plays an important role in the quality and sustainability of business operations, which is also an important indicator of enterprise performance.
2.2. Construction of QCA Model for Performance Improvement Path of Marine Resource Enterprises
2.2.1. Qualitative Comparison Method of Fuzzy Sets
This study uses the qualitative comparative analysis (QCA) method developed by Ragin (2008) [40] to explore the multivariate combination paths that affect the high business performance of marine resource enterprises. QCA is essentially a method based on set theory, which uses Boolean algebra for data minimization. This feature enables QCA to handle causal ambiguity situations. The business performance of marine resource enterprises is usually causal with multiple factors, and QCA focuses on the reasons that lead to the results [41], providing methodological guidance for exploring ways to promote high business performance within marine resource enterprises. Fuzzy set QCA (fsQCA) is a method of QCA that allows conditions to be scaled along the 0–1 interval and can handle continuous data and assign values. The business performance or influencing factor data of marine resource enterprises are basically continuous. Using fuzzy set QCA can more accurately describe the actual state of variables, making the research results more convincing.
2.2.2. Variable Design
- (1)
- Conditional variable design
In the QCA method, the number of conditional variables should be well balanced with the number of case samples [42]. If the research sample itself is a small sample and a large number of conditional variables are selected, there may be a situation where the combination of condition variables is larger than the sample size, which is difficult to explain in research. To avoid this situation, we selected 6 conditional variables in combination with actual cases in the marine resource enterprises.
- (1.1)
- Property-right attribute (PRA): The type of ownership is a distinct form in China [43]. SOEs are essential policy tools in China, with resource advantages and important strategic positions [44]. POEs are relatively young and market-oriented, and differ from state-owned enterprises in terms of resources, capabilities, and the degree of institutional pressure [45]. We assign a value of 1 to SOEs and 0 to POEs.
- (1.2)
- Enterprise size: Considering the basic characteristics of enterprises, the scale of enterprises affects their innovation activities and business activities to a certain extent [46]. We measure the size of enterprises using the total assets at the end of the year from 2019 to 2022. Due to the skewed distribution of total asset data, all data are logarithmically transformed.
- (1.3)
- R&D Intensity: R&D investment is the foundation for enterprises to create new products, processes, designs, and technologies, and plays an important role in improving the technological level and performance of the enterprises [47]. We measure the level of R&D investment of a company based on the average ratio of R&D investment to operating revenue from 2019 to 2022.
- (1.4)
- Executive incentive (EI): Executives are in a dominant position in corporate operations. Executive incentives are a key focus of internal governance. From the perspective of domestic practice, the main incentive method for executives is salary incentives. There are two competitive hypotheses about executive motivation: the convergence of interest hypothesis and the management defense hypothesis. We measure the executive incentive level of a company based on the average of the total remuneration of the top three executives from 2019 to 2022.
- (1.5)
- Equity concentration (EC): Ownership concentration has a statistically significant positive impact on enterprise performance [48]. The background and shareholding proportion of major shareholders, to a certain extent, determine the control power of the actual controllers over the company. We measure equity concentration based on the shareholding ratio of the largest shareholder.
- (1.6)
- Environmental investment (ENV): Referring to the study by Lei and Wei (2023) [49], we conducted binary valuation based on whether the enterprise has invested in projects to treat exhaust gas, wastewater, and solid waste. If the enterprise conducts environmental governance and incurs related costs, the value is assigned as 1; otherwise, we assign a value of 0.
- (2)
- Result variable design
Business performance (BP): This study is based on the perspective of input and output, using overall efficiency to measure the business performance of marine resource enterprises, and using the BCC model in the DEA method to measure the comprehensive efficiency of sample enterprises. Table 2 shows the specific variable designs.
Table 2.
Selection of variables for fsQCA.
2.3. Construction of DEA-fsQCA Theoretical Model
This paper explores the performance improvement path of marine resource enterprises by constructing a DEA-fsQCA theoretical model (Figure 1). There are two following stages: (1) The DEA model is applied to evaluate the business performance of the marine resource enterprises. The input indicators are set as the main business cost, the total number of employees, and the net fixed assets, and the output indicators are set as the main business revenue and earnings before interest and tax. The comprehensive efficiency of marine resource enterprises can be obtained through calculation. (2) Referring to the research of Li et al. (2022) [30], the comprehensive efficiency of the marine resource enterprises obtained from the DEA is used as the outcome variable of the fsQCA. Subsequently, the property-right attribute, R&D intensity, executive incentives, enterprise size, equity concentration, and environmental investment are taken as the conditional variables. Through the fsQCA, the paths that can improve the business performance of marine resource enterprises are obtained. The DEA-fsQCA model is an analytical framework that integrates multiple factors and perspectives to evaluate and improve the business performance of marine resource enterprises. By analyzing the different factors and mechanisms that contribute to the high business performance of marine resource enterprises, this model can provide valuable insights for policymakers seeking to improve the overall performance of marine resource enterprises.
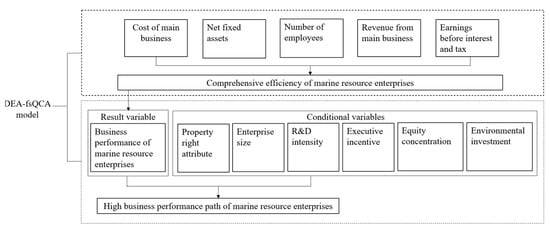
Figure 1.
DEA-fsQCA model.
3. Results
3.1. DEA Results
When determining the input and output indicator data of the DEA model, we used sample data from 42 listed marine resource companies in China from 2019 to 2022. Due to the fact that these raw data have different measurement units or measure the same phenomenon at different scales, we have standardized the data to eliminate these unit measurements. Through processing, the data are standardized as values with an interval of [0, 1]. The processing formula is as follows:
Among them, is the value after data processing, ∈ [0, 1]; is the original data. is the maximum value of the th indicator; is the minimum value of the th indicator. Then, the standardized data were imported into Deap 2.1 for analysis. The results of the comprehensive efficiency are shown in Table 3.
Table 3.
Comprehensive evaluation results of business performance in 2019–2022.
3.2. fsQCA Results
3.2.1. Calibration
Before conducting the path analysis, the variables needed to be calibrated first. In the fuzzy set analysis, the results and conditions were expressed using fuzzy sets, while antecedent conditions can also be expressed using clear sets. As one of the main calibration methods, the direct calibration method is suitable for variables that lack theoretical and empirical basis. This method is based on statistical models and is relatively formal, making it the most commonly used calibration method in existing research [50]. For the five variables of business performance, enterprise size, R&D intensity, executive incentives, and equity concentration, their data characteristics are relatively complex, and their theoretical and empirical basis is relatively lacking. To avoid subjective bias caused by the absence of theoretical basis in the calibration process, we drew on the research of Fan et al. (2017) [51] and Qin et al. (2021) [42] and set full membership, full non-membership, and the crossover point as 95%, 5%, and 50% of the variable values, respectively. For the property-right attribute and environmental investment variables, we adopted the binary clear set calibration method, assigning state-owned enterprises a value of 1 and private enterprises a value of 0. Similarly, we assigned a value of 1 for environmental investment and 0 for no environmental investment. Table 4 summarizes the calibration information for each conditional and outcome variable in this article.
Table 4.
Calibration of conditional and outcome variables.
3.2.2. Necessity and Sufficiency Analysis
Before calculating the truth table, it is necessary to first test whether a single condition constitutes a necessary condition for the high business performance of an enterprise. According to Ragin (2008) and Schneider (2013), when the consistency level is above 0.9, the variable can be considered a necessary condition for the result [52,53]. We conducted a necessity test on the calibrated variable data, and the results are shown in Table 5. The consistency of all conditional variables in this study is below 0.9, indicating that none of them are necessary conditions for the occurrence of the results. Therefore, there is no need to exclude them in the subsequent truth table calculations. In summary, all conditional variables pass the necessity tests.
Table 5.
Necessity analysis for business performance.
Unlike necessary condition analysis, adequacy analysis aims to reveal the adequacy of different configurations formed of multiple antecedent conditions on the results. Through fsQCA, three solutions can be obtained: a complex solution, a parsimonious solution, and an intermediate solution. We consider factors that appear simultaneously in the intermediate solution and parsimonious solution as core elements, and factors that only appear in the intermediate solution but not in the parsimonious solution as edge elements. In order to effectively reveal the core and edge elements of the high business performance configuration path of marine resource enterprises, we draw on the research of Ragin (2006) [54] and sets the consistency threshold for the high business performance of marine resource enterprises to 0.8. Furthermore, due to the small sample size of the study, the sample frequency threshold is set to 1. After conducting a standardized analysis, we obtained a total of six configuration paths, as shown in Table 6.
Table 6.
Configurations for high business performance in fsQCA results.
Overall, the consistency level values of the individual solutions and overall solutions for the six configurations of the high business performance of marine resource enterprises are higher than the acceptable minimum standard of 0.75 suggested by Ragin (2008) [40], indicating the high effectiveness of the results. Among them, the consistency of the overall solution is 0.86, indicating that 86% of the marine resource enterprises that meet the following six configuration conditions have achieved high business performance. The coverage of the overall solution is 0.53, indicating that these paths have a high degree of explanation for the high business performance of marine resource enterprises. To further test the robustness of the results, we adjusted the consistency level and reduced the sample size. The results obtained are basically consistent with existing results and meet the two criteria for the robustness of QCA results proposed by Schneider and Wagemann (2012) [55].
4. Discussion
All configurations for high business performance were divided into three types of C1, C2, and C3. Among them, the three paths that can lead to high business performance for small private enterprises take environmental investment as the core condition, with high R&D intensity as a marginal condition. This is the “private green innovation” type, led by environmental protection and coordinated with research and development. The path that leads to high business performance for large private enterprises is based on environmental protection investment as the core condition, with executive incentives and equity concentration as marginal conditions. This is the “private green concentration” type, led by environmental protection, with equity concentration and executive incentives coordinating. The path of high business performance in state-owned enterprises is based on executive incentives and non-equity concentration as the core conditions. This is the “state-owned incentive decentralized” type, dominated by executive incentives and equity concentration. The following analysis explains the logic of the different configuration types.
4.1. Private Green Innovation Type
Configuration paths C1a, C1b, and C1c indicate that increasing environmental investment is the key to achieving high business performance for small private marine resource enterprises. Small private marine resource enterprises are more cautious with using their funds. Investing funds in green production can provide financial support for green technology innovation in enterprises. At the same time, introducing environmentally friendly equipment can significantly reduce the cost of raw materials, thereby bringing higher profits to enterprises [56]. Moreover, according to the resource-based perspective, environmental protection activities are beneficial for enhancing the “heterogeneous” resource of enterprises, which can help marine resource enterprises improve their resource utilization efficiency, win more market and social resources, establish a good social image, and achieve sustainable development [57]. Therefore, executives will be more supportive of enterprises’ green strategic investments at present, which can help them achieve higher income in the future.
In addition, for small private marine resource enterprises, increasing their R&D intensity can help them to achieve high business performance. According to the theory of endogenous growth, increasing R&D investment is beneficial for providing support for technological innovation and improving the innovation performance of enterprises [58]. The mechanism of R&D investment on the growth of the business performance of small private marine resource enterprises can be explained based on two aspects: Firstly, R&D investment is conducive to the introduction of new products and processes by marine resource enterprises, ensuring the vitality of their development. Secondly, increasing R&D investment by enterprises is beneficial for attracting more innovative talents, and thus helping marine resource enterprises achieve significant progress in their technological performance. For private enterprises, the core business goal is to maximize profits and achieve long-term development. Executives and shareholders are not eager to immediately receive cash returns or stock dividends from the enterprise, but instead choose to invest more funds into R&D activities to seek future development. When a company’s R&D activities succeed, this can positively promote the improvement of the company’s business performance. Meanwhile, due to the uncertainty of innovation activities, limiting the excessive concentration of equity is also beneficial for avoiding the inhibitory behavior of major shareholders on R&D investment.
4.2. Private Green Concentration Type
Configuration C2 shows that for large private marine resource enterprises, developing green production is a key measure to achieve high business performance when they form a certain scale and have relatively concentrated equity. Large marine resource enterprises usually have more resources and technology, which can effectively carry out environmental governance and pollution control, thereby reducing the negative impact on the marine environment. Meanwhile, it is worth noting that equity concentration is an effective management mechanism. In large private marine resource enterprises, due to their large scale and high business complexity, a more specialized management team is needed for operation and management. In this case, an increase in equity concentration may provide more funding and resource support for the enterprise, thereby helping to improve its business performance. In addition, large private marine resource enterprises often face more market risks and competitive pressures. The increase in equity concentration can promote the efficiency and flexibility of enterprise decision making, enabling enterprises to better respond to market changes and challenges and thus achieve long-term stable development. Furthermore, improving equity concentration can also enable shareholders to effectively supervise the senior management of the company, thereby enabling them to work diligently to improve the company’s business performance.
According to the principal–agent theory, the ultimate goal of business owners and actual managers is not the same. Business owners aim to maximize residual value, while managers always set their goal to obtain the highest reward. Therefore, when equity is relatively concentrated, in order to align the goals of executives and company owners, corporate shareholders need to link the personal benefits of executives with company business performance and incentivize them to restrain their behavior and serve for the benefit of business owners through higher salaries.
4.3. State-Owned Incentive Decentralized Type
Configuration C3a and C3b indicate that for state-owned enterprises, improving the compensation level of company executives and reducing equity concentration is beneficial for improving business performance. Relatively speaking, large state-owned marine resource enterprises have stronger financial strength. Therefore, large state-owned marine resource enterprises should actively assume environmental responsibility, promote green production, and promote the sustainable development of enterprises.
According to the theory of incentive expectations, the internal incentive mechanism of a company determines the level of work effort of executives [59]. Compensation is a good stimulus factor that can increase executives’ recognition of the company, motivate them to work harder, and bring more positive returns to the company. According to the resource-based view (RBV), higher levels of compensation will motivate company executives to use resources related to operations, investment, and financing activities more effectively to achieve better economic results, thereby improving the company’s business performance. On the other hand, as the personal benefits of executives are directly related to company performance, compensation incentives can also affect their risk preference. Higher compensation will inhibit executives from making high-risk financial decisions and reduce the probability of the company falling into financial difficulties [60].
For state-owned marine resource enterprises, appropriately reducing equity concentration has a positive impact on enterprise business performance. State-owned marine resource enterprises are often controlled by the government or state institutions, and their equity concentration is usually high, which may lead to some problems, such as a lack of effective supervision mechanisms and low market operating efficiency. Therefore, reducing the concentration of equity in state-owned marine resource enterprises can not only ensure effective regulation through equity diversification, but also introduce other strategic investors to improve the level of enterprise management. This will encourage enterprises to focus more on market orientation and customer needs, thereby enhancing their market competitiveness.
5. Conclusions
5.1. Main Findings
Based on the DEA-fsQCA model, we evaluated the business performance of marine resource enterprises and analyzed the path to achieve high business performance by taking their property-right attribute, enterprise size, R&D intensity, executive incentive, equity concentration, and environmental investment as conditional variables. Through an analysis of 42 listed marine resource enterprises, we found the following:
- (1)
- The improvement of the business performance of marine resource enterprises is the result of the synergistic effect of multiple factors. The research results show that there are six different combinations of mechanisms that can achieve high business performance for marine resource enterprises, indicating that any single factor cannot constitute a sufficient or necessary condition for high business performance. High business performance is the result of the synergistic effect of multiple factors. Marine resource enterprises must choose a suitable combination of conditional factors to improve their business performance.
- (2)
- Enterprises with different characteristics have different paths to achieve high business performance. In the exploration of the path of high performance for private marine resource enterprises, there are two paths, the “green & innovation” type and the “green & concentration” type, that can achieve high performance in business operation. In the exploration of the path to high performance for state-owned marine resource enterprises, only the path of the “incentive & dispersion” type can achieve high performance in business development. The ways to improve the business performance of marine resource enterprises are diversified, and enterprises should formulate corresponding strategies based on their property-right attribute and own asset size.
5.2. Theoretical Implications
Specifically, this article makes two contributions to the existing literature. Firstly, this research has contributed to the literature on business performance by studying how the Chinese government guides marine resource enterprises to improve their business performance. Previous studies mainly focused on the management performance, ecological innovation performance, and economic and social performance of marine enterprises [6,11,61], while few studies have paid attention to the overall business performance of these enterprises. We use the DEA method to measure the business performance of marine resource enterprises from the perspectives of input and output, using the main business costs, net fixed assets, and number of employees as input variables and the main business revenue and earnings before interest and tax as output variables. This not only expands the application scope of the DEA model, but also provides important theoretical references for the research on enterprise business performance.
Secondly, this study provides new insight into the influence mechanism of business performance from the perspective of configuration. Although the existing literature acknowledges the mechanisms that affect business performance, most studies have focused on the role of a single identified factor, neglecting the key and complex mechanisms that drive the improvement of business performance [61,62]. As suggested by Rihoux and Ragin (2009) [63], the “configurational perspective” effectively comprehends complex causality. By combining the DEA and fsQCA approaches, this study adds to existing knowledge on business performance, enterprise size, property-right attributes, R&D intensity, executive incentives, equity concentration, and environmental investment from a methodological perspective, emphasizing how different antecedent configurations affect business performance. Specifically, we have contributed to the research of marine resource enterprises by identifying six configuration paths that lead to high business performance. These findings are a novel attempt to explain the business performance improvement paths from an integrated perspective using configurational analysis [64].
5.3. Research Insights
- (1)
- When formulating environmental policies, relevant departments should promote marine resource enterprises to fulfill their environmental responsibilities and support their green and low-carbon development. We found that increasing environmental investment is the key to promoting the improvement of business performance within private marine resource enterprises. It is generally believed that state-owned enterprises play a leading role in the green development of society and bear the primary responsibility for protecting the environment. However, as the main body of the market economy, private enterprises are also important participants in environmental protection. The “Green Development Report of Chinese Private Enterprises (2022)” systematically demonstrates that Chinese private enterprises have always maintained a high awareness of green and low-carbon development. They are an important force in promoting the green development of the Chinese economy, and their environmental investment has achieved positive results. Under the ecological protection concept that “Lucid waters and lush mountains are invaluable assets” in China, relevant departments should continue to strengthen the top-level design of environmental protection policies for marine resource enterprises, improve relevant laws and regulations, and stimulate the green development awareness of marine resource enterprises from the source.
- (2)
- When formulating research and development policies, relevant departments should fully stimulate the technological innovation vitality of private marine resource enterprises and promote the high-quality development of the private economy. Stable R&D investment is the key to the innovative development of marine resource enterprises. Enterprises also need to increase their R&D investment to achieve green production transformation. In order to promote the innovative development of private marine resource enterprises, the government should accelerate the formulation of supporting service policies to promote innovation in local marine resource enterprises, and provide corresponding support to marine resource enterprises from tax incentives, government subsidies, and other aspects. At the same time, the government should also promote the implementation of inclusive innovation policies such as procurement policies and technology finance policies, and guide marine resource enterprises to truly become the main organizations for the transformation of scientific research achievements. Furthermore, the government should also guide private marine resource enterprises to strengthen the cultivation of innovative talents and improve the welfare subsidies for marine high-tech talents.
- (3)
- When formulating talent incentive policies, relevant departments should deepen the reform of the incentive system for executives in state-owned marine resource enterprises. At present, the executive equity incentive system of state-owned enterprises has not been deeply implemented, and the executive compensation incentive based on the annual salary system is still the main incentive method of state-owned enterprise executives. In order to further optimize the executive compensation incentive mechanism, relevant departments should classify state-owned marine resource enterprises according to their functional positioning, and implement differentiated executive compensation incentives according to their categories and marketization degrees. For example, for state-owned marine resource enterprises with a high degree of marketization, executive incentives should be linked to market economic benefits, and the government’s salary restrictions should be gradually lifted. For public-welfare state-owned marine resource enterprises with a low degree of marketization, the government should continue to implement salary restrictions for executives and implement relatively tight regulations. In addition, the executive equity incentive of state-owned marine resource enterprises in China is relatively weak at present. The government should gradually break the current single-executive-compensation incentive mechanism and promote the reform of the executive equity incentive system of state-owned enterprises.
- (4)
- When formulating equity policies, relevant departments should further optimize the equity structure of marine resource enterprises and enhance their vitality and competitiveness. Path C3 reveals that dispersing the equity of state-owned marine resource enterprises is beneficial for improving their business performance, which implies that equity can be dispersed to more shareholders, and the control of state-owned shareholders over company decisions can be reduced. In recent years, China has actively promoted the mixed ownership reform of state-owned enterprises. As an important means to reduce the concentration of equity in state-owned enterprises, the mixed ownership reform of state-owned enterprises improves their efficiency by introducing private capital and foreign capital and increasing the number of shareholders. Meanwhile, through the mixed ownership reform of state-owned enterprises, state-owned marine resource enterprises can also fully utilize the advantages of the private economy in terms of funds, technology, management, and improving their profitability. Therefore, in order to improve the business performance of state-owned marine resource enterprises, the government should increase its support for the mixed reform of state-owned enterprises, guide social capital to enter state-owned marine resource enterprises through policy incentives such as financial support and tax benefits, and adjust the proportion of state-owned equity.
Author Contributions
Conceptualization, J.W. and J.C.; methodology, J.W.; software, J.C.; validation, J.W. and J.C.; formal analysis, J.W.; investigation, J.C.; resources, J.C.; data curation, J.C.; writing—original draft preparation, J.C.; writing—review and editing, J.W.; visualization, J.W.; supervision, J.W.; project administration, J.W.; funding acquisition, J.W. All authors have read and agreed to the published version of the manuscript.
Funding
This research was funded by the National Social Science Foundation of China, grant number 23BJY260.
Data Availability Statement
Data are contained within the article. Further requests can made to the corresponding author.
Acknowledgments
The authors would like to thank the College of Management for its support during this project.
Conflicts of Interest
The authors declare no conflicts of interest.
References
- Ding, L.; Zhao, Z.; Wang, L. Exploring the role of technical and financial support in upgrading the marine industrial structure in the Bohai Rim region: Evidence from coastal cities. Ocean Coast. Manag. 2023, 243, 106659. [Google Scholar] [CrossRef]
- Clifton, J.; Osman, E.O.; Suggett, D.J.; Smith, D.J. Resolving conservation and development tensions in a small island state: A governance analysis of Curieuse Marine National Park, Seychelles. Mar. Policy 2021, 127, 103617. [Google Scholar] [CrossRef]
- Wu, D. Study on the Construction of New Port Area under the Background of National Marine Economic Development Demonstration Zone. J. Coast. Res. 2019, 98, 159–162. [Google Scholar] [CrossRef]
- Carpitella, S.; Mzougui, I.; Benitez, J.; Carpitella, F.; Certa, A.; Izquierdo, J.; Cascia, M.L. A risk evaluation framework for the best maintenance strategy: The case of a marine salt manufacture firm. Reliab. Eng. Syst. Saf. 2021, 205, 107265. [Google Scholar] [CrossRef] [PubMed]
- Liu, B.; Zhang, S.; Xu, M.; Wang, J.; Wang, Z. Spatial differences in the marine industry based on marine-related enterprises: A case study of Jiangsu Province, China. Reg. Stud. Mar. Sci. 2023, 62, 102954. [Google Scholar] [CrossRef]
- Xu, Z.; Ren, Y.; Zhao, P.; Zhang, Z. The Factors Affecting the Performance of Marine Environmental Protection Enterprises. J. Coast. Res. 2019, 94, 40–49. [Google Scholar] [CrossRef]
- Ma, W.; Li, Y.; Ding, L. Does marine financial policy affect total factor productivity of marine enterprises? An empirical evidence based on Chinese first guidance on strengthening finance for marine economy. Mar. Pollut. Bull. 2023, 195, 115493. [Google Scholar] [CrossRef]
- Ma, Y.; Zhang, H. The Structural Features and Centrality Optimization of a Firm Interlocking Network of the Nodal Cities on the South Route of the 21st-Century Maritime Silk Road: The Case of Fujian Province. Sustainability 2022, 14, 15389. [Google Scholar] [CrossRef]
- Li, X.; Wang, M.; Chi, J.; Yang, X. Policy Effects and Suggestions on Green Technology Innovation of Marine Enterprises in China. J. Coast. Res. 2020, 110, 76–79. [Google Scholar] [CrossRef]
- Li, J.; Jiang, S. How can governance strategies be developed for marine ecological environment pollution caused by sea-using enterprises?—A study based on evolutionary game theory. Ocean Coast. Manag. 2023, 232, 106447. [Google Scholar] [CrossRef]
- Tao, L.; Li, R.; Tian, M. Effects of Government Subsidies on the Economic and Social Performance of Marine Enterprises-Taking Chinese Listed Enterprises as Examples. J. Coast. Res. 2020, 110, 71–75. [Google Scholar] [CrossRef]
- Wan, X.; Li, Q.; Zhang, G.; Zhang, K.; Wang, Z. Sustainable collaborative innovation capability enhancement paths of marine ranching: Supernetwork analysis perspective. Ocean Coast. Manag. 2023, 231, 106387. [Google Scholar] [CrossRef]
- Liu, L.; Wen, X.; Ba, J.; Wu, S. Comprehensive Evaluation of Environmental Performance Based on Offshore Oil Drilling. J. Coast. Res. 2020, 112, 19–21. [Google Scholar] [CrossRef]
- Zhou, Y.; Yuen, K.F.; Tan, B. The effect of maritime knowledge clusters on maritime firms’ performance: An organizational learning perspective. Mar. Policy 2021, 128, 104472. [Google Scholar] [CrossRef]
- Gupta, A.; Kumar, S. Comparing the performance of public and private enterprises: Case for a reappraisal-evidence from India. Int. J. Public Sect. Manag. 2021, 34, 87–100. [Google Scholar] [CrossRef]
- Cantele, S.; Vernizzi, S.; Campedelli, B. Untangling the Origins of Sustainable Commitment: New Insights on the Small vs. Large Firms’ Debate. Sustainability 2020, 12, 671. [Google Scholar] [CrossRef]
- Coppa, M.; Sriramesh, K. Corporate social responsibility among SMEs in Italy. Public. Relat. Rev. 2013, 39, 30–39. [Google Scholar] [CrossRef]
- Liang, J.; Ma, L. Ownership, Affiliation, and Organizational Performance: Evidence from China’s Results-Oriented Energy Policy. Int. Public Manag. J. 2020, 23, 57–83. [Google Scholar] [CrossRef]
- Elouaourti, Z.; Ezzahid, E. Financial services and firm performance, are there any differences by size? Worldwide evidence using firm-level data. J. Econ. Stud. 2023, 50, 858–880. [Google Scholar] [CrossRef]
- Kumar, A.S.; Babu, R.V.; Paranitharan, K.P. S-SMILE model: A leveraging mechanism to polarise performance in small and medium enterprises—An empirical study. Int. J. Value Chain Manag. 2021, 12, 309–335. [Google Scholar] [CrossRef]
- Luo, Y.; Xiong, G.; Mardani, A. Environmental information disclosure and corporate innovation: The “Inverted U-shaped” regulating effect of media attention. J. Bus. Res. 2022, 146, 453–463. [Google Scholar] [CrossRef]
- Chang, A.; Wang, M.; Allen, G.I. Sparse regression for extreme values. Electron. J. Statist. 2021, 15, 5995–6035. [Google Scholar] [CrossRef]
- Färe, R.; Grosskopf, S. Theory and Application of Directional Distance Functions. J. Prod. Anal. 2000, 13, 93–103. [Google Scholar] [CrossRef]
- Zou, W.; Yang, Y.; Yang, M. Analyzing efficiency measurement and influencing factors of China’s marine green economy: Based on a two-stage network DEA model. Front. Mar. Sci. 2021, 10, 1020373. [Google Scholar] [CrossRef]
- Zhang, X.; Sun, D.; Zhang, X.; Yang, H. Regional ecological efficiency and future sustainable development of marine ranch in China: An empirical research using DEA and system dynamics. Aquaculture 2021, 534, 736339. [Google Scholar] [CrossRef]
- Chi, E.; Jiang, B.; Peng, L.; Zhong, Y. Uncertain Network DEA Models with Imprecise Data for Sustainable Efficiency Evaluation of Decentralized Marine Supply Chain. Energies 2022, 15, 5313. [Google Scholar] [CrossRef]
- Su, L.; Jia, J. New-type urbanization efficiency measurement in Shanghai under the background of industry city integration. Environ. Sci. Pollut. Res. 2023, 30, 80224–80233. [Google Scholar] [CrossRef] [PubMed]
- Zhu, J. DEA under big data: Data enabled analytics and network data envelopment analysis. Ann. Oper. Res. 2022, 309, 761–783. [Google Scholar] [CrossRef]
- Banker, R.D.; Charnes, A.; Cooper, W. Some models for estimating technical and scale inefficiency in Data envelopment analysis. Manag. Sci. 1984, 30, 1078–1092. [Google Scholar] [CrossRef]
- Li, T.; Wen, J.; Zeng, D.; Liu, K. Has enterprise digital transformation improved the efficiency of enterprise technological innovation? A case study on Chinese listed companies. Math. Biosci. Eng. 2022, 19, 12632–12654. [Google Scholar] [CrossRef] [PubMed]
- Neykov, N.; Krišťáková, S.; Hajdúchová, I.; Sedliačiková, M.; Antov, P.; Giertliová, B. Economic efficiency of forest enterprises-empirical study based on data envelopment analysis. Forests 2021, 12, 462. [Google Scholar] [CrossRef]
- Cook, W.D.; Tone, K.; Zhu, J. Data envelopment analysis: Prior to choosing a model. Omega 2014, 44, 1–4. [Google Scholar] [CrossRef]
- Zhang, Y.; Wang, S. Influence of marine industrial agglomeration and environmental regulation on marine innovation efficiency—From an innovation value chain perspective. Mar. Policy 2021, 134, 104807. [Google Scholar] [CrossRef]
- Wang, C.N.; Luu, Q.C.; Nguyen, T.K.L.; Day, J.D. Assessing Bank Performance Using Dynamic SBM Model. Mathematics 2019, 7, 73. [Google Scholar] [CrossRef]
- Gong, Y.; Zhu, J.; Chen, Y.; Cook, W.D. DEA as a tool for auditing: Application to Chinese manufacturing industry with parallel network structures. Ann. Oper. Res. 2018, 263, 247–269. [Google Scholar] [CrossRef]
- Nguyen, P.A.; Simioni, M. Productivity and efficiency of Vietnamese banking system: New evidence using Färe-Primont index analysis. Appl. Econ. 2015, 47, 4395–4407. [Google Scholar] [CrossRef]
- Cui, Q.; Li, Y.; Yu, C.; Wei, Y. Evaluating energy efficiency for airlines: An application of Virtual Frontier Dynamic Slacks Based Measure. Energy 2016, 113, 1231–1240. [Google Scholar] [CrossRef]
- Du, X.; Wan, B.; Long, W.; Xue, H. Evaluation of Manufacturing Innovation Performance in Wuhan City Circle Based on DEA-BCC Model and DEA-Malmquist Index Method. Discrete Dyn. Nat. Soc. 2022, 2022, 2989706. [Google Scholar] [CrossRef]
- Horvat, A.M.; Milenković, N.; Dudić, B.; Kalaš, B.; Radovanov, B.; Mittelman, A. Evaluating Bank Efficiency in the West Balkan Countries Using Data Envelopment Analysis. Mathematics 2023, 11, 15. [Google Scholar] [CrossRef]
- Ragin, C.C. Redesigning Social Inquiry: Fuzzy Sets and Beyond; University of Chicago Press: Chicago, IL, USA, 2008. [Google Scholar]
- Goertz, G.; Mahoney, J. A Table of Two Cultures: Qualitative and Quantitative Research in the Social Science; Princeton University Press: Princeton, NJ, USA, 2012. [Google Scholar]
- Qin, M.; Tao, Q.; Du, Y. Policy implementation and project performance: A qualitative comparative analysis based on 29 National Marine ranchings in China. Mar. Policy 2021, 129, 104527. [Google Scholar] [CrossRef]
- Hu, C.; Li, J.; Yun, K.H. Re-examining foreign subsidiary survival in a transition economy: Impact of market identity overlap and conflict. J. World Bus. 2023, 58, 101432. [Google Scholar] [CrossRef]
- Ghorbani, M.; Xie, Z.; Jin, J.; Wang, F. Chinese Firms’ Acquisition of Innovation Capability from Overseas: Approaches by State- versus Private-Owned Firms. Manag. Organ. Rev. 2023, 19, 233–255. [Google Scholar] [CrossRef]
- Xu, D.; Lu, J.W.; Gu, Q. Organizational forms and multi-population dynamics: Economic transition in China. Adm. Sci. Q. 2014, 59, 517–547. [Google Scholar] [CrossRef]
- Xiao, Z.; Hao, B.; Li, Y. Strategic Emerging Industry Policy on Enterprise Innovation Performance: The Intermediary Role Based on Cost of Debt Financing and Regulatory Role of Business Environment. J. Syst. Manag. 2023, 32, 355–366. [Google Scholar]
- Hao, J.; Li, C.; Yuan, R.; Ahmed, M.; Khan, M.A.; Oláh, J. The Influence of the Knowledge-Based Network Structure Hole on Enterprise Innovation Performance: The Threshold Effect of R&D Investment Intensity. Sustainability 2020, 12, 6155. [Google Scholar]
- Hu, J.; Hu, L.; Hu, M.; Dnes, A. Entrepreneurial human capital, equity concentration and firm performance: Evidence from companies listed on China’s Growth Enterprise Market. MDE Manag. Decis. Econ. 2023, 44, 187–196. [Google Scholar] [CrossRef]
- Lei, Z.; Wei, J. Assessing the eco-efficiency of industrial parks recycling transformation: Evidence from data envelopment analysis (DEA) and fuzzy set qualitative comparative analysis (fsQCA). Front. Environ. Sci. 2023, 11, 1170688. [Google Scholar] [CrossRef]
- Zhang, M.; Du, Y.Z. Qualitative comparative analysis (QCA) in management and organizational research: Position, tactics, and directions. Chin. J. Manag. 2019, 16, 1312–1323. [Google Scholar]
- Fan, D.; Li, Y.; Chen, L. Configuring innovative societies: The crossvergent role of cultural and institutional varieties. Technovation 2017, 66–67, 43–67. [Google Scholar] [CrossRef]
- Ragin, C.C. STRAND SI. Using qualitative comparative analysis to study causal order. Comment on Caren and Panofsky (2005). Sociol. Methods Res. 2008, 36, 431–441. [Google Scholar] [CrossRef]
- Schneider, C.Q.; Wagemann, C. Set-theoretic methods for the social sciences: A guide to qualitative comparative analysis. Int. J. Sci. Res. Manag. 2013, 16, 165–166. [Google Scholar]
- Ragin, C.C. Set Relations in Social Research: Evaluating Their Consistency and Coverage. Polit. Anal. 2006, 14, 291–310. [Google Scholar] [CrossRef]
- Schneider, C.Q.; Wagemann, C. Set-Theoretic Methods for the Social Sciences; Cambridge University Press: Cambridge, UK, 2012. [Google Scholar]
- Hsieh, C.L.; Tsai, W.H.; Chang, Y.C. Green Activity-Based Costing Production Decision Model for Recycled Paper. Energies 2020, 13, 2413. [Google Scholar] [CrossRef]
- Wamba, L.D. The determinants of environmental performance and its effect on the financial performance of European-listed companies. J. Gen. Manag. 2022, 47, 97–110. [Google Scholar] [CrossRef]
- Sun, Z.; Wang, X.; Liang, C.; Cao, F.; Wang, L. The impact of heterogeneous environmental regulation on innovation of high-tech enterprises in China: Mediating and interaction effect. Environ. Sci. Pollut. Res. 2021, 28, 8323–8336. [Google Scholar] [CrossRef] [PubMed]
- Murphy, K.J. Incentives, Learning, and Compensation: A Theoretical and Empirical Investigation of Managerial Labor Contracts. RAND. J. Econ. 1986, 17, 59–76. [Google Scholar] [CrossRef]
- Chatterjee, B.; Jia, J.; Nguyen, M.; Taylor, G.; Duong, L. CEO remuneration, financial distress and firm life cycle. Pac. Basin Financ. J. 2023, 80, 102050. [Google Scholar] [CrossRef]
- Li, X.; Cai, Q. Analysis on Green Dynamic Ability of Creating Resources and Eco-Innovation Performance of Marine Industrial Clusters. J. Coast. Res. 2019, 94 (Suppl. S1), 6–10. [Google Scholar] [CrossRef]
- Madhavan, M.; Sharafuddin, M.A.; Chaichana, T. Impact of Business Model Innovation on Sustainable Performance of Processed Marine Food Product SMEs in Thailand—A PLS-SEM Approach. Sustainability 2022, 14, 9673. [Google Scholar] [CrossRef]
- Rihoux, B.; Ragin, C. Configurational Comparative Methods: Qualitative Comparative Analysis (QCA) and Related Techniques; SAGE Publications, Inc.: Thousand Oaks, CA, USA, 2009. [Google Scholar]
- Li, Z.; Li, Y.; Zhang, W. Configuration analysis of influencing factors of operating efficiency based on fsQCA: Evidence from China’s property insurance industry. Chin. Manag. Stud. 2021, 15, 1085–1103. [Google Scholar] [CrossRef]
Disclaimer/Publisher’s Note: The statements, opinions and data contained in all publications are solely those of the individual author(s) and contributor(s) and not of MDPI and/or the editor(s). MDPI and/or the editor(s) disclaim responsibility for any injury to people or property resulting from any ideas, methods, instructions or products referred to in the content. |
© 2024 by the authors. Licensee MDPI, Basel, Switzerland. This article is an open access article distributed under the terms and conditions of the Creative Commons Attribution (CC BY) license (https://creativecommons.org/licenses/by/4.0/).