Article

Post-Restoration Monitoring of Wetland Restored from Farmland Indicated That Its Effectiveness Barely Measured Up

1
College of Forestry and Grassland, Jilin Agricultural University, Changchun 130118, China
2
Jilin Academy of Agricultural Sciences, Changchun 130033, China
3
Key Laboratory of Wetland Ecology and Environment, Northeast Institute of Geography and Agricultural, Chinese Academy of Sciences, Changchun 130102, China
4
The Faculty of Agronomy, Jilin Agricultural University, Changchun 130118, China
*
Authors to whom correspondence should be addressed.
These authors contributed equally to this work.
Water 2024, 16(3), 410; https://doi.org/10.3390/w16030410
Submission received: 21 December 2023 / Revised: 24 January 2024 / Accepted: 24 January 2024 / Published: 26 January 2024
(This article belongs to the Section Biodiversity and Functionality of Aquatic Ecosystems)

Abstract

:
In the context of wetland restoration, the reconstruction of an ecosystem’s structure typically manifests within a relatively short timeframe, while the restoration of its function often necessitates an extended period of time following the implementation of restoration measures. Consequently, it becomes imperative to engage in the comprehensive, long-term dynamic monitoring of restored wetlands to capture timely information regarding the ecological health status of wetland restoration. In this paper, we aimed to precisely assess the ecosystem health of a typical wetland that had been converted from farmland to wetland in Fujin National Wetland Park in 2022. We selected 18 ecological, social, and economic indicators to establish a wetland ecological health evaluation model, and then used the method of an analytic hierarchy process (AHP) to calculate the weights for each indicator and acquire the ecological health index (EHI) score. The results of our study revealed that the ecosystem health index was 3.68, indicating that the FNWP wetland ecosystem was in “good” condition; this result was mainly affected by wetland water quality (0.382). The ecological health assessment of restored wetlands can monitor wetland ecological resources and provide a scientific basis for the management and protection of restored wetlands.

1. Introduction

Wetland refers to a natural or artificial, long-term or temporary swamp, peatland, or water area, with or without static or flowing, fresh, brackish, or saline water bodies, consisting of water bodies with a depth of no more than 6 m at low tide [1]. Wetlands are multifunctional ecosystems that play an important role in regulating the climate, maintaining biodiversity, purifying water quality, the carbon and nitrogen cycles, and providing biological habitats, and thus are considered to be one of the three major ecosystems of the Earth [2,3,4,5,6,7] known as the “kidneys of the Earth” [8,9,10,11,12]. At the same time, wetlands are one of the most threatened and sensitive ecosystems due to intensifying human activities [13,14,15,16,17]. Between 1700 and 2020, a total of 3.4 × 10⁶ km2 of inland wetlands has been lost globally, and mainly across Europe, the United States, and China [18,19]. The decrease in wetland area is mainly due to irrational human exploitation and use, and wetland loss and degradation, leading to serious problems such as natural disasters and ecological degradation. Consequently, it is imperative that national focus is directed toward the conservation, restoration, and reconstruction of wetland ecosystems [20,21,22]. Since the 18th National Congress, China has implemented its 13th Five-Year Implementation Plan for National Wetland Protection, introduced the Wetland Protection Law of the People’s Republic of China, and issued the National Wetland Protection Plan (2022–2030) to carry out comprehensive protection and restoration measures for wetlands [23].
Wetland ecosystem health is characterized by the following points: (1) the preservation of unimpaired material circulation and energy flow within the system; (2) that key ecological components and organic tissues are maintained in an intact state without diseases, exhibiting resilience and stability in the face of both prolonged and abrupt natural or anthropogenic disturbances; and (3) the overall functionality of the ecosystem manifests as diversified ecological processes, species diversity, and heightened biological productivity [24,25].On 1 June 2022, the Wetland Protection Law of the People’s Republic of China came into force, which clearly stipulates the principles of prioritizing protection, systematic governance, scientific restoration, and the rational utilization of wetlands in China. Traditionally, an ecosystem’s health assessment is conducted using field observation data or models. Commonly used methods include indices of biological integrity (IBI) [26], the Hydrogeomorphic Method (HGM) [27], pressure–state–response (PSR) modeling methods [28], and the evaluation of LDI (landscape development intensity) [29]. Most researchers have combined these methods with the analytic hierarchy process (AHP) and Fuzzy Comprehensive Evaluation (FCE) to systematically and comprehensively assess the health status of an entire wetland ecosystem [30,31,32,33,34,35,36,37]. In addition, the monitoring of wetlands in China should be more scientifically standardized and continuously optimized in terms of the selection of a combined indicator system, field monitoring and collection methods, and data analysis and management [38,39,40].
The Sanjiang Plain, situated in the northeastern part of Heilongjiang Province, China, is the largest marsh wetland area within the country’s territory. At the beginning of the 19th century, the wetland area in this region was 534.5 × 10⁴ ha, accounting for 49.08% of the total area of the Sanjiang Plain [41,42,43]. In response to escalating national requirements for grain production and population expansion, the Sanjiang Plain has undergone four stages of large-scale agricultural development (1949–1954, 1956–1958, 1969–1973, 1975–1983), leading to the substantial conversion of large areas of natural wetlands into arable land [44,45]. Between 2000 and 2015, the total wetland area in the Sanjiang Plain decreased by 250,856 ha, and the wetland vegetation coverage declined from 91.8% to 74.0% [46].
This study selected a typical converted-farmland wetland in the Fujin National Wetland Park (FNWP) in the hinterland of the Sanjiang Plain. The aim is to evaluate the ecosystem health of the restored wetland and analyze the factors affecting the ecological health of the wetland through the systematic monitoring of various indicators of hydrology, water quality, birds, soil characteristics, and the landscape pattern of the restored wetland. We also aim to construct a restored wetland ecosystem health evaluation system and use the analytic hierarchy process to calculate the ecosystem health index of the wetland to evaluate the current health status of the restored wetland.

2. Materials and Methods
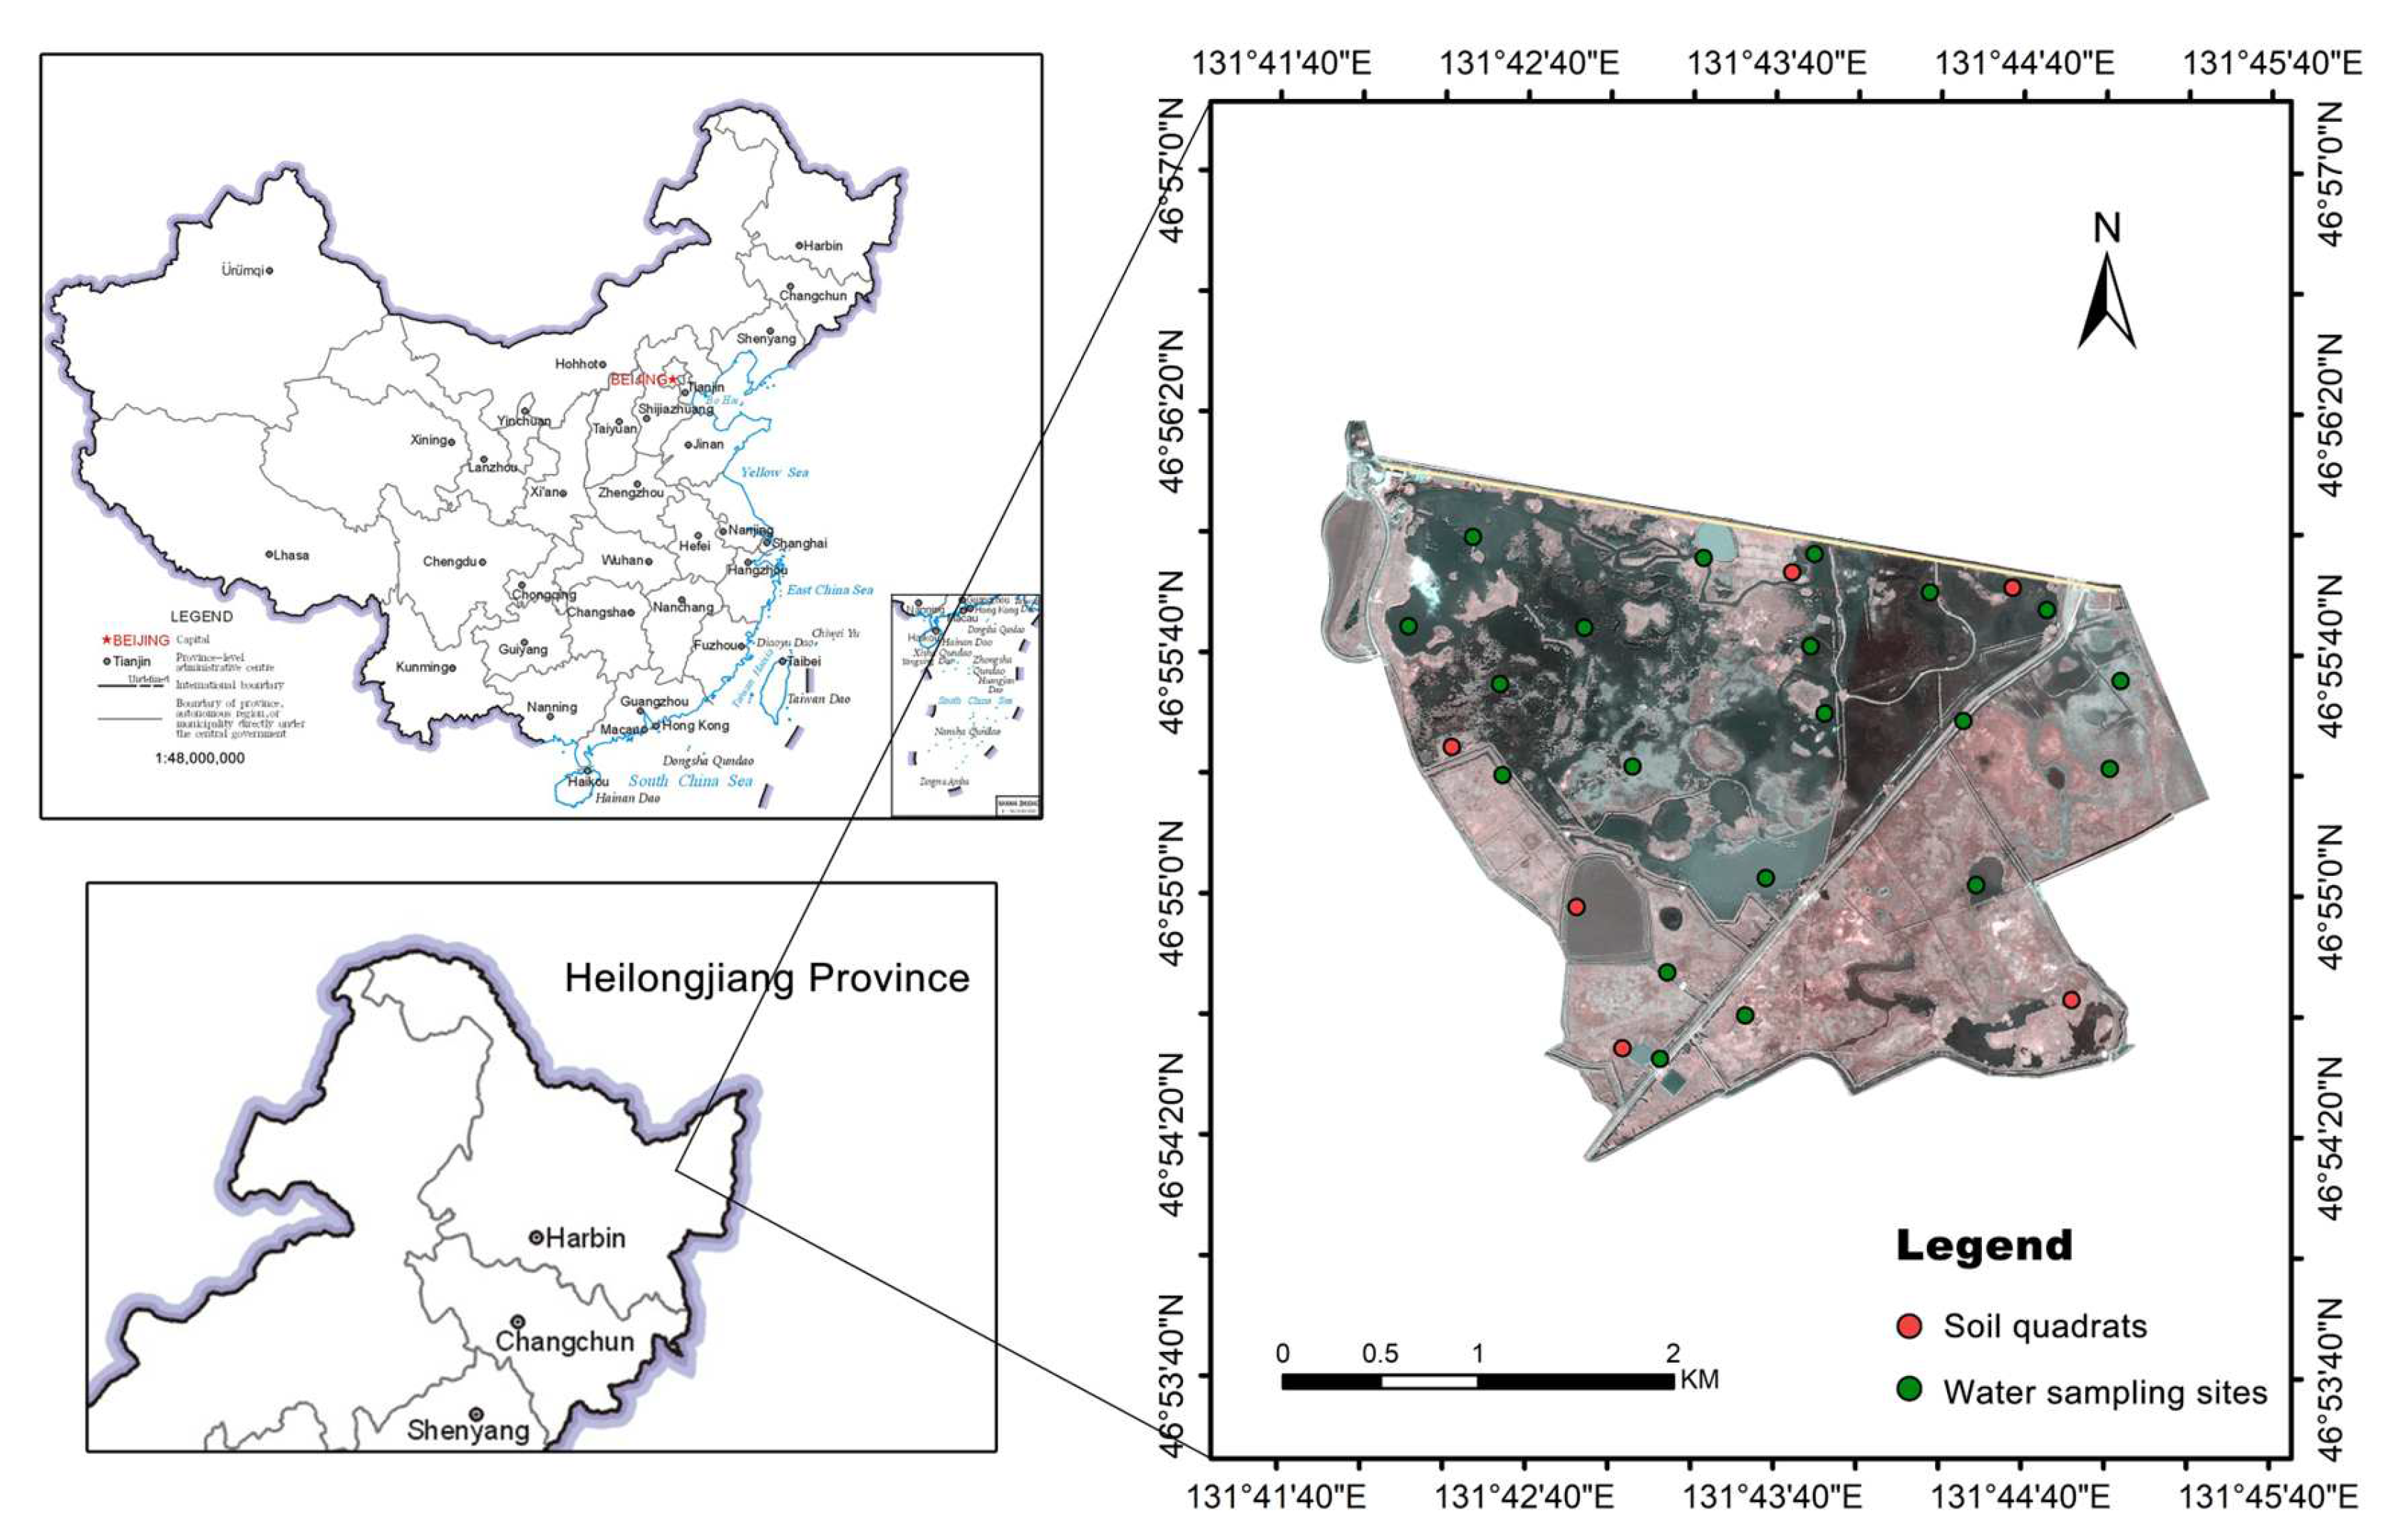
2.1. Study Area

The FNWP is located in northeastern Heilongjiang Province (46°55′52.72″ N, 131°44′51.33″ E), on the south bank of the downstream of the Songhua River. Notably, the FNWP occupies a pivotal position within the core area of the Sanjiang Plain (Figure 1). The FNWP covers an area of 2200 ha, and is a typical area for restoring farmland to wetland. Our main study area is located in the 1152 ha of restored and reconstructed wetland, accounting for 52.36% of the total park area. FNWP belongs to the middle temperate continental semi-humid monsoon climate zone, characterized by marked seasonal temperature variations. The average multi-year temperature is 2.5 °C, and the average multi-year precipitation is 512 mm, with concurrent hot conditions and concentrated precipitation in summer [47]. The wetlands are recharged by two main water sources: natural precipitation, including surface runoff from the surrounding farmland catchment, and recharge from the canals south of the park [48].
FNWP was approved as a national (pilot) wetland park in 2009, and has experienced several important stages from “primitive natural marsh wetland—wetland reclamation and wetland degradation—returning farmland to wet/degraded wetland restoration”. Wetland restoration was carried out, through scientific planning, in 2011, and the wetland protection and restoration and capacity building project was officially launched with a loan from the German government in 2013, including the construction of sluice gates and embankments, wetland restoration from farmland, and ecological islands’ construction, etc. The project period was from July 2013 to June 2018, and restoration started in early 2014.

2.2. Data Sources and Processing

The evaluation of wetland ecological health primarily relies on long-term monitoring data from restored wetlands and field surveys. Various data collection methods, such as experimental analysis, field monitoring surveys, questionnaires, and literature reviews, are employed to ensure the comprehensiveness and reliability of the data. Different types of data require different collection methods, ensuring a robust evaluation process.

2.2.1. Experimental Analysis Data

The data used in this study include remote sensing data and experimental data obtained through field surveys, experimental treatments, and questionnaires.

2.2.2. Remote Sensing Image Processing Data

Remote sensing data come from the Gaofen-2 satellite data of China, which are 0.8 m four-band bundle data. We obtained RS images of FNWP for 31 August 2022, the data were acquired with data processing level 1A, and there is no cloud coverage; the data quality is good. To improve the visualization of remote sensing images, we pre-processed with atmospheric correction, topographic correction, color leveling, fusion, and cropping. Additionally, we used Image Enhancement Processing to make the landscape of the study area more visible in the picture, aiding in identifying and further classifying the study area, and removing unimportant or irrelevant image information to highlight the key contents of the study area [49].

2.3. Methods

2.3.1. Soil Physical and Chemical Parameters

Six quadrants were selected in different wetland types, and a total of 18 soil samples were collected to measure the physical and chemical property indices of the soil (Figure 1), including pH, organic matter content, total nitrogen (TN), and total phosphorus (TP).

2.3.2. Water Quality

We set up 20 monitoring sites (Figure 1) including farmland ditches, natural wetland locations, and entrance and exit gates. pH, Secchi Depth (SD), dissolved oxygen (DO), and Chlorophyll-a (Chl-a) were measured in situ with YSI 6920 equipment (YSI, Yellow Spings, OH, USA).
Laboratory measurements included TN, TP, biochemical oxygen demand (BOD5), and chemical oxygen demand (CODMn), and were determined according to the Chinese national standard “Environmental Quality Standard for Surface Water” (GB3838-2002) [50]. Furthermore, surface water quality was classified into five levels: I, II, III, IV and V [50].
In order to transform the eutrophication evaluation standard value into an evaluation result that is easy for the public to understand, the comprehensive trophic level index TLI (∑) [51,52,53] was used to estimate the definite water trophic state.
TLI = j = 1 m W j × TLI j
where TLI(j) is the trophic level index of j and Wj is the correlative weight for the trophic level index of j.

2.3.3. Wetland Waterfowl

FNWP plays a significant role as a key stopover point along the East Asian–Australasian bird migration route. As it serves as a critical breeding and migratory habitat for numerous protected avian species, the judicious selection of bird indicators becomes imperative. Bird monitoring was conducted from March to September 2022, covering as much of the surrounding agricultural land as possible (Figure 1) [54,55]. With the help of binoculars and monoculars in open habitats, we directly recorded the birds’ species, number, location, and distribution. The Shannon–Weiner diversity index (H’), Margalef species richness index (D), and Pielou (J) evenness index were used to assess the species diversity of bird communities in FNWP.

2.3.4. Wetland Area and Land Use

The changes of the wetland area were obtained by the interpretation of remote sensing images from 2017 to 2022. Based on the results of remote sensing impact classification derived from ArcGIS 10.8, the ratio of non-wetland area (farmland, building land and shelterbelt) to the total area was calculated as the land use intensity of FNWP wetlands.

2.3.5. Landscape Indices

In this study, patch density (PD) and Shannon’s diversity index (SHDI) were used to indicate the degree of the ecological fragmentation of wetlands and the degree of the heterogeneity of wetland landscapes, respectively [56,57]. These two indices were selected based on the classification results of ArcGIS 10.8, converted to raster data and then imported into Fragstats 4.2 software for calculation.
Patch density can show the overall degree of patch differentiation and fragmentation of a wetland landscape, which is calculated as follows:
P D = N i / A i
Here, PD indicates the patch density, which is the ratio of the total number of wetland landscape patches to the total wetland area.
Shannon’s diversity index reflects the diversity of wetland landscape, which is calculated as follows:
S H D I = i = 1 n P i ln P i
Here, SHDI indicates Shannon’s diversity index and Pi is the ratio of the area occupied by land use type i to the total landscape area.

2.3.6. Indicator System Establishment

Based on the long-term monitoring of wetland ecological characteristics and using previous research as a reference, 18 indicators including wetland soil, water quality, bird diversity, landscape structure, and social value were selected to construct the FNWP wetland ecosystem health evaluation system. The specific indicators are shown in Table 1.

2.3.7. Questionnaire

We collected data by randomly distributing survey questionnaires around the study area. A total of 50 questionnaires were distributed, and 48 valid questionnaires were collected. The questionnaire adopted a 5-point scale, which consists of 5 integers ranging from 1 to 5. The higher score, the stronger people’s willingness to play a role, and the higher the value of science popularization and education in the research area.

2.3.8. Indices’ Weight and Assessment Methods

The evaluation process consists of several key steps: (1) Utilizing long-term monitoring data, along with reference literature [50,58,59,60] and expert guidance, each index within the index layer was assigned a score, and these indicees were then categorized into five levels and assigned standardized scores of 5, 4, 3, 2, and 1 (Table 2). (2) The relative importance of the evaluation indices at each level was assessed using the expert scoring method, resulting in a relative importance matrix. The weight of each index was determined using the hierarchical analysis method. (3) The ecosystem health index (EHI) was selected to calculate the wetland ecological health index score for FNWP, enabling the assessment of the level of the wetland’s ecological health (Table 3).
We used the analytic hierarchy process (AHP) method to analyze and calculate the appropriate weight of each factor. The AHP is a mature, multi-objective analysis method introduced and developed by Saaty [62]. It views a complex problem with multiple objective factors as an integrated system. It involves breaking down the overarching objective into multiple indices, subsequently establishing organized and interconnected hierarchies. This method not only formulates inherently intricate problems into a hierarchical structure but also allows for the consideration of diverse qualitative and quantitative criteria within the problem-solving framework [63,64,65,66]. The AHP is currently widely used to solve the difficulty in directly and accurately quantifying decision results, taking advantage of its strong systematicity, easy use, and smaller quantitative data requirement [65]. At the same time, this method has the disadvantages of being highly subjective, having too many factors, and a high number of pairwise comparisons required [67,68].
The elements of the upper level are used as criteria and have a dominant relationship with the elements of the next level. The importance of the relevant components on this level and the upper level is compared in pairs, and the comparison results are expressed quantitatively from 1 to 9 (Table 4). After constructing the judgment matrix, the maximum eigenvalue λmax of the matrix is calculated and the eigenvector obtained. The eigenvector is used as the weight vector W, and then a consistency test is performed. The consistency index is defined by the equation CI = λ m a x n n 1 , CR = CI/RI, where λmax is the largest eigenvalue of a preference matrix and n is the number of parameters [69,70,71]. When the CR is less than 0.10, it means that the matrix has passed the consistency check, otherwise the matrix needs to be reconstructed.
The ecosystem health index (EHI) is an effective short-term monitoring index. A higher EHI indicates a more functional ecosystem, whereas lower values indicate that the ecosystem is a poorly functioning landscape [73]. Its calculated using the following formula [74]:
E H I = i = 1 n E i W i
where EHI represents the ecosystem health index, n represents the number of evaluation indicators, Ei represents the standardized value of the i-th evaluation indicator, and Wi represents the weight of the i-th evaluation indicator.
The derived wetland ecological health index was also validated by the multi-objective linear weighting function method [75], with the validation equation [60]
E H I = i = 1 n i = 1 n E i W b i W i
where EHI represents the ecosystem health index, Ei represents the graded evaluation value of the i-th evaluation indicator, Wbi represents the weight of the i-th indicator relative to the criterion layer B in a single ranking, Wi represents the total ranking weight of the i-th indicator, and n represents the number of evaluation indicators.

3. Results

3.1. Restoration of Wetland Ecological Health Indicator Characteristics

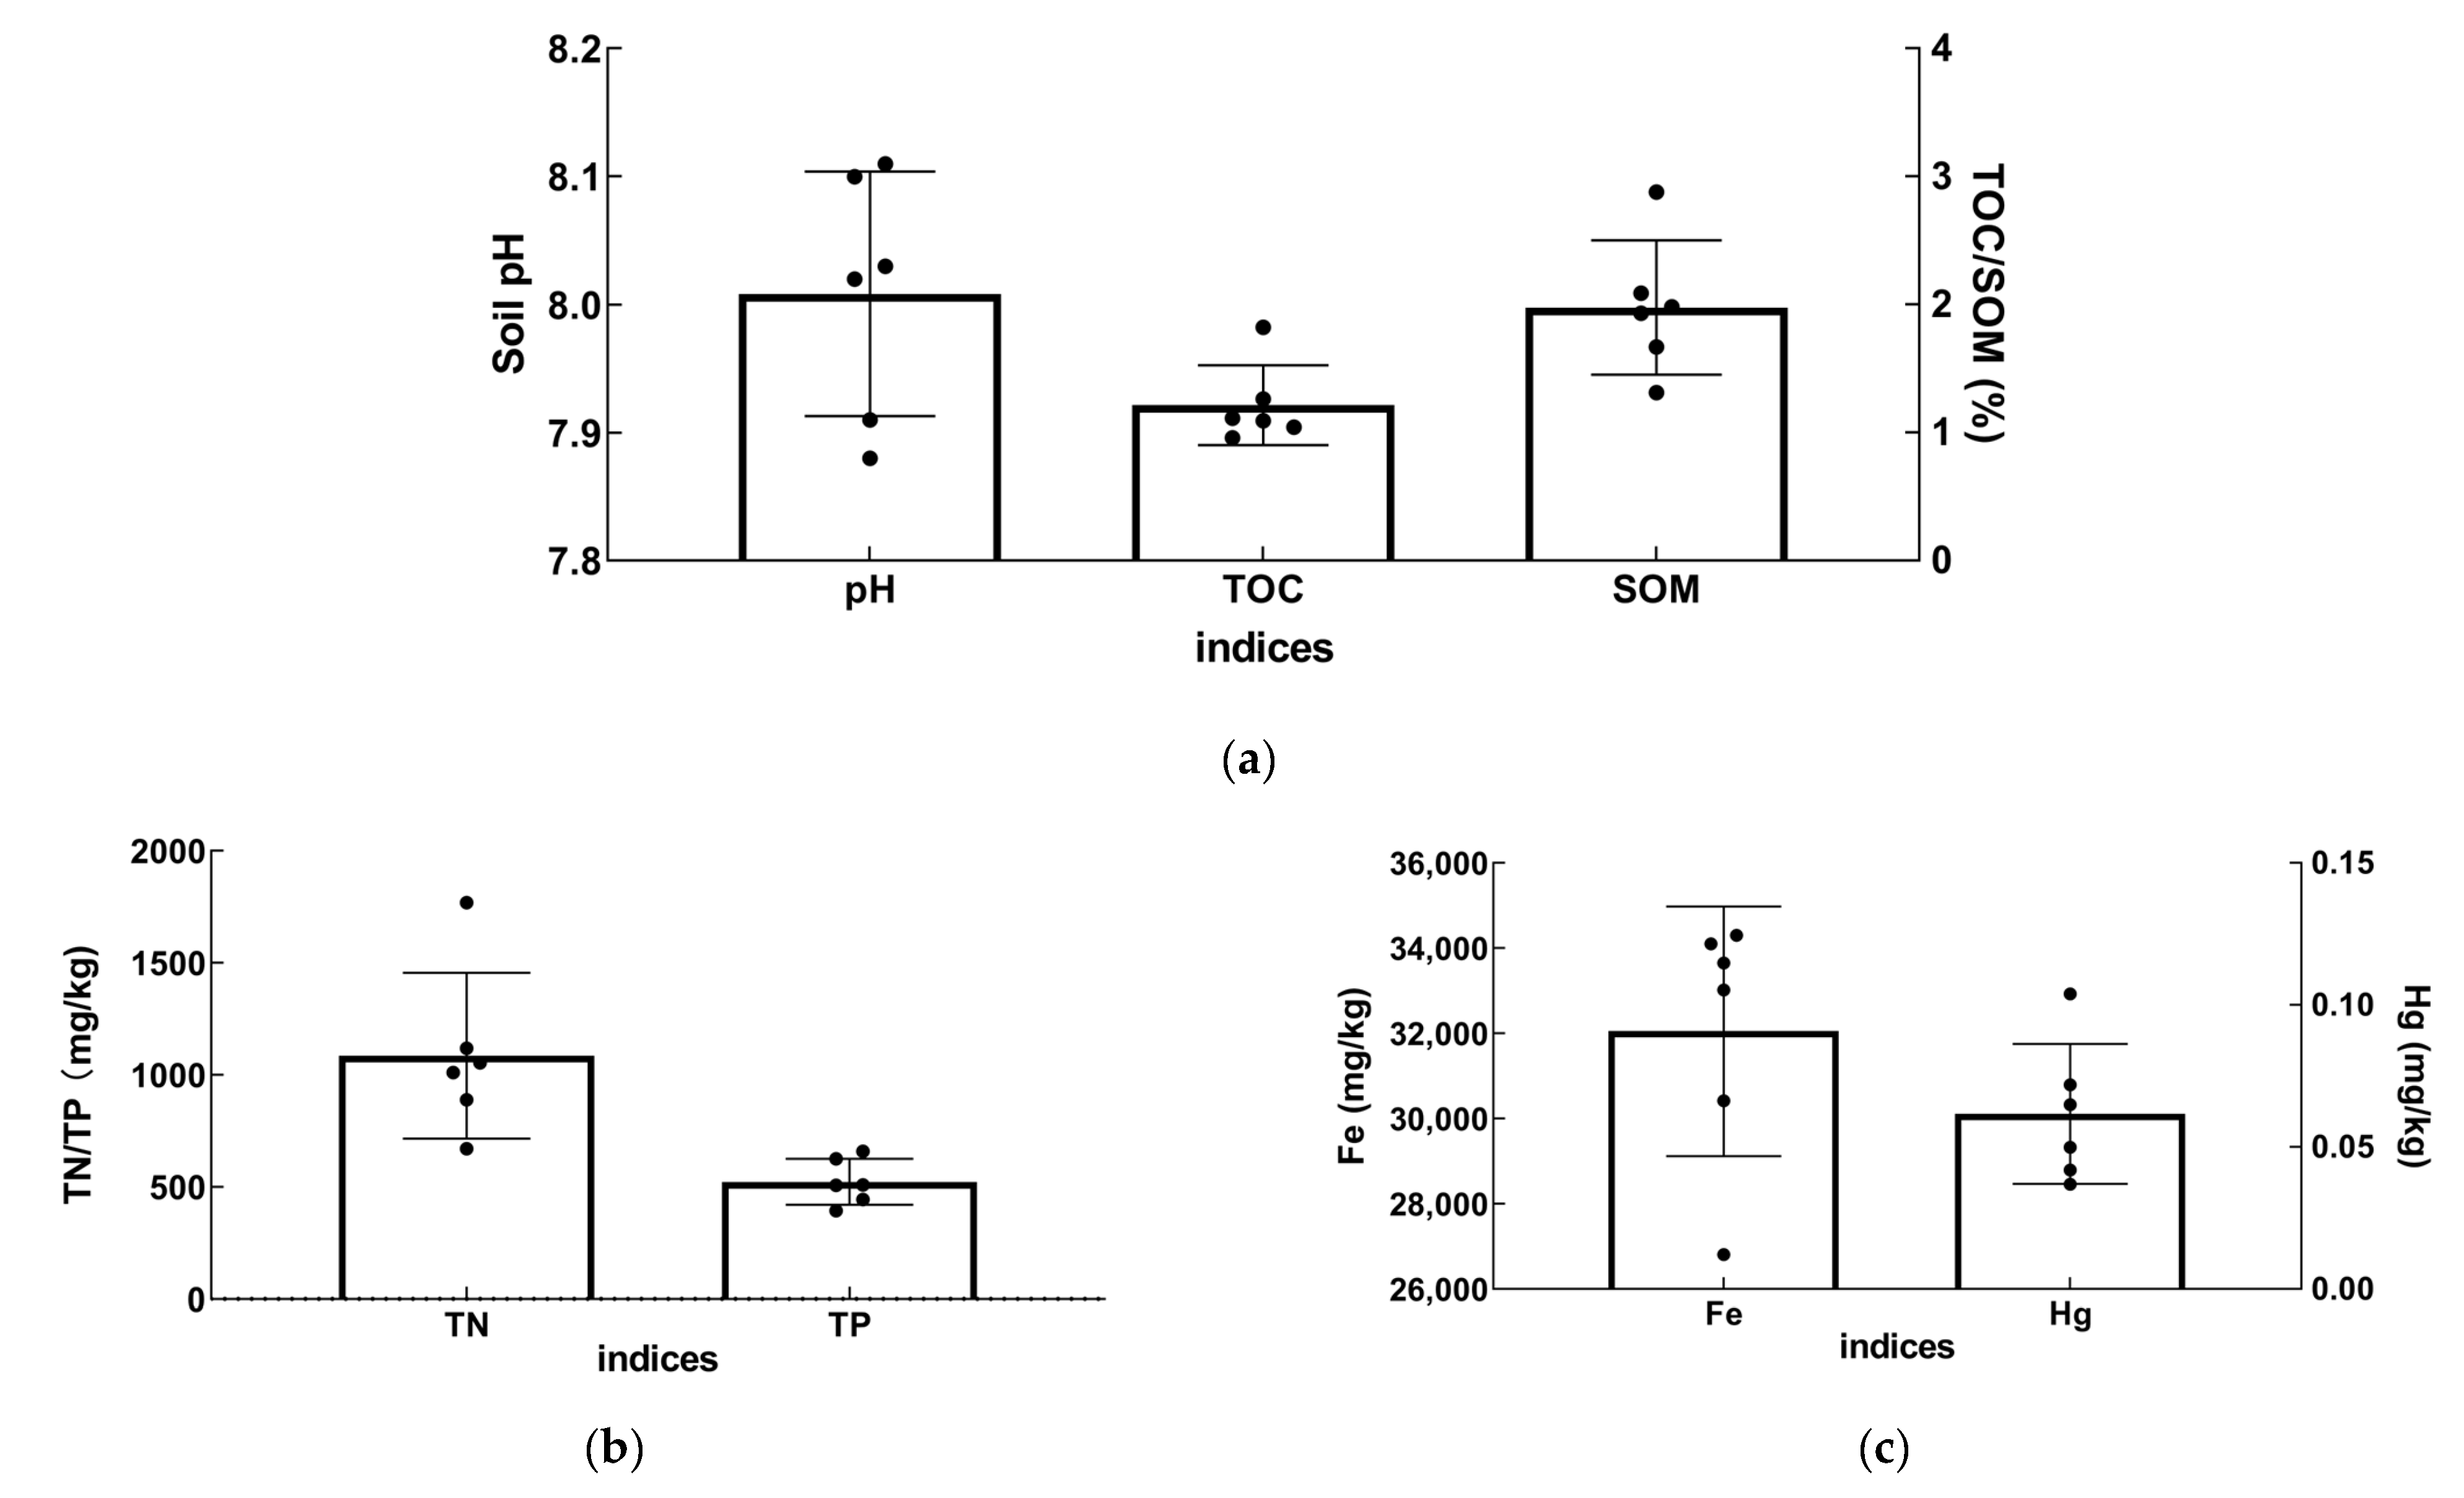
3.1.1. Soil Physical and Chemical Parameters

The main physicochemical properties of the restored wetland soils in the FNWP were determined through the laboratory testing of 18 soil samples (Figure 2). In 2022, the average pH of the wetland soils was 8.01, indicating a slight alkaline condition. The organic carbon (TOC) content ranged from 1.31% to 2.88%, the total nitrogen (TN) content ranged from 671.03 mg/kg to 1769.98 mg/kg, the total phosphorus (TP) content ranged from 394.68 mg/kg to 659.40 mg/kg, the mercury (Hg) content ranged from 0.037 mg/kg to 0.104 mg/kg, and the iron (Fe) content ranged from 26,794 mg/kg to 34,688 mg/kg. These values do not meet the standards for typical wetlands [60,76], indicating that the basic structure and internal components of the soil were still in a state of gradual recovery.

3.1.2. Wetland Water Quality

By conducting experimental analyses on samples collected from 20 water monitoring points in the FNWP, we found that the average water pH value of the restored wetland in 2022 was 6.45, indicating a neutral condition (Figure 3). The average TLI was 56.34, indicating a mild eutrophic state.

3.1.3. Wetland Area Change Rate and Landscape Indices

The wetland area (swamp and water) was extracted by acquiring remote sensing images of the FNWP for 2017, 2020, and 2022. Briefly, the FNWP wetland area showed a slow increasing trend combined with a maximum wetland area of 910.73 ha in 2022 (Table 5).
The FNWP wetland landscape pattern index was calculated based on the classification results, and the results are shown in Table 4. The land-use types of the FNWP wetlands in 2022 include five categories: swamp, water, farmland, building, and shelterbelt (Figure 4). Marsh has the largest area, accounting for 69% of the total area. The non-wetland area was 110.43 ha, and the calculated land-use intensity for the FNWP is 0.096 (Table 5).

3.1.4. Bird Diversity

A total of 33 bird species belonging to 7 orders and 14 families were recorded in 2022. Common species included Anas formosa, Fulica atra, Podiceps cristatus, Chlidonias leucoptera, Anas platyrhynchos, Larus ridibundus and so on, most of which are wading birds. The seasonal variation in the FNWP’s bird diversity is shown in Table 6. The Mean Shannon–Winner diversity for birds in 2022 was 1.66, the Pielou evenness was 0.50, and Margalef species richness was 2.76.

3.2. Wetland Ecological Health Index

In this study, we determined the weight of the evaluation indicators based on the ecological monitoring results of the restored wetland and expert opinions, taking into account of the actual situation of construction and management in the FNWP. Weight judgment matrices were constructed for the criterion layer and indicator layer. The EHI score for the wetland in the FNWP is shown in Table 7. The results of the EHI (3.68) indicated that the restored wetland’s state is at a “good” level. Furthermore, the wetland exhibited a pronounced trend in its landscape pattern and remote sensing images in 2022. In the year 2022, although the comprehensive physical and chemical characteristics of the wetland soil did not yet meet the standards set for typical wetlands, the restored wetland provided effective water quality purification and bird biodiversity capabilities.

4. Discussion

4.1. Wetland Landscape Pattern

The landscape pattern index is an important index to measure the spatial structure characteristics of a landscape. It is a manifestation of landscape heterogeneity as a result of various ecological processes, including disturbance, acting at different scales. From the perspective of the entire wetland landscape, swamp accounts for the largest proportion, followed by water. In terms of the landscape pattern index, the LPI has the largest weight of the landscape indices, and the SHDI has the smallest weight (Table 5). In similar studies, Liu et al. developed a landscape-based multi-metric index (LMI) to assess the condition of the Poyang Lake wetland; the results of this study showed that a higher LPI value is associated with a better health status and a higher SHDI value is associated with a poorer health status [77], which is consistent with the results of this study. From 2017 to 2022, the wetland area of FNWP gradually increased (876.72 ha, 910.73 ha), while the number of patches (NP) and PD showed a decreasing trend (Table 8). The significant increase in LPI indicated that the fragmentation of wetland area had been decreasing year by year, and the landscape’s resistance to disturbance had increased. SHDI reflects the diversity and heterogeneity of the landscape [57,78]. From 2017 to 2022, the SHDI of the wetlands slightly decreased, indicating a slight decrease in the heterogeneity of the wetland landscape. The fragmented patches were gradually replaced by wetlands, indicating that the landscape pattern of the wetlands was gradually and slowly recovering.

4.2. Ecological Indicators

Wetland water quality and soil are important indicators that characterize the effectiveness of wetland restoration and have a huge impact on wetland ecological health. The results of this study indicate that, in 2022, the soil TN and TP in the FNWP wetland decreased compared to 2017. The mean concentration of heavy metal mercury (Hg) in the soil surface was 0.06 mg/kg, and the iron (Fe) content was 32,053 mg/kg, which were significantly lower than the values in 2017 (Hg: 0.198 mg/kg, Fe: 35,497 mg/kg) [60]. These findings suggested that the wetland soil was healthier and undergoing recovery. This may be due to the increase in the wetland area, the rise of the water level, the acceleration of the release rates of Hg and Fe from the soil, and the reduction in fertilizer use in the surrounding farmland [79,80].
The results of this study indicated that, in 2022, the DO and CODMn in the water of the FNWP wetland met the national Class I water standard (≥7.5, ≤15). The overall concentration of BOD5 was within the optimal range (3~4 mg/L), suggesting that the water quality of the FNWP was generally good [50]. Wetlands have effectively played their role in purifying the water quality. The overall water quality of wetlands in the FNWP in 2022 was mildly eutrophic, with a value of 56.1, which was consistent with previous studies [43]. This may be attributed to the continuous accumulation of nutrients in farmland drainage ditches and the increase in organic matter content in the water bodies [53,81,82].
As one of the most sensitive indicator species of wetlands, wetland birds can characterize the diversity of species and reflect the health of wetlands [83]. Mereta et al. found that environmental factors and anthropogenic disturbances were the main influencing factors on bird diversity, while spatial factors played an unimportant role [84]. In this study, the Shannon–Winner diversity and Pielou evenness of birds in 2022 were found to be the highest in summer, with values of 1.82 and 0.56 (Table 6), respectively, possibly due to the abundance of food in the marsh during this season. Additionally, the lush growth of plants such as reeds and irises provide birds with suitable hiding conditions [54,55].

4.3. Analysis of the FNWP Wetland’s Health Status

The assessment of ecosystem health is an effective method for understanding the security status of ecosystems, which can provide basic support for the healthy development and planning management of ecosystems [85]. In this study, we utilized field surveys, on-site monitoring, remote sensing technology, and landscape pattern indices to construct an ecological health evaluation system for the restored wetlands in the FNWP. We employed hierarchical analysis to determine the weights of the various indices and calculated the EHI, and then the effectiveness of the wetland restoration could be initially assessed based on its EHI score. In a previous study, Li et al. developed a system to assess the effectiveness of the FNWP wetland restoration, considering factors such as water supply function, water quality, soil resources, species diversity, landscape adaptability, and park construction, and the results showed that the FNWP wetland EHI score was 3.5 [60]. Finally, the FNWP wetland was considered to be recovering at a satisfactory level, which aligns with the findings of this study, albeit with a slight increase (3.68). According to the final assessment of the whole ecosystem, the FNWP wetland ecosystem was in “good” condition, this result is mainly affected by the wetland water quality (Table 6). This result suggests that the ecosystem maintains good natural conditions, its structure is reasonable and complete, its resilience is strong and its function is normal, the outside pressure on it is small, its restoration ability is strong, and abnormal phenomena do not appear in system [61,86].
This study constructed a swamp wetland ecological health evaluation system for wetlands that were converted from farmland to wetland, and applied this system to the later health evaluation of swamp wetlands. However, due to limited resources, obtaining data for some indicators remains challenging and the system is not comprehensive enough. Therefore, we will continue to conduct in-depth research in the future, focusing on supplementing and expanding the system to enhance its scientific nature and universal applicability. In terms of wetland supervision and management, it is crucial for relevant government departments to enhance public awareness and education, increase people’s awareness of the protection and sustainable utilization of wetland resources, and reduce the use of pesticides. Additionally, the management and construction departments responsible for the park should prioritize the development of ecological and environmental protection facilities. During the construction process, careful consideration should be given to whether the level of wetland resources and ecological utilization requirements, as well as the needs of the community, are ultimately achieving a harmonious balance between wetland protection, economic development, and social progress [87,88].

5. Conclusions

The ecosystem health index score of the restored wetland in the FNWP is 3.68, and the wetland ecosystem is in “good” condition. The main factors affecting the health of wetland ecosystems are wetland water quality, landscape structure, and soil properties. The results of this study can provide a scientific reference for the protection and management of restored wetlands. In the future, we aim to procure a more comprehensive dataset, facilitating the development of a scientifically rigorous evaluation framework.

Author Contributions

R.C.: conceptualization, methodology, investigation, software, formal analysis, writing—original draft, writing—review and editing. J.W.: conceptualization, methodology, investigation, formal analysis, writing—original draft, writing—review and editing. X.T.: supervision, conceptualization, data curation, writing—original draft. Y.Z.: methodology, software, supervision, writing—review and editing. M.J.: data curation, methodology, supervision, visualization. H.Y.: funding acquisition, project administration, visualization, resources. C.Z.: conceptualization, funding acquisition, supervision, resources. X.Z.: formal analysis, investigation, software. All authors have read and agreed to the published version of the manuscript.

Funding

This work was supported by the National Natural Science Foundation of China (42001112).

Data Availability Statement

The data presented in this study are available on request from the corresponding author.

Conflicts of Interest

The authors declare no conflict of interest.

References

  1. Ma, Z.; Zhang, M. Prospective on Development Trends of International Wetland Conservation and Management from the 12th Meeting of the Conference of the Parties of the Convention on Wetlands. Wetl. Sci. Manag. 2015, 13, 523–527. [Google Scholar]
  2. Moreno-Mateos, D.; Power, M.E.; Comín, F.A.; Yockteng, R. Structural and functional loss in restored wetland ecosystems. PLoS Biol. 2012, 10, e1001247. [Google Scholar] [CrossRef] [PubMed]
  3. Wahlroos, O.M.; Valkama, P.; Mäkinen, E.; Ojala, A.; Vasander, H.; Väänänen, V.-M.; Halonen, A.; Linden, L.; Nummi, P.; Ahponen, H.; et al. Urban wetland parks in Finland: Improving water quality and creating endangered habitats. Int. J. Biodiv. Sci. Ecosyst. Serv. Manag. 2015, 11, 46–60. [Google Scholar] [CrossRef]
  4. Wondie, A. Ecological conditions and ecosystem services of wetlands in the Lake Tana Area, Ethiopia. Ecohydrol. Hydrobiol. 2018, 18, 231–244. [Google Scholar] [CrossRef]
  5. Chen, W.; Cao, C.; Liu, D.; Tian, R.; Wu, C.; Wang, Y.; Qian, Y.; Ma, G.; Bao, D. An evaluating system for wetland ecological health: Case study on nineteen major wetlands in Beijing-Tianjin-Hebei region, China. Sci. Total Environ. 2019, 666, 1080–1088. [Google Scholar] [CrossRef] [PubMed]
  6. Cao, T.G.; Yi, Y.; Liu, H.X.; Yang, Z.F. Integrated ecosystem services-based calculation of ecological water demand for a macrophyte-dominated shallow lake. Glob. Ecol. 2020, 21, e00858. [Google Scholar] [CrossRef]
  7. Cai, Y.; Liang, J.; Zhang, P.; Wang, Q.; Wu, Y.; Ding, Y.; Wang, H.; Fu, C.; Sun, J. Review on strategies of close-to-natural wetland restoration and a brief case plan for a typical wetland in northern China. Chemosphere 2021, 285, 131534. [Google Scholar] [CrossRef]
  8. Maltby, E.; Acreman, M.C. Ecosystem services of wetlands: Pathfinder for a new paradigm. Hydrol. Sci. J. 2011, 56, 1341–1359. [Google Scholar] [CrossRef]
  9. Mitsch, W.J.; Bernal, B.; Hernandez, M.E. Ecosystem services of wetlands. Int. J. Biodiv. Sci. Ecosyst. Serv. Manag. 2015, 11, 1–4. [Google Scholar] [CrossRef]
  10. Jiang, T.T.; Pan, J.F.; Pu, X.M.; Wang, B.; Pan, J.J. Current status of coastal wetlands in China: Degradation, restoration, and future management. Estuar. Coast. Shelf Sci. 2015, 164, 265–275. [Google Scholar] [CrossRef]
  11. Xu, S.; Liu, X.; Li, X.; Tian, C. Soil organic carbon changes following wetland restoration: A global meta-Analysis. Geoderma 2019, 353, 89–96. [Google Scholar] [CrossRef]
  12. Ekumah, B.; Armah, F.A.; Afrifa, E.K.; Aheto, D.W.; Odoi, J.O.; Afitiri, A.-R. Geospatial assessment of ecosystem health of coastal urban wetlands in Ghana. Ocean Coast. Manag. 2020, 193, 105226. [Google Scholar] [CrossRef]
  13. Zhang, Y.; Jeppesen, E.; Liu, X.; Qin, B.; Shi, K.; Zhou, Y.; Thomaz, S.M.; Deng, J. Global loss of aquatic vegetation in lakes. Earth Sci. 2017, 173, 259–265. [Google Scholar] [CrossRef]
  14. Sieben, E.J.J.; Khubeka, S.P.; Sithole, S.; Job, N.M.; Kotze, D.C. The classification of wetlands: Integration of top-down and bottom-up approaches and their significance for ecosystem service determination. Wetl. Ecol. Manag. 2018, 26, 441–458. [Google Scholar] [CrossRef]
  15. Sizo, A.; Noble, B.; Bell, S. Futures analysis of urban land use and wetland change in Saskatoon, Canada: An application in strategic environmental assessment. Sustainability 2015, 7, 811–830. [Google Scholar] [CrossRef]
  16. Tong, Y.; Zhang, W.; Wang, X.; Couture, R.-M.; Larssen, T.; Zhao, Y.; Li, J.; Liang, H.; Liu, X.; Bu, X.; et al. Decline in Chinese lake phosphorus concentration accompanied by shift in sources since 2006. Nat. Geosci. 2017, 10, 507–511. [Google Scholar] [CrossRef]
  17. Best, J. Anthropogenic stresses on the world’s big rivers. Nat. Geosci. 2018, 12, 7–21. [Google Scholar] [CrossRef]
  18. Davidson, N.C. How much wetland has the world lost? Long-term and recent trends in global wetland area. Mar. Freshw. Res. 2014, 65, 219–235. [Google Scholar] [CrossRef]
  19. Fluet-Chouinard, E.; Stocker, B.D.; Zhang, Z.; Malhotra, A.; Melton, J.R.; Poulter, B.; Kaplan, J.O.; Goldewijk, K.K.; Siebert, S.; Minayeva, T.; et al. Extensive global wetland loss over the past three centuries. Nature 2023, 614, 281–286. [Google Scholar] [CrossRef]
  20. Costanza, R.; de Groot, R.; Sutton, P.; van der Ploeg, S.; Anderson, S.J.; Kubiszewski, I.; Farber, S.; Turner, R.K. Changes in the global value of ecosystem services. Glob. Environ. Chang. 2014, 26, 152–158. [Google Scholar] [CrossRef]
  21. Liu, W.; Guo, Z.; Jiang, B.; Lu, F.; Wang, H.; Wang, D.; Zhang, M.; Cui, L. Improving wetland ecosystem health in China. Ecol. Ind. 2020, 113, 106184. [Google Scholar] [CrossRef]
  22. Chatanga, P.; Kotze, D.C.; Okello, T.W.; Sieben, E.J. Ecosystem services of high-altitude Afromontane palustrine wetlands in Lesotho. Ecosyst. Serv. 2020, 45, 101185. [Google Scholar] [CrossRef]
  23. Zhu, H.; Wu, H.T.; Xing, X.X.; Xie, T.; Song, C.; Wang, G.; Jiang, M. Achievement of wetland protection and restoration and development strategies in China. Bull. Chin. Acad. Sci. 2023, 38, 365–375. (In Chinese) [Google Scholar]
  24. Cui, B.; Yang, Z. Research advance of wetland ecosystem health. Chin. J. Ecol. 2001, 20, 31–36. (In Chinese) [Google Scholar]
  25. Keiter, R.B. Ecosystems and the law: Toward an integrated approach. Ecol. Appl. 1998, 8, 332–341. [Google Scholar] [CrossRef]
  26. Kim, J.J.; Atique, U.; An, K.G. Long-Term Ecological Health Assessment of a Restored Urban Stream Based on Chemical Water Quality, Physical Habitat Conditions and Biological Integrity. Water 2019, 11, 114. [Google Scholar] [CrossRef]
  27. Hruby, T. Testing the Basic Assumption of the Hydrogeomorphic Approach to Assessing Wetland Functions. Environ. Manag. 2001, 27, 749–761. [Google Scholar] [CrossRef] [PubMed]
  28. Rapport, D.J.; Friend, A.M. Towards a Comprehensive Framework for Environmental Statistics: A Stress-Response Approach; Statistics Canada: Ottawa, ON, Canada, 1979; Volume 11, p. 87. [Google Scholar]
  29. Brown, M.T.; Vivas, M.B. Landscape development intensity index. Environ. Monit. Assess. 2005, 101, 289–309. [Google Scholar] [CrossRef]
  30. Malekmohammadi, B.; Jahanishakib, F. Vulnerability assessment of wetland landscape ecosystem services using driver-pressure-state-impact-response (DPSIR) model. Ecol. Indic. 2017, 82, 293–303. [Google Scholar] [CrossRef]
  31. Chen, F.; Su, S.C.; Chen, Y.; Li, N.; Wang, R.; You, W.B.; He, D.J. Ecological Health Assessment of Coastal Wetlands Based on PSR Model in Eastern Fujian. Wetl. Sci. Manag. 2020, 16, 25–29. (In Chinese) [Google Scholar]
  32. Zhang, L.L.; Liu, J.L.; Yang, Z.F.; Li, Y.; Yang, Y. Integrated ecosystem health assessment of a macrophyte-dominated lake. Ecol. Model. 2013, 252, 141–152. [Google Scholar] [CrossRef]
  33. Mo, M.; Wang, X.; Wu, H.; Cai, S.; Zhang, X.; Wang, H. Ecosystem Health Assessment of Honghu Lake Wetland of China Using Artificial Neural Network Approach. Chin. Geogra. Sci. 2009, 19, 349–356. [Google Scholar] [CrossRef]
  34. Sun, R.; Yao, P.; Wang, W.; Yue, B.; Liu, G. Assessment of Wetland Ecosystem Health in theYangtze and Amazon River Basins. ISPRS Int. J. Geo-Inf. 2017, 6, 81. [Google Scholar] [CrossRef]
  35. Wu, C.; Chen, W.; Cao, C.; Tian, R.; Liu, D.; Bao, D. Diagnosis of Wetland Ecosystem Health in the Zoige Wetland, Sichuan of China. Wetlands 2018, 38, 469–484. [Google Scholar] [CrossRef]
  36. Wu, C.; Chen, W. Indicator system construction and health assessment of wetland ecosystem—Taking Hongze Lake Wetland, China as an example. Ecol. Indic. 2020, 112, 106164. [Google Scholar] [CrossRef]
  37. Wang, W.; Sun, M.; Li, Y.; Zhao, S.; Zhang, Z.; Luan, X. Multi-Level Comprehensive Assessment of Constructed Wetland Ecosystem Health: A Case Study of Cuihu Wetland in Beijing, China. Sustainability 2022, 14, 13439. [Google Scholar] [CrossRef]
  38. Mao, X.; Wei, X.; Jina, X.; Tao, Y.; Zhang, Z.; Wang, W. Monitoring urban wetlands restoration in Qinghai Plateau: Integrated performance from ecological characters, ecological processes to ecosystem services. Ecol. Indic. 2019, 101, 623–631. [Google Scholar] [CrossRef]
  39. Galatowitsch, S.; Bohnen, J. Predicting restoration outcomes based on organizational and ecological factors. Restor. Ecol. 2020, 28, 1201–1212. [Google Scholar] [CrossRef]
  40. Galatowitsch, S.; Bohnen, J. Long-Term Recovery of a Restored Palustrine Wetland: The Role of Monitoring and Adaptive Management. Wetlands 2021, 41, 80. [Google Scholar] [CrossRef]
  41. Zhao, K. Mires in China; Science Press: Beijing, China, 1999. (In Chinese) [Google Scholar]
  42. Li, X. Black swans were found in Sanhuanpao Nature Reserve. Chin. Wildl. 2005, 3, 29. (In Chinese) [Google Scholar]
  43. Li, N.; Tian, X.; Fu, H.C.; Li, Y.; Jia, X.; Jin, G.; Jiang, M. Seasonal and Spatial Variability of Water Quality and Nutrient Removal Efficiency of Restored Wetland: A Case Study in Fujin National Wetland Park, Chin. Chin. Geogr. Sci. 2018, 28, 123–133. [Google Scholar] [CrossRef]
  44. Liu, X.; Ma, X. Influence of Large-Scale Reclamation on Natural Environment and Regional Environmental Protection in the Sanjiang Plain. Sci. Geogr. Sin. 2000, 20, 14–19. (In Chinese) [Google Scholar]
  45. Liu, D.W. Land Use/Cover Change and its Environmental Effects in Sanjiang Plain in the Past 50 Years. Master’s Thesis, Jilin University, Changchun, China, 2006. [Google Scholar]
  46. Yuan, Z.; Liu, X.; Du, H.; Zhang, M. Can artificial ecological islands alter the biodiversity of macroinvertebrate? A case study in Fujin National Wetland Park, the Sanjiang Plain, China. Ecol. Evol. 2021, 11, 14988–15003. [Google Scholar] [CrossRef] [PubMed]
  47. Wan, H.L.; Wang, S.G.; Chen, B.; Xia, C.Y.; Su, R. Ecological risk assessment and spatial threshold analysis of wetland in the Sanjiang Plain. Acta Ecol. Sin. 2022, 42, 6595–6606. [Google Scholar]
  48. Sun, M.Y.; Tian, X.; Zou, Y.C.; Jiang, M. Ecological aesthetic assessment of a rebuilt wetland restored from farmland and management implications for National Wetland Parks. PLoS ONE 2019, 14, e0223661. [Google Scholar] [CrossRef] [PubMed]
  49. Liu, J.; Ye, J.; Yang, W.; Guo, H.C.; Yu, S.X. A GIS-Based Landscape Pattern Optimization Approach for Lake Dianchi Watershed. J. Nat. Resour. 2012, 5, 801–808. (In Chinese) [Google Scholar]
  50. GB3838-2002; Environmental Quality Standards for Surface Water. China Environmental Science Press: Beijing, China, 2002. (In Chinese)
  51. Zhang, J.Y.; Ni, W.M.; Luo, Y.; Stevenson, R.J.; Qi, J.G. Response of freshwater algae to water quality in Qinshan Lake within Taihu Watershed, China. Phys. Chem. Earth 2011, 36, 360–365. [Google Scholar] [CrossRef]
  52. Huo, S.; Ma, C.; Xi, B.; Su, J.; Zan, F.; Ji, D.; He, Z. Establishing eutrophication assessment standards for four lake regions, China. J. Environ. Sci. 2013, 25, 2014–2022. [Google Scholar] [CrossRef]
  53. Liu, X.; Zhang, G.; Sun, G.; Wu, Y.; Chen, Y. Assessment of Lake Water Quality and Eutrophication Risk in an Agricultural Irrigation Area: A Case Study of the Chagan Lake in Northeast China. Water 2019, 11, 2380. [Google Scholar] [CrossRef]
  54. Liu, H.; Li, T.; Chen, L.; Wang, Q. Seasonal Variation of Bird Diversity in Wetlands along River in Fujin City, Heilongjiang Province. Wetl. Sci. 2015, 13, 577–581. [Google Scholar]
  55. Zhou, Y.; Sheng, C.; Yuan, Y. Changes of Bird Diversity in Fujin National Wetland Park in Heilongjiang Province. Wetl. Sci. Manag. 2017, 13, 57–60. [Google Scholar]
  56. Sun, Y. Ecosystem Health Evaluation of Rizhao Futong Estuary Wetland Based on RS and GIS. Master’s Thesis, Qufu Normal University, Jining, China, 2016. [Google Scholar]
  57. Zhou, Y. Assessment of the Ecological Health of Wetlands in Baiyangdian Nature Reserve by RS and GIS Techniques. Master’s Thesis, Hebei University, Baoding, China, 2017. [Google Scholar]
  58. Zhang, F.; Wang, X.; Liang, X.; Kong, X.; Zhang, Q.; Yang, L. Analysis of Classification and Mapping for Great Group, Subgroup in Second National Soil Survey. Soils 2014, 46, 761–765. (In Chinese) [Google Scholar]
  59. Ren, J.; Sun, Y.; Chen, X.; Fan, Z. An Assessment of Ecosystem Health in Jiuduansha Wetland based on PSR Model. Wetl. Sci. Manag. 2012, 8, 12–16. [Google Scholar]
  60. Li, N. Ecological Characteristics Change and Effect Evaluation for Typical Restored Wetlands in the Sanjiang Plain. Ph.D. Thesis, Northeast Forestry University, Harbin, China, 2019. [Google Scholar]
  61. Hua, G.; Li, Y.; Huang, C.; Liang, C.; Wang, J. Study on the Assess Index System of the Ecological Restoration to the Lalu Wetland in Tibet. J. Sichuan Univ. (Eng. Sci. Ed.) 2005, 37, 20–25. [Google Scholar]
  62. Saaty, T.L. A scaling method for priorities in hierarchical structures. Math. Psychol. 1977, 15, 234–281. [Google Scholar] [CrossRef]
  63. Höfer, T.; Sunak, Y.; Siddique, H.; Madlener, R. Wind farm siting using a spatial Analytic Hierarchy Process approach: A case study of the Städteregion Aachen. Appl. Energy 2016, 163, 222–243. [Google Scholar] [CrossRef]
  64. Achour, Y.; Boumezbeur, A.; Hadji, R.; Chouabbi, A.; Cavaleiro, V.; Bendaoud, E.A. Landslide susceptibility mapping using analytic hierarchy process and information value methods along a highway road section in Constantine, Algeria. Arab. J. Geosci. 2017, 10, 194. [Google Scholar] [CrossRef]
  65. Sun, B.; Tang, J.; Yu, D.; Song, Z. Penggang Wang.Ecosystem health assessment: A PSR analysis combining AHP and FCE methods for Jiaozhou Bay, China. Ocean Coast. Manag. 2019, 168, 41–50. [Google Scholar] [CrossRef]
  66. Khodaparast, M.; Rajabi, A.M.; Edalat, A. Municipal solid waste landfill siting by using GIS and analytical hierarchy process (AHP): A case study in Qom city, Iran. Environ. Earth Sci. 2018, 77, 52. [Google Scholar] [CrossRef]
  67. Thanh, L.N.; De Smedt, F. Application of an analytical hierarchical process approach for landslide susceptibility mapping in A Luoi district, Thua Thien Hue Province, Vietnam. Env. Earth Sci. 2011, 66, 1739–1752. [Google Scholar] [CrossRef]
  68. Carmone, F.J., Jr.; Kara, A.; Zanakis, S.H. A Monte Carlo investigation of incomplete pairwise comparison matrices in AHP. Eur. J. Oper. Res. 1997, 102, 538–553. [Google Scholar] [CrossRef]
  69. Sutadian, A.D.; Muttil, N.; Yilmaz, A.G.; Perera BJ, C. Using the Analytic Hierarchy Process to identify parameter weights for developing a water quality index. Ecol. Indic. 2017, 75, 220–233. [Google Scholar] [CrossRef]
  70. Chen, Y.; Bouferguene, A.; Al-Hussein, M. Analytic hierarchy process-simulation framework for lighting maintenance decision-making based on the clustered network. J. Perform. Constr. Facil. 2018, 32, 04017114. [Google Scholar] [CrossRef]
  71. Luu, C.; Meding, J.V.; Kanjanabootra, S. Assessing flood hazard using flood marks and analytic hierarchy process approach: A case study for the 2013 flood event in Quang Nam, Vietnam. Nat. Hazards 2018, 90, 1031–1050. [Google Scholar] [CrossRef]
  72. Saaty, T.L. The analytic hierarchy and analytic network processes for the measurement of intangible criteria and for decision-making. In Multiple Criteria Decision Analysis: State of the Art Surveys; Figueira, J., Greco, S., Ehrgott, M., Eds.; Springer: New York, NY, USA, 2005; pp. 345–405. [Google Scholar]
  73. Xu, S.; Rowntree, J.; Borrelli, P.; Hodbod, J.; Raven, M.R. Ecological health index: A short term monitoring method for land managers to assess grazing lands ecological health. Environments 2019, 6, 67. [Google Scholar] [CrossRef]
  74. Song, C.Y.; Hu, H.X.; Huang, H.; Ren, H.X.; Huang, C. Assessing the health of rehabilitated reed wetland ecosystem in the Yellow River Delta. Acta Ecol. Sin. 2016, 36, 2705–2714. [Google Scholar]
  75. Liu, J.; Guo, J.; Guo, J.; Zheng, S.; Lin, L. The Ecological Evaluation of the Forest Ecosystems in Mangdangshan Nature Reserve. J. Fujian Coll. For. 2003, 23, 106–110. [Google Scholar]
  76. Li, R.; Chai, M.; Qiu, G.; Shi, F.; Sasa, K. Profile Nutrient Distribution and Sedimentary Characteristics in Typical Marshes of Sanjiang Plain. Environ. Sci. 2014, 35, 2928–2936. (In Chinese) [Google Scholar]
  77. Liu, D.; Liu, L.; You, Q.; Hu, Q.; Jian, M.; Liu, G.; Cong, M.; Yao, B.; Xia, Y.; Zhong, J.; et al. Development of a Landscape-Based Multi-Metric Index to Assess Wetland Health of the Poyang Lake. Remote Sens. 2022, 14, 1082. [Google Scholar] [CrossRef]
  78. Ma, R. Study on Landscape Ecological Health in Panjin Shuangtaizi Estuarine and Coastal Wetland Based on Remote Sensing Image. Master’s Thesis, Dalian Maritime University, Dalian, China, 2015. [Google Scholar]
  79. Jiao, W.; Ouyang, W.; Hao, F.; Wang, F.; Liu, B. Long-term cultivation impact on the heavy metal behavior in a reclaimed wetland, Northeast China. J. Soils Sediments 2014, 14, 567–576. [Google Scholar] [CrossRef]
  80. Zhang, H.; Wang, S.; Wang, J.; Wu, X.; Ma, S.; Wu, Y.; Li, J.; Xu, N. Effects of different land use types on soil physicochemical properties and aggregate composition in Sanjiang Plain wetland. Chin. J. Ecol. 2019, 38, 1679–1687. [Google Scholar]
  81. Liu, J.T.; Fang, S.W.; Sun, J.J. Nutrient zoning of Poyang Lake based on aquatic eco-environment indices. Environ. Earth Sci. 2016, 75, 61. [Google Scholar] [CrossRef]
  82. Fang, N.; You, Q.; Liu, L.; Li, J.; Lu, C.; Zhang, L.; Yang, T.; Yu, Z.; Lü, Z.; Yang, W. Evaluation of eutrophication in Poyang Lake wetland during autumn based on the cloud model. Acta Ecol. Sin. 2019, 39, 6314–6321. [Google Scholar]
  83. Xiao, K.; Zhu, Y.; Zhou, M.; Fan, R. Health Assessmentof Wetland in Suzhou Based on Bird-based Index of Biotic integrity. J. Chin. Urban For. 2022, 20, 114–119. (In Chinese) [Google Scholar]
  84. Mereta, S.T.; Lemmens, P.; De Meester, L.; Goethals, P.L.M.; Boets, P. The Relative Importance of Human Disturbance, Environmental and Spatial Factors on the Community Composition of Wetland Birds. Water 2021, 13, 3448. [Google Scholar] [CrossRef]
  85. Peng, C.; Li, B.; Nan, B. An analysis framework for the ecological security of urban agglomeration: A case study of the Beijing-Tianjin-Hebei urban agglomeration. J. Clean. Prod. 2021, 315, 128111. [Google Scholar] [CrossRef]
  86. Cui, B.S.; Yang, Z.F. Establishing an Indicator System for Ecosystem Health Evaluation on Wetlands. A Theoretical Framework. Acta Ecol. Sin. 2002, 22, 1005–1011. [Google Scholar]
  87. Jiang, M.; Zou, Y.C.; Zhang, G.X.; Tong, S.; Wu, H.; Liu, X.; Zhang, Z.; Xue, Z.; Lü, X. Progress and prospects of wetland science in China-Commemoration on the 60th anniversary of the founding of Northeast Institute of Geography and Agroecology, Chinese Academy of Sciences. Wetl. Sci. 2018, 16, 279–287. (In Chinese) [Google Scholar]
  88. Yu, G.R.; Yang, M.; Hao, T.X. Coordinate the five-pool functions of ecosystem and buildstrong national ecological infrastructures—Ecological construction ideology, tasks and goals in the new developing era of China. Bull. Chin. Acad. Sci. 2022, 37, 1534–1538. (In Chinese) [Google Scholar]
Figure 1. Location of sampling sites in FNWP.
Water 16 00410 g001
Figure 2. Soil physicochemical characteristics in FNWP. ((a) Soil pH, TOC and SOM, (b) TN and TP, (c) Fe and Hg).
Water 16 00410 g002
Figure 3. The water quality indices of the FNWP. ((a) SD, (b) Water pH/CODMn/BOD5/DO/Chl-a, (c) TN and TP).
Water 16 00410 g003
Figure 4. Land-use classification map of FNWP.
Water 16 00410 g004
Table 1. Hierarchical chart of wetland ecosystem health assessment indicators.
Level-1 IndicatorLevel-2 IndicatorData SourceFrequency
SoilSoil pHExperimental analysis1 time per year
Organic matter content
TP
TN
Hg
WaterWater pHExperimental analysis3 times (spring, summer, and autumn)
DO
BOD5
CODMn
The comprehensive nutritive index
Wetland waterfowlWaterfowl species and populationsSampling the line transect or sampling sites’ data statistics1 time per year
Landscape indicesChange rate of wetland areaRemote sensing image processing1 time per year
Land-use intensity
Largest patch index
Patch density
Shannon’s diversity index
SocietyTourism valueQuestionnaire1 time per year
Scientific research value
Table 2. Indicators of wetland ecological health assessment system and classification standards.
Overall Normalized Score54321
Soil pH7–86–7, 8–95–6, 9–103–5, 10–120–3, 12–14
Organic matter content (%)>43-42-31-2<1
TP (g/kg)>1.00.7–1.00.4–0.70.2–0.4<0.2
TN (g/kg)>2.01.5–2.01.0–1.50.5–1.0<0.5
Hg (mg/kg)<0.050.05–0.10.1–0.150.15–0.2>0.2
Water pH6–95–6, 9–103–5, 10–122–3, 12–130–2, 13–14
DO (mg/L)≥7.5≥6≥5≥3≥2
BOD5 (mg/L)≤3≤3≤4≤6≤10
CODMn (mg/L)≤15≤15≤20≤30≤40
The comprehensive nutritive index (TLI)0–3030–5050–6060–70>70
Waterfowl species and populations>43–42–31–2<1
Change rate of wetland areaFirstSecondThirdForthFifth
Land-use intensity<0.20.2–0.40.4–0.60.6–0.8>0.8
Largest patch index(LPI)80–10060–8040–6020–400–20
Shannon’s diversity index (SHDI)>0.80.6–0.80.4–0.60.2–0.4<0.2
Patch density (PD)<22–1010–2020–40>40
Tourism value4–53–42–31–20–1
Scientific research value4–53–42–31–20–1
Table 3. Classification standard of wetland ecosystem health [61].
LevelExcellentGoodFairPoorVery Poor
EHI4~53~42~31~20~1
Table 4. The fundamental scale of absolute numbers in AHP [71,72].
Intensity of ImportanceDefinitionExplanation
1Equal importanceTwo criteria/sub-criteria are equally important
2Weak
3Moderate importanceOne criterion/sub-criterion is slightly favored over another
4Moderate plus
5Strong importanceOne criterion/sub-criterion is strongly favored over another
6Strong plus
7Very strongOne criterion/sub-criterion is very strongly favored over another
8Very, very strong
9Extreme importanceEvidence favoring one criterion/sub-criterion over the other is the highest possible order of affirmation
Reciprocals of the aboveIf activity i is the judgement value when i is compared with activity j, then j has a reciprocal value when compared with iA reasonable assumption
Table 5. Statistics of wetland landscape pattern index.
Farmland (ha)Building (ha)Shelterbelt (ha)Land-Use IntensityLPIPDSHDIWetland Area (ha)
88.2912.1959.9450.09653.4082.090.986910.73
Table 6. Biodiversity indices of birds in different seasons in FNWP wetland in 2022.
SpringSummerAutumn
Shannon–Winner index1.51.821.65
Margalef index2.562.623.10
Pielou index0.460.560.48
Table 7. The AHP weight of the evaluation index of the Fujin wetland’s ecological health.
Level-1 IndicatorLevel-2 IndicatorWeightEHI Score
Soil (0.184)pH0.0733.68
Organic matter content0.045
TP0.031
TN0.022
Hg0.013
Water (0.382)pH0.019
DO0.116
BOD50.057
CODMn0.037
The comprehensive nutritive index0.153
Wetland waterfowl (0.114)Waterfowl species and population0.114
Landscape indices (0.243)Change rate of wetland area0.056
Land-use intensity0.056
Largest patch index0.088
Patch density0.031
Shannon’s diversity index0.013
Society (0.077)Tourism value0.052
Scientific research value0.026
Table 8. Calculation results of wetland landscape indices in 2017–2022.
YearNPPDLPISHDI
201744654.3837.941.16
202030302.9025.931.39
202224082.0953.410.99
Disclaimer/Publisher’s Note: The statements, opinions and data contained in all publications are solely those of the individual author(s) and contributor(s) and not of MDPI and/or the editor(s). MDPI and/or the editor(s) disclaim responsibility for any injury to people or property resulting from any ideas, methods, instructions or products referred to in the content.

