Article

Characteristics of Groundwater Microbial Community Composition and Environmental Response in the Yimuquan Aquifer, North China Plain

1
Center for Hydrogeology and Environmental Geology Survey, CGS, Baoding 071051, China
2
State Key Laboratory of Biogeology and Environmental Geology, Wuhan 430078, China
3
Key Laboratory of Eco-Restoration of Regional Contaminated Environment, Shenyang University, Shenyang 110044, China
4
Department of Civil and Environmental Engineering, University of Alberta, Edmonton T6G 1H9, Canada
*
Authors to whom correspondence should be addressed.
Water 2024, 16(3), 459; https://doi.org/10.3390/w16030459
Submission received: 11 December 2023 / Revised: 12 January 2024 / Accepted: 22 January 2024 / Published: 31 January 2024
(This article belongs to the Section Biodiversity and Functionality of Aquatic Ecosystems)

Abstract

:
To explore the intricate interrelationship between groundwater microbial communities and hydrochemical characteristics in the Mancheng District, Baoding City, samples from karst groundwater and porous groundwater were collected. Hydrochemical analysis and the 16s RNA gene V4-V5 region sequencing method were used to detail the water environmental characteristics and microbial community distribution pattern in the study area. The hydrochemical results reveal notable differences in major ion contents and other hydrochemical indices between karst water and porous water. Microbial community analysis demonstrates that Proteobacteria, Actinobacteria, and Firmicutes are the dominant taxa in both types of water bodies, albeit with significant variations in their proportions across distinct water bodies. The observed disparities in microbial communities between karst water and porous water underscore the influence of environmental factors such as ion concentration and pH on microbial distribution. Redundancy Analysis (RDA) indicates notable associations between microbial community composition and environmental factors in both types of groundwater environments. Studying the distribution pattern of microbial communities and the connection with environmental factors in two types of groundwater lays a crucial foundation for interpreting the functional roles of microbes in groundwater ecosystems.

1. Introduction

Natural spring areas, as the unique zones where groundwater and surface water converge, boast abundant water resources and distinct ecological environments [1,2]. Research on environmental microbial communities and their functions holds significant implications worldwide [3]. In recent years, it has been discovered that microbes in groundwater environments play vital roles in maintaining aquatic ecological stability, protecting water resources, and safeguarding ecosystem health [4,5,6]. Studies have shown that groundwater microbes can degrade organic matter, remove heavy metals, and eliminate pollutants such as nitrogen and phosphorus, offering biotechnological methods for protecting and purifying water resources [7]. Additionally, groundwater microbes play key roles in the Earth’s biogeochemical cycles, such as those of carbon, nitrogen, and sulfur [8,9]. In-depth exploration into groundwater microbial communities and their functions is of great theoretical significance for understanding global ecosystem functions and elucidating Earth’s ecological evolution. The investigation of groundwater microbes provides new perspectives and methods for ecological protection and the sustainable use of water resources.
The Yimuquan Spring area in Baoding City is located at the southern margin of the North China Plain, in the pre-mountain area. It occupies the upstream area of the groundwater dynamics system in central Hebei, boasting abundant groundwater resources and complex hydrogeological conditions. According to the data from the China Water Resources Yearbook (2021), the groundwater resources of Baoding City account for 79.4% of the city’s total water resources, playing a crucial role in agricultural production, ecological environment protection, and residential water supply [10]. However, as the population grows and economic development advances, the water resources of the Yimuquan Spring area in Baoding city are facing increasingly severe pressure, and the scientific management and protection of groundwater resources have become increasingly important. Although groundwater microorganisms play an important role in biogeochemical processes, the relationship between the microbial community structure in the groundwater layer of this area and environmental characteristics has not yet been thoroughly studied [11,12]. Therefore, this study aims to systematically survey the microbial communities in the groundwater layer of the Yimuquan Spring area in Baoding City. Specifically, our objectives are as follows: (i) comprehensively investigate the distribution and diversity of microbial communities in groundwater; (ii) analyze the relationships between these communities and environmental factors such as ion concentration and pH values, to uncover their structure and environmental response characteristics; and (iii) explore the ecological roles of groundwater microorganisms, providing a scientific basis for the protection and rational utilization of groundwater resources. Through this research, we hope to offer robust scientific support for the sustainable development of this region, the improvement of the ecological environment, and the advancement of the livelihood and the local citizens’ well-being.

2. Materials and Methods

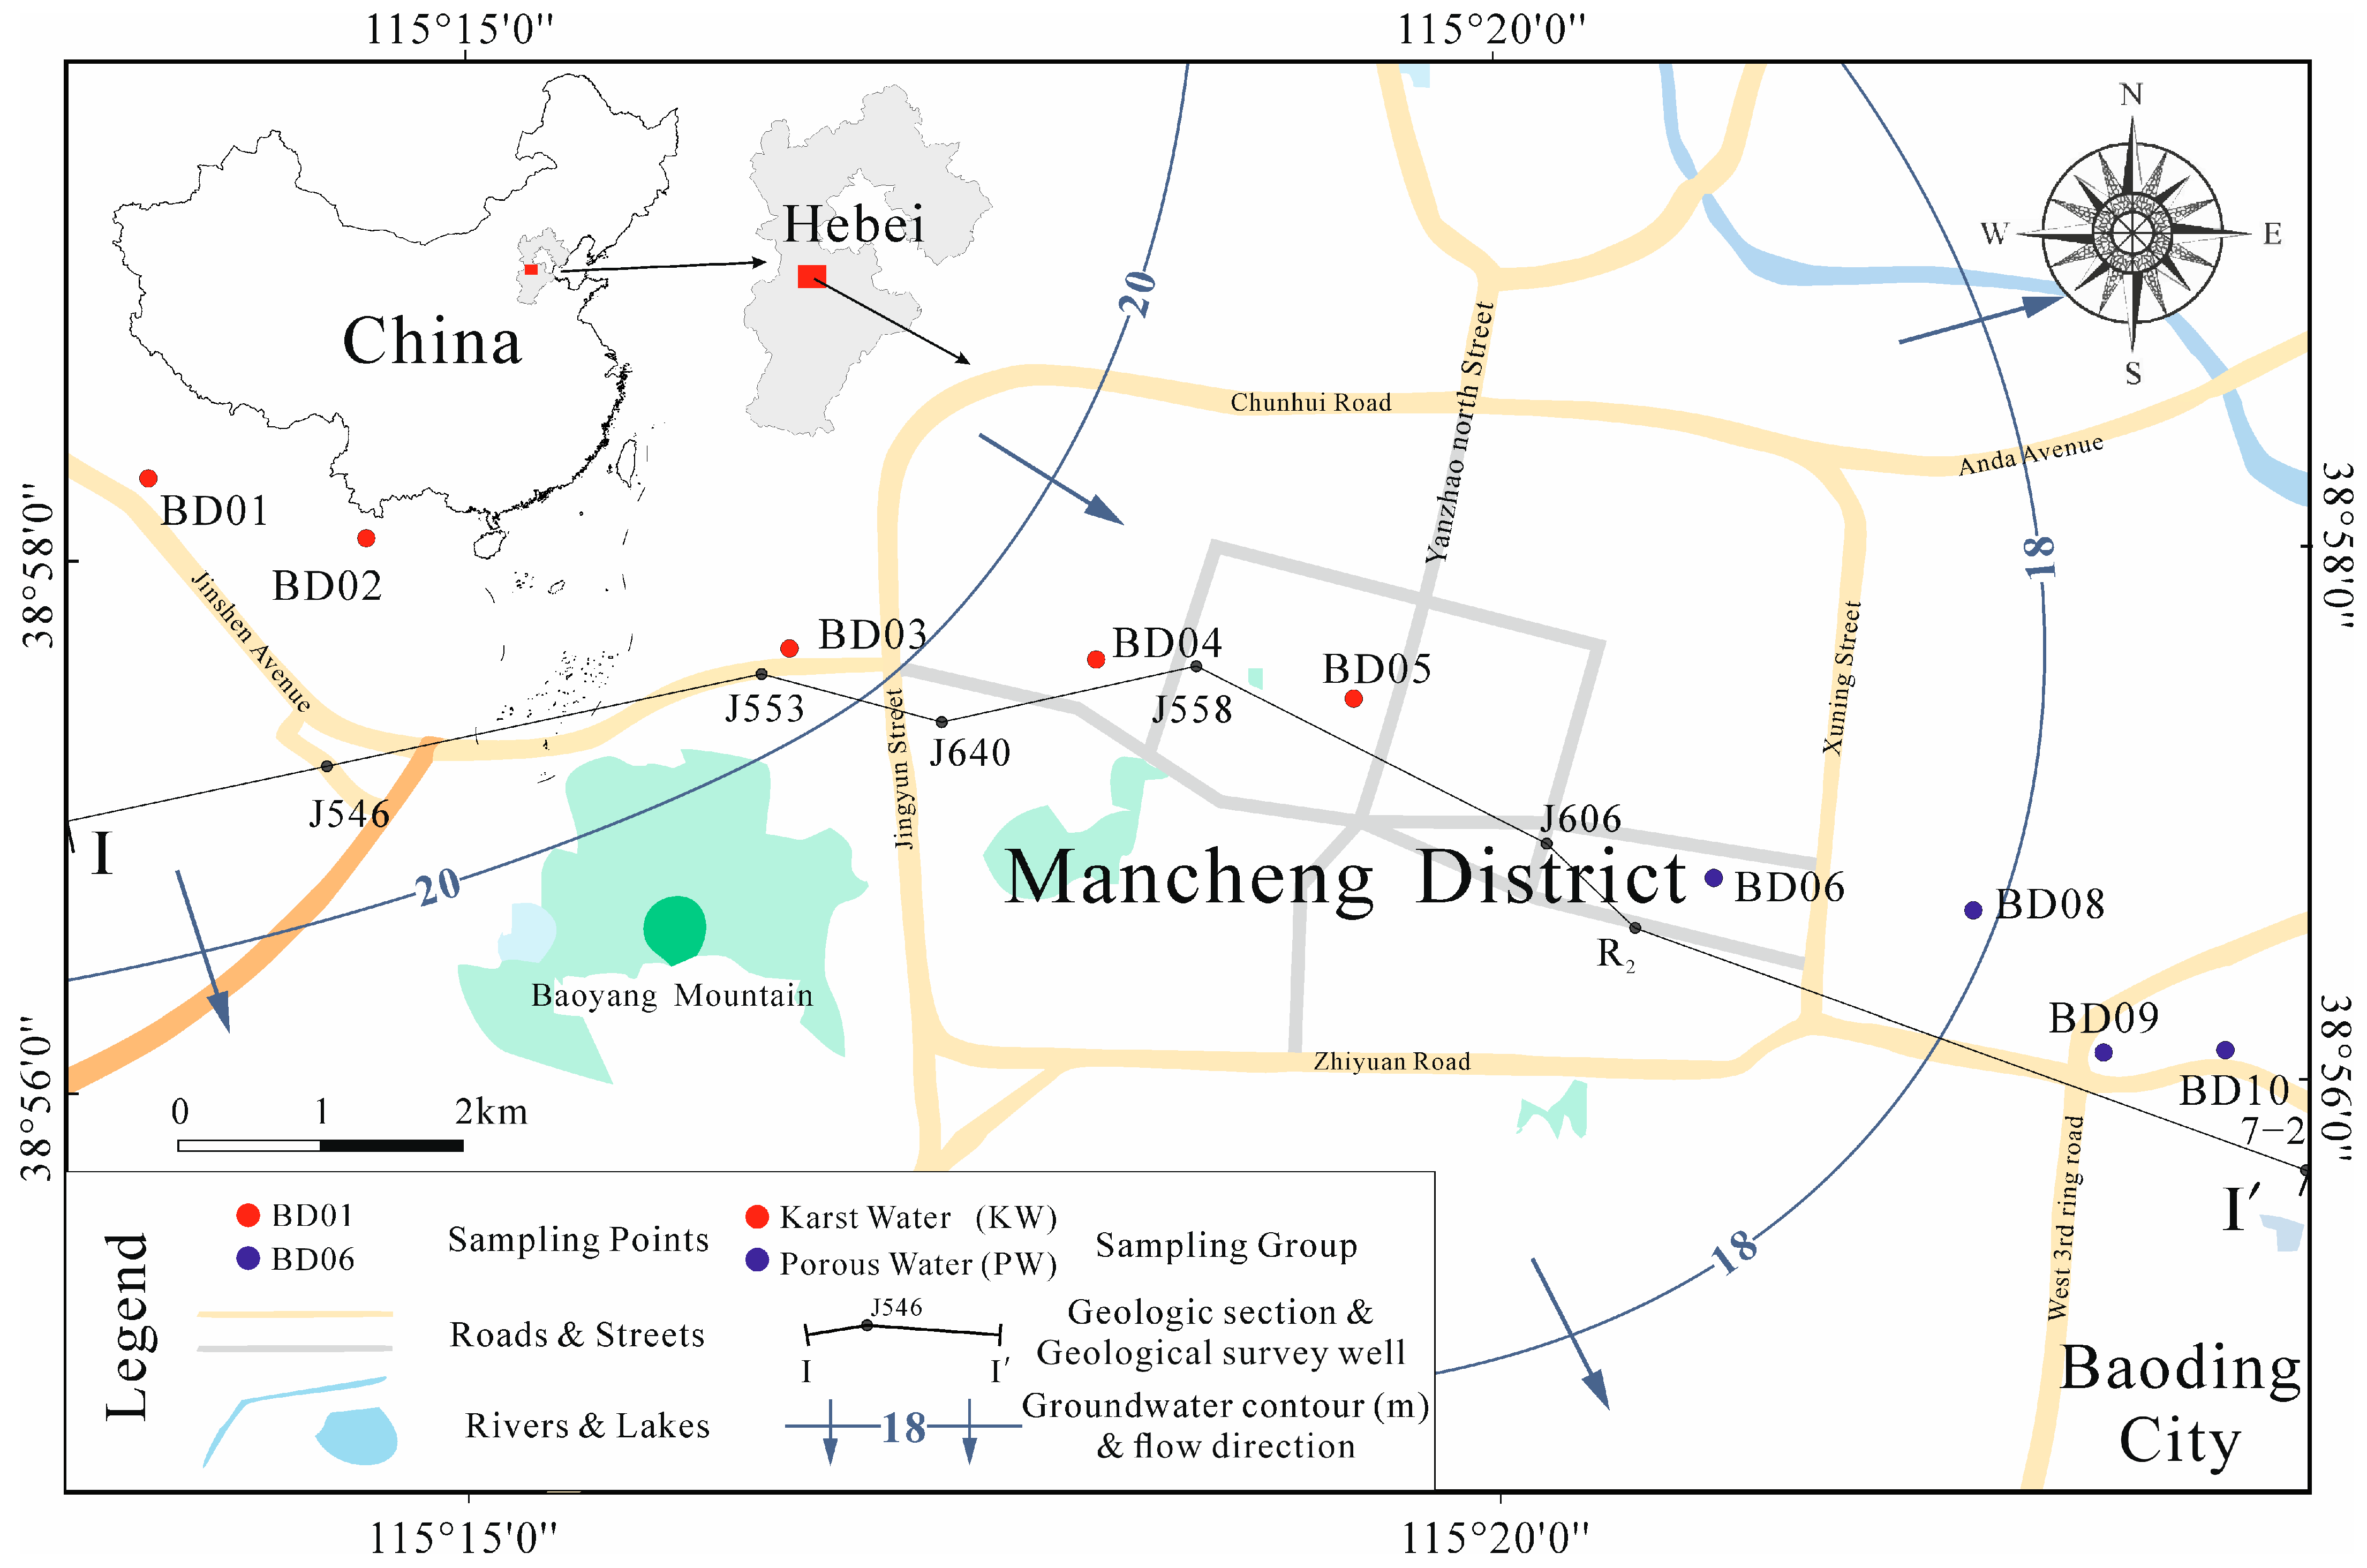
2.1. Study Area Overview

The study area is primarily located in Mancheng District, Baoding City, Hebei Province, encompassing parts of the upstream and downstream spring areas. It spans a range between 38°56′0″–38°58′30″ N and 115°12′30″–115°24′30″ E (Figure 1). The climate is a warm temperate semi-humid continental climate, with an average annual temperature of 13 °C and an average annual precipitation of 550 mm [13]. The terrain is predominantly plain, representing various geological origins such as ancient river floodplains, alluvial fans, and aeolian terraces (Figure 2). The topography is high in the north and low in the south, with altitudes ranging between 50 and 100 m [14]. The western part of the area is characterized by bedrock predominantly consisting of dolomitic stone, where geological layers alternating between mud and gravel and pebble and gravel. These layers are surmounted by a loess-shaped loam surface layer. With increasing stratal thickness, intermittent clay lenses and loess-shaped sub-sandy soil lenses become discernible. The hydrogeological conditions are complex. The main aquifers include the Quaternary alluvial layer and the Tertiary sedimentary layer. The former is the main aquifer, with a thickness of 20–100 m. The latter has a thickness of about 50–150 m and slightly less water content [15].
The study area has abundant overall resources, with annual available groundwater resources of around 936 million cubic meters. Among this available groundwater, 70% is used for agricultural irrigation, followed by industrial production and domestic water use [10]. The groundwater quality is safe with low nitrite, nitrate, and heavy metal contents. The concentrations of the former two are far below the values stipulated in the “Groundwater Quality Standards (GB/T 14848-2017)” [16,17]. In addition, the total hardness of groundwater in the study area is relatively high (average 450 mg/L) and exhibits alkaline characteristics (pH values are between 7.5 and 8.5). The main cations are calcium, magnesium, and sodium, while the main anions are carbonate, bicarbonate, and sulfate. The water chemical type is primarily HCO3·SO4-Ca·Mg [18].

2.2. Sample Collection and Testing

In January 2022, considering the groundwater flow direction and actual water usage in the study area, we collected nine groundwater samples from the Yimuquan area in Mancheng District, Baoding City. The sampling depth ranged from 90 to 200 m. Prior to sampling, we pumped the well for 0.5–2 h until the water quality was clear and stable. Samples were then taken from the water outlet directly above the submersible pump at the ground surface, without pipe aeration or disinfection. Samples were collected in three parts: Firstly, on-site measurement of water temperature, pH, electrical conductivity (Ec), and oxidation–reduction potential (ORP) was performed using a Hach HQ40D portable multi-parameter water quality analyzer. Secondly, the samples were preserved according to the “Standard Test Methods for Drinking Water” (GB/T 5750-2006) [19], and then the total dissolved solids (TDS) were measured using the dry weighing method. An ICS-600 Ion Chromatograph was used to determine Cl, SO42−, NO3, NO2, and F. Inductively Coupled Plasma Optical Emission Spectrometry (ICP-OES) was used to determine Na+, Al3+, Fe3+, Mn2+, and TDS. After the tests were completed, the relative measurement error was calculated to be 1.7% based on the standards announced in the “Standard Test Methods for Drinking Water—Quality Control in Water Quality Analysis (GB/T 5750-2006)” and DD2014-2015 “Technical Requirements for Quality Control of Sample Analysis in Groundwater Pollution Investigation and Evaluation” [20]. Thirdly, 1 L of each water sample was collected and filtered using a 0.22 μm water system filter membrane using a suction pump, then stored in a dry ice box. These samples were finally transported to Shanghai Personal Biotechnology Co., Ltd., (Shanghai, China) for testing.
DNA extraction was performed using the OMEGA Soil DNA Kit (D5625-01) from Omega Bio-Tek, and the extracted DNA was tested. The DNA concentration was measured using a NanoDrop ND-1000 spectrophotometer (Thermo Fisher Scientific, Waltham, MA, USA) at 260 nm and 280 nm, and the quality of the DNA was assessed using 1% agarose gel electrophoresis. The concentration of the DNA solution was adjusted, with the working DNA solution stored at 4 °C and the storage solution stored at −20 °C. The V4-V5 region of the bacterial 16S rRNA gene was amplified with PCR using the forward primer 515F (5′-GTGCCAGCMGCCGCGGTAA-3′) and the reverse primer 907R (5′-CCGTCAATTCMTTTRAGTTT-3′). A 7 bp barcode specific to the samples was incorporated into the primers for multiplex sequencing. The PCR amplification products were purified using Vazyme VAHTSTM DNA Clean Beads (Vazyme, Nanjing, China) and quantified using the Quant-iT PicoGreen dsDNA Assay Kit (Invitrogen, Carlsbad, CA, USA). After the individual quantification step, the amplified products were pooled in equimolar amounts and sequenced on the Illumina MiSeq platform using the MiSeq Reagent Kit v3 for 2 × 250 bp paired-end sequencing.

2.3. Sequence and Data Analysis

Sequence data analyses were mainly performed using QIIME2 and R packages (v3.2.0). ASV-level alpha diversity indices, such as Chao1 richness estimator, Observed species, Shannon diversity index, Simpson index, Faith’s PD, Pielou’s evenness, and Good’s coverage were calculated using the ASV table in QIIME2 and visualized as box plots. ASV-level ranked abundance curves were generated to compare the richness and evenness of ASVs among samples. Beta diversity analysis was performed to investigate the structural variation of microbial communities across samples using Jaccard metrics, Bray–Curtis metrics and UniFrac distance metrics and visualized via principal coordinate analysis (PCoA). The statistical significance of alpha diversity variations among sample groups was assessed using Kruskal–Wallis rank-sum test and Dunn’s test for post-hoc analysis. For pairwise comparisons, the Kruskal–Wallis test was utilized, equating to the Wilcoxon test. Box plot components included interquartile range (IQR), median, max/min values, and outliers. Kruskal–Wallis p-values and Dunn’s test results were annotated for clarity [21]. In this study, we also employed the Random Forest algorithm, a decision-tree-based machine learning method known for its efficiency and effectiveness in analyzing non-linear data sets, such as our microbial community data [22]. Random Forest is a machine learning algorithm that employs a multitude of individual decision trees for prediction or analysis. This algorithm constructs an ensemble of decision trees, each trained on a random subset of the data and a random subset of features. It then amalgamates predictions or analytical outcomes from each tree to make a final prediction or analysis. In the computation process, the importance of individual variables is assessed by randomly permuting the values of each variable within the Random Forest model and comparing the error rates before and after permutation. The calculation of the importance of individual variables provides an in-depth method to understand the contribution of each variable to the model’s predictive performance, which is crucial for simplifying the model, enhancing interpretability, and guiding data-driven decision making. The analysis was conducted using the QIIME2 (2019.4) software, specifically utilizing the ‘classify_samples_ncv’ function within the q2-sample-classifier for the Random Forest analysis and nested stratified cross-validation.
Water chemistry data and their correlation with species were compiled and analyzed using Excel 2007, SPSS 25.0, and Canoco5 for data collection, collation, and statistical analysis. Levins’ niche breadth was utilized to quantify the ecological niche width of microbial species within the groundwater communities. Niche breadth indicates the range of resources used by a species within an environment, reflecting its ecological versatility. The calculation of Levins’ niche breadth (B) was based on the following formula:
B i = 1 / j = 1 n ( p i j ) 2
where pij is the proportion of the i-th species using the j-th resource. Higher values of Bi suggest that a species has a broader niche, utilizing a wider array of resources, whereas lower values indicate specialization.

3. Results and Analysis

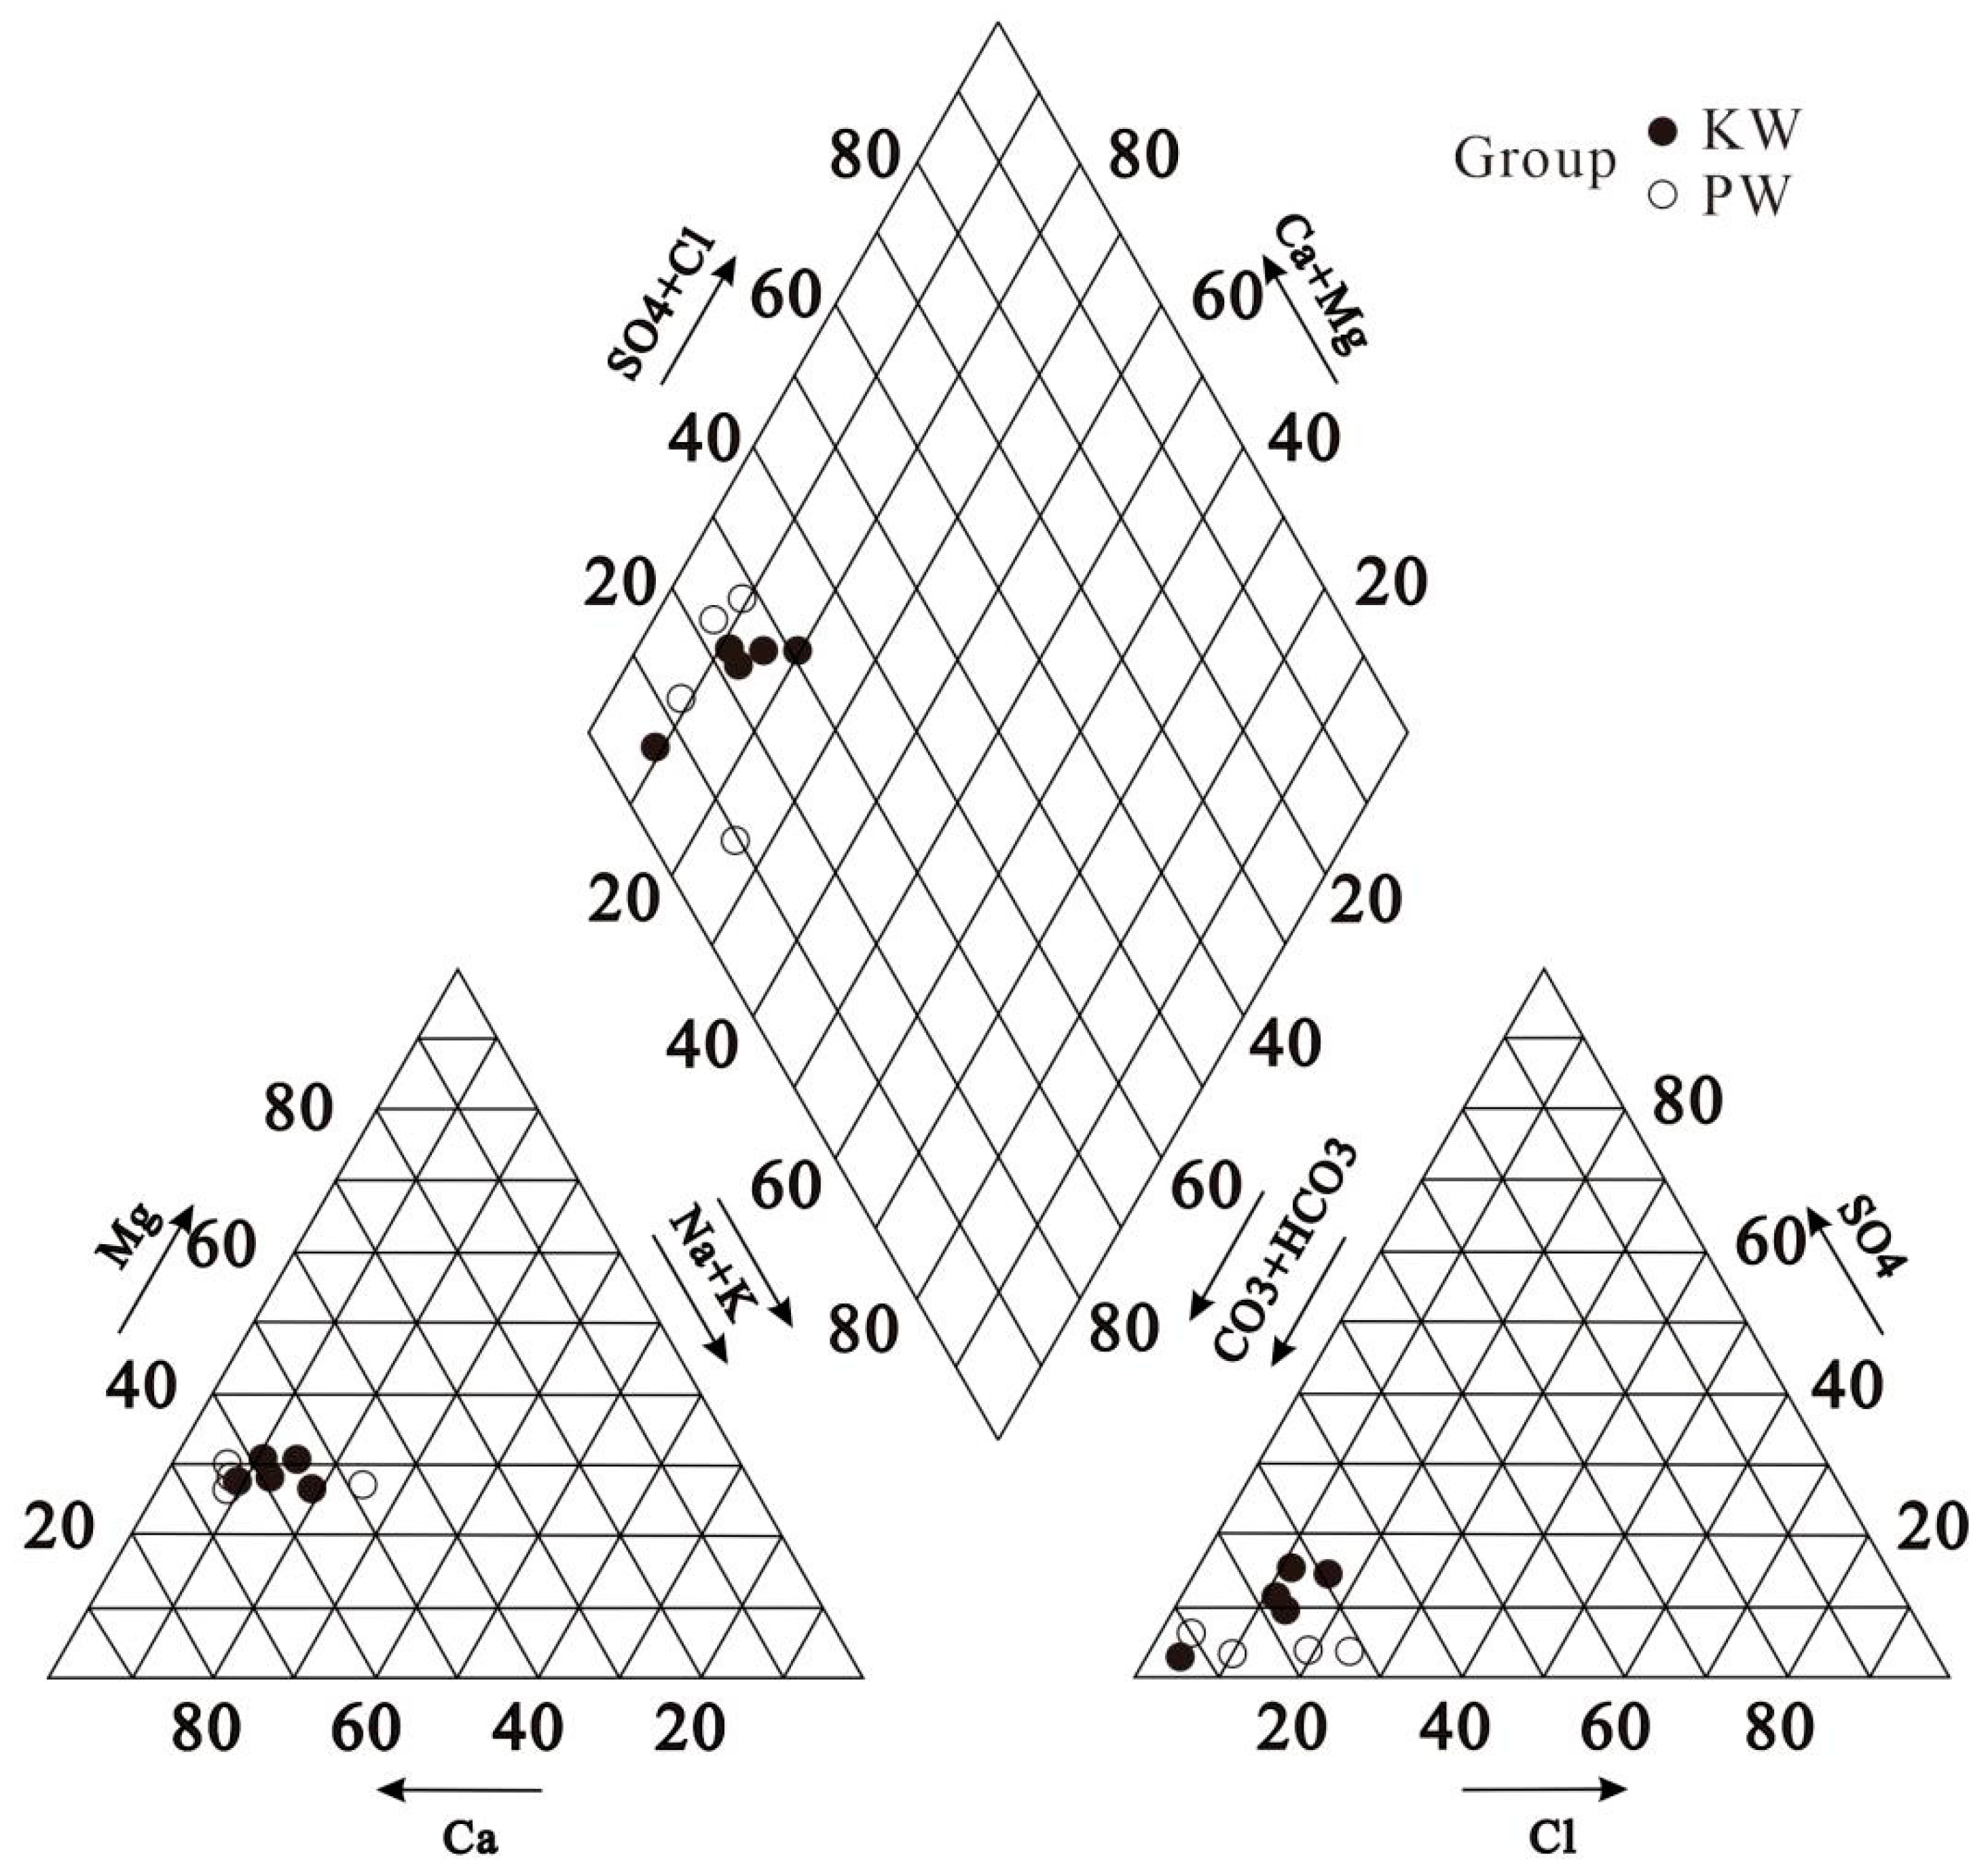
3.1. Hydrochemical Characteristics

According to the analysis, the collective groundwater in the study area is weakly alkaline, and there is not much difference in the basic characteristics of the porous water in the upper reaches and the karst water in the middle, with the pH ranging from 7.44 to 7.88 and an average value of 7.71 (Table 1). The TDS value is low, with the highest value being only 572.47 mg·L−1 and an average value of 408.99 mg·L−1. In terms of composition, there are little differences in the cation content of the two, with high levels of Ca2+ and Mg2+, reflecting the lithological conditions of the strata in the area. The content of K+, Na+, and Mg2+ in porous water is slightly lower than that in karst water. In terms of anionic composition, the SO42− and NO3 levels in karst water are more than twice as high as in porous water, while Cl- and HCO3- are relatively low. The hydrochemical type of all five karst water samples is represented as HCO3-Ca·Mg; while in porous water samples, two types, HCO3-Ca·Mg (BD6 & BD10) and HCO3·Cl-Ca·Mg (BD8 & BD9), are present (Figure 3).
In addition, the redox environments of the two are different, with karst water having a higher amount of dissolved oxygen and slightly weaker oxidizing properties, and with porous water having a lower amount of dissolved oxygen and stronger oxidizing properties relative to karst water. This is consistent with the findings of C Q Qin et al., 2020 [23].

3.2. Microbial Community Structure

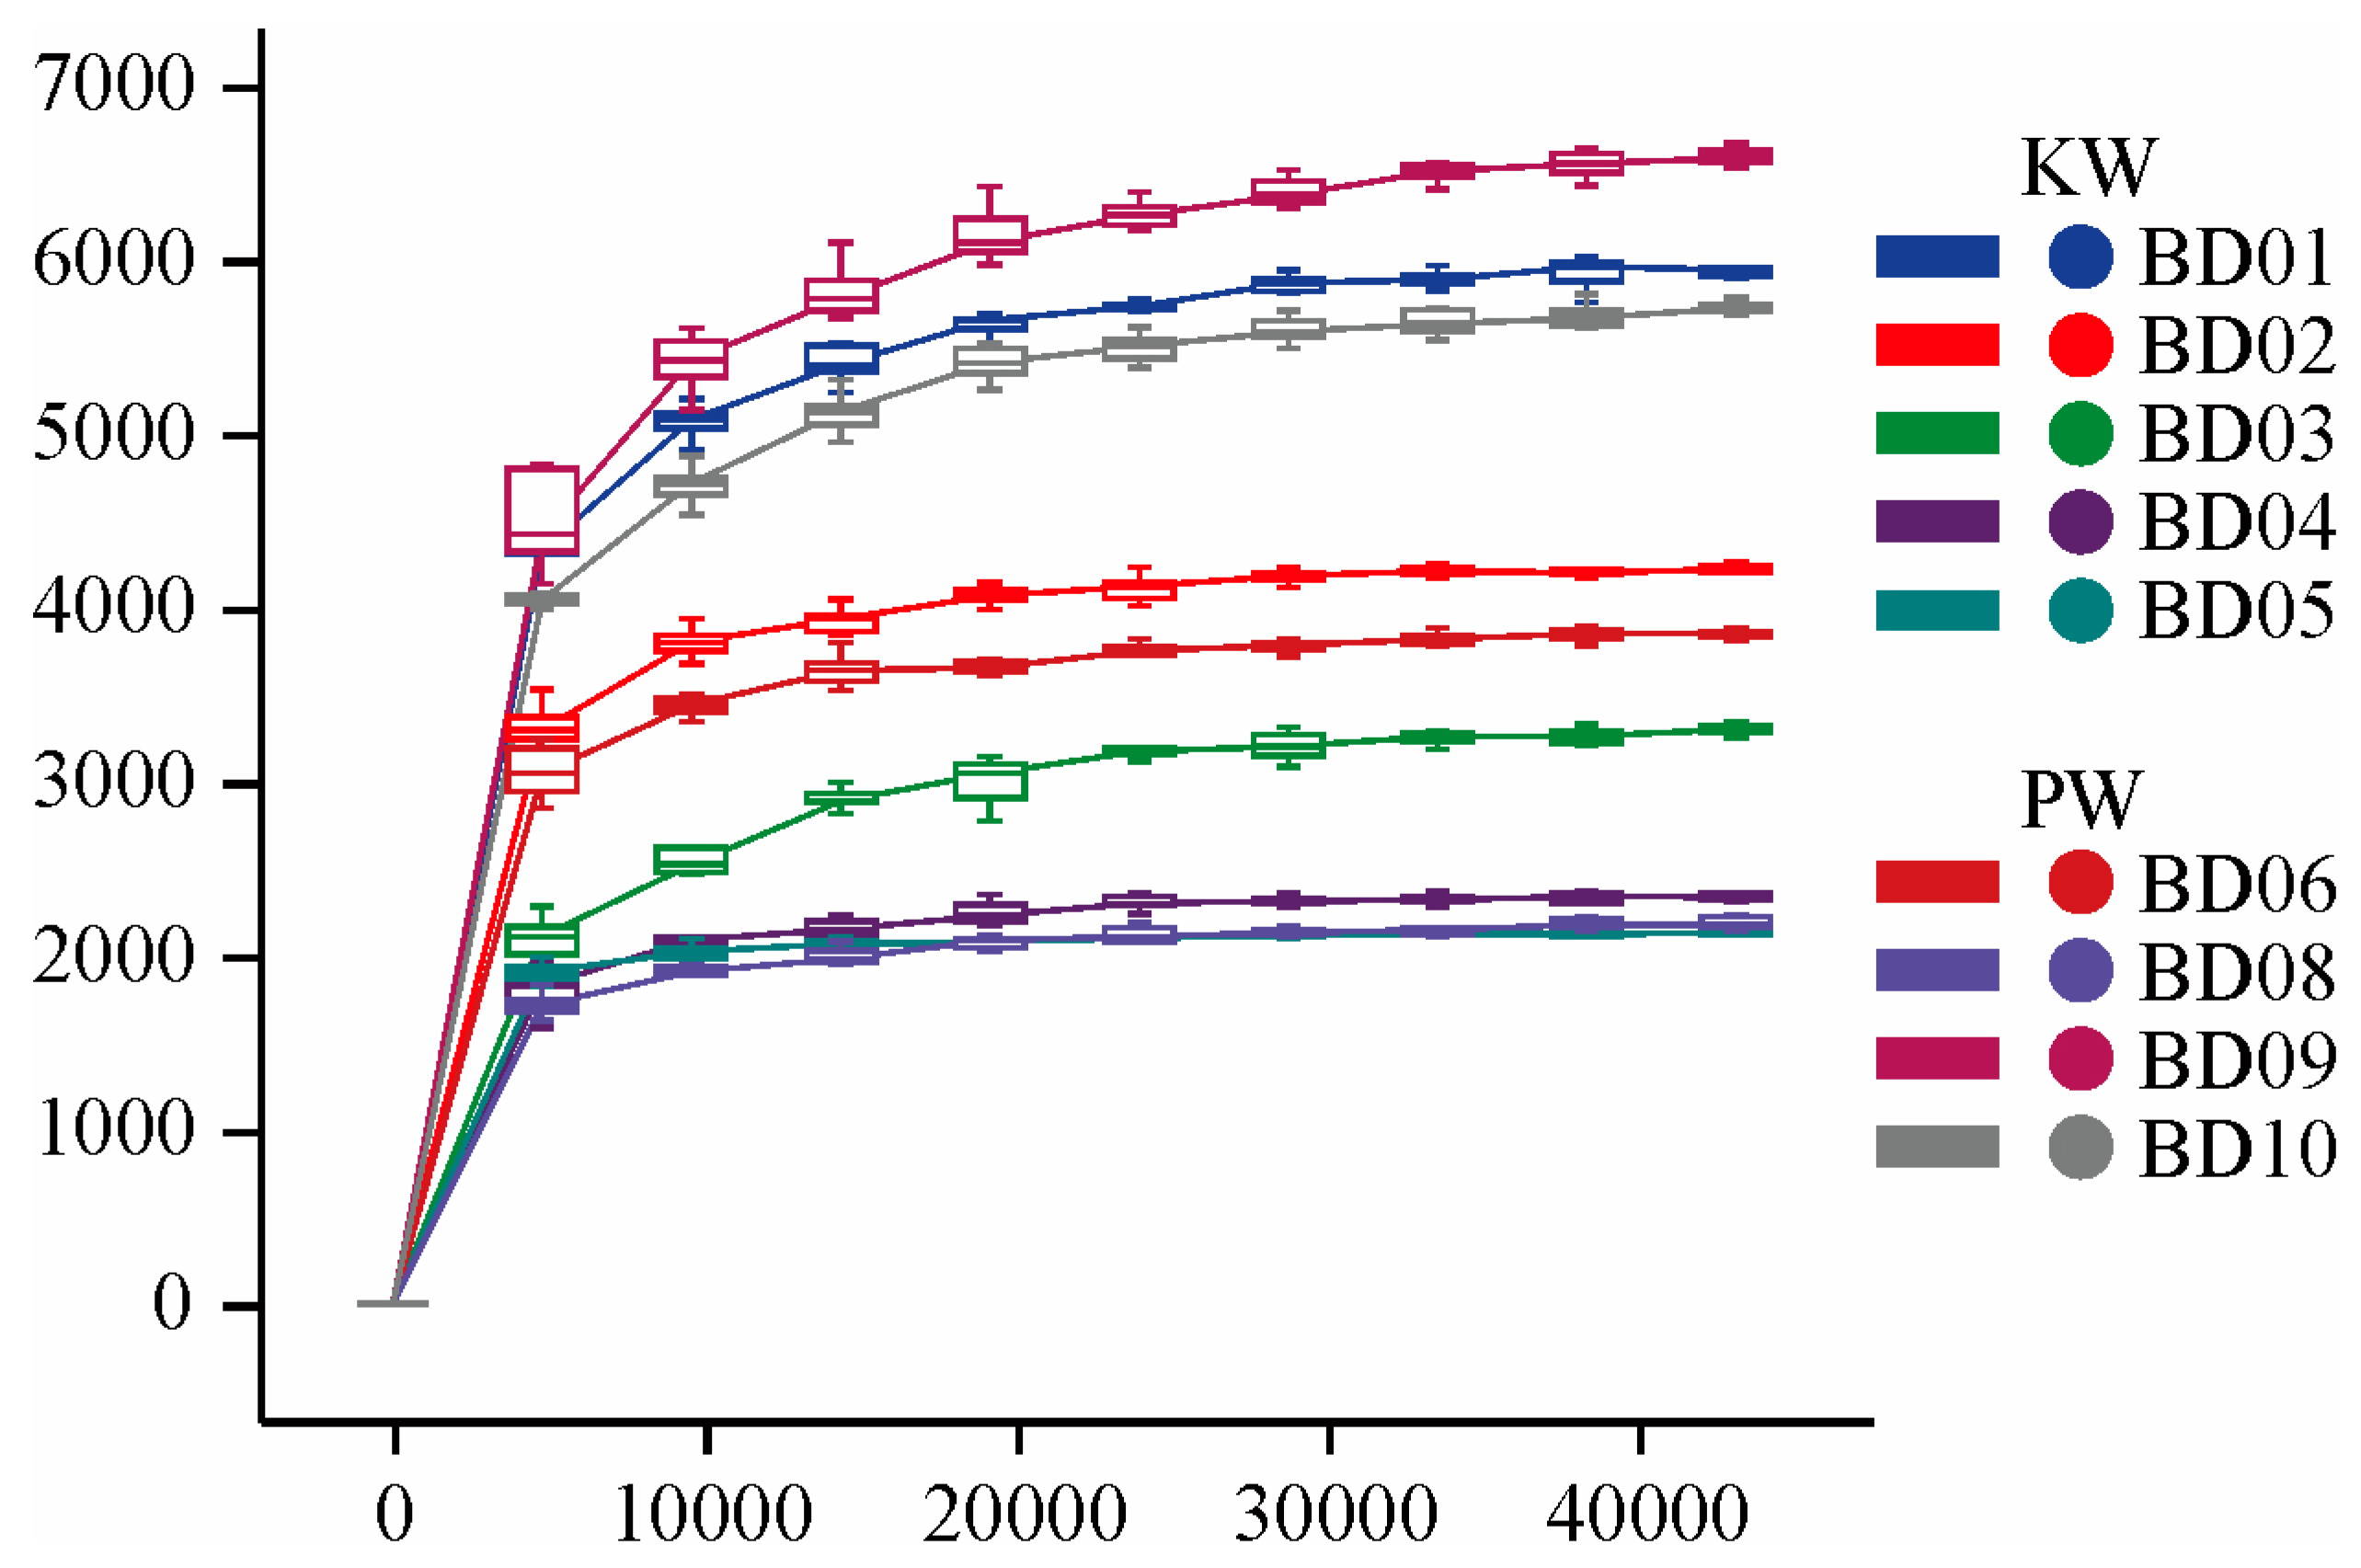
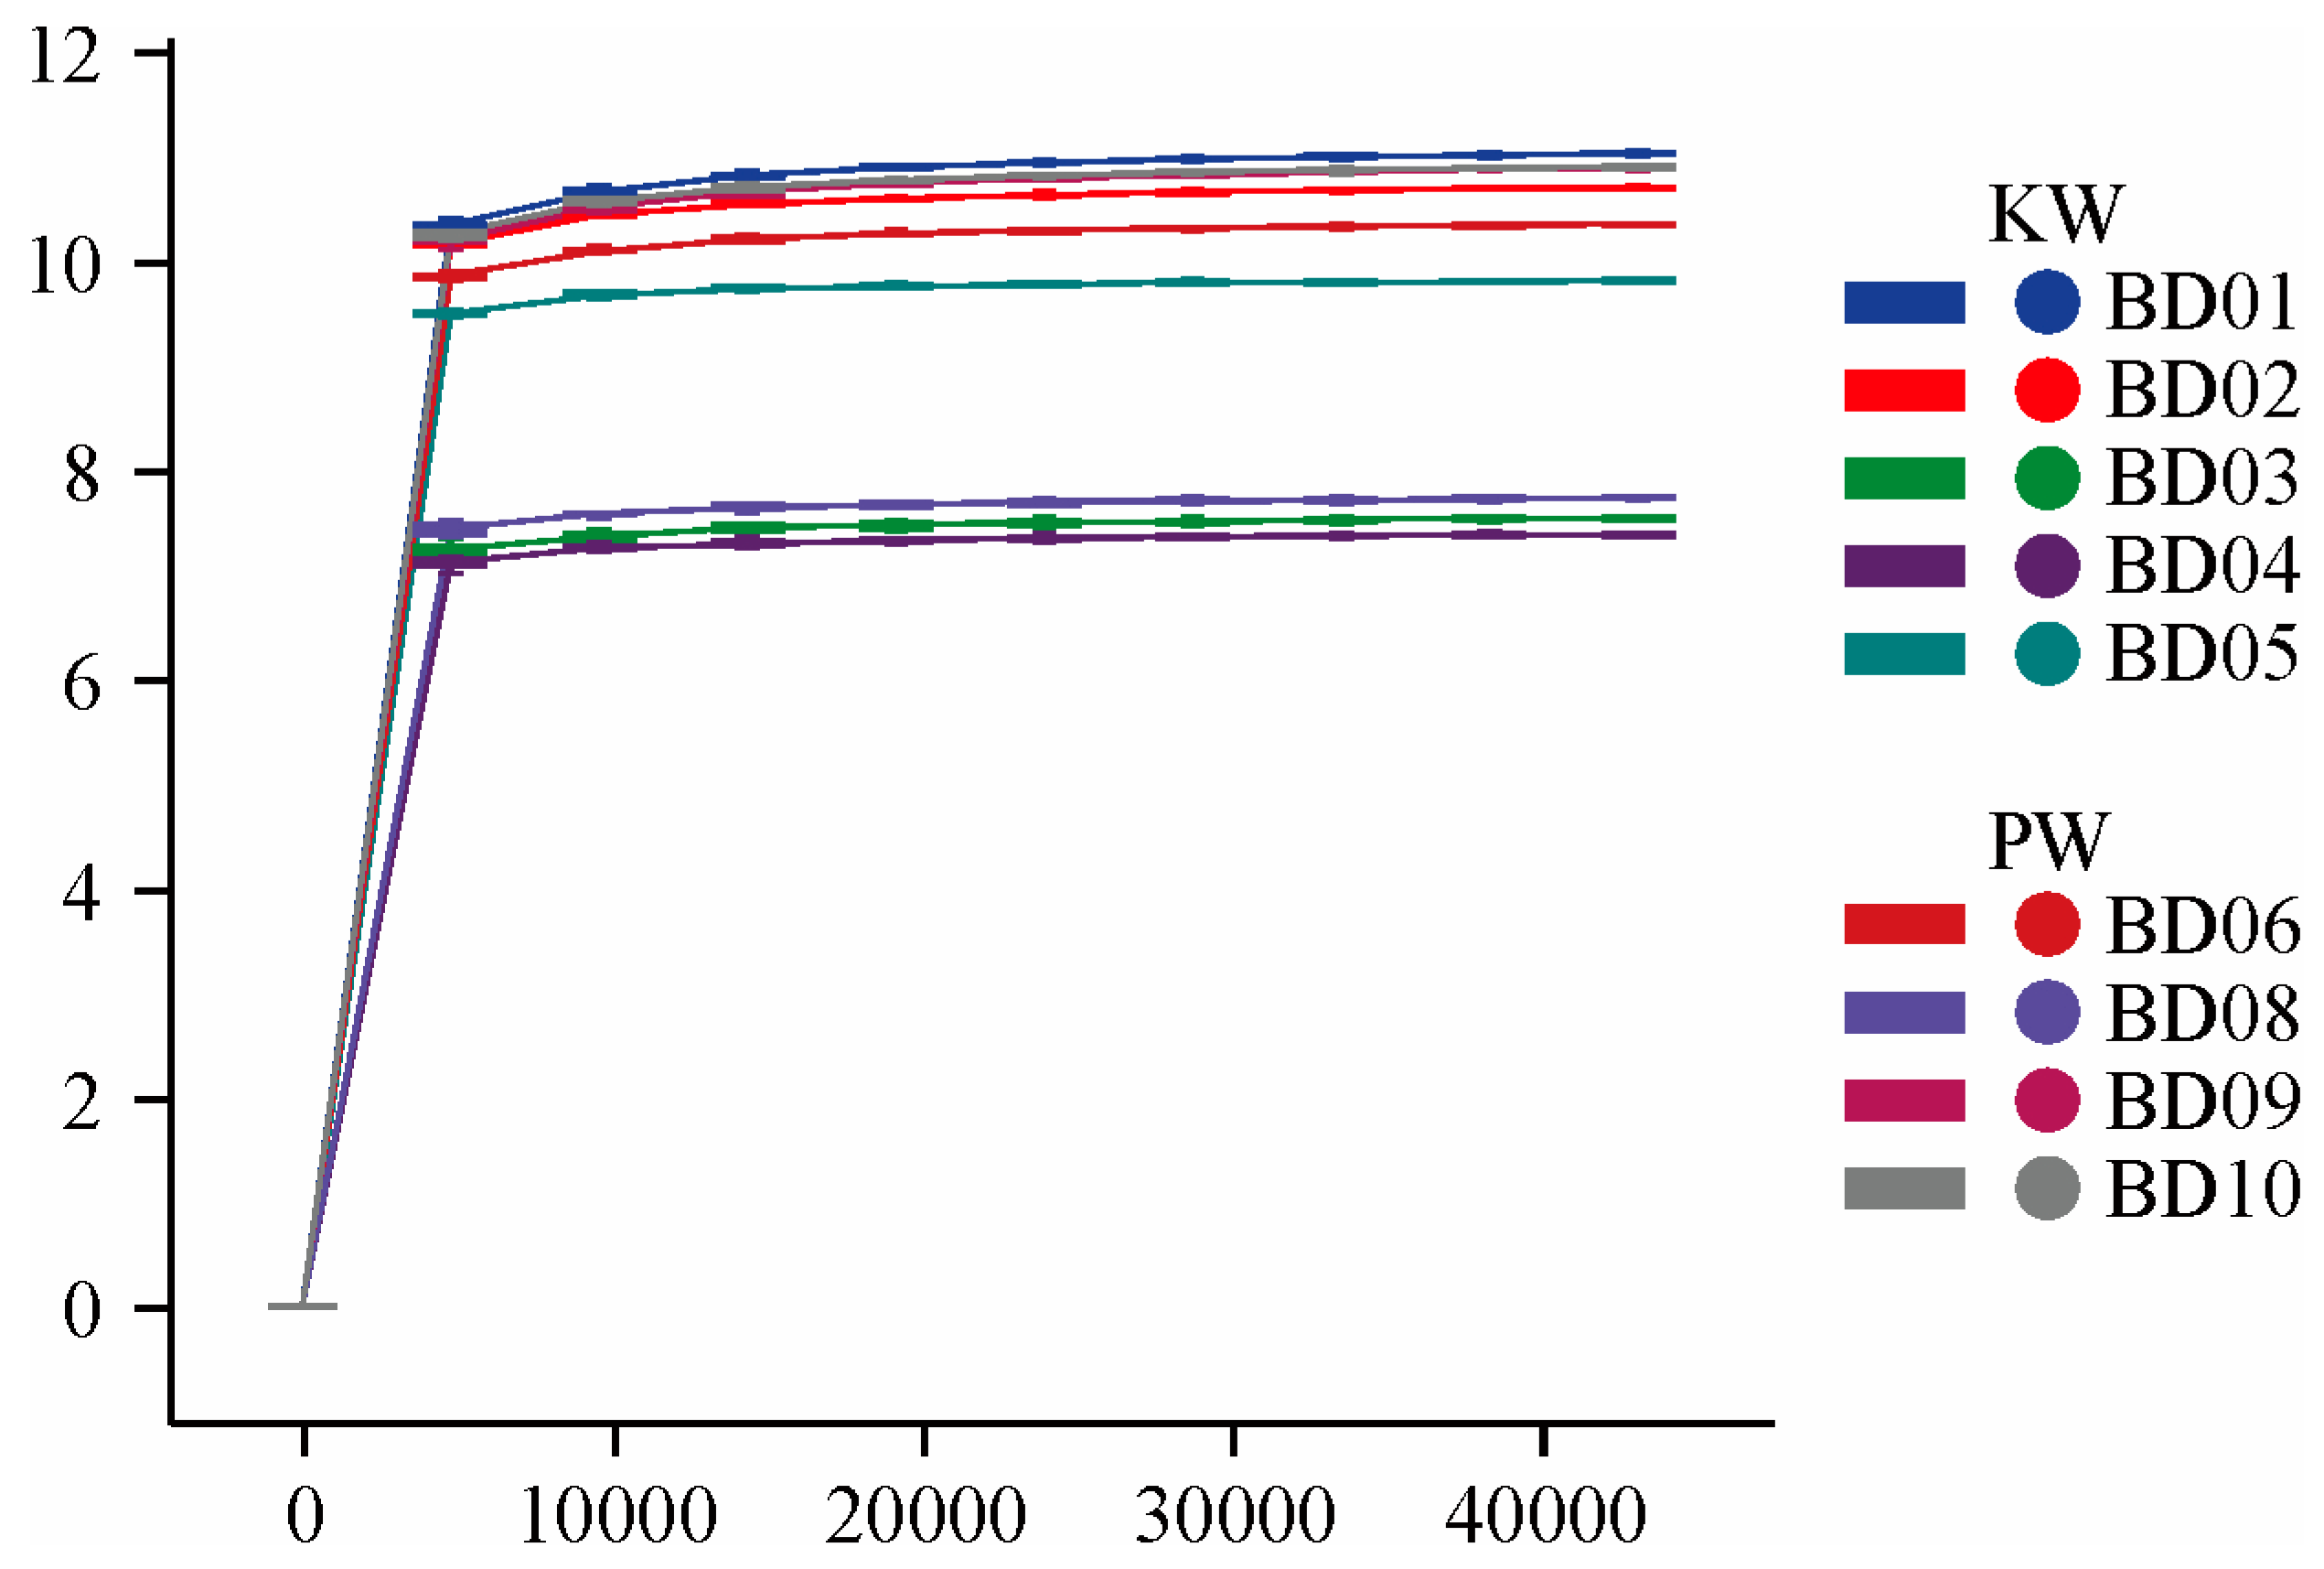
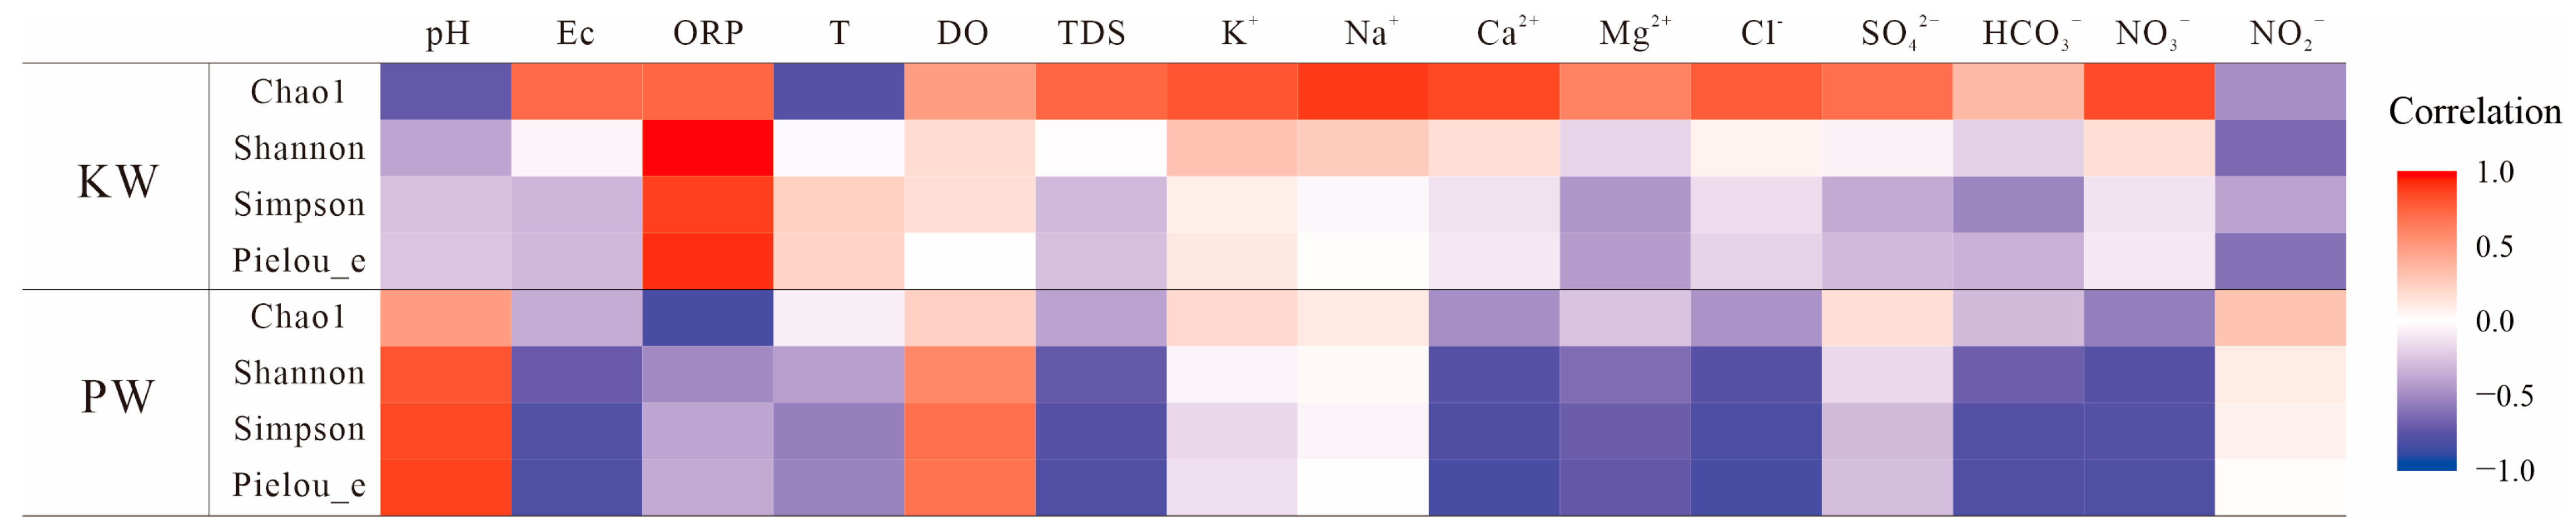
3.2.1. Diversity Analysis

In this study, 142,847–206,200 pairs of sequences were obtained, and 117,067–168,692 groups of high-quality sequences were analyzed and tested. From the rarefaction curves (Figure 4 and Figure 5), it can be seen that, with the increase in drawdown depth, the rarefaction curves of Chao1 and Shannon indices gradually become noticeably flat. This suggests that the samples are sufficiently representative in terms of microbial quantity and community richness, and the sequencing depth has met the requirements to reflect the diversity and quantity of samples.
From the Alpha index box plot, it can be seen that the Goods_coverage index in the sequenced samples ranges from 0.969 to 0.998, reflecting a high and reliable sequencing depth (Figure 6). Upon scrutinizing the alpha diversity metrics in Figure 6, the data illustrate a nuanced ecological narrative between the KW group and the PW group. The Goods_coverage index, with values between 0.969 and 0.998, affirms a comprehensive sequencing depth. The Chao1 index reveals a higher mean species richness in the PW group (4586.25) as opposed to the KW group (3583.7), indicating a potentially more variable microbial community. The Shannon index, with close means across both groups, and the Simpson index reinforce the view of a similar overall diversity profile. The analysis of the Faith PD index, a widely recognized measure in microbial diversity studies, reveals that the samples from the Porous Water (PW) group exhibit a notably higher evolutionary-based diversity and species evenness in their microbiota [24]. This suggests a more complex and phylogenetically varied microbial community within the PW group, potentially indicative of a broader range of functional capabilities and ecological adaptability. While the alpha diversity analysis did not reveal statistically significant differences, the preliminary observations suggest distinctions in the microbial communities of the KW group and the PW group. These findings, though initial, lay the groundwork for further exploration of the ecological and functional dynamics underlying these two microbial ecosystems.

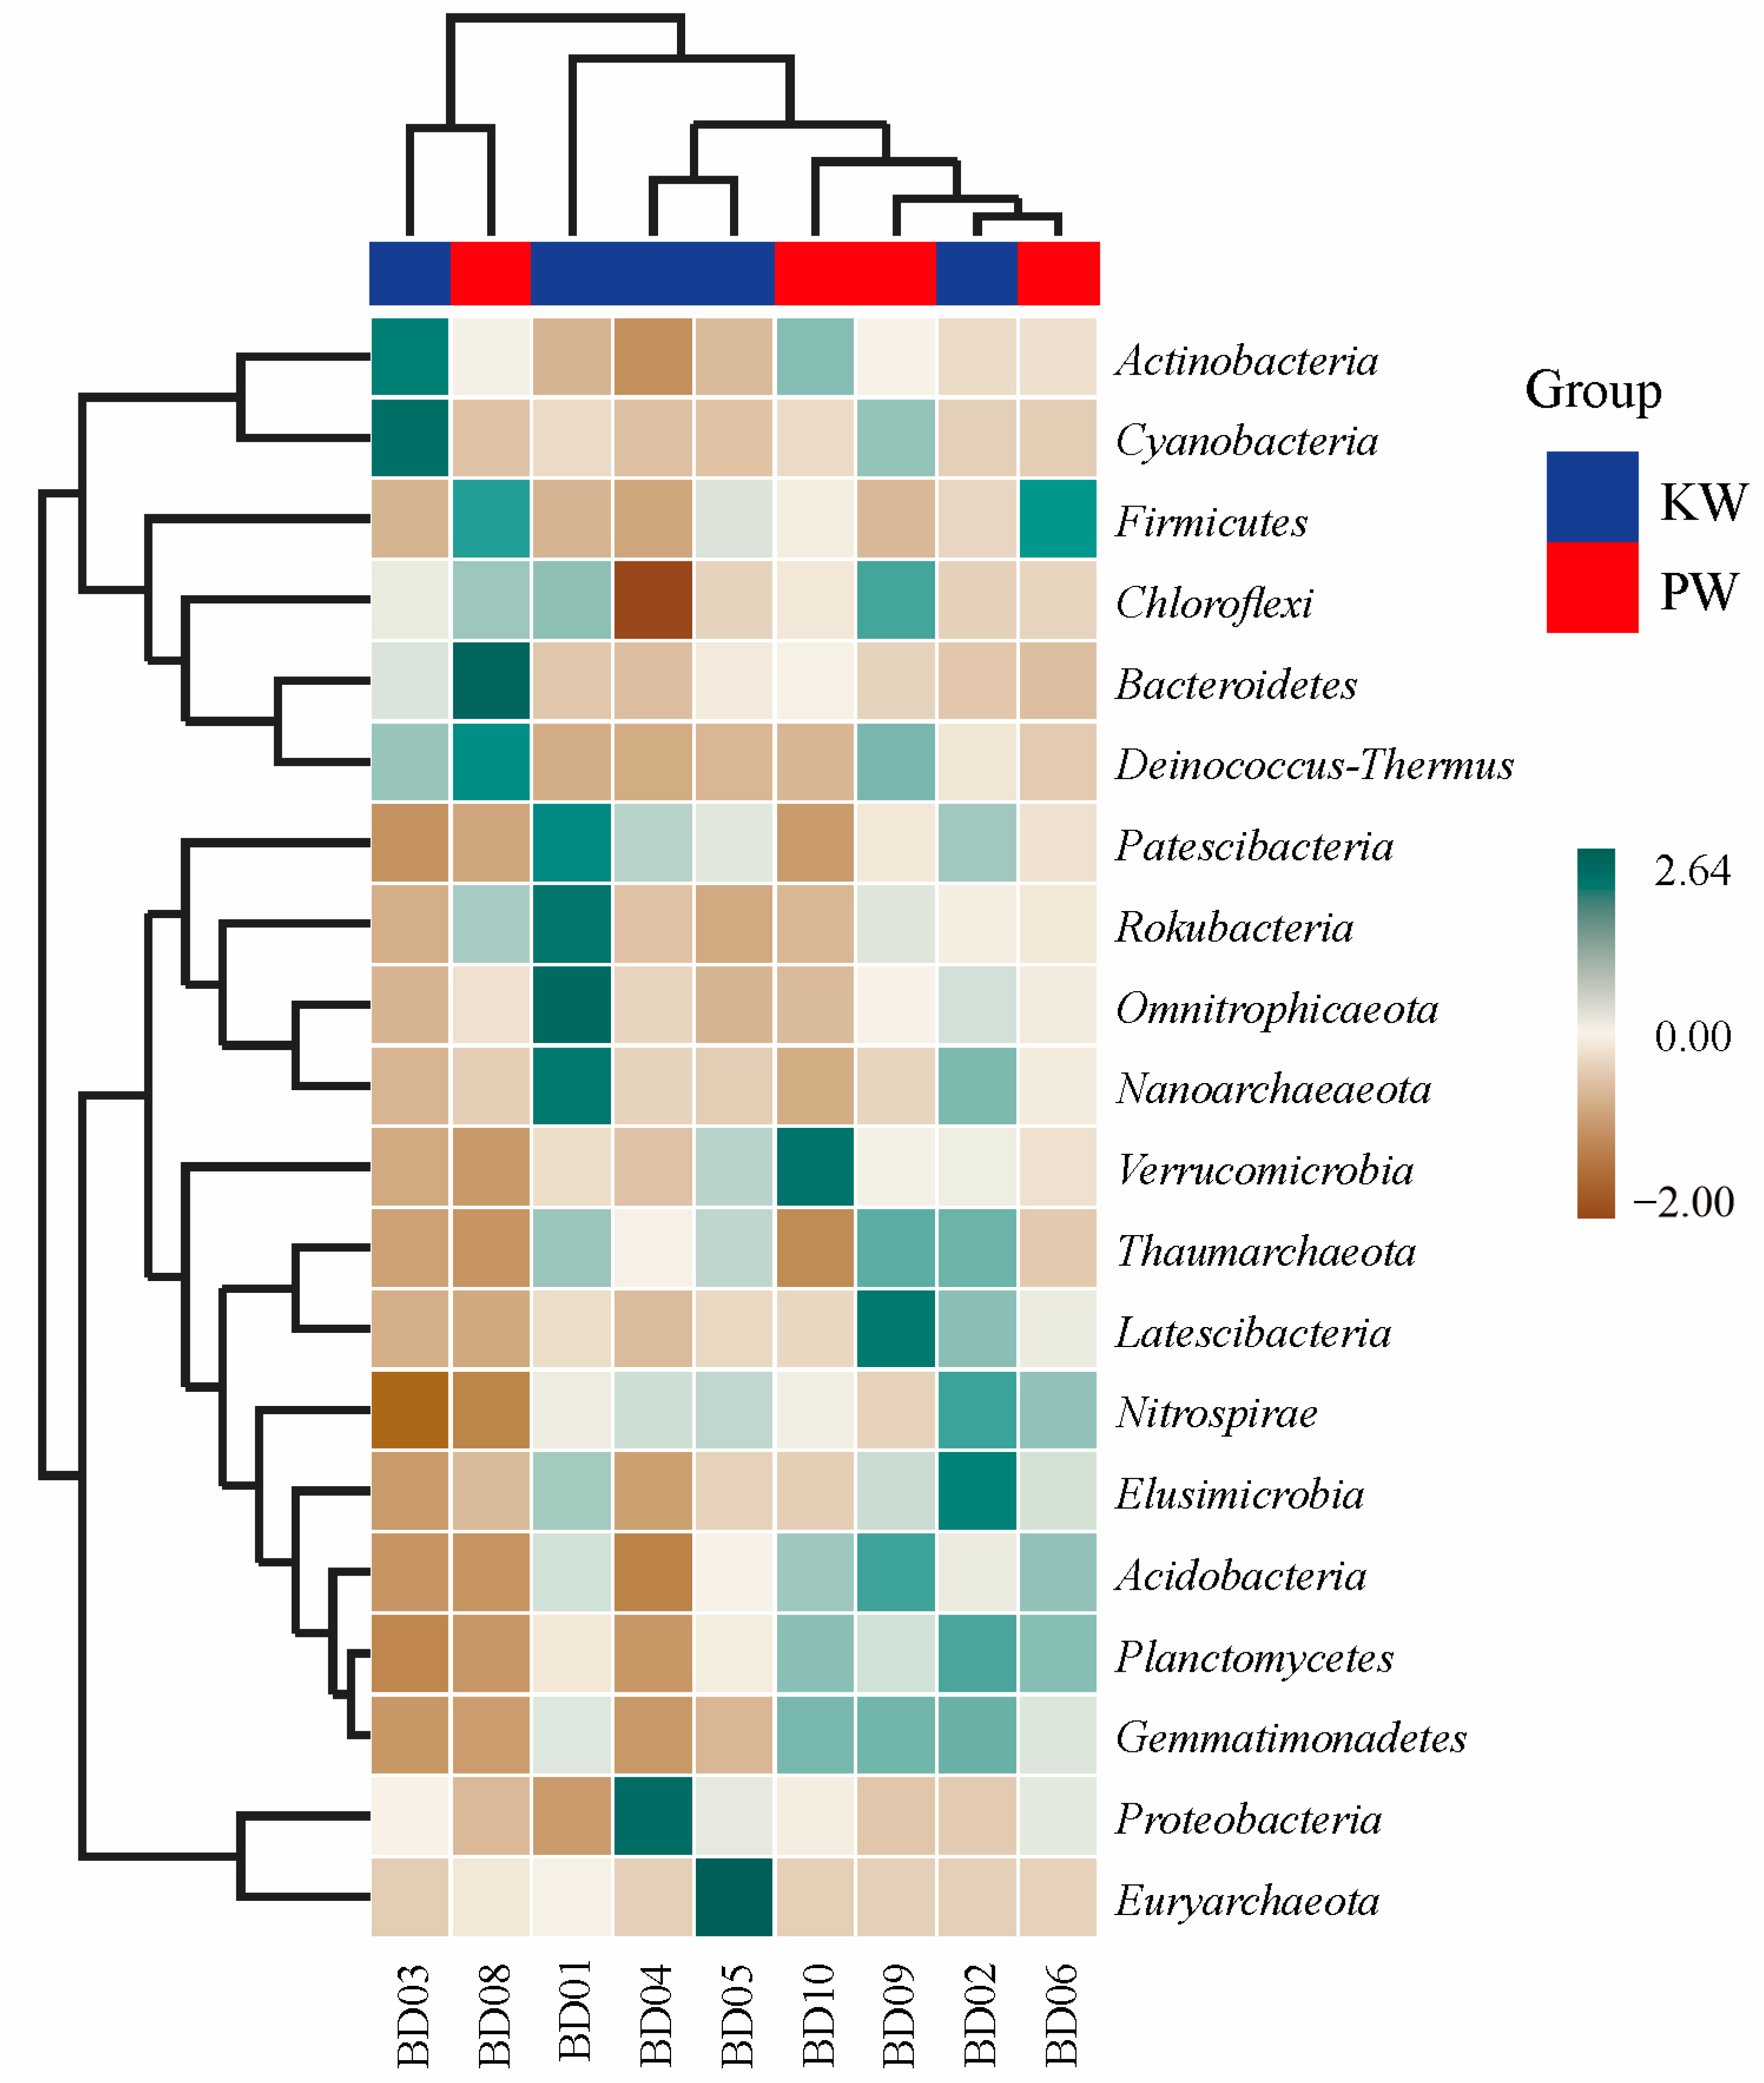
3.2.2. Microbial Composition Analysis

At the phylum level, Proteobacteria, Actinobacteria, Bacteroidetes, and Firmicutes are the bacterial species with the highest relative abundance in the groundwater in the study area, with all average contents above 6%, and single relative abundances accounting for 76.13~38.53%, 22.45~3.74%, and 22.67~2.49% of the total community, respectively (Figure 7 top). In addition, species with an average relative abundance greater than 3% include Planctomycetes (4.06%), Chloroflexi (4.04%), Omnitrophicaeota (3.95%), and Acidobacteria (3.26%). The groundwater in the study area moves from west (BD01) to east (BD10), resulting in gradient differences in water composition and underground environmental conditions, and the species composition changes accordingly [25]. In this process, the relative abundances of Proteobacteria and Omnitrophicaeota decreased, with a drop of 10.26% and 40.94%, respectively. Nonetheless, the relative abundances of Actinobacteria, Bacteroidetes, Planctomycetes, Chloroflexi, and Acidobacteria increased to varying degrees (20.93~95.52%). This growth in species relative abundance may imply a series of diversified ecological niches that have arisen or have been enhanced due to the gradual changes in water composition and underground environmental conditions. Bacteroidetes are famous for their ability to decompose polysaccharides, which helps in the degradation of organic matter [26]. Some studies have shown that Planctomycetes can degrade organic substances such as polysaccharides and polyphenols [27]. When groundwater flows from mountains to plains, it may change in the types and contents of organic matter, thereby benefiting the growth of Planctomycetes. Chloroflexi can also play a key role in the degradation of organic matter and denitrification process [28]. Acidobacteria are involved in various biogeochemical processes such as organic matter degradation and nitrate reduction [29].
The content of Nitrospirae, Rokubacteria, and Elusimicrobia are relatively uniform, with contents in the KW group of 3.06%, 1.42%, and 1.02%, respectively, and with contents in the PW group of 2.63%, 1.47%, and 0.9%. This finding indicates that they have potential adaptability to environmental changes, or that they are involved in basic biogeochemical processes that are common throughout the groundwater ecosystem. The ecological functions and relative abundance of Rokubacteria and Elusimicrobia in groundwater environments are relatively stable, which may be related to their physiological characteristics and ecological niches [30,31]. The similar relative abundance of Nitrospirae in karst water and porous water may imply that the nitrogen cycling processes in these two groundwater environments are relatively similar. Furthermore, the compositional differences between the KW group and PW group are the most evident in Actinobacteria, Bacteroidetes, Planctomycetes, and Acidobacteria with the above four types of bacteria contributing 9.09% of the positive compositional difference to the PW group. This result indicates that they may be better adapted to the environmental conditions of the PW group.
At the genus level, the composition varies considerably among different samples, and there is no obvious dominant genus (Figure 7 bottom). The dominant genus of BD1 is Omnitrophicaeota (13.49%), that of BD3 is Psychrobacter (22.66%) and Glutamicibacter (12.14%), that of BD4 is Gallionella (24.26%) and Sideroxydans (22.47%), and that of BD8 is Ochrobactrum (12.38%). There is no obvious dominant genus in other samples. Overall, the microbial community structure of the KW group shows a more obvious dominant genus, while the microbial community structure of the PW group is more balanced. These differences may reflect the diversity of environmental conditions and microbial ecological adaptability, suggesting the complexity and uniqueness of microbial ecosystems in each groundwater sample [32,33,34].

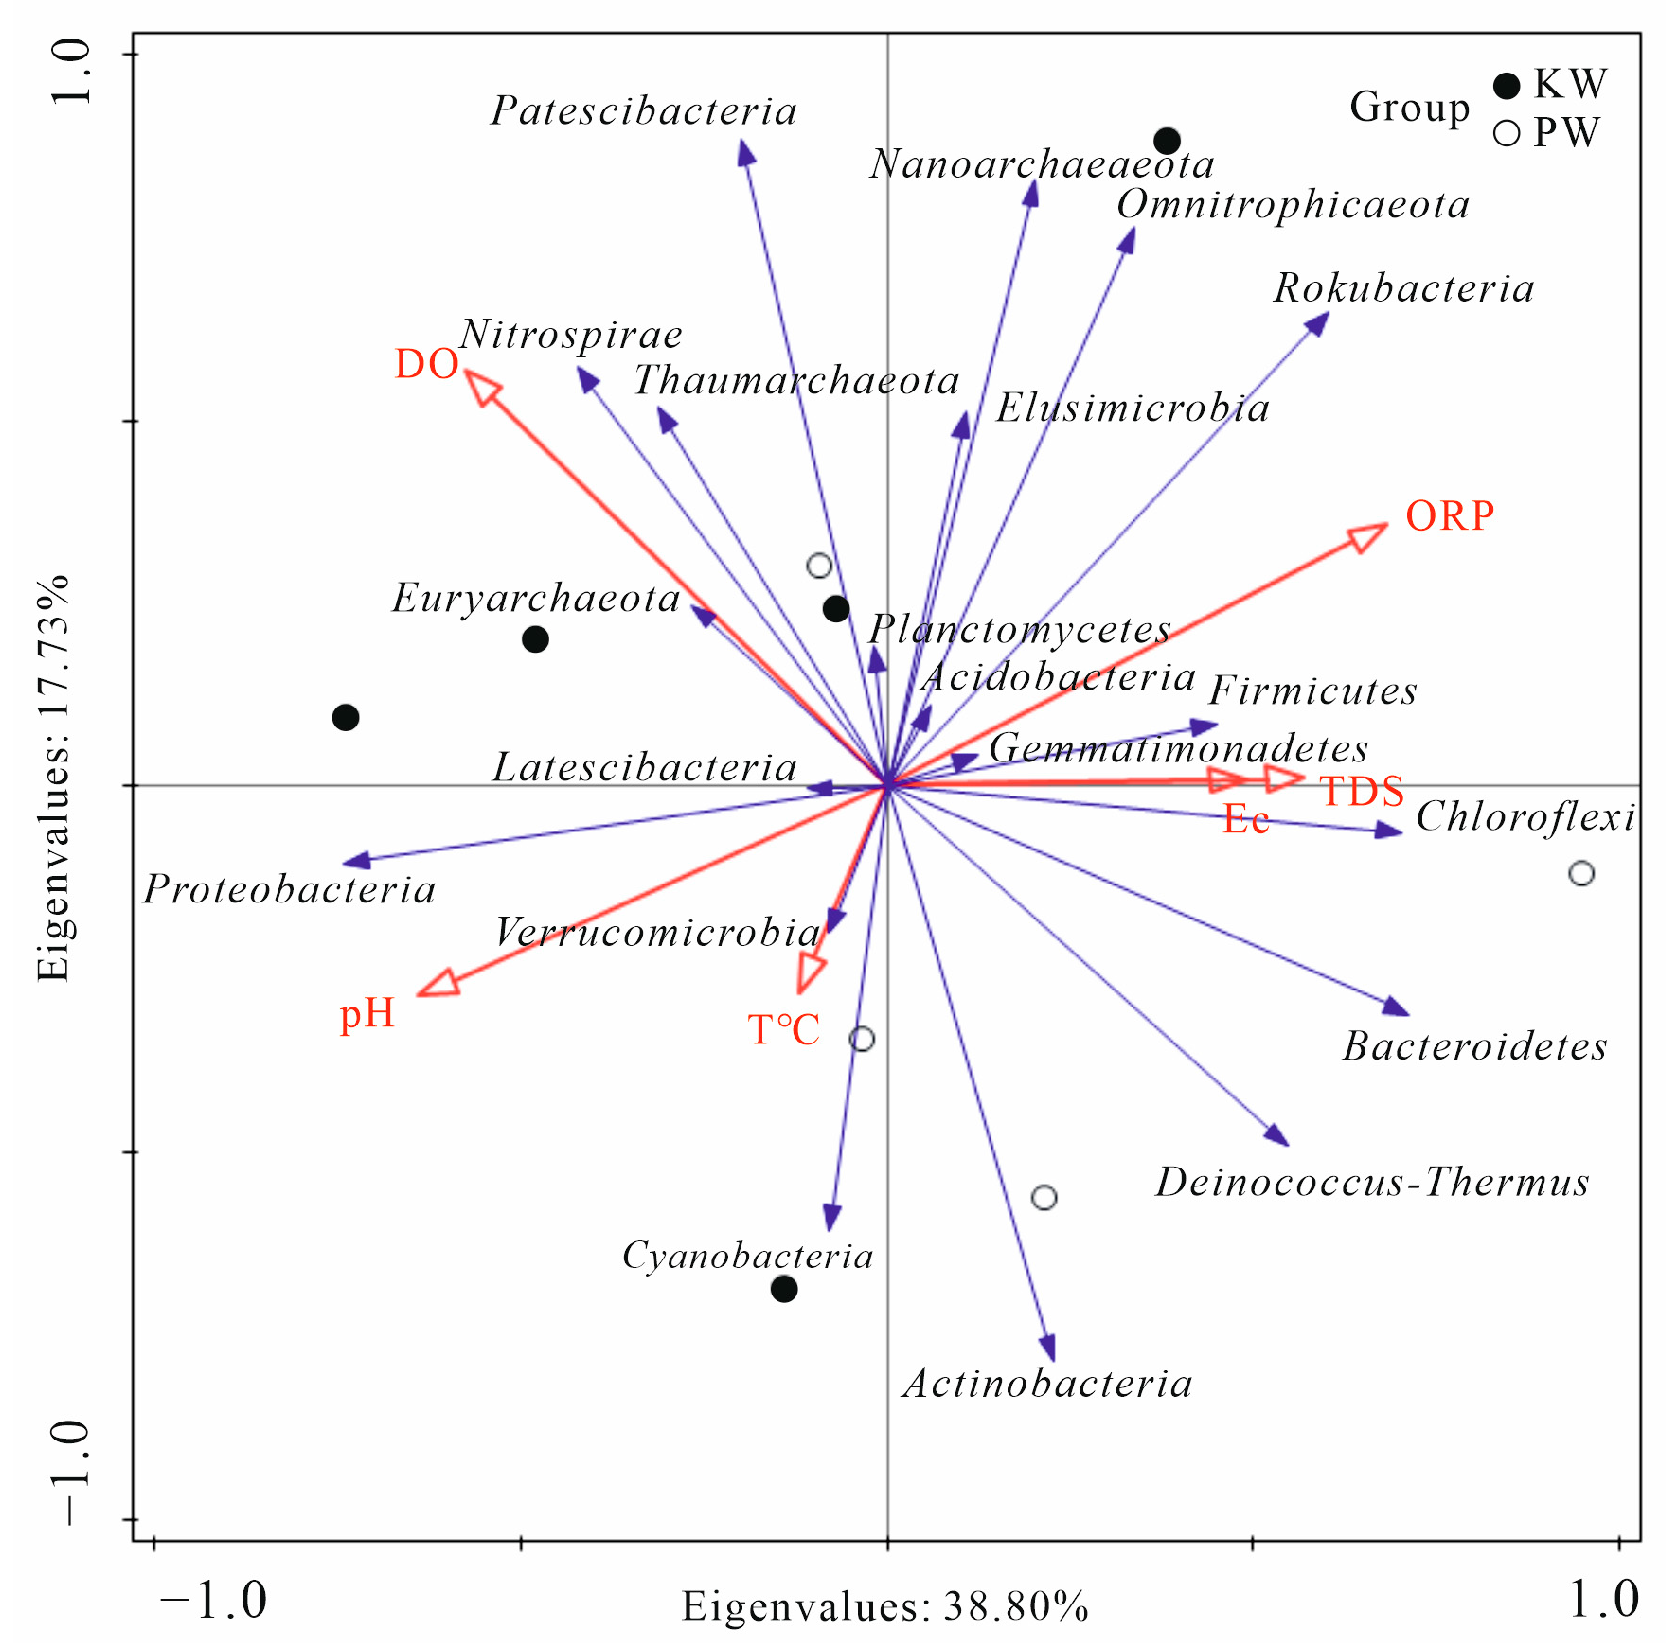
3.2.3. Analysis of Differences in Microbial Community Composition

Based on the high dispersion at the genus level and no obvious dominant genus in the microbial taxa of the study area’s groundwater, PCA analysis was carried out based on the species matrix at the phylum level [32]. As can be seen from the figure, PCo1 and PCo2 can represent 30.1% and 19.2% of the variation characteristics, respectively (Figure 8). The distribution of samples in the KW group is generally to the left, mainly concentrated in the area of the PCo1 axis from −0.2 to 0.05. Due to the higher community relative abundance and diversity in the PW group compared to the KW group, all samples fall within the −0.1 to 0.1 range on the PCo2 axis.
Given the nature of microbial community characteristic data, which often exhibit discontinuous or discrete distributions, this study employs heatmaps and Random Forest analyses (Figure 9 and Figure 10). These methods leverage decision trees to create nonlinear classifiers for sample categorization, facilitating the identification of marker species [35,36]. Such approaches are instrumental in environmental microbial analysis, where they enable a nuanced exploration of complex data sets, highlighting key species that may serve as indicators of environmental conditions or ecological processes. From the heatmaps of community composition at the phylum level, it can be seen that Actinobacteria, Bacteroidetes, Firmicutes, and Deinococcus-Thermus are more abundant in the PW group, while Omnitrophicaeota and Patescibacteria are more indicative in the KW group (Figure 9). This is associated with environmental tolerance as well as dissolved oxygen concentration and organic matter content [37,38].
In the analysis of Figure 9, we discern the heatmap that illustrates the importance of various bacterial phyla in distinguishing between sample groups. The heatmap explicitly marks the phyla Actinobacteria, Patescibacteria, Firmicutes, and Deinococcus-Thermus with positive values, indicating their significant roles in differentiating sample clusters. The disparity in importance scores suggests the differential abundance or unique presence of these bacterial phyla within certain sample groups, which may reflect the ecological or environmental specificity of the sampled environments. Consequently, these bacteria may serve as pivotal indicators of the latent conditions within each environment. The pronounced significance of Actinobacteria and Patescibacteria could suggest their paramount role in defining microbial community structures. Notably, the biological traits of Patescibacteria, as documented by C J Castelle et al. (2017), indicate their robust survival in anoxic or microaerophilic conditions, utilizing a variety of organic substances for carbon and energy sources, and potentially justifying their marked importance in specific sample groups [39]. The analysis of metagenomic and metatranscriptomic sequences from microbial mats has revealed that Patescibacteria, a minor fraction, showed significant spatial and seasonal variations in composition, suggesting an active response to environmental conditions. The metagenome-assembled genomes (MAGs) of Patescibacteria indicated their potential importance in the ecosystem, despite their lower abundance [40]. Conversely, the adaptability of Firmicutes and Deinococcus-Thermus depends on nutrient-scarce and extreme environments, which might suggest their distinguishing role in such conditions, in line with the findings of S Maloy (2013) and K S Makarova et al. (2001) [41,42]. Synthesizing these observations, it could be inferred that nutritional variations and dissolved oxygen levels are notable factors in differentiating microbial communities between the KW group and the PW group. This inference is in concordance with the broader research perspectives outlined by D C White et al. (1995) and K Manoj et al. (2016), underscoring the influence of environmental conditions on microbial diversity and distribution [43,44].

4. Discussion

Within the realm of hydrological characteristics, our analysis unveils a statistically significant correlation between the relative abundance of different microbial species and specific hydrological indicators. This correlation accentuates the intricate linkages between microbial diversity and hydrological parameters, highlighting the influence of environmental factors such as ion concentration, pH, and redox potential on microbial community dynamics within aquatic ecosystems. As can be seen from the correlation heatmap, in the KW environment, various ions in the water body support the relative abundance of species and to some extent support the development of species evolution and diversity. Among them, the higher ORP indicates that the level of oxidation is closely associated with the improvement of species diversity (Figure 11). The Chao1 diversity index is significantly positively correlated with ORP (Oxidation–Reduction Potential) and Na+, and significantly negatively correlated with pH. This implies that microbial relative abundance will be higher in environments with high oxidation–reduction potential and high Na+ concentration. Species relative abundance will decrease in environments with low pH values. The Shannon diversity index is extremely positively correlated with ORP. This indicates that the diversity of microbial species will increase in environments with high ORP values. The PW environment is different, the overall relative abundance of species relatively prefers a weakly oxidizing environment, and the diversity and evolution level of species relatively depend on a high dissolved oxygen alkaline environment. The Shannon diversity index is significantly positively correlated with pH and DO (dissolved oxygen), and significantly negatively correlated with Ec (conductivity), Ca2+, Cl, HCO3, NO3, and other factors. This implies that in environments with high pH values and high dissolved oxygen concentrations, the diversity of microbial communities will increase, while in environments with high conductivity and high concentrations of ions, such as Ca2+, Cl, HCO3, and NO3, the diversity of microbial communities will decrease. The Pielou_e uniformity index is significantly positively correlated with pH and DO, and significantly negatively correlated with Ec, Ca2+, Cl, HCO3, NO3, and other factors. This means that in environments with high pH values and high dissolved oxygen concentrations, the uniformity of microbial communities will increase, while in environments with high conductivity and high concentrations of ions, such as Ca2+, Cl, HCO3, and NO3, the uniformity of microbial communities will decrease.
In this study, Redundancy Analysis (RDA) was conducted on the top 20 taxa at the species level, aiming at elucidating their relationship with key hydrological and hydrochemical characteristics. The results, illustrated in Figure 12 and Figure 13, offer detailed insight on the specific interactions between these taxa and environmental factors. It is implicit in this analysis that the findings are taxon-specific, reflecting the unique ecological dynamics and environmental interactions of each species.
In our RDA within the KW group, significant insights emerged. Proteobacteria exhibited a positive correlation with NO2, potentially linked to nitrate respiration capabilities in some of its members. Actinobacteria, Cyanobacteria, and Deinococcus-Thermus showed positive associations with HCO3, Na+, Ca2+, Mg2+, and SO42−, notably with HCO3 reaching significance, suggesting these ions might be crucial for their growth and metabolism. For instance, Actinobacteria are known to utilize bicarbonate ions as a carbon source [45]. Omnitrophicaeota, Rokubacteria, and Nanoarchaeaeota’s negatively correlated with pH and temperature and positively correlated with ORP, DO, and primary water ions, with significant associations with pH, ORP, K+, and Cu, indicating a preference for lower pH and temperatures and a requirement for higher oxidation–reduction potential and dissolved oxygen concentrations. In contrast, Firmicutes, Euryarchaeota, and Verrucomicrobia displayed negative correlations with Ec, DO, and main ion content. Nevertheless, Firmicutes, Euryarchaeota, and Verrucomicrobia showed positive correlations with ORP, temperature, F, silicic acid, and Fe content, as well as significant correlations with Ec, Mg2+, Cl, NO3, F, silicic acid, and Fe, suggesting an adaptation to environments rich in these elements. Lastly, Planctomycetes, Nitrospirae, Thaumarchaeota, and Latescibacteria were positively correlated with ORP and silicic acid, while negatively correlated with Ba, Cr, and the main ions in the water body. Additionally, Planctomycetes, Nitrospirae, Thaumarchaeota, and Latescibacteria showed significant correlations with ORP, Ba, and Cr. This indicates a stronger survival ability in high oxidation–reduction potential and silicic acid environments, but a possible sensitivity to elements like Ba and Cr.
In the PW group, Proteobacteria, Planctomycetes, Acidobacteria, and Nitrospirae were positively correlated with pH, DO, and F, while negatively correlated with Ec, temperature, and other main ions. Among them, pH, HCO3, Mg2+, Ba, Co, etc., reached extremely significant levels, which implies that these microbes are adapted to high pH, high dissolved oxygen, and F environments, but are not adapted to high conductivity and temperature, or have difficulty surviving in environments with high main ion concentration. This finding is consistent with the study conducted by T M Lapara, et al. 2001 [46]. These microbes may also use these environmental factors as energy or nutrients through some special biochemical pathways. In addition, Bacteroidetes, Chloroflexi, Omnitrophicaeota, Rokubacteria, Euryarchaeota, and Deinococcus-Thermus were negatively correlated with pH, DO, and F, while positively correlated with Ec, Ba, Co, Sr, and the main ions in the water body. Among them, Ec, Ca2+, Mg2+, Cl, SO42−, NO3, Co, and Sr showed extremely significant correlations. This indicates that these microbes may be adapted to low pH, low dissolved oxygen, and low F- environments and have stronger survival capabilities in high-conductivity and high-ion-concentration environments or can metabolize some substances in high ion environments [47]. Also, Cyanobacteria, Thaumarchaeota, and Latescibacteria were significantly negatively correlated with ORP while significantly positively correlated with NO2. This may mean that these microbes are more likely to survive in environments with lower oxidation–reduction potential and can use NO2 as an energy source or nutrient [48].
The categorization of resources utilized by microbial communities, as detailed in Table 2, delineates the diversity of dissolved ions, organic compounds, and environmental variables in the groundwater ecosystem. This table crucially outlines the shifts in niche breadth and resource utilization patterns among key species such as Omnitrophicaeota and Euryarchaeota. For instance, Omnitrophicaeota demonstrates a noteworthy shift from a positive correlation to a negative correlation with basic hydrochemical ions when transitioning from karst to porous water. Similarly, Euryarchaeota’s response to environmental conductivity and ion concentrations like Ca2+ and Mg2+ reverses from karst to porous water. These changes underscore the dynamic nature of microbial interactions with their environment, highlighting a complex interplay between microbial ecology and hydrochemical factors. Detailed insights into these transformations, as provided in Table 2, are instrumental in understanding the ecological adaptability of these species and their roles in groundwater ecosystems. Among them, Omnitrophicaeota and Euryarchaeota have changed in their response to basic hydrochemical ions. The correlation of Omnitrophicaeota with K+, Na+, and SO42− changed from a positive correlation in karst water to a negative correlation (0.767→−0.81*). The correlation of Euryarchaeota with Ec, TDS, Ca2+, Mg2+, Cl, and NO3 changed from a negative correlation in karst water to a positive correlation (−0.82*→0.756). The response changes of Thaumarchaeota and Latescibacteria are consistent, affecting the correlation with ORP (0.803→−0.81*) and NO2 (−0.347→0.883*). These microbes have shown different ecological niche widths in different water body environments, reflecting their outstanding environmental adaptability [49]. Specifically, the ecological niche widths of Omnitrophicaeota, Thaumarchaeota, and Euryarchaeota in porous water significantly exceed that of those in karst water, implying that the porous water environment may have larger environmental fluctuations, forcing these microbes to expand their resource acquisition strategies [50]. Similarly, the resource selection of these microbes in different water bodies also showed differences, possibly due to the different competitive pressures they face. For example, Omnitrophicaeota mainly uses S5 and S6 resources in karst water, while it mainly uses S4, S8, and S9 resources in porous water, which may be a response to the competitive pressure of other microbial communities in the environment [51]. Moreover, the variability in niche width and resource selection is a critical factor contributing to ecosystem diversity. Microbes with broader ecological niches demonstrate robust resilience in fluctuating environments, thereby reinforcing the stability and diversity of their ecosystems. Such adaptability is evident in species like Omnitrophicaeota and Euryarchaeota, which exhibits remarkable flexibility in responding to hydrochemical changes in groundwater environments. This flexibility not only highlights their ecological plasticity but also underscores their crucial role in sustaining ecological diversity amidst environmental perturbations. These insights into microbial adaptability offer a profound understanding of the complex interplay between microbial communities and their changing deepening, advancing our comprehension of microbial contributions to ecosystem resilience.

5. Conclusions

Through hydrochemical analysis, it was observed that the groundwater in the study area was weakly alkaline. Karst water and porous water exhibit distinct differences in terms of major ion composition, dissolved oxygen content, and redox properties, reflecting two distinctly different environments due to the variations in stratum lithology and redox conditions. The alpha diversity indices, encompassing the Chao1, Shannon, and Simpson indices, collectively depict the biotic richness and evenness within the Yimuquan Spring groundwater ecosystem. Notably, the Chao1 index underscores a higher species richness in the PW group, suggesting a more diverse microbial assembly. Concurrently, the Faith PD index points to a greater evolutionary diversity and evenness within the PW group, implying a more intricate microbial network with potentially broader ecological functions and adaptability to environmental gradients such as ion concentration variations. These insights into microbial diversity and distribution are pivotal in mapping the ecological functions of groundwater microbiota. The groundwater microbial community is mainly composed of Proteobacteria, Actinobacteria, Bacteroidetes, etc., and their relative abundance undergoes noticeable changes in the process of groundwater migration from west to east, which reflects the influence of water composition and underground environmental conditions. It appears that different bacterial groups may demonstrate different ecological adaptability to changes in specific environmental conditions, suggesting the complexity and uniqueness of the underground water microbial ecosystem. Utilizing heat map and Random Forest analysis, it was found that Actinobacteria, Bacteroidetes, Firmicutes, etc. tend to be more abundant in the PW group, while Omnitrophicaeota and Cyanobacteria were more commonly found in the KW group, potentially relating to environmental tolerance, dissolved oxygen concentration, and organic matter content. The observed prevalence of Cyanobacteria in the KW group could indicate interactions between surface and groundwater, given that Cyanobacteria’s light-dependent nature suggests an origin from surface waters [52]. Their ability to adapt to a range of conditions, including environments with variable dissolved oxygen levels and organic content, further highlights their potential as indicators of hydrological interactions. The existence of these indicator species suggests that the differences in nutritional conditions and dissolved oxygen content are the main factors shaping the microbial community structure variations in the KW group and PW group of groundwater. Principal Component Analysis (PCA) and Redundancy Analysis (RDA) indicate that there is a noticeable correlation between the relative abundance and diversity of microbial communities and the hydrological features of the environment they inhabit. These environmental features include redox potential, ion concentration, dissolved oxygen concentration, conductivity, and pH. Individual microbial species such as Omnitrophicaeota, Euryarchaeota, Thaumarchaeota, and Latescibacteria demonstrate adaptive shifts in different water environments, which further emphasizes the crucial role of microbes in responding to environmental changes and in maintaining ecological diversity.

Author Contributions

Conceptualization, H.Z. and L.Z.; methodology, Y.L.; software, T.Z.; validation, H.Z., X.M. and S.L.; formal analysis, T.Z.; investigation, Y.L.; resources, X.L.; data curation, H.Z.; writing—original draft preparation, H.Z.; writing—review and editing, H.Z. and L.Z.; visualization, T.Z.; supervision, L.Z.; project administration, X.L.; funding acquisition, L.Z. All authors have read and agreed to the published version of the manuscript.

Funding

This work is funded by the Hebei Province Central Guidance for Local Science and Technology Development Fund (grant no.: 236Z3902G), Scientific research project of State Grid Qinghai Electric Power Company (grant no.: B7280722E072), open fund of State Key Laboratory of Biogeography and Environmental Geology (grant no.: GBL22110), and the open fund from the Key Lab of Eco-restoration of Regional Contaminated Environment (Shenyang University), Ministry of Education (grant no.: KF-22-03).

Data Availability Statement

The data presented in this study are available on request from the corresponding author.

Acknowledgments

The authors gratefully acknowledge the State Key Laboratory of Biogeography and Environmental Geology and the Key Lab of Eco-restoration of Regional Contaminated Environment for their invaluable guidance in research methodologies. Special thanks are also extended to the Department of Civil and Environmental Engineering at the University of Alberta for their expert guidance in bioinformatics analysis and for providing essential research facilities. Their support was crucial in the successful completion of this study.

Conflicts of Interest

The authors declare no conflict of interest. The funders had no role in the design of the study; in the collection, analyses, or interpretation of data; in the writing of the manuscript, or in the decision to publish the results.

References

  1. Medici, G.; Lorenzi, V.; Sbarbati, C.; Manetta, M.; Petitta, M. Structural Classification, Discharge Statistics, and Recession Analysis from the Springs of the Gran Sasso (Italy) Carbonate Aquifer; Comparison with Selected Analogues Worldwide. Sustainability 2023, 15, 10125. [Google Scholar] [CrossRef]
  2. Kalhor, K.; Ghasemizadeh, R.; Rajic, L.; Alshawabkeh, A.N. Assessment of groundwater quality and remediation in karst aquifers: A review. Groundw. Sustain. Dev. 2019, 8, 104–121. [Google Scholar] [CrossRef]
  3. Cerasoli, F.; Fiasca, B.; Di Lorenzo, T.; Lombardi, A.; Tomassetti, B.; Lorenzi, V.; Vaccarelli, I.; Di Cicco, M.; Petitta, M.; Galassi, D.M.P. Assessing spatial and temporal changes in diversity of copepod crustaceans: A key step for biodiversity conservation in groundwater-fed springs. Front. Environ. Sci. 2023, 11, 1051295. [Google Scholar] [CrossRef]
  4. Shields, M.R.; Bianchi, T.S.; Gélinas, Y.; Allison, M.A.; Twilley, R.R. Enhanced terrestrial carbon preservation promoted by reactive iron in deltaic sediments. Geophys. Res. Lett. 2016, 43, 1149–1157. [Google Scholar] [CrossRef]
  5. Yan, L.; Syrie, M.; Totsche, K.U.; Lehmann, R.; Herrmann, M.; Küsel, K. Groundwater bacterial communities evolve over time in response to recharge. Water Res. 2021, 201, 117290. [Google Scholar] [CrossRef]
  6. Wehncke, E.V.; Mariano, N.A. Groundwater and Its Role in Maintaining the Ecological Functions of Ecosystems—A Review. In Intensified Land and Water Use: A Holistic Perspective of Local to Regional Integration; Springer: Berlin/Heidelberg, Germany, 2021. [Google Scholar] [CrossRef]
  7. Sharma, P.; Pandey, A.K.; Kim, S.H.; Singh, S.P.; Chaturvedi, P.; Varjani, S. Critical review on microbial community during in-situ bioremediation of heavy metals from industrial wastewater. Environ. Technol. Innov. 2021, 21, 101826. [Google Scholar] [CrossRef]
  8. Wegner, C.E.; Gaspar, M.; Geesink, P.; Herrmann, M.; Marz, M.; Küsel, K. Biogeochemical Regimes in Shallow Aquifers Reflect the Metabolic Coupling of the Elements Nitrogen, Sulfur, and Carbon. Appl. Environ. Microbiol. 2019, 85, e02346-18. [Google Scholar] [CrossRef]
  9. Rinke, C.; Rubino, F.; Messer, L.F.; Youssef, N.; Parks, D.H.; Chuvochina, M.; Brown, M.; Jeffries, T.; Tyson, G.W.; Seymour, J.R.; et al. A phylogenomic and ecological analysis of the globally abundant Marine Group II archaea (Ca. Poseidoniales ord. nov.). ISME J. 2018, 13, 663–675. [Google Scholar] [CrossRef]
  10. Xiao, Y.; Xiao, D.; Hao, Q.; Liu, K.; Wang, R.; Huang, X.; Liao, X.; Zhang, Y. Accessible Phreatic Groundwater Resources in the Central Shijiazhuang of North China Plain: Perspective From the Hydrogeochemical Constraints. Front. Environ. Sci. 2021, 9, 747097. [Google Scholar] [CrossRef]
  11. Korbel, K.L.; Greenfield, P.; Hose, G.C. Agricultural practices linked to shifts in groundwater microbial structure and denitrifying bacteria. Sci. Total Environ. 2022, 807 Pt 2, 150870. [Google Scholar] [CrossRef]
  12. Retter, A.; Karwautz, C.; Griebler, C. Groundwater Microbial Communities in Times of Climate Change. Curr. Issues Mol. Biol. 2021, 41, 509–538. [Google Scholar] [CrossRef]
  13. Pan, Y.N.; Li, Q.; Liu, Y.; Liu, R.; Deng, R. Hydroclimate variations in the Northern China Plain and their possible socio-cultural influences. Geogr. Ann. Ser. A Phys. Geogr. 2020, 102, 287–296. [Google Scholar] [CrossRef]
  14. Chen, W. A View on Geomorphologic Zonalization of North China Plain. Geogr. Geo-Inf. Sci. 2008, 25, 100–103. [Google Scholar]
  15. Huang, Z.Y.; Pan, Y.; Gong, H.; Yeh, P.J.F.; Li, X.; Zhou, D.; Zhao, W. Subregional-scale groundwater depletion detected by GRACE for both shallow and deep aquifers in North China Plain. Geophys. Res. Lett. 2015, 42, 1791–1799. [Google Scholar] [CrossRef]
  16. Han, D.M.; Currell, M.J.; Guo, H. Controls on distributions of sulphate, fluoride, and salinity in aquitard porewater from the North China Plain: Long-term implications for groundwater quality. J. Hydrol. 2021, 603, 126828. [Google Scholar] [CrossRef]
  17. GB/T 14848-2017; Standards for Groundwater Quality. General Administration of Quality Supervision, Inspection and Quarantine of the People’s Republic of China, Standardization Administration of China, Standards Press of China: Beijing, China, 2017.
  18. Fu, X.G.; Dong, Z.; Gan, S.; Wang, Z.; Wei, A. Groundwater Quality Evaluation for Potable Use and Associated Human Health Risk in Gaobeidian City, North China Plain. J. Chem. 2021, 2021, 3008567. [Google Scholar] [CrossRef]
  19. GB/T 5750-2006; Standard Test Methods for Drinking Water. Ministry of Health of the People’s Republic of China, Standardization Administration of China, Standards Press of China: Beijing, China, 2006.
  20. DD2014-15; Technical Requirements for Quality Control of Sample Analysis in Groundwater Pollution Investigation and Evaluation. Geological Survey of China: Beijing, China, 2014.
  21. Dinno, A. Nonparametric Pairwise Multiple Comparisons in Independent Groups using Dunn’s Test. Stata J. 2015, 15, 292–300. [Google Scholar] [CrossRef]
  22. Yatsunenko, T.; Rey, F.E.; Manary, M.J.; Trehan, I.; Dominguez-Bello, M.G.; Contreras, M.; Magris, M.; Hidalgo, G.; Baldassano, R.N.; Anokhin, A.P.; et al. Human gut microbiome viewed across age and geography. Nature 2012, 486, 222–227. [Google Scholar] [CrossRef]
  23. Qin, C.Q.; Ding, H.; Li, S.L.; Yue, F.J.; Wang, Z.J.; Zeng, J. Hydrogeochemical Dynamics and Response of Karst Catchment to Rainstorms in a Critical Zone Observatory (CZO), Southwest China. Front. Water 2020, 2, 577511. [Google Scholar] [CrossRef]
  24. Armstrong, G.; Cantrell, K.; Huang, S.; McDonald, D.; Haiminen, N.; Carrieri, A.P.; Zhu, Q.; Gonzalez, A.; McGrath, I.; Beck, K.L.; et al. Efficient computation of Faith’s phylogenetic diversity with applications in characterizing microbiomes. Genome Res. 2021, 31, 2131–2137. [Google Scholar] [CrossRef]
  25. Amalfitano, S.; Del Bon, A.; Zoppini, A.; Ghergo, S.; Fazi, S.; Parrone, D.; Casella, P.; Stano, F.; Preziosi, E. Groundwater geochemistry and microbial community structure in the aquifer transition from volcanic to alluvial areas. Water Res. 2014, 65, 384–394. [Google Scholar] [CrossRef]
  26. Kirchman, D.L. The ecology of Cytophaga-Flavobacteria in aquatic environments. FEMS Microbiol. Ecol. 2002, 39, 91–100. [Google Scholar] [CrossRef]
  27. Wang, J.; Jenkins, C.; Webb, R.I.; Fuerst, J.A. Isolation of Gemmata-like and Isosphaera-like planctomycete bacteria from soil and freshwater. Appl. Environ. Microbiol. 2002, 68, 417–422. [Google Scholar] [CrossRef]
  28. Hug, L.A.; Castelle, C.J.; Wrighton, K.C.; Thomas, B.C.; Sharon, I.; Frischkorn, K.R.; Williams, K.H.; Tringe, S.G.; Banfield, J.F. Community genomic analyses constrain the distribution of metabolic traits across the Chloroflexi phylum and indicate roles in sediment carbon cycling. Microbiome 2013, 1, 22. [Google Scholar] [CrossRef] [PubMed]
  29. Jones, R.T.; Robeson, M.S.; Lauber, C.L.; Hamady, M.; Knight, R.; Fierer, N. A comprehensive survey of soil acidobacterial diversity using pyrosequencing and clone library analyses. ISME J. 2009, 3, 442–453. [Google Scholar] [CrossRef] [PubMed]
  30. Castelle, C.J.; Wrighton, K.C.; Thomas, B.C.; Hug, L.A.; Brown, C.T.; Wilkins, M.J.; Frischkorn, K.R.; Tringe, S.G.; Singh, A.; Markillie, L.M.; et al. Genomic expansion of domain archaea highlights roles for organisms from new phyla in anaerobic carbon cycling. Curr. Biol. 2015, 25, 690–701. [Google Scholar] [CrossRef]
  31. Herlemann, D.P.; Labrenz, M.; Jürgens, K.; Bertilsson, S.; Waniek, J.J.; Andersson, A.F. Transitions in bacterial communities along the 2000 km salinity gradient of the Baltic Sea. ISME J. 2011, 5, 1571–1579. [Google Scholar] [CrossRef] [PubMed]
  32. Lozupone, C.A.; Knight, R. Global patterns in bacterial diversity. Proc. Natl. Acad. Sci. USA 2007, 104, 11436–11440. [Google Scholar] [CrossRef]
  33. Flynn, T.M.; Sanford, R.A.; Ryu, H.; Bethke, C.M.; Levine, A.D.; Ashbolt, N.J.; Domingo, J.W.S. Functional microbial diversity explains groundwater chemistry in a pristine aquifer. BMC Microbiol. 2013, 13, 146. [Google Scholar] [CrossRef]
  34. Faust, K.; Raes, J. Microbial interactions: From networks to models. Nat. Rev. Microbiol. 2012, 10, 538–550. [Google Scholar] [CrossRef]
  35. Robinson, R.L.M.; Palczewska, A.; Palczewski, J.; Kidley, N. Comparison of the Predictive Performance and Interpretability of Random Forest and Linear Models on Benchmark Data Sets. J. Chem. Inf. Model. 2017, 57, 1773–1792. [Google Scholar] [CrossRef]
  36. Louca, S.; Jacques, S.M.S.; Pires, A.P.F.; Leal, J.S.; Srivastava, D.S.; Parfrey, L.W.; Farjalla, V.F.; Doebeli, M. High taxonomic variability despite stable functional structure across microbial communities. Nat. Ecol. Evol. 2016, 1, 0015. [Google Scholar] [CrossRef]
  37. Vorholt, J.A. Microbial life in the phyllosphere. Nat. Rev. Microbiol. 2012, 10, 828–840. [Google Scholar] [CrossRef]
  38. Nickerson, C.A.; Ott, C.M.; Mister, S.J.; Morrow, B.J.; Burns-Keliher, L.; Pierson, D.L. Microbial responses to microgravity and other low-shear environments. Microbiol. Mol. Biol. Rev. 2004, 68, 345–361. [Google Scholar] [CrossRef]
  39. Castelle, C.J.; Brown, C.T.; Thomas, B.C.; Williams, K.H.; Banfield, J.F. Unusual respiratory capacity and nitrogen metabolism in a Parcubacterium (OD1) of the Candidate Phyla Radiation. Sci. Rep. 2017, 7, 40101. [Google Scholar] [CrossRef] [PubMed]
  40. Vigneron, A.; Perrine, C.; Rémy, G.; Marisol, G.-U. Into the darkness of the microbial dark matter: In situ activities through expression profiles of Patescibacteria populations. Front. Microbiol. 2023, 13, 1073483. [Google Scholar] [CrossRef] [PubMed]
  41. Maloy, S. Brenner’s Encyclopedia of Genetics. Brenners Encycl. Genet. 2013, 91, 2–3. [Google Scholar]
  42. Makarova, K.S.; Aravind, L.; Wolf, Y.I.; Tatusov, R.L.; Minton, K.W.; Koonin, E.V.; Daly, M.J. Genome of the Extremely Radiation-Resistant Bacterium Deinococcus radiodurans Viewed from the Perspective of Comparative Genomics. Microbiol. Mol. Biol. Rev. 2001, 65, 44–79. [Google Scholar] [CrossRef] [PubMed]
  43. White, D.C.; Ringelberg, D.B.; Palmer, R.J. Quantitative Comparison of the In Situ Microbial Communities in Different Biomes; Oak Ridge National Lab. (ORNL): Oak Ridge, TN, USA; Tennessee University: Knoxville, TN, USA, 1995. [Google Scholar]
  44. Manoj, K.; Shrivastava, N.; Teotia, P.; Goyal, P.; Varma, A.; Sharma, S.; Tuteja, N.; Kumar, V. Omics: Tools for Assessing Environmental Microbial Diversity and Composition. In Modern Tools and Techniques to Understand Microbes; Springer: Berlin/Heidelberg, Germany, 2016; pp. 273–283. [Google Scholar]
  45. Zaitsev, G.M.; Tsitko, I.V.; Rainey, F.A.; Trotsenko, Y.A.; Uotila, J.S.; Stackebrandt, E.; Salkinoja-Salonen, M.S. New aerobic ammonium-dependent obligately oxalotrophic bacteria: Description of Ammoniphilus oxalaticus gen. nov. sp. nov. and Ammoniphilus oxalivorans gen. nov. sp. nov. Int. J. Syst. Bacteriol. 1998, 48 Pt 1, 151. [Google Scholar] [CrossRef] [PubMed]
  46. Lapara, T.M.; Nakatsu, C.H.; Pantea, L.M. Aerobic Biological Treatment of a Pharmaceutical Wastewater: Effect of Temperature on Cod Removal And Bacterial Community Development. Water Res. A J. Int. Water Assoc. 2001, 35, 4417–4425. [Google Scholar]
  47. Hahn, M.W. Broad diversity of viable bacteria in ‘sterile’ (0.2 μm) filtered water. Res. Microbiol. 2004, 155, 688–691. [Google Scholar] [CrossRef] [PubMed]
  48. Paerl, H.W.; Hall, N.S.; Calandrino, E.S. Controlling harmful cyanobacterial blooms in a world experiencing anthropogenic and climatic-induced change. Sci. Total Environ. 2011, 409, 1739–1745. [Google Scholar] [CrossRef]
  49. Hutchinson, G.E. Concluding remarks—Cold spring harbor symposia on quantitative biology. Reprinted in 1991: Classics in theoretical biology. Bull. Math. Biol. 1957, 53, 193–213. [Google Scholar] [CrossRef]
  50. Leibold, M.A. The Niche Concept Revisited: Mechanistic Models and Community Context. Ecology 1995, 76, 1371–1382. [Google Scholar] [CrossRef]
  51. Chesson, P. Mechanisms of Maintenance of Species Diversity. Annu. Rev. Ecol. Syst. 2000, 31, 343–366. [Google Scholar] [CrossRef]
  52. Mohanty, R.K.; Seyed, M.; Majedi, M.; Shruti, P.; Shu Harn, T.; Chek Yin, B.; Karina Yew-Hoong, G.; Sanjay, S. Effects of Light and Temperature on the Metabolic Profiling of Two Habitat-Dependent Bloom-Forming Cyanobacteria. Metabolites 2022, 12, 406. [Google Scholar] [CrossRef] [PubMed]
Figure 1. Geographical location and distribution of sampling points.
Water 16 00459 g001
Figure 2. Geological profile and hydrological characteristics of the study area.
Water 16 00459 g002
Figure 3. Piper diagram of groundwater in the Yimuquan area.
Water 16 00459 g003
Figure 4. Chao1 exponential sparse curve.
Water 16 00459 g004
Figure 5. Shannon exponential sparse curve.
Water 16 00459 g005
Figure 6. Box chart of Alpha index of groundwater microbial community. Note: p-values reflect the likelihood of the observed differences occurring by chance.
Water 16 00459 g006
Figure 7. The phylum and genus composition of the groundwater microbial community.
Water 16 00459 g007
Figure 8. Principal coordinate analysis of samples in the Yimuquan area.
Water 16 00459 g008
Figure 9. Heat map of samples on the phylum level.
Water 16 00459 g009
Figure 10. Assessment of bacterial phyla contributions through Random Forest analysis.
Water 16 00459 g010
Figure 11. Heat map of correlation between environmental factors and alpha index.
Water 16 00459 g011
Figure 12. Redundancy Analysis (RDA) of the relationships between hydrological characteristics and bacterial phyla.
Water 16 00459 g012
Figure 13. Redundancy Analysis (RDA) of the relationships between hydrochemical characteristics and bacterial phyla.
Water 16 00459 g013
Table 1. Hydrochemical characteristics and major ion contents of groundwater in the Yimuquan area.
pHEc
(μs/cm)
ORP
(mv)
DO
(mg/L)
TDS
(mg/L)
K+
(mg/L)
Na+
(mg/L)
Ca2+
(mg/L)
Mg2+
(mg/L)
Cl
(mg/L)
SO42−
(mg/L)
HCO3
(mg/L)
NO3
(mg/L)
NO2
(mg/L)
F
(mg/L)
H2SiO3
(mg/L)
Karst Water
(n = 5)
Avg7.72863.8132.368.976405.231.6221.3387.8645.1346.9946.21316.3068.160.010.1713.63
Max7.831032163.89.9487.213.4435.75106.9254.7974.8771.07344.68109.750.040.3015.56
Min7.4955096.27.46277.030.848.5864.1028.4011.738.96300.238.640.000.1112.35
Porous Water
(n = 4)
Avg7.70812.75166.16.92413.691.2217.2493.6443.7570.6718.36362.1926.420.010.1718.29
Max7.881129190.39.09572.471.5629.26135.7556.96139.4022.59418.9841.040.020.2523.96
Min7.44581128.85.18275.330.869.9556.3632.6812.6611.93310.5810.650.000.1414.85
Note: ORP: Oxidation–Reduction Potential; DO: dissolved oxygen; TDS: total dissolved solids.
Table 2. Changes in phylum niche in karst water and porous water.
PhylumKarst WaterPorous Water
Levins NicheTypes of Commonly Used ResourcesLevins NicheTypes of Commonly Used Resources
Omnitrophicaeota11.1427S5 = 11.32%, S6 = 10.62%8.6607S4 = 11.65%, S8 = 13.92%, S9 = 17.23%
Thaumarchaeota4.1453S1 = 34.59%, S3 = 17.67%, S5 = 25.14%6.0497S9 = 32.35%
Euryarchaeota3.3207S3 = 26.77%, S4 = 34.46%, S5 = 32.99%9.355S4 = 11.69%, S6 = 12.36%,S8 = 12.34%
Latescibacteria5.1979S2 = 32.32%, S4 = 18.00%, S8 = 14.49%3.1762S3 = 21.15%, S10 = 50.18%
Disclaimer/Publisher’s Note: The statements, opinions and data contained in all publications are solely those of the individual author(s) and contributor(s) and not of MDPI and/or the editor(s). MDPI and/or the editor(s) disclaim responsibility for any injury to people or property resulting from any ideas, methods, instructions or products referred to in the content.

