Article

A Field Study to Investigate the Hydrological Characteristics of Newly Established Biochar-Amended Green Roofs

1
Institute for Sustainable Industries & Liveable Cities, Victoria University, P.O. Box 14428, Melbourne, VIC 8001, Australia
2
College of Sport, Health and Engineering, Victoria University, P.O. Box 14428, Melbourne, VIC 8001, Australia
*
Author to whom correspondence should be addressed.
Water 2024, 16(3), 482; https://doi.org/10.3390/w16030482
Submission received: 11 January 2024 / Revised: 25 January 2024 / Accepted: 30 January 2024 / Published: 1 February 2024

Abstract

:
Green roofs (GRs) have been researched for decades, yet their implementation remains constrained due to several reasons, including their limited appeal to policymakers and the public. Biochar, a carbon-rich material, has been recently introduced as an amendment to GR substrate to enhance the performance of GRs through reduced runoff volume, improved runoff quality, and increased soil fertility. This paper aims to investigate the impact of biochar amendment on the hydrological performance of newly established GRs. Six 1 m × 1 m GR test beds were constructed, comprising of five biochar-amended GR test beds, and one conventional test bed (without any biochar in its substrate). The water retention capacity and runoff outflow delay of the six test beds were studied with the application of artificial rainfall using a nozzle-based simulator. Biochar was found to increase the water retention capacity and effectively delay runoff outflow in the biochar-amended GRs. After nine artificial rainfall events of 110.7 mm rainfall in total, 39.7 to 58.9 L of runoff was retained by the biochar-amended GRs as compared to 37.9 L of runoff retained by the conventional GR. Additionally, the test bed without biochar quickly started releasing runoff after 300 to 750 s, whereas test beds with fine biochar particles could delay runoff outflow by 700 to 1100 s. The performance of the non-biochar and biochar-amended test beds varies according to the values of biochar-related variables such as biochar particle sizes, amendment rates, and application methods. The observational data illustrated that the GR test bed with medium biochar particles applied to the bottom layer of the GR substrate was the optimal biochar-GR design. This selection was determined by the combined performance of high retention rates, long runoff outflow delays, and few other factors, such as lesser loss of biochar caused by wind and/or water.

1. Introduction

Green roofs (GRs) are commonly known to be one of the most effective green infrastructures (GI) strategies to counter the impacts of multiple global concerns like climate change and rapid urbanization [1,2]. A typical GR system consists of the following layers from top to bottom: vegetation, substrate, filter layer, and drainage [3]. There are three main types of GR: extensive GR (EGR), semi-intensive GR (SIGR), and intensive GR (IGR) [4]. EGR has a substrate thickness of less than 15 cm, which is favorable for drought-tolerant plants. EGR has a huge potential to be implemented thoroughly due to its affordability, easy installation on existing buildings without structural reinforcement, low investment costs, and moderate maintenance [5,6]. Oppositely, IGR outperforms EGR in terms of ecosystem services due to a thicker substrate. However, there are several obstacles preventing the application of IGR. They are issues relating to extreme load-bearing capacity, high initial costs, and intensive maintenance [7]. The SIGR having a medium substrate depth takes advantage of both the EGR and IGR. SIGR is appropriate for the survival of medium-root plants and lawns, and does not require comprehensive maintenance [8]. The recognition of GRs has been increasing in the last two decades due to a considerable number of global efforts [9]. An imbalanced research focus with regards to GR benefits has been reported in the literature with the greatest attention towards runoff and temperature reductions [10,11,12]. GR studies have been mostly conducted in the USA and many European countries, which result in the insufficient awareness of GR potential in other countries. Given that the performance of GRs significantly varies according to local climate and availability of material, research needs to be improved in terms of both quantity and quality at a local level [12]. An insufficient number of studies at a local scale limit the widespread implementation of GRs because of inadequate information available for investors and policymakers.
GRs provide numerous eco-system services comprising runoff retention, runoff quality improvement, enhanced thermal comfort, noise reduction, air purification, and economical and environmental benefits [13]. Among them, runoff retention has been studied the most [10]. Rainwater is absorbed by the substrate layer and then is either consumed by the plants or is lost to the atmosphere through evapotranspiration. Excess water from intense rainfall events is either stored in the drainage layer of the GR or flows into the roof’s drainage system. This mechanism helps to reduce the stress on the stormwater infrastructure by attenuating runoff volume and peak flow. This ability of GRs to retain rainwater (which in turn leads to delayed runoff outflow) has been examined in numerous studies. For example, Palermo et al. [14] studied the hydrological responses of a full-scale EGR. They found that 68% (fluctuating from 16.7 to 100%) of rainwater was retained by the GR in a single rainfall event. The average peak-flow reduction per event was 56% ranging from 13.3 to 95.2%. A similar finding was obtained for a full-scale EGR in the study by Cipolla et al. [15], which had an average retention rate of 51.9% ranging from 6.4 to 100% on an event-by-event basis. Similar studies can also be found in [16,17,18,19,20,21,22]. In addition, GRs have been significantly researched in test beds. The hydrological performance of pilot-scale GRs is comparable to that of full-scale GRs. An excellent example is the study by Stovin et al. [23], wherein the authors studied a 3 m2 EGR test bed. The average rainfall retention and the peak-flow reduction were 70% and 60%, respectively. The 1 m2 EGR test bed of Zhang et al. [24] achieved a higher retention rate of 77.2%, which fluctuated from 35.5 to 100%. GR test beds are a convenient choice for researchers to easily collect observational data and study the impacts of different parameters on the performance of GRs. Some relevant studies are [6,25,26,27,28,29]. However, a wide range of runoff retention/reduction rates have been reported and some parameters affecting GRs remain controversial [10]. This inconsistency could be due to the variation in hydraulic characteristics caused by different GR materials, study areas, monitoring period, climate conditions, and data analysis methods [14,30]. For instance, an agreement on the impact of antecedent dry weather period (ADWP) on water retention in GRs has not yet been reached [22,24,25,26,31]. Zhang, Szota, Fletcher, Williams and Farrell [25] highlighted the importance of substrates when compared to evapotranspiration (ET); whereas the studies by Johannessen, Muthanna and Braskerud [28] and Kaiser et al. [32] stated that ET had a greater impact when compared to that by other parameters. Furthermore, some studies reported rainfall events that produced zero runoff, leading to exceptional average retention rates [14]. Certain studies reported that more than 90% of the rainwater was retained by the GR, attributed to a significant occurrence of small rainfall depths throughout the study period [25,33,34,35]. Conversely, Wong and Jim [19] reported a low retention capacity due to numerous intense rainfall events, reaching a maximum depth of 344.8 mm.
Several researchers have shown interest in innovative technologies to improve the ecosystem services provided by GRs. The integration of GRs with other systems was found to be effective in various studies. For instance, La Roche et al. [36] successfully enhanced the cooling performance of GRs by combining GRs with a radiant/evaporative cooling systems. The surface temperature of a hybrid photovoltaic GR (PV GR) was observed to be 5 °C cooler than that of a stand-alone GR in [37]. Furthermore, a 4.3% enhancement in the electricity production of the PV panels was also observed. Similar findings were found in other studies [38,39,40]. Green-blue roofs and green wall-integrated GRs are other well-documented systems. Biochar, a carbon-rich material, is manufactured by burning biomass, such as woody materials, crop residues, or municipal solid wastes, in an oxygen-deficient environment [41,42,43]. Biochar has been recently introduced to GRs and other fields of application (for e.g., agriculture). The benefits of biochar have a strong connection to its highly-porous structure [44]. Biochar is able to retain more water and nutrients, improve soil fertility and plant health, and allow for the diversity of microbial community [45].
Despite biochar having a huge potential in enhancing GRs, the hydrological performance of biochar-amended GRs has been insufficiently understood due to limited research and a consequent lack of information. Consequently, the study presented in this paper aims to investigate the effectiveness of biochar in improving runoff retention and the delaying of runoff in GRs. Runoff retention refers to the ability of GRs to retain or capture rainfall and prevent it from immediately flowing as runoff. The higher the retention rate is, the lower the runoff volume is. Runoff outflow delay refers to the phenomena where rainfall is delayed from immediately contributing to runoff after a rainfall event. A biochar-amended GR system with high-runoff retention and long runoff outflow delay can have various benefits, including reducing stormwater runoff, improving water quality, and providing additional moisture for vegetation. Additionally, this research also aims to study the influence of different biochar-related variables (including application methods, amendment rates, and biochar particle sizes) on the hydrological performance of GRs. To achieve these objectives, six 1 m2 GR test beds with varying characteristics were established. Data on the volume of runoff and runoff outflow delay for each test bed were collected during several artificial rainfall events. A pressurized nozzle-based rainfall simulation system was employed to generate an artificial rainfall. Acknowledging the distinctions between artificial and natural rainfall events [46], this study attempted to replicate the characteristics of a natural rainfall as closely as possible. Further details about the rainfall simulation system are provided in Section 2.2. It is worth mentioning that the influence of plant characteristics on the hydrological performance of GRs requires a comprehensive analysis, which is beyond the scope of the current study. However, the plant conditions were consistent across each test bed throughout the monitoring period, thereby limiting the influence of plants on the results.
This paper is structured as follows. Section 2 presents the methods and materials used in this study, which includes details about the experimental site, information regarding setting up of the GR test beds, selection of biochar types, design of the rainfall simulation system, and data collection methods. This is followed by the results presented in Section 3. A detailed discussion on the results is provided in Section 4, and finally the conclusions drawn from this study are presented in Section 5.

2. Method and Materials

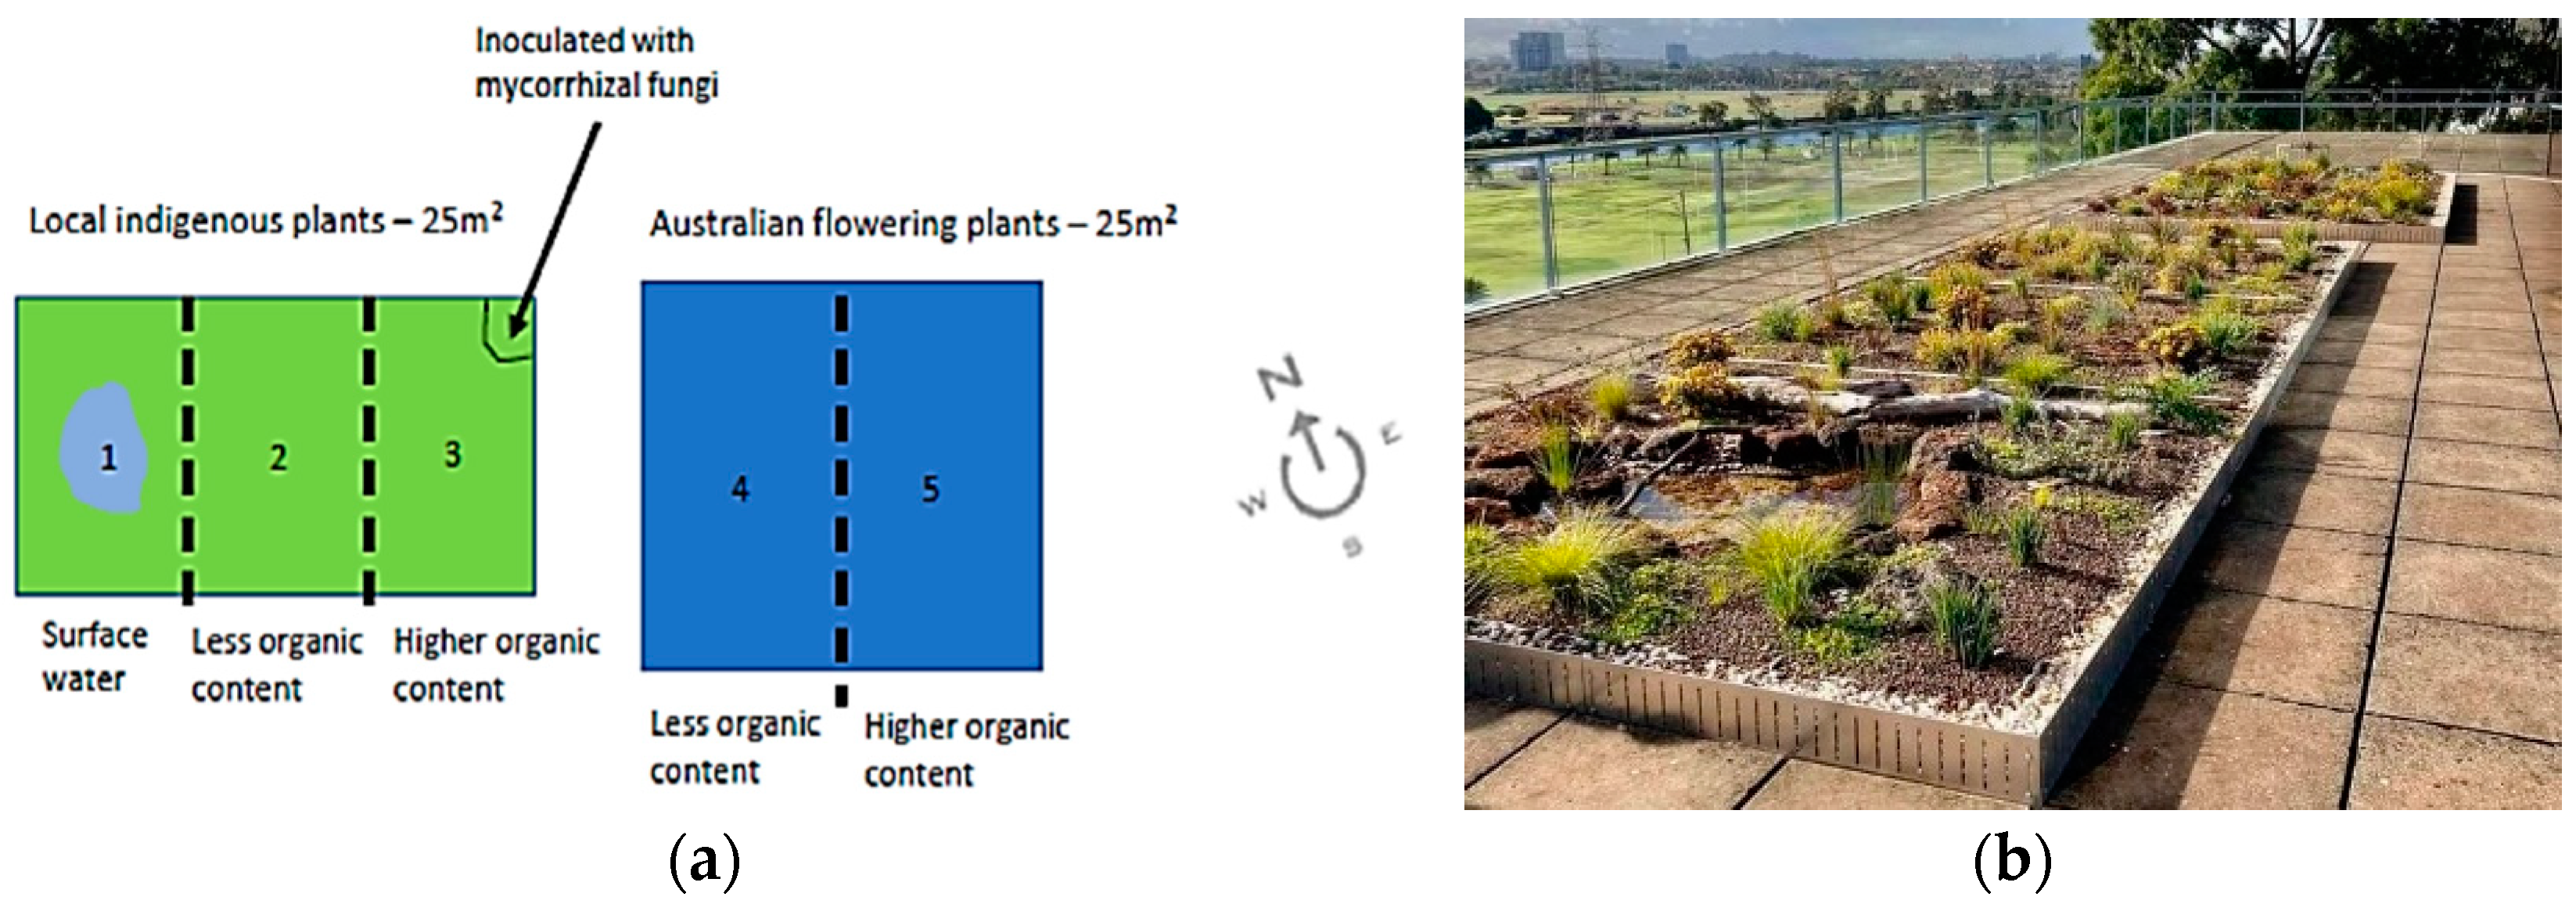
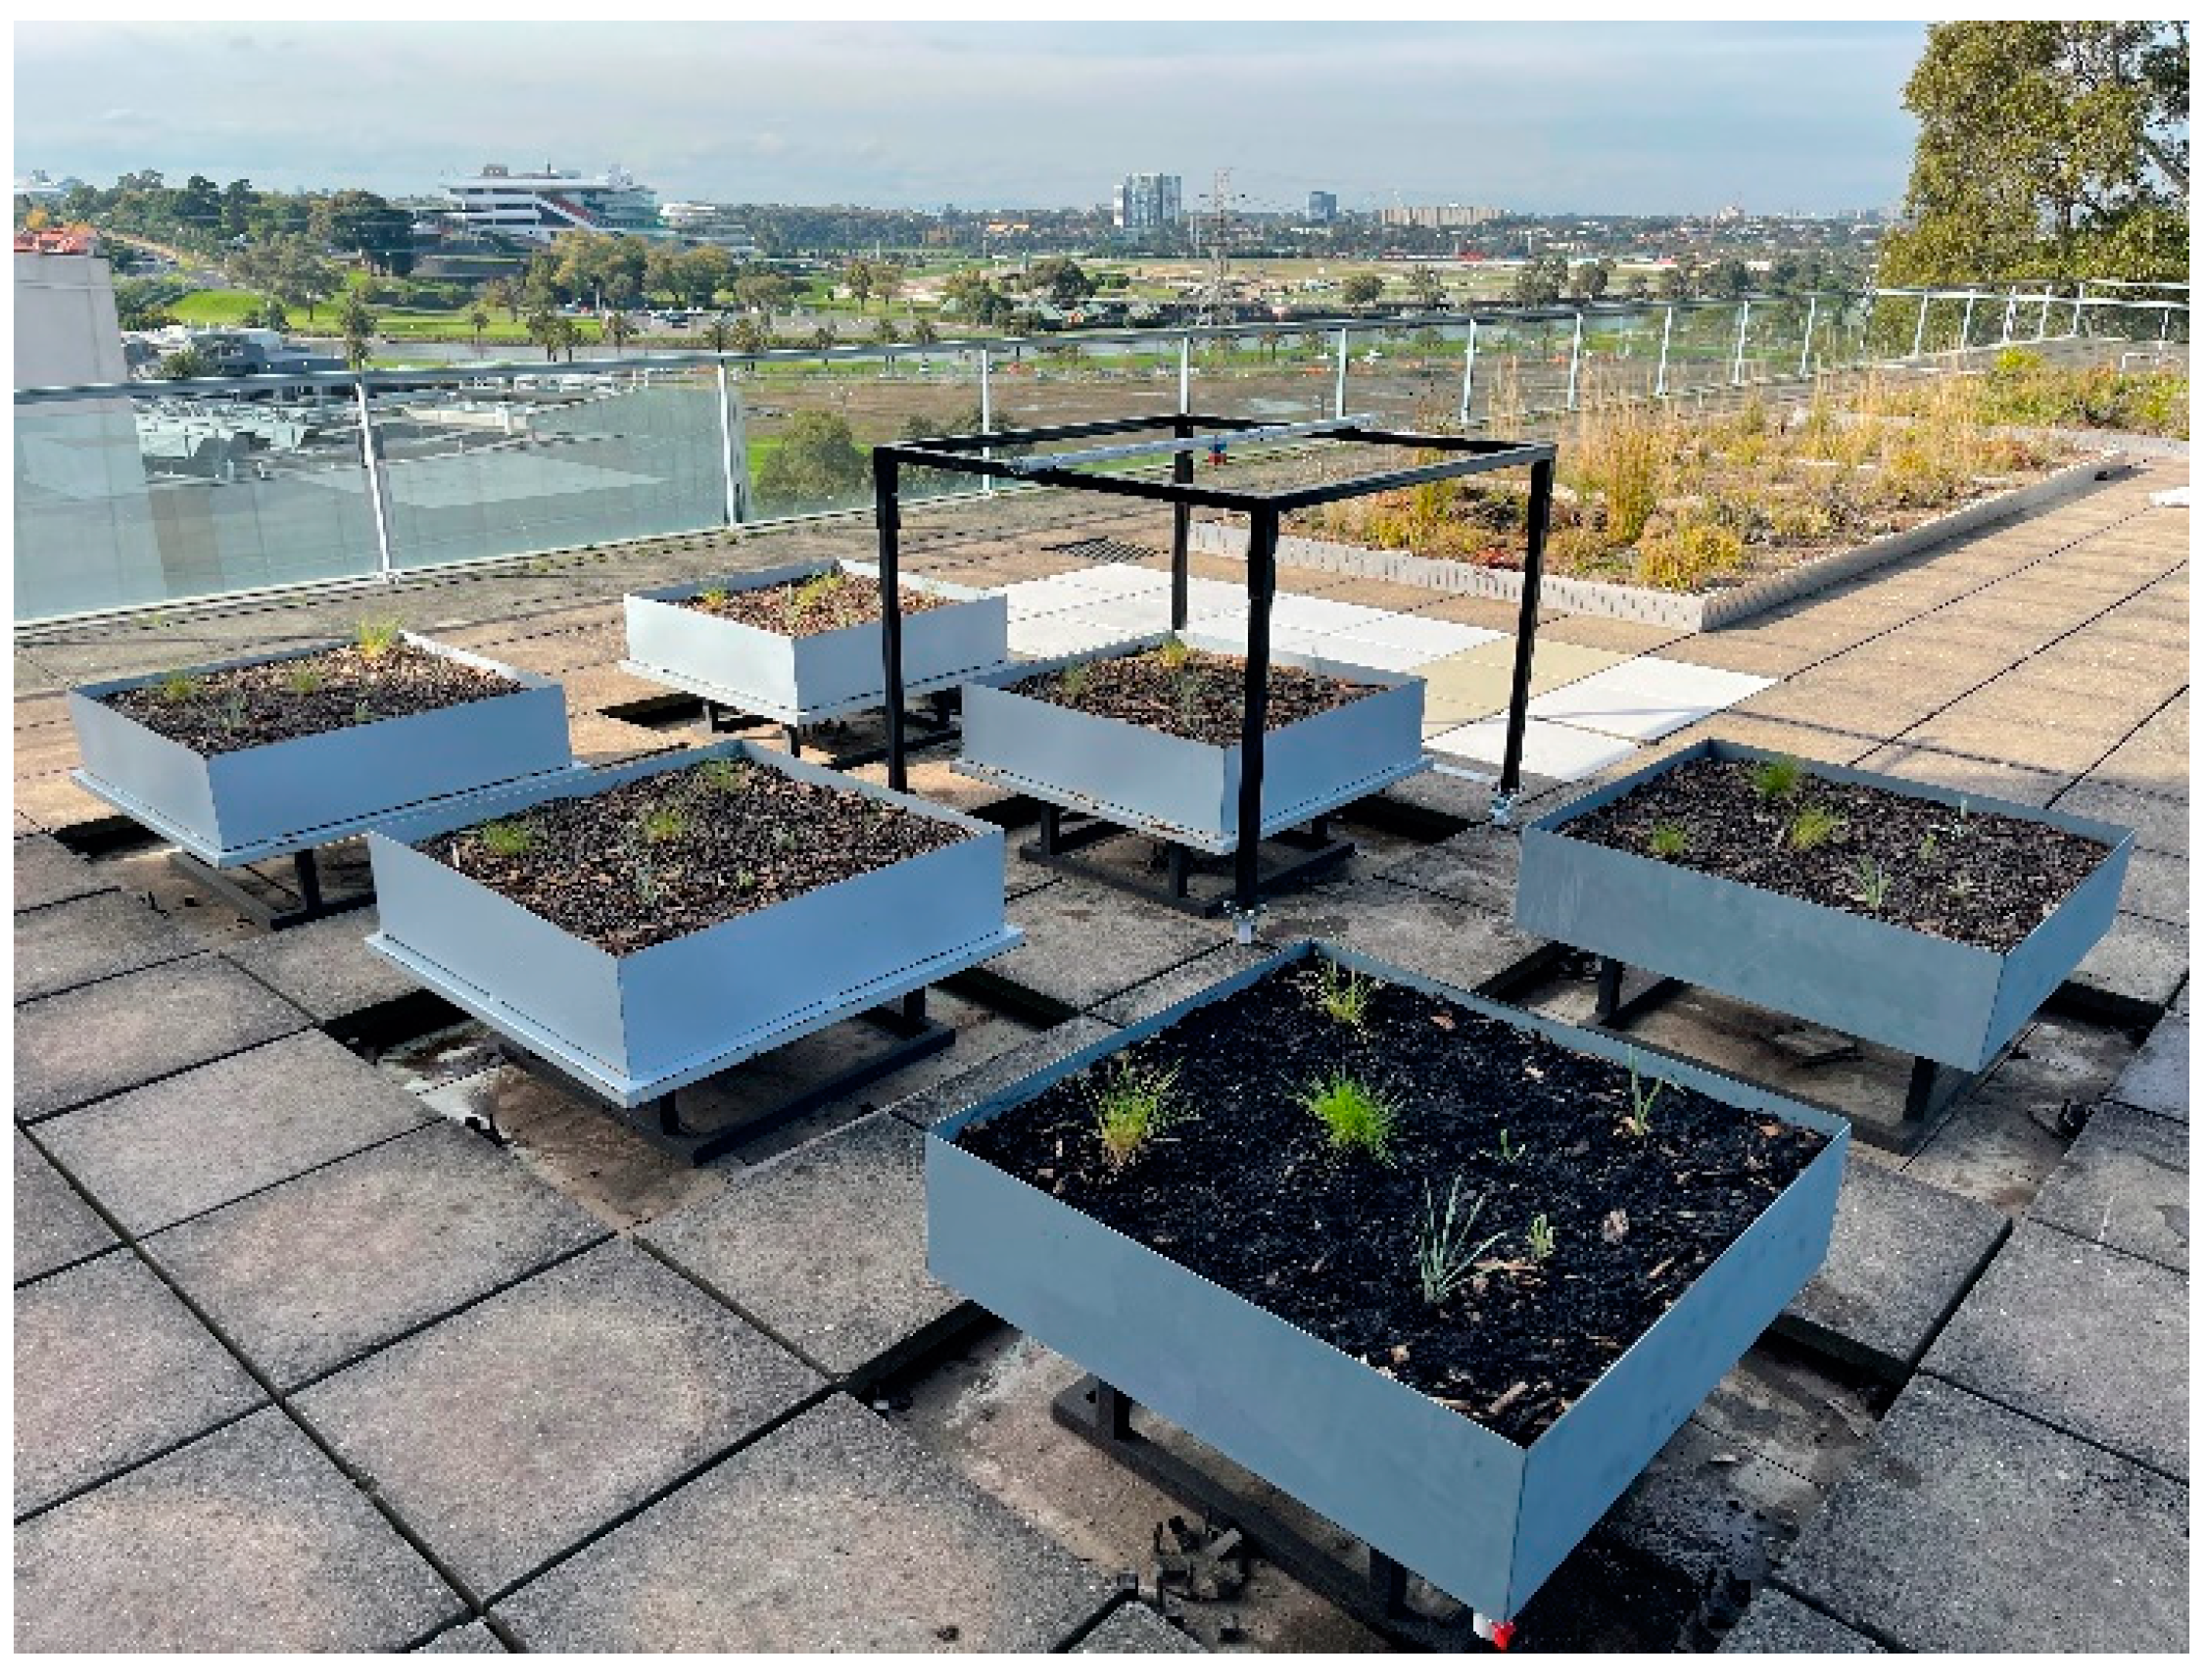
2.1. Site Description

The experiments undertaken in this study were conducted on the roof of Building M at the Footscray Park campus of Victoria University (VU), Victoria, Australia. The study area is influenced by the temperate oceanic climate (Köppen climate classification Cfb) with warm summers and mild winters. The average amount of precipitation received annually is roughly 650 mm. A 50 m2 GR divided into 5 different growing spaces (Figure 1) was initially constructed. It was observed that the existing roof conditions of the building were not favorable for the acquisition of runoff-related experimental data. Hence, six 1 m2 GR test beds were subsequently constructed (Figure 2). Galvanized steel trays measuring 1 m × 1 m were used, which were elevated to a height of 0.3 m above the roof tiles using a metal frame.
The substrate of the six GR test beds was based on the initial 50 m2 GR. The 150 mm substrate consisted of a mix of light expanded clay aggregate (LECA), hardwood mulch, and coir chips with a volumetric percentage ratio of 80:15:5, respectively. These test beds have a filter layer (non-woven geo-textile membrane) and a drainage layer (20-mm Atlantis Flo-cell and 30-mm Versidrain trays). The materials chosen in this study were not only to provide a high water retention capacity but also to avoid adding a lot of weight to the structure below. LECA is a light-weight material with a large water absorption capacity (18% by weight). Atlantis Flo-cell is a lightweight and effective drainage solution that has considerable water storage. The mini reservoirs of Versidrain that were placed on top of the Atlantis Flo-cell can store 11 L of water per square meter.
In addition to the unmodified test bed (GR-0), there are five other test beds that were amended by the biochar in different ways. An amendment rate of 7.5% v/v 1–3 mm biochar particles (hereafter referred to as medium biochar) evenly mixed with other substrate components was applied in GR-7.5M-M. In GR-7.5B-M, 7.5% v/v medium biochar particles were applied at the bottom layer of the substrate. GR-15M-M used the mixing of biochar at an amendment rate of 15% v/v medium biochar. Less than 1 mm particle biochar (hereafter called fine biochar) was applied in GR-7.5M-F and GR-7.5T-F by using mixed and top-dressing biochar application methods, respectively. The characteristics of all GR test beds are summarized in Table 1.
Two common wallaby grasses (Rytidosperma caespitosum), two common everlasting wildflowers (Chrysocephalum apiculatum), and two Billy Buttons wildflowers (Pycnosorus globosus) were pre-grown at a nursery and moved to each test bed on 5 May 2023. Additionally, one Lomandra longifolia Tanika and one Lomandra Lime Tuff were added per test bed on 1 July 2023, to increase the plant coverage area prior to the experiments. The quantity and size of each type of plant were consistent across the test beds at the time they were planted. The experiments were conducted once the plants had successfully adapted to the new growing environment of the LECA-based substrate after about two months.

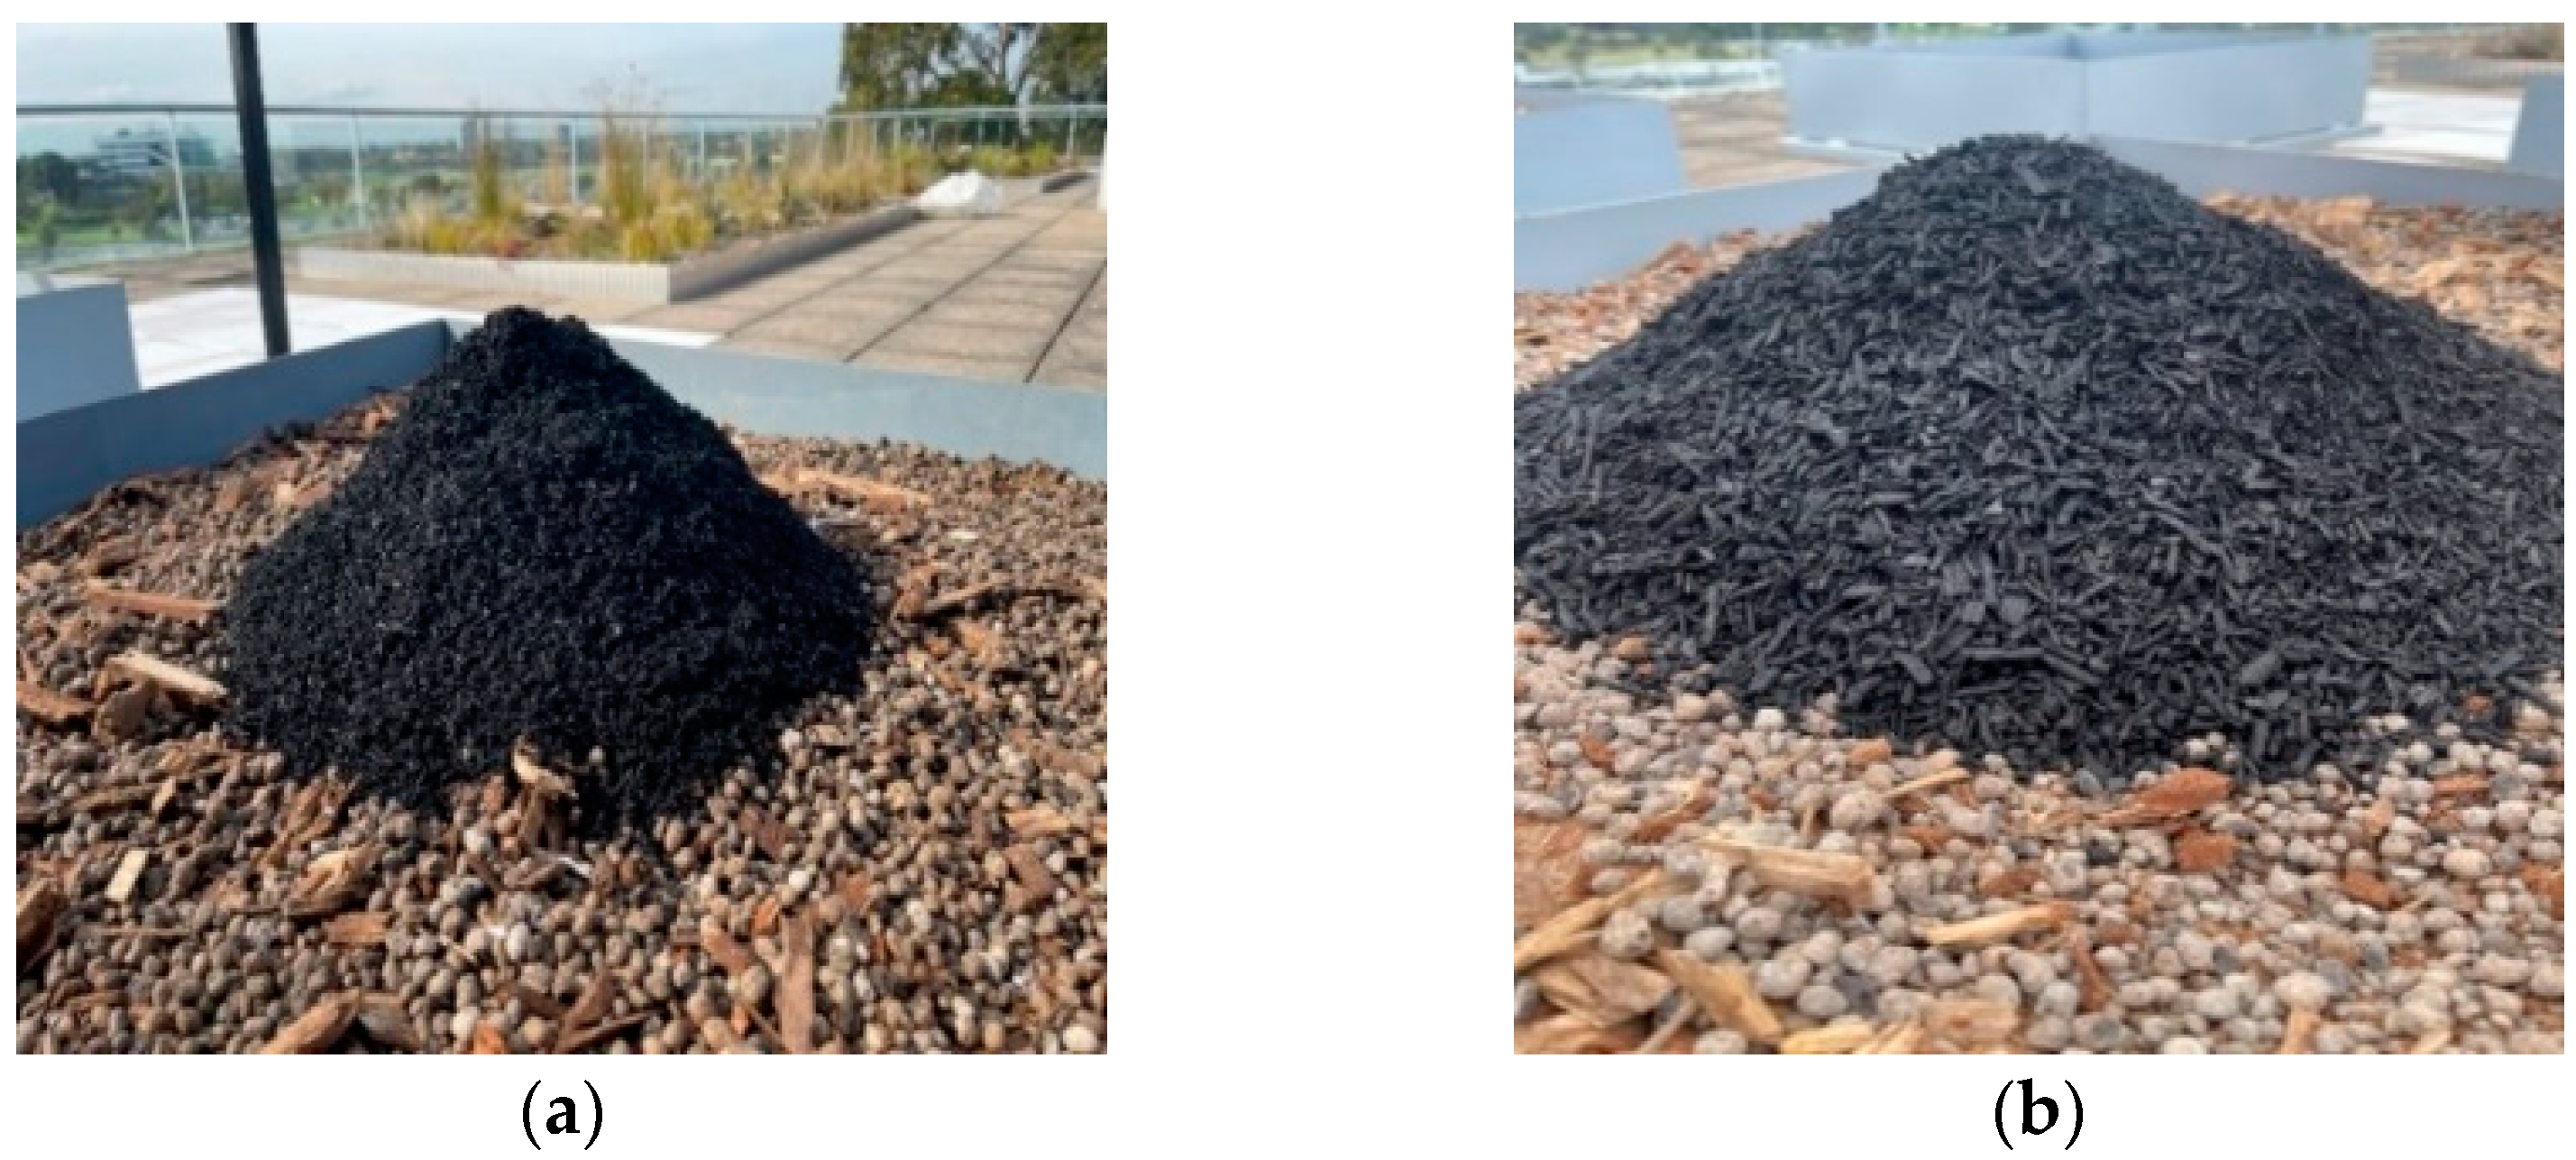
2.2. Biochar Selection

Biochar was procured from the supplier, Green Man Char, in Melbourne. The feedstock used for manufacturing biochar was woody materials, particularly from eucalyptus with the pyrolysis target temperature of 500–550 °C. According to the literature, 7.5% v/v is a reasonable amendment rate of biochar considering plant survival, water retention, and affordability. For example, Li et al. [47] recommended a 5–7% biochar dose to avoid plant mortality and obtain a good water retention capacity. Beck et al. [48] applied a 7% biochar dose to deal with the limited availability of biochar. Wang et al. [49] found that the amendment rate of 5% biochar was optimal for GR substrates since it positively impacted plant growth, whereas 15% biochar acted as a root-barrier layer that prevented root expansion. However, the effects of biochar amendment rates on water retention have been a subject of controversy in previous studies [50,51,52,53,54,55]. Therefore, one test bed with a 15% biochar dose was investigated in this research to discover the advantages and disadvantages of increasing the amount of biochar.
Regarding particle sizes of biochar, small particles were found to overperform the large particles in terms of water retention due to higher porosity and specific surface area [56]. Nevertheless, very fine biochar reduced the infiltration rate and caused substrate waterlogging, which led to flooding on the surface of the GR. Fast drainage is an important hydraulic characteristic of GRs, especially during the wet seasons [57,58]. In addition, small particles are less resistant to water and wind erosion when compared with large particles [59]. Hence, granulated biochar with a medium particle size (2–2.8 mm) was recommended by Liao et al. [60]. Moreover, small biochar particles were also recommended to be amended to medium to coarse textured substrates [56,58,61]. As a result, this research excluded large biochar particles and focused on studying fine to medium sized ones. Fine (up to 1 mm) and medium (1–3 mm) biochar particles (Figure 3) procured from Green Man Char were used in this study.
With regard to the application methods of biochar, mixing, top layer, and middle layer are three popular treatments in numerous studies [51,54,56,62,63,64,65,66,67]. While mixing and middle-layer methods imply high labor costs, the top-layer biochar application method is exposed to strong winds and other severe weather conditions causing biochar loss over time, especially fine biochar particles [65]. Furthermore, the effectiveness of biochar is affected by the application method. For instance, bottom-layer biochar had a better performance than the top-layer biochar in terms of both runoff quantity and quality in the study of Kuoppamäki, Hagner, Lehvävirta and Setälä [67]. Therefore, for this research, it was decided to compare the mixing and bottom-layer methods. Additionally, one test bed applied fine biochar particles through top-dressing with water. The biochar manufacturer suggested using this treatment to enhance the functions of well-established GRs or to restore failed GRs. This could be attributed to the fact that small biochar particles can work their way into the GR substrates faster than larger particles do. Together with the vegetation, the top-dressing biochar test bed was left for two months before the experiments were conducted. The irrigation helped fine biochar particles to penetrate the substrate gradually. A proper comparison, thus, could be made between top-dressing and mixing methods.

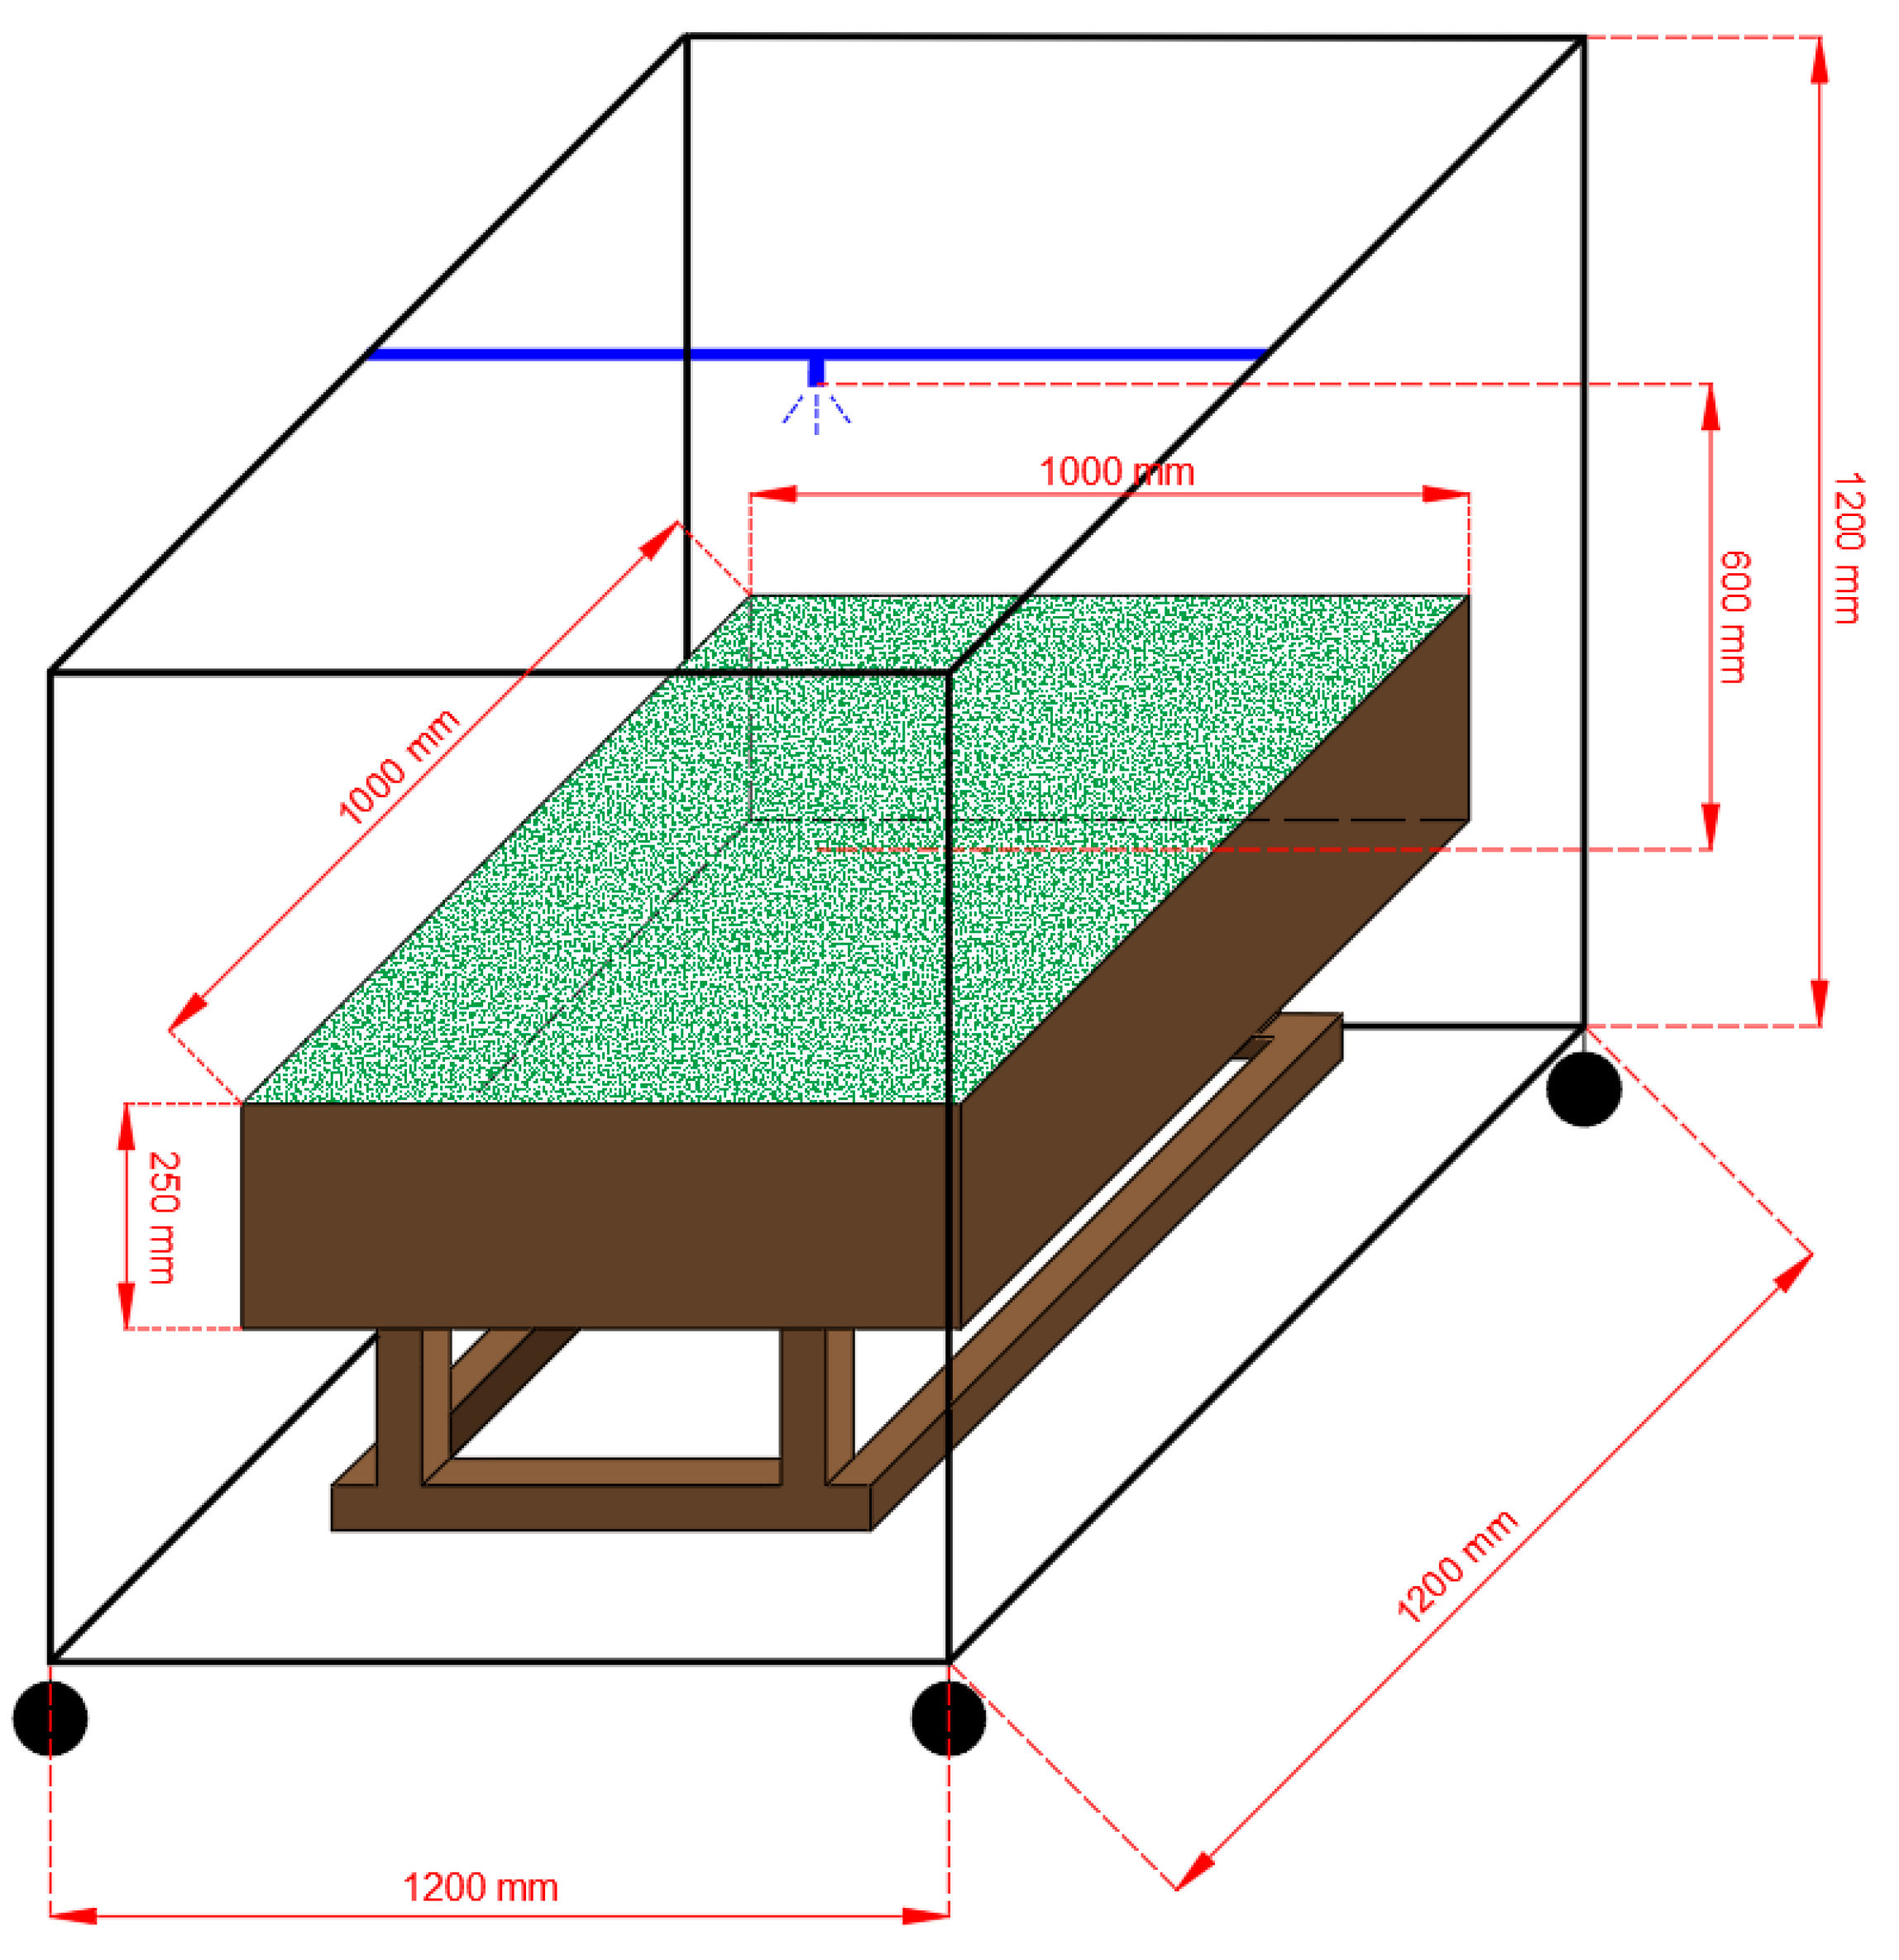
2.3. Rainfall Simulation

To precisely control the experimental inputs, a rainfall simulation system was constructed. It was a pressurized system including a spray nozzle attached to a PVC pipe that was connected to a water tap. Dunkerley [46] had undertaken a comprehensive review of the validation of rainfall simulation for the runoff-related research. He explicitly highlighted the significant differences between artificial and natural rainfall. Artificial rainfall is continuous with constant and extreme intensity, whereas intensities of natural rainfall highly fluctuate with interruptions. The conventional (unpressurized) rainfall simulator depends on gravity to create water droplets, which requires a fall height of nearly 9.1 m to reach the terminal velocity of natural raindrops [68]. In contrast, the pressurized simulator uses pressure from the water mains to form droplets, which does not rely on gravity, and provides a wide range of droplet sizes [69]. Therefore, properly simulating rainfall with an unpressurized simulator is challenging as compared to a pressurized simulator [70]. Considering all factors, this study opted for a nozzle-based rainfall simulation system to assess the hydrological behaviors of the GR test beds.
The selected spray nozzle was the MPL 0.21M-B manufactured by Spray Nozzle Engineering, Melbourne. This nozzle has a full-cone spray pattern and provides large droplets, a spray angle of 77°, and a flow rate of 0.82 L/minute at a 3-bar pressure. When it is installed 600 mm above the target surface, it can have a spray coverage of roughly 1000 mm, which was appropriate for the 1 m2 test beds utilized in this study. Figure 4 provides an illustration of the nozzle-based rainfall simulator above a GR test bed.

2.4. Data Collection and Analysis

A drainage hole was placed at the bottom corner of every test bed. A plastic container positioned under the drainage hole records the runoff volume drained from the test beds. The runoff collection is continued until there is no runoff production for at least five minutes. Small rainfall events, especially those less than 5 mm in depth and hardly producing any runoff, have been observed in plenty of studies [14,24,25,33,34]. Therefore, this study focused on investigating medium, high, and extreme rainfall events. A total of nine artificial rainfall events per test bed were simulated. For a catchment area of 1 m2, the rainfall depth in millimeters (mm) is equal to the water volume in liters (L). The nozzle was attached to a PVC pipe that was connected to the water mains through a 5 m hose. Since the pressure of the tap water was identified as roughly 4.5 bar, a pressure reducer was employed to bring it down to 3 bar. Medium to extreme rainfall events were simulated by altering the simulation duration. Considering the intermittent characteristic of natural rainfall, gaps of 2 min were introduced after every 5 min of simulation. A similar method was applied in the study of Holko et al. [71]. Together with the simulation gaps, the selection of MPL 0.21M-B with a low flow rate was an attempt to generate more realistic rainfall intensities. Numerous papers were identified for unrealistically reproducing rainfall intensities exceeding those of extreme events [46,72].
To ensure an accurate comparison between the test beds, each experimental event was conducted on the same day. A soil moisture meter was also used to understand the impacts of soil moisture on rainfall retention before every event (hereafter called initial soil moisture). Soil moisture was measured at several locations of a test bed and at the same depth. The antecedent dry weather period (ADWP), which is another important parameter determining the water retention capacity, was also recorded. The first experiment was carried out on 31 July 2023, when the vegetation was three months old. Table 2 presents information about the characteristics of the nine simulated rainfall events. Medium, high, and extreme rainfall events were represented by simulation durations of 10, 15, and 20 min, respectively, with 2 min gaps every five minutes. With the exception of Medium A and Medium B events that were conducted on the same day to examine the response of GRs to two consecutive rainfall events, all other events were conducted on different days within the one month study period.
The amount of water retained by the GR test beds was calculated by subtracting the volume of runoff from the volume of rainfall. The runoff outflow delay, which was recorded in seconds, was the amount of time from the beginning of a simulation until a test bed started producing runoff. This parameter helps to understand the capability of GR in delaying runoff and reducing stress on the drainage system. The observational data were analyzed using line and bar graphs as well as box plots. By employing these statistical methods, the hydrological performance of all GR test beds was thoroughly assessed and compared. Moreover, the relationship between rainfall depth and retention rate was also described. The conclusions regarding the impacts of biochar on GRs and the optimal biochar-GR design were derived from high runoff retention rates and long runoff outflow delays. Furthermore, other factors such as low infiltration rates leading to substrate waterlogging and biochar loss were also considered.

3. Results

Table 3 presents data on various hydrological parameters, such as initial soil moisture, rainfall volume, runoff retention, and runoff outflow delay, for the six GR test beds during medium, high, and extreme rainfall events.

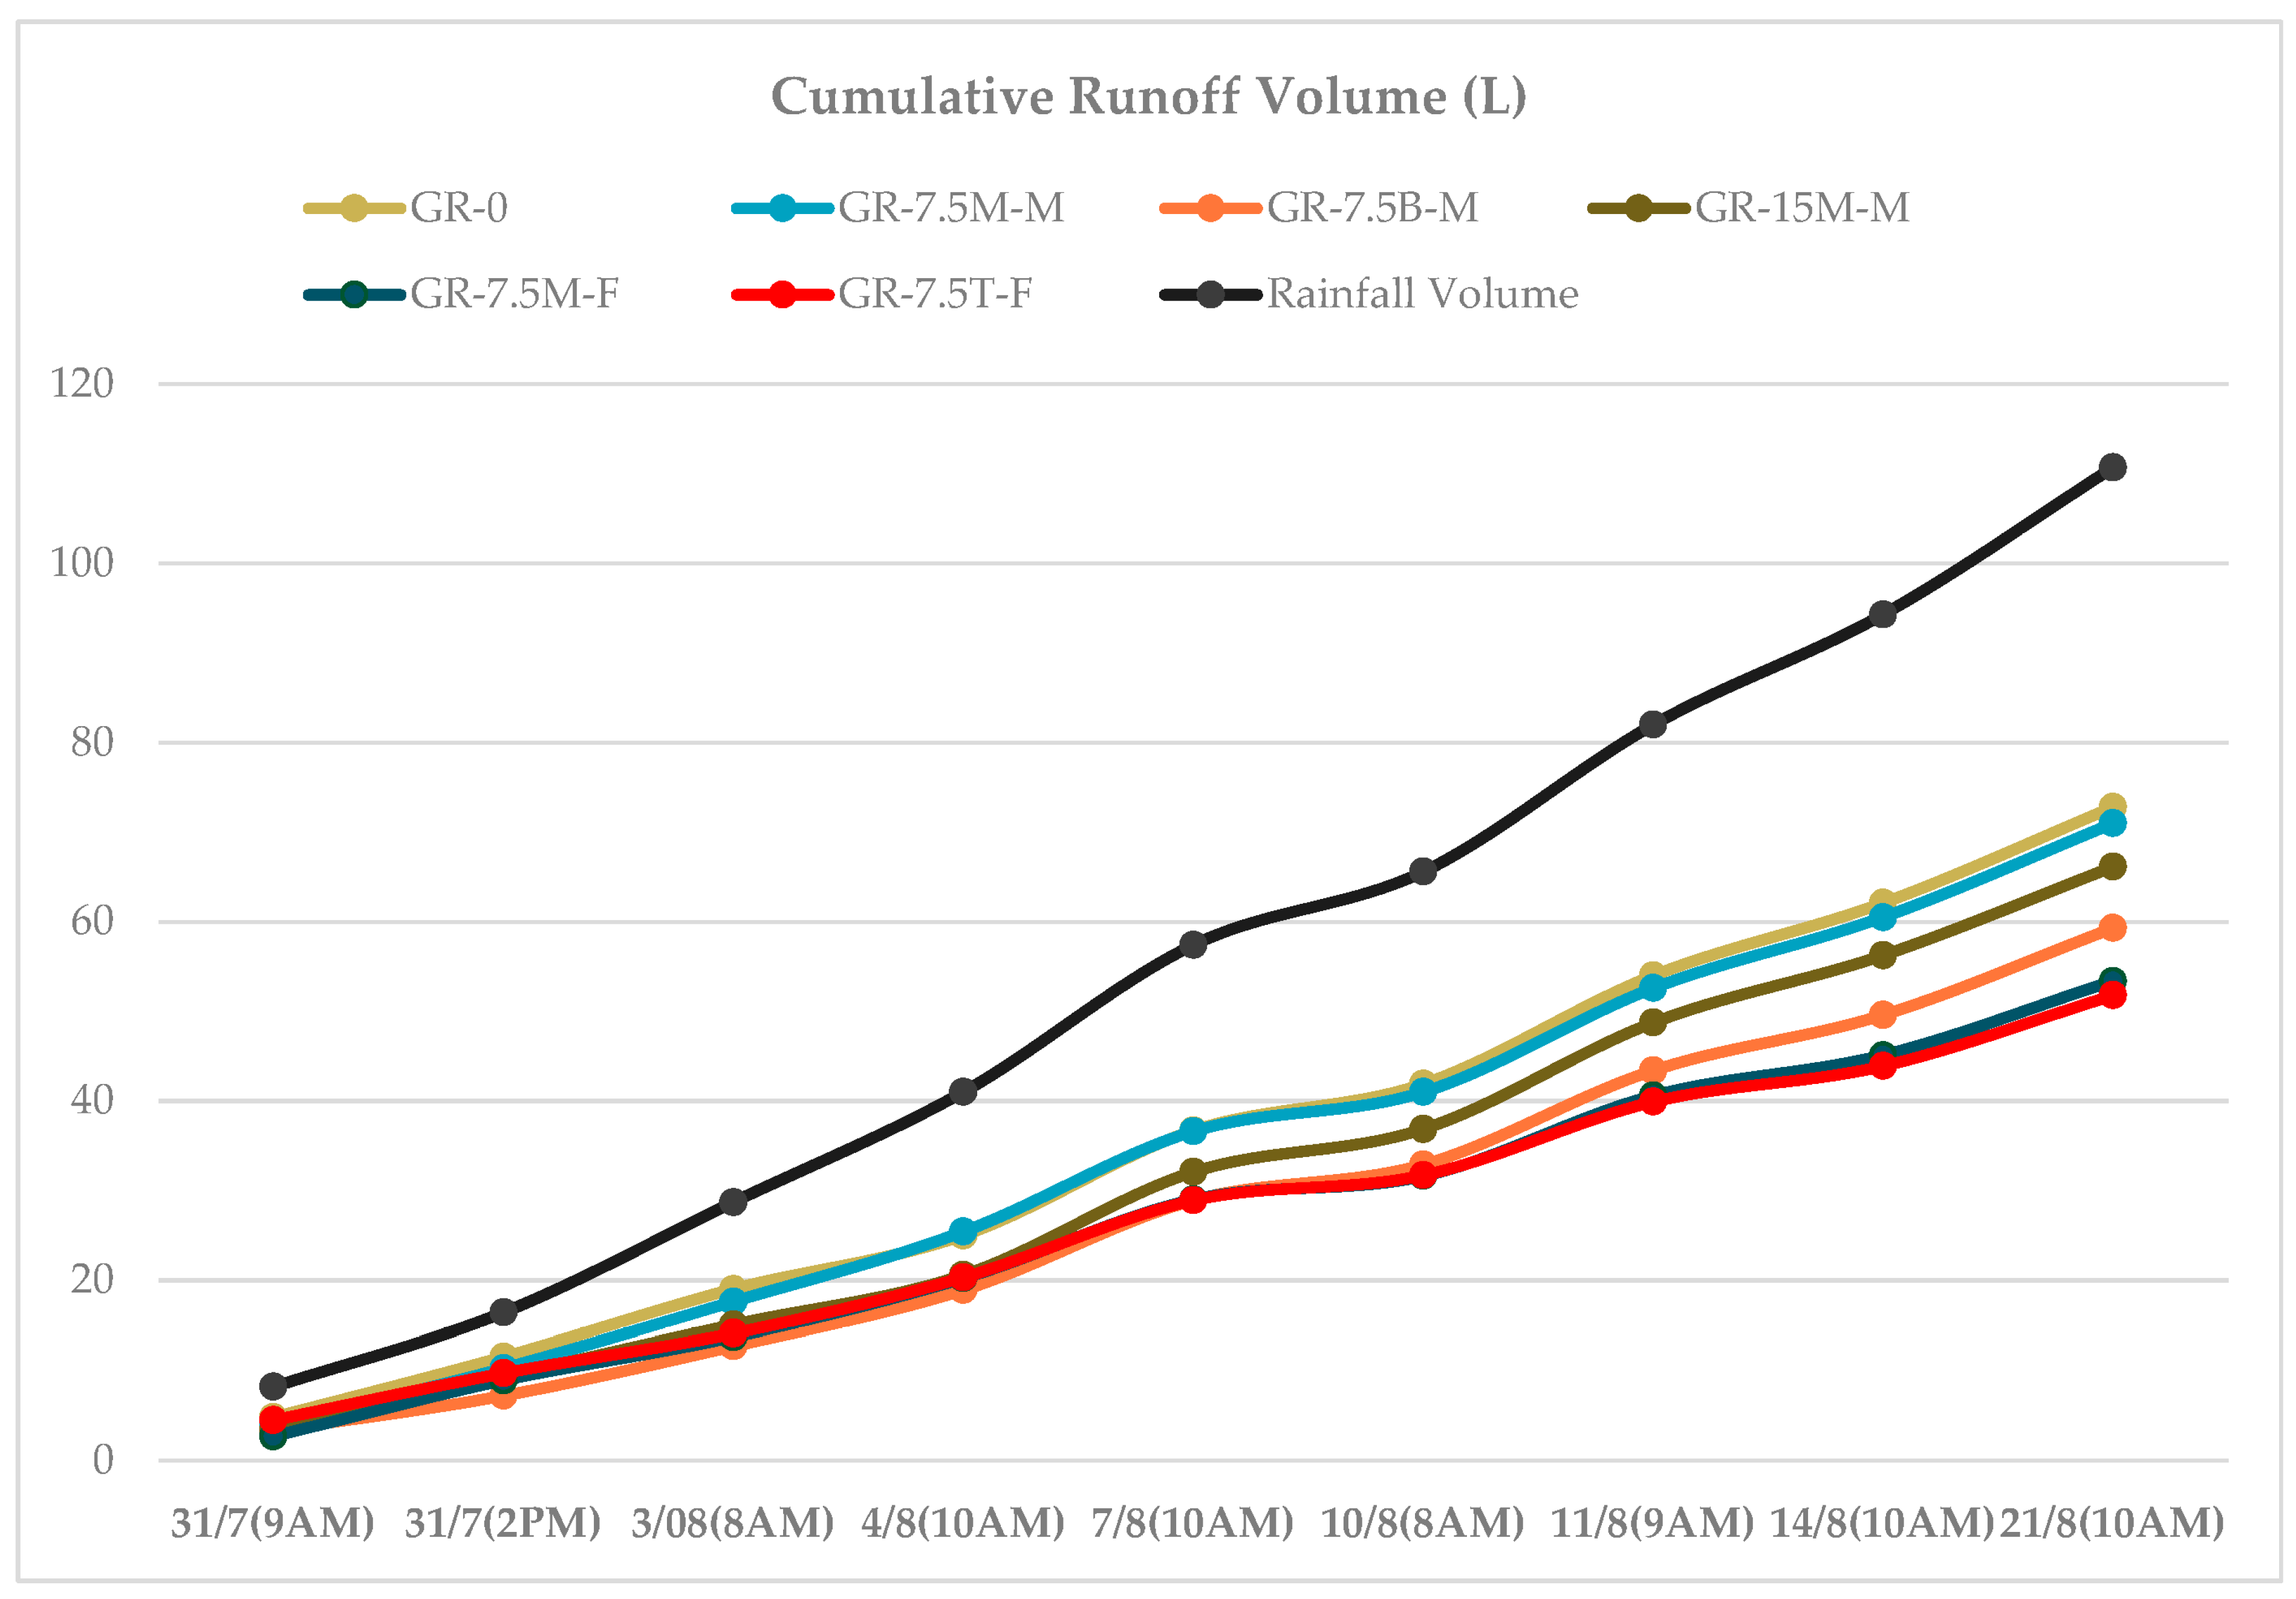
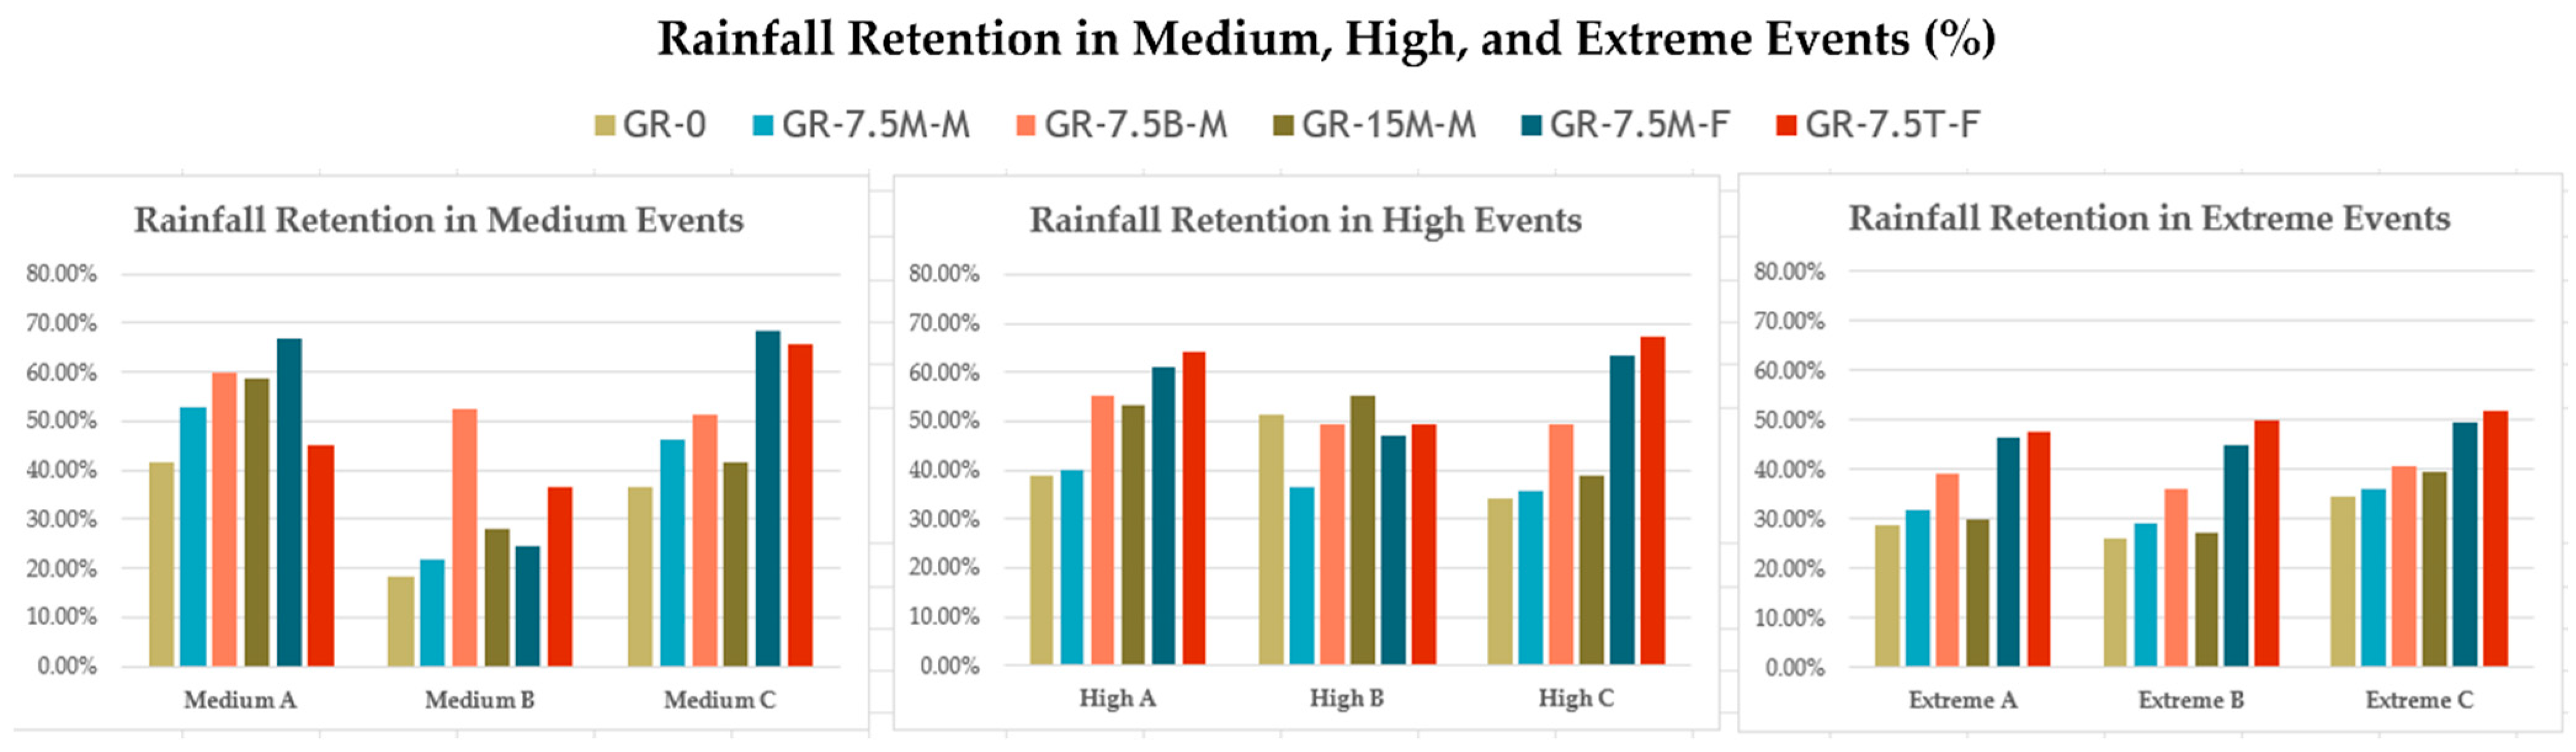
3.1. Runoff Retention

The hydrological responses of the six GR test beds in terms of runoff retention during the monitoring period are shown in Figure 5. The box plots provide a summary of the overall performance of each GR test bed in terms of retention rates, considering the maximum, minimum, mean, and median values after nine simulated events. As expected, the application of biochar enhanced the water retention rates of GRs. While a moderate improvement was observed in GR-7.5M-M and GR-15M-M, runoff volume was significantly alleviated by GR-7.5B-M, GR-7.5M-F, and GR-7.5T-F. The maximum retention rate of 68.29% was reached by GR-7.5M-F in the Medium C event. In contrast, GR-0 had the poorest retention rate of only 18.29% in the Medium B event. With the same application method of mixing and medium biochar particles, the higher amendment rate of biochar in GR-15M-M slightly improved the water retention as compared to GR-7.5M-M in most events. However, 7.5% v/v biochar at the bottom layer of the GR7.5B-M substrate outperformed 15% v/v biochar mixed in the GR-15M-M substrate. For the entire study period, the highest retention capacity was achieved by fine biochar particles of GR-7.5M-F and GR-7.5T-F with the average of 52–53%. In general, the differences in rainfall retention between the six GR test beds were identical under different rainfall depths. The only exception was found in the High B event when GR-0 and GR-15M-M had the best retention performance.
Figure 6 further elucidates the overall retention performance of the six test beds. The graph illustrates the cumulative rainfall volume and the comparison of runoff volume from different GR test beds under the nine artificial rainfall events. From 31 July 2023 to 21 August 2023, a total of 110.7 L of artificial rainfall was generated per test bed. The lowest and highest cumulative runoff reductions of 34.24% and 53.21% were recorded in GR-0 and GR-7.5T-F, respectively. The retention rates in this study are lower than those previously reported by other researchers. For instance, Todorov, Driscoll and Todorova [33] obtained an average retention of 95.9 ± 3.6% ranging from 75% to 99.6%. Furthermore, average retention rates of 68% (16.7% to 100%), 78% (17% to 100%), 66% (3.6% to 100%), and 70% (0% to 100%) were reported in [14,17,18,23], respectively. This could be attributed to the unrealistic rainfall intensity generated by a pressurized simulator and the omission of low rainfall-depth events in the present study. For example, GRs in the study of Jahanfar et al. [73] achieved a retention rate of at least 90% from events with less than 10 mm in depth. Additionally, the average amount of retained rainwater in [6,24,25,34] was significantly high, primarily due to the inclusion of numerous small intensity events producing zero runoff.

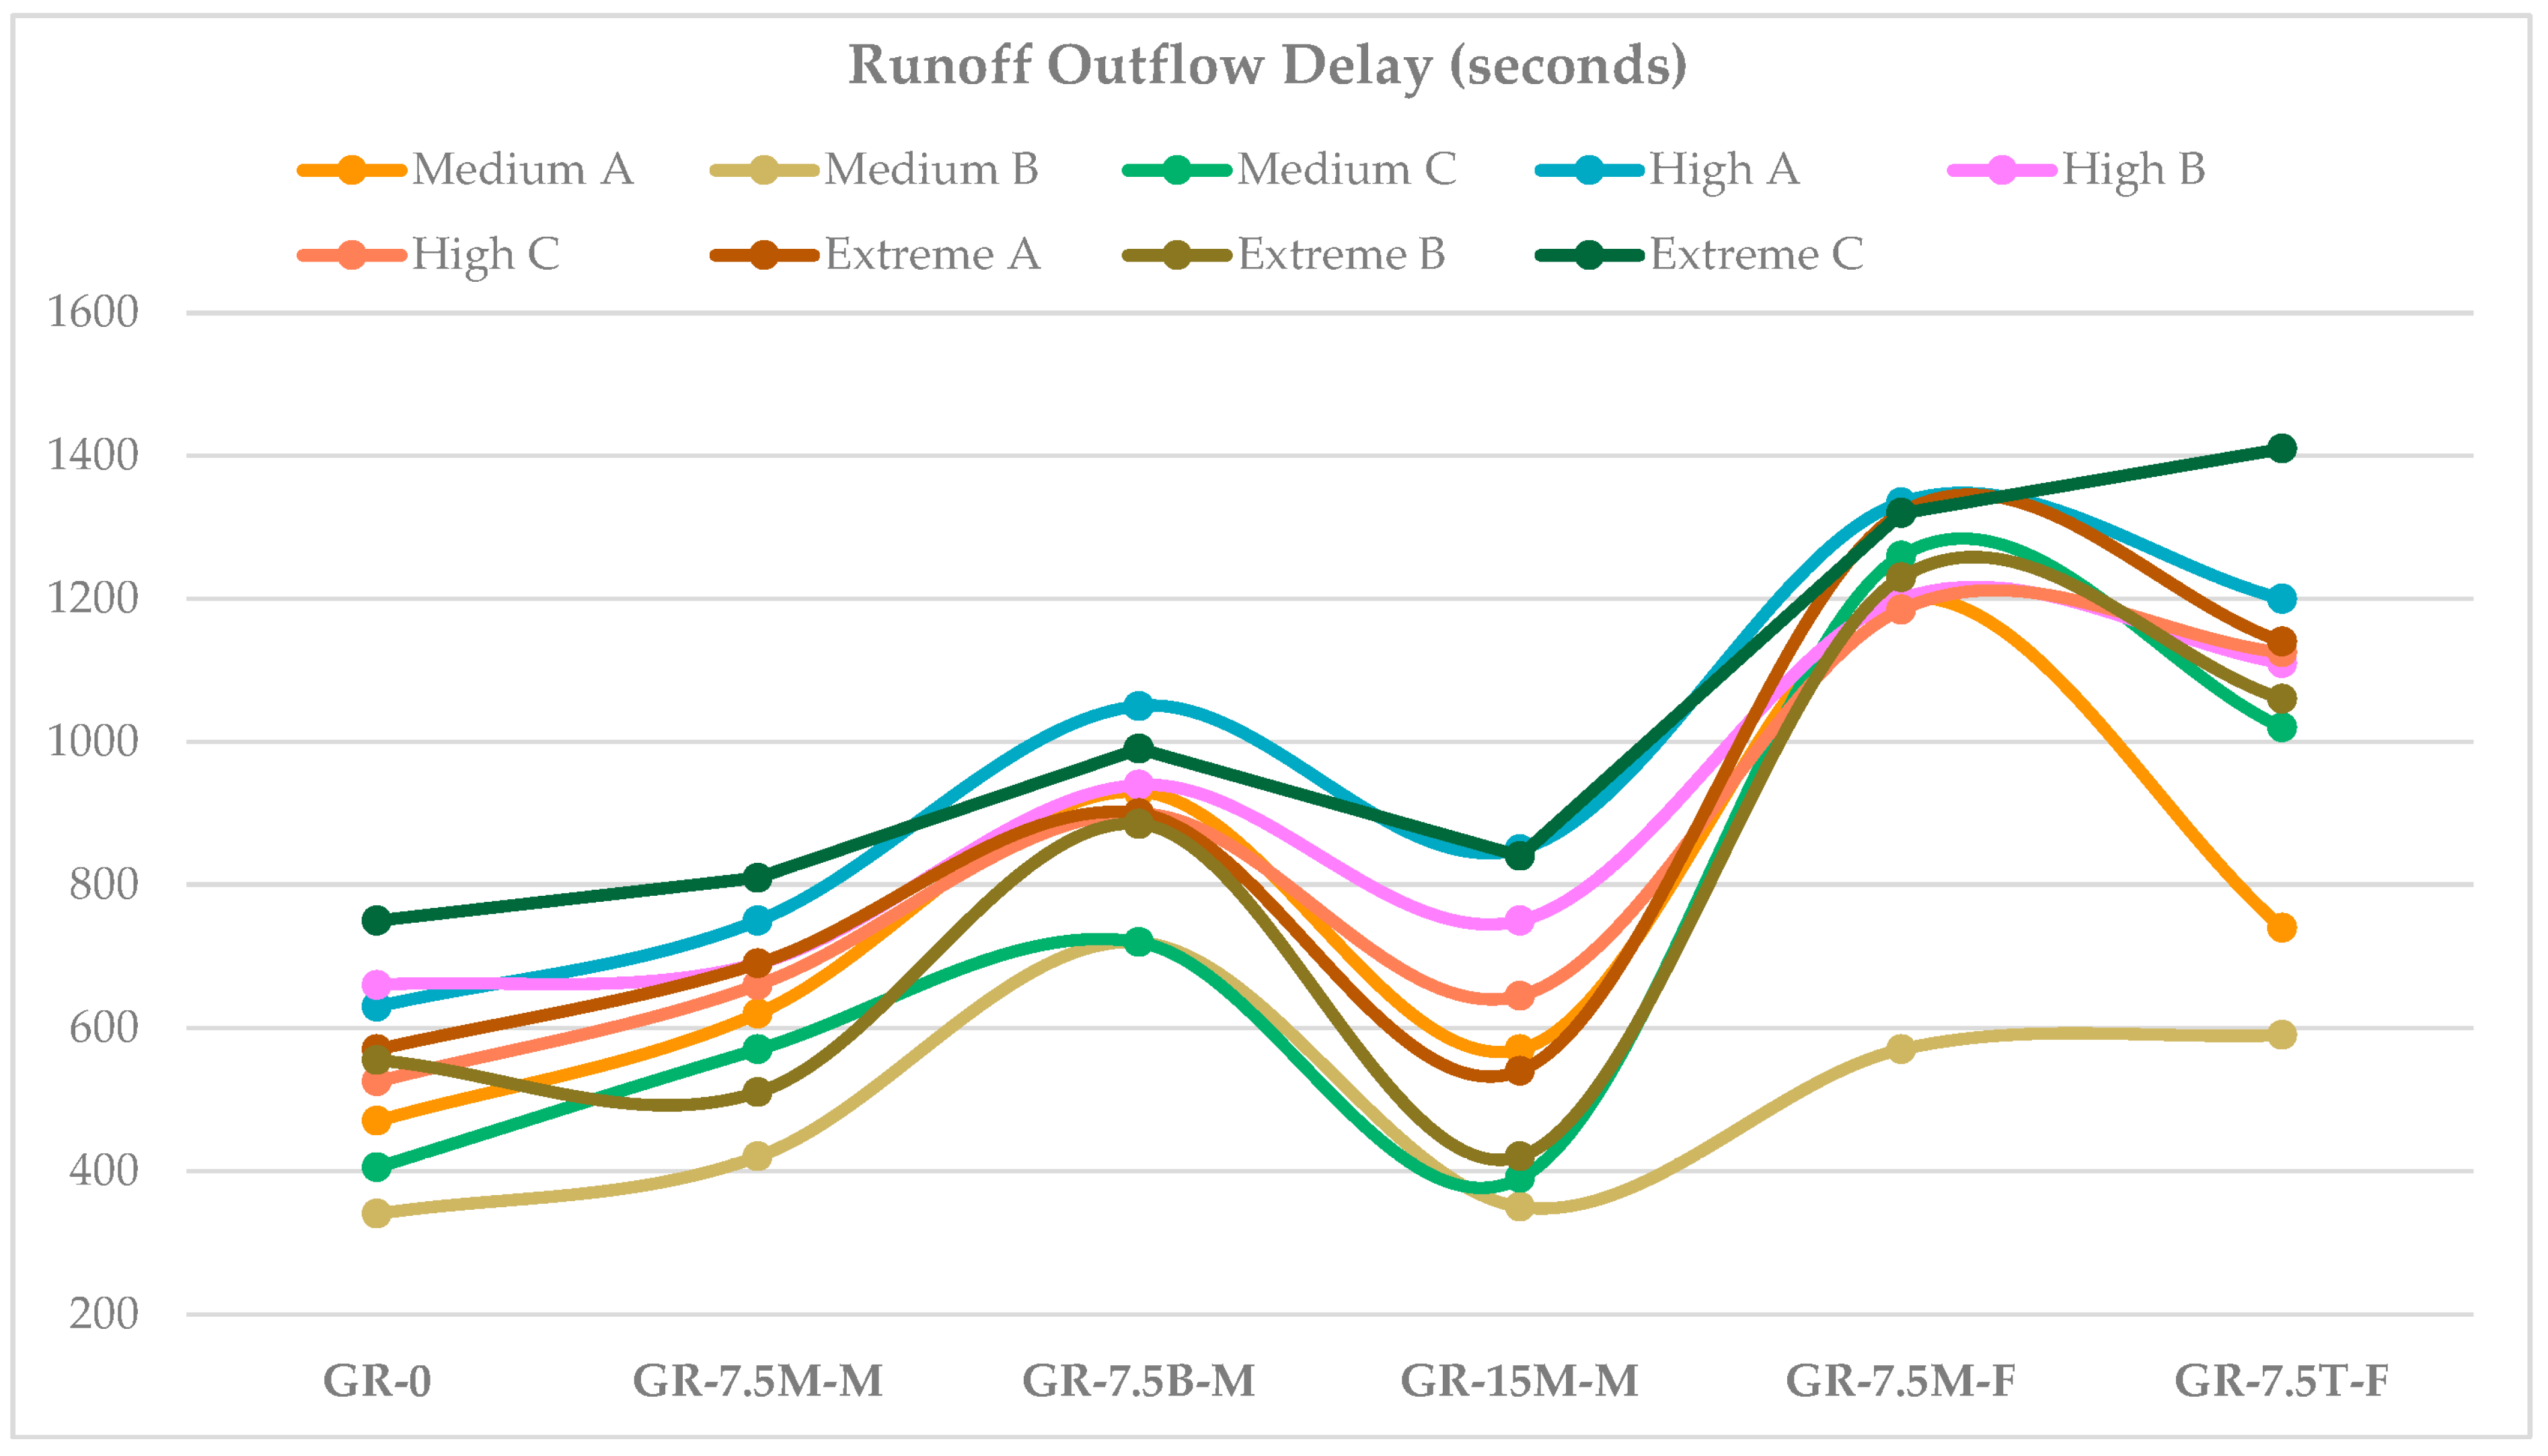
3.2. Runoff Outflow Delay

Across the nine different events, the performance of the six GR test beds in delaying runoff outflow remained consistent. Figure 7 shows the amount of time in seconds before a test bed starts producing runoff in a rainfall event. The graph illustrates which GR test bed exhibited a tendency for longer runoff outflow delays during different medium, high, and extreme rainfall events. In most events, runoff was delayed the most by fine biochar particles of GR-7.5M-F and GR-7.5T-F with an average of 1200 s. They only observed a substantial drop to about 600 s during the Medium B event. The exceptional delays of fine biochar particles of GR-7.5M-F and GR-7.5T-F could raise concerns about the infiltration reduction. GR-0 quickly started releasing runoff after 300 to 750 s, which was the shortest outflow delay. The 7.5% v/v amendment rate of medium biochar particles in GR-7.5M-M slightly improved the runoff outflow delay. The increase in the amount of medium biochar particles to 15% v/v in GR-15M-M did not result in a noticeable difference. However, GR-7.5M-M tended to have a slightly longer delay than GR-15M-M. In contrast, moving 7.5% v/v medium biochar particles to the bottom of the GR-7.5B-M substrate resulted in a remarkable enhancement. GR-7.5B-M was able to delay runoff by 700 to 1100 s and it performed consistently in all events.

4. Discussion

4.1. Biochar Variables: Application Method, Amendment Rate, and Particle Size

In accordance with the previous findings [50,51,52], the higher amount of biochar led to a higher water retention capacity of GRs. Though D’Ambrosio, Mobilia, Khamidullin, Longobardi and Elizaryev [51] used a modeling software to investigate the 15 cm depth biochar-amended GRs, comparable results were observed regarding the enhanced retention capacity associated with a higher quantity of biochar. A higher retention capacity by increasing biochar application rate was also observed in the study of Valagussa, Gatt, Tosca and Martinetti [52], wherein they tested 15 cm depth GR substrates with two different biochar types. In the present study, GR-15M-M (15% biochar v/v) retained 4.63% (on average) more rainwater than GR-7.5M-M (7.5% biochar v/v). Regarding the runoff outflow delay, the performance of GR-15M-M was lower than that of GR-7.5M-M. However, the difference was negligible. It could be concluded in this study that the hydrological performance marginally improved by increasing the quantity of biochar from 7.5% to 15%. Hence, it is strongly recommended to consider the addition of 5–7.5% v/v biochar in future projects, addressing the constraints posed by the limited availability and high manufacturing cost of biochar [47,48,58,74]. On the other hand, a contradictory finding was also reported in the study by Goldschmidt [53]. The increase in the biochar application rate from 2.5% to 10% did not result in an increase in the retention capacity of 60 cm × 29 cm biochar-GR plots. Therefore, a preliminary assessment of a biochar-GR system is necessary before considering its widespread application.
The significance of the biochar application method was emphasized in this research. Taking both the retention rate and the outflow delay into account, the performance of the bottom biochar GR test bed (GR-7.5B-M) was consistently outstanding. As compared to GR-7.5M-M, and even GR-15M-M, GR-7.5B-M retained 11.42% and 6.79% (on average) more rainwater and had 257 s and 298 s (on average) longer outflow delays, respectively. With a similar biochar particle size (medium), the bottom-layer biochar prevailed over the mixed biochar in this study. The bottom-layer biochar also outperformed the top-layer biochar in the study of Kuoppamäki, Hagner, Lehvävirta and Setälä [67]. In their study, GR test plots with a dimension of 0.4 m × 0.5 m and two different types of plants (Sedum and meadow) had higher water retention rates when biochar was applied at the bottom layer of the GR substrate. However, further research is required to gain an in-depth knowledge about the bottom-layer-biochar method, by investigating different biochar particle sizes and amendment rates. Additionally, the performance of fine biochar particles was relatively similar when they were either thoroughly mixed in the GR-7.5M-F substrate or mixed with water and then applied on the substrate surface of GR-7.5T-F. Under the impact of rainfall/irrigation, fine biochar particles on the substrate surface tended to quicky move downward into the substrate mix within only two months after the application. These two GRs also performed exceptionally better than other GRs in this research. Top-layer biochar was also suggested to be applied in [65], due to lower labor costs associated with the mixing methods. They also recommended replacing unprocessed biochar with processed biochar applied on the GR substrate surface to mitigate biochar loss. Future research attempts are encouraged, since only a limited number of studies on methods of applying biochar were found in the literature.
Regarding biochar particle sizes, two of the studied test beds featuring fine biochar particles outperformed others in terms of both water retention and runoff outflow delay. This result was in line with previous findings. For example, Werdin, Conn, Fletcher, Rayner, Williams and Farrell [58] used soil columns to study two types of biochar with three biochar particle sizes (less than 2 mm, 2–10 mm, and mix) and four amendment rates (10, 20, 30, and 40% v/v) and concluded that fine particles (<2 mm) had the highest water retention. Liao, Drake and Thomas [60] investigated different sizes of processed and unprocessed biochar by mixing them (4.5% w/w) into 8 cm depth substrates of 71 cm2 GR test plots. They found that the smaller, unprocessed biochar particles led to higher water retention rates. Nevertheless, the trend was not consistent in the case of the processed biochar. The notable improvement in retention performance observed with fine biochar particles compared to large particles may be attributed to increases in porosity and specific surface area [56]. However, concerns arising from fine biochar particles are substrate waterlogging during high-intensity events and consequent potential for biochar loss. Fine particles diminish the filtration rate and the air-filled porosity (AFP), leading to waterlogging [58]. The slow water releasing of fine biochar particles caused the greatest decline in the retention rate of GR-7.5M-F from 67.07% in the Medium A event to 24.39% in the Medium B event. The fast drainage of an EGR plays a major role in avoiding waterlogging, adversely influencing plant health [57,75]. Wang, Garg, Zhang, Xiao and Mei [57] recommended the use of coconut-shell fiber in conjunction with biochar to reduce the air-entry value for effective stormwater management. As compared to fine particles, larger particles are more resistant to biochar loss caused by wind and water [59]. Medium to large biochar particles or heavy biochar (processed biochar) were suggested to be used to limit the biochar loss [60,65,76].
Based on the observational data in this research, medium biochar particles applied at the bottom of the GR-7.5B-M substrate are highly recommended as an optimal biochar-amended GR system. GR-7.5B-M was able to have a higher retention and a longer outflow delay than 7.5% and 15% v/v medium biochar particles thoroughly mixed into the substrates of GR-7.5M-M and GR-15M-M. While the hydrological performance of GR-7.5B-M was not the most optimal, it still exhibited remarkable retention of rainfall, acceptable delay in runoff outflow, and facilitated fast drainage to prevent waterlogging. Although the drainage speed of GR-7.5M-F was slow, GR-7.5B-M proved to be more advantageous in quickly replenishing the water storage for upcoming events during the wet seasons. Using medium particle sizes of biochar at the bottom of the GR substrates also helped to minimize the biochar loss to the environment. On the other hand, in projects restoring/improving the functions of failed/well-established GRs when other application methods are inappropriate, the application of fine biochar particles through the top-dressing method is an efficient solution. Noteworthy results regarding the comparison between processed and unprocessed biochar have been documented, providing motivation for future research endeavors. Further simultaneous investigations into the different forms of processed biochar, amendment rates, particle sizes, and application methods are necessary to identify the optimal biochar-amended GR design. Moreover, several biochar benefits should all be considered in a study to find the best strategy to address stormwater management as well as other global concerns.

4.2. The Influences of Rainfall Depth, Climate Conditions, and Other Factors

A strong relationship between rainfall depth and the retention capacity of GRs was detected in this study. The impact of rainfall depth was more pronounced when comparing medium/high events with extreme events. The bar charts presented in Figure 8 illustrate the different retention performance of GRs under medium, high, and extreme rainfall events. Although the differences between medium and high events were negligible, the retention rates of the GR test beds in extreme events were significantly lower. When a GR substrate reaches a saturation point during a heavy event, it cannot absorb more water, and then all remaining rainwater becomes runoff. This finding is in agreement with other published results. For example, the retention rate of only 11.9% in the study of Wong and Jim [19] was due to heavy rainfall events with more than 300 mm in depth. The notably low cumulative rainfall retention values in [14,23,30], that were lower than the average reported by others, were indicated by significant cumulative rainfall depths of 1256.3 mm (1 year), 1892.2 mm (27 months), and 481 mm (5 months), respectively.
The influence of the initial soil moisture of the GR substrates on the water retention of GRs has been thoroughly documented [17,29,31]. ADWP has also been considered as a crucial parameter affecting the retention capacity. For instance, the Medium B event was simulated only 5 h after the 8.2 mm Medium A event; hence, the difference in the initial soil moisture of all test beds between these two events was easily recognizable. A substantial reduction in rainfall retention was recorded in all test beds in the Medium B event. Moreover, all test beds in the Extreme C event, having an ADWP of 2 days, performed better than they did in the Extreme B, with zero ADWP in relation to rainfall retention. However, a consistent trend was not observed in other events. With a lower initial soil moisture or longer ADWP, the GRs did not achieve a higher retention or a longer delay in all experiments. Therefore, other parameters such as the available water storage of the drainage layers are likely to play a major role. However, firm conclusions regarding these influential parameters could not be drawn due to insufficient data. A longer monitoring period and a more precise data collection of the initial soil moisture content and ADWP are required to completely understand their impacts.
Most studies examined the effectiveness of biochar by testing small GR test beds, GR modules, and soil columns. Though the establishment of a large experimental site requires intensive effort and investment, future projects are recommended to identify the benefits of biochar-amendment in large-scale GRs.

5. Conclusions

Green roofs (GRs) are widely recognized as one of the optimistic green infrastructures that aim to address various global concerns, including urban flash flooding, water quality degradation, urban heat island effects, energy crises, and air pollution. Though GRs have been studied for decades, more efforts are still required to improve their ecosystem services. One of the innovative strategies is the addition of biochar, a carbon-rich material, to GR substrates to simultaneously enhance several GR benefits. This paper aimed to investigate the impacts of biochar on the hydrological performance of six newly established GR test beds, which included five biochar-amended test beds and one conventional test bed. The study focused on the water retention capacity and the runoff outflow delay of the six GR test beds by using a nozzle-based rainfall simulator. The GR test beds were amended by biochar with different characteristics including particle sizes, application methods, and amendment rates.
The findings and recommendations from this study are summarized below:
(a)
Green Roofs (GRs) amended with biochar outperformed conventional GRs in terms of rainfall retention and runoff outflow delays.
(b)
This study recommends biochar amendment rate of up to 7.5% v/v, as an increased biochar amount to 15% v/v did not lead to a noticeable improvement. The 7.5% v/v dose is reasonable considering the hydrological performance, biochar costs, and currently limited availability of biochar.
(c)
This study suggests the application of biochar in the bottom layer of the substrate as the optimal method due to high water retention, long outflow delay, fast drainage, and less biochar loss.
(d)
Applying biochar with water on the surface of GR substrates is the most appropriate method in cases of failed/well-established GRs, where other methods are impractical.
(e)
Medium biochar particles are recommended to be used in future GR systems. It was observed that fine particles cause substrate waterlogging and biochar loss to the environment, whereas large particles reduce the rainfall retention rate and runoff outflow delay.
(f)
More research is required to properly understand the impacts of initial soil moisture content, antecedent dry weather period (ADWP), and other parameters on the hydrological performance of GRs.
(g)
Further investigations are recommended to simultaneously study different biochar variables such as particle sizes and application methods to find out the optimal biochar-amended GR design.

Author Contributions

Conceptualization, C.N.N. and N.M.; methodology, C.N.N.; software, C.N.N. and N.M.; validation, N.M. and H.-W.C.; formal analysis, C.N.N. and N.M.; investigation, C.N.N.; resources, C.N.N. and N.M.; data curation, C.N.N.; writing—original draft preparation, C.N.N.; writing—review and editing, C.N.N., H.-W.C. and N.M.; visualization, C.N.N. and N.M.; supervision, N.M. and H.-W.C.; project administration, C.N.N.; funding acquisition, N.M. All authors have read and agreed to the published version of the manuscript.

Funding

This research received no external funding.

Data Availability Statement

The data presented in this study are available on request from the corresponding author.

Acknowledgments

The completion of this project is also attributed to the support from KHD Landscape Engineering Solutions and Green Man Char for the supplies of Versidrain drainage trays and biochar, respectively.

Conflicts of Interest

The authors declare no conflict of interest.

References

  1. Versini, P.-A.; Gires, A.; Tchiguirinskaia, I.; Schertzer, D. Fractal analysis of green roof spatial implementation in European cities. Urban For. Urban Green. 2020, 49, 126629. [Google Scholar] [CrossRef]
  2. Zhang, G.; He, B.-J. Towards green roof implementation: Drivers, motivations, barriers and recommendations. Urban For. Urban Green. 2021, 58, 126992. [Google Scholar] [CrossRef]
  3. Manso, M.; Teotónio, I.; Silva, C.M.; Cruz, C.O. Green roof and green wall benefits and costs: A review of the quantitative evidence. Renew. Sustain. Energy Rev. 2021, 135, 110111. [Google Scholar] [CrossRef]
  4. Ávila-Hernández, A.; Simá, E.; Xamán, J.; Hernández-Pérez, I.; Téllez-Velázquez, E.; Chagolla-Aranda, M. Test box experiment and simulations of a green-roof: Thermal and energy performance of a residential building standard for Mexico. Energy Build. 2020, 209, 109709. [Google Scholar] [CrossRef]
  5. Sun, T.; Bou-Zeid, E.; Wang, Z.-H.; Zerba, E.; Ni, G.-H. Hydrometeorological determinants of green roof performance via a vertically-resolved model for heat and water transport. Build. Environ. 2013, 60, 211–224. [Google Scholar] [CrossRef]
  6. Gong, Y.; Yin, D.; Li, J.; Zhang, X.; Wang, W.; Fang, X.; Shi, H.; Wang, Q. Performance assessment of extensive green roof runoff flow and quality control capacity based on pilot experiments. Sci. Total Environ. 2019, 687, 505–515. [Google Scholar] [CrossRef]
  7. Tabatabaee, S.; Mahdiyar, A.; Durdyev, S.; Mohandes, S.R.; Ismail, S. An assessment model of benefits, opportunities, costs, and risks of green roof installation: A multi criteria decision making approach. J. Clean. Prod. 2019, 238, 117956. [Google Scholar] [CrossRef]
  8. Scolaro, T.P.; Ghisi, E. Life cycle assessment of green roofs: A literature review of layers materials and purposes. Sci. Total Environ. 2022, 829, 154650. [Google Scholar] [CrossRef] [PubMed]
  9. Cascone, S. Green roof design: State of the art on technology and materials. Sustainability 2019, 11, 3020. [Google Scholar] [CrossRef]
  10. Nguyen, C.N.; Muttil, N.; Tariq, M.A.U.R.; Ng, A.W. Quantifying the Benefits and Ecosystem Services Provided by Green Roofs—A Review. Water 2021, 14, 68. [Google Scholar] [CrossRef]
  11. Shafique, M.; Kim, R.; Rafiq, M. Green roof benefits, opportunities and challenges–A review. Renew. Sustain. Energy Rev. 2018, 90, 757–773. [Google Scholar] [CrossRef]
  12. Vijayaraghavan, K. Green roofs: A critical review on the role of components, benefits, limitations and trends. Renew. Sustain. Energy Rev. 2016, 57, 740–752. [Google Scholar] [CrossRef]
  13. Mahdiyar, A.; Mohandes, S.R.; Durdyev, S.; Tabatabaee, S.; Ismail, S. Barriers to green roof installation: An integrated fuzzy-based MCDM approach. J. Clean. Prod. 2020, 269, 122365. [Google Scholar] [CrossRef]
  14. Palermo, S.A.; Turco, M.; Principato, F.; Piro, P. Hydrological effectiveness of an extensive green roof in Mediterranean climate. Water 2019, 11, 1378. [Google Scholar] [CrossRef]
  15. Cipolla, S.S.; Maglionico, M.; Stojkov, I. A long-term hydrological modelling of an extensive green roof by means of SWMM. Ecol. Eng. 2016, 95, 876–887. [Google Scholar] [CrossRef]
  16. Versini, P.-A.; Ramier, D.; Berthier, E.; De Gouvello, B. Assessment of the hydrological impacts of green roof: From building scale to basin scale. J. Hydrol. 2015, 524, 562–575. [Google Scholar] [CrossRef]
  17. Yang, W.-Y.; Li, D.; Sun, T.; Ni, G.-H. Saturation-excess and infiltration-excess runoff on green roofs. Ecol. Eng. 2015, 74, 327–336. [Google Scholar] [CrossRef]
  18. Nawaz, R.; McDonald, A.; Postoyko, S. Hydrological performance of a full-scale extensive green roof located in a temperate climate. Ecol. Eng. 2015, 82, 66–80. [Google Scholar] [CrossRef]
  19. Wong, G.K.; Jim, C.Y. Quantitative hydrologic performance of extensive green roof under humid-tropical rainfall regime. Ecol. Eng. 2014, 70, 366–378. [Google Scholar] [CrossRef]
  20. Speak, A.; Rothwell, J.; Lindley, S.; Smith, C. Rainwater runoff retention on an aged intensive green roof. Sci. Total Environ. 2013, 461, 28–38. [Google Scholar] [CrossRef] [PubMed]
  21. Carson, T.; Marasco, D.; Culligan, P.; McGillis, W. Hydrological performance of extensive green roofs in New York City: Observations and multi-year modeling of three full-scale systems. Environ. Res. Lett. 2013, 8, 024036. [Google Scholar] [CrossRef]
  22. Razzaghmanesh, M.; Beecham, S. The hydrological behaviour of extensive and intensive green roofs in a dry climate. Sci. Total Environ. 2014, 499, 284–296. [Google Scholar] [CrossRef] [PubMed]
  23. Stovin, V.; Vesuviano, G.; Kasmin, H. The hydrological performance of a green roof test bed under UK climatic conditions. J. Hydrol. 2012, 414, 148–161. [Google Scholar] [CrossRef]
  24. Zhang, Q.; Miao, L.; Wang, X.; Liu, D.; Zhu, L.; Zhou, B.; Sun, J.; Liu, J. The capacity of greening roof to reduce stormwater runoff and pollution. Landsc. Urban Plan. 2015, 144, 142–150. [Google Scholar] [CrossRef]
  25. Zhang, Z.; Szota, C.; Fletcher, T.D.; Williams, N.S.; Farrell, C. Green roof storage capacity can be more important than evapotranspiration for retention performance. J. Environ. Manag. 2019, 232, 404–412. [Google Scholar] [CrossRef] [PubMed]
  26. Ferrans, P.; Rey, C.V.; Pérez, G.; Rodríguez, J.P.; Díaz-Granados, M. Effect of green roof configuration and hydrological variables on runoff water quantity and quality. Water 2018, 10, 960. [Google Scholar] [CrossRef]
  27. Zhang, Z.; Szota, C.; Fletcher, T.D.; Williams, N.S.; Werdin, J.; Farrell, C. Influence of plant composition and water use strategies on green roof stormwater retention. Sci. Total Environ. 2018, 625, 775–781. [Google Scholar] [CrossRef] [PubMed]
  28. Johannessen, B.G.; Muthanna, T.M.; Braskerud, B.C. Detention and retention behavior of four extensive green roofs in three nordic climate zones. Water 2018, 10, 671. [Google Scholar] [CrossRef]
  29. Soulis, K.X.; Valiantzas, J.D.; Ntoulas, N.; Kargas, G.; Nektarios, P.A. Simulation of green roof runoff under different substrate depths and vegetation covers by coupling a simple conceptual and a physically based hydrological model. J. Environ. Manag. 2017, 200, 434–445. [Google Scholar] [CrossRef]
  30. Gregoire, B.G.; Clausen, J.C. Effect of a modular extensive green roof on stormwater runoff and water quality. Ecol. Eng. 2011, 37, 963–969. [Google Scholar] [CrossRef]
  31. Hakimdavar, R.; Culligan, P.J.; Finazzi, M.; Barontini, S.; Ranzi, R. Scale dynamics of extensive green roofs: Quantifying the effect of drainage area and rainfall characteristics on observed and modeled green roof hydrologic performance. Ecol. Eng. 2014, 73, 494–508. [Google Scholar] [CrossRef]
  32. Kaiser, D.; Köhler, M.; Schmidt, M.; Wolff, F. Increasing evapotranspiration on extensive green roofs by changing substrate depths, construction, and additional irrigation. Buildings 2019, 9, 173. [Google Scholar] [CrossRef]
  33. Todorov, D.; Driscoll, C.T.; Todorova, S. Long-term and seasonal hydrologic performance of an extensive green roof. Hydrol. Process. 2018, 32, 2471–2482. [Google Scholar] [CrossRef]
  34. Carpenter, C.M.; Todorov, D.; Driscoll, C.T.; Montesdeoca, M. Water quantity and quality response of a green roof to storm events: Experimental and monitoring observations. Environ. Pollut. 2016, 218, 664–672. [Google Scholar] [CrossRef]
  35. Beecham, S.; Razzaghmanesh, M. Water quality and quantity investigation of green roofs in a dry climate. Water Res. 2015, 70, 370–384. [Google Scholar] [CrossRef]
  36. La Roche, P.; Yeom, D.J.; Ponce, A. Passive cooling with a hybrid green roof for extreme climates. Energy Build. 2020, 224, 110243. [Google Scholar] [CrossRef]
  37. Hui, S.C.; Chan, S.-C. Integration of green roof and solar photovoltaic systems. In Proceedings of the Joint symposium 2011: Integrated Building Design in the New Era of Sustainability, Kowloon Shangri-la Hotel, Tsim Sha Tsui East , Kowloon, Hong Kong, 22 November 2011; pp. 1–12. [Google Scholar]
  38. Chemisana, D.; Lamnatou, C. Photovoltaic-green roofs: An experimental evaluation of system performance. Appl. Energy 2014, 119, 246–256. [Google Scholar] [CrossRef]
  39. Kaewpraek, C.; Ali, L.; Rahman, M.A.; Shakeri, M.; Chowdhury, M.; Jamal, M.; Mia, M.S.; Pasupuleti, J.; Dong, L.K.; Techato, K. The effect of plants on the energy output of green roof photovoltaic systems in tropical climates. Sustainability 2021, 13, 4505. [Google Scholar] [CrossRef]
  40. Zheng, Y.; Weng, Q. Modeling the effect of green roof systems and photovoltaic panels for building energy savings to mitigate climate change. Remote Sens. 2020, 12, 2402. [Google Scholar] [CrossRef]
  41. Hussain, R.; Ravi, K.; Garg, A. Influence of biochar on the soil water retention characteristics (SWRC): Potential application in geotechnical engineering structures. Soil Tillage Res. 2020, 204, 104713. [Google Scholar] [CrossRef]
  42. Kwapinski, W.; Byrne, C.M.; Kryachko, E.; Wolfram, P.; Adley, C.; Leahy, J.J.; Novotny, E.H.; Hayes, M.H. Biochar from biomass and waste. Waste Biomass Valorization 2010, 1, 177–189. [Google Scholar] [CrossRef]
  43. Wang, J.; Wang, S. Preparation, modification and environmental application of biochar: A review. J. Clean. Prod. 2019, 227, 1002–1022. [Google Scholar] [CrossRef]
  44. Rasa, K.; Heikkinen, J.; Hannula, M.; Arstila, K.; Kulju, S.; Hyväluoma, J. How and why does willow biochar increase a clay soil water retention capacity? Biomass Bioenergy 2018, 119, 346–353. [Google Scholar] [CrossRef]
  45. Kocsis, T.; Ringer, M.; Biró, B. Characteristics and applications of biochar in soil–plant systems: A short review of benefits and potential drawbacks. Appl. Sci. 2022, 12, 4051. [Google Scholar] [CrossRef]
  46. Dunkerley, D. The case for increased validation of rainfall simulation as a tool for researching runoff, soil erosion, and related processes. Catena 2021, 202, 105283. [Google Scholar] [CrossRef]
  47. Li, M.; Garg, A.; Huang, S.; Jiang, M.; Mei, G.; Liu, J.; Wang, H. Hydrological properties of biochar-amended expansive soil under dynamic water environment and biochar-amended soil’s application in green roofs. Acta Geophys. 2023, 1–11. [Google Scholar] [CrossRef]
  48. Beck, D.A.; Johnson, G.R.; Spolek, G.A. Amending greenroof soil with biochar to affect runoff water quantity and quality. Environ. Pollut. 2011, 159, 2111–2118. [Google Scholar] [CrossRef]
  49. Wang, H.; Zhang, K.; Gan, L.; Liu, J.; Mei, G. Expansive soil-biochar-root-water-bacteria interaction: Investigation on crack development, water management and plant growth in green infrastructure. Int. J. Damage Mech. 2021, 30, 595–617. [Google Scholar] [CrossRef]
  50. Farrell, C.; Cao, C.; Ang, X.; Rayner, J. Use of water-retention additives to improve performance of green roof substrates. In Proceedings of the XXIX International Horticultural Congress on Horticulture: Sustaining Lives, Livelihoods and Landscapes (IHC2014), Brisbane, Australia, 17–22 August 2014; pp. 271–278. [Google Scholar]
  51. D’Ambrosio, R.; Mobilia, M.; Khamidullin, I.F.; Longobardi, A.; Elizaryev, A.N. How substrate and drainage layer materials affect the hydrological performance of Green Roofs: CHEMFLO-2000 numerical investigation. In Proceedings of the International Conference on Computational Science and Its Applications, Cagliari, Italy, 13–16 September 2021; pp. 254–263. [Google Scholar]
  52. Valagussa, M.; Gatt, A.; Tosca, A.; Martinetti, L. Physical, chemical and hydraulic characterization of different green roof growing media. In Proceedings of the III International Symposium on Growing Media, Composting and Substrate Analysis, Milan, Italy, 24–28 June 2019; pp. 391–398. [Google Scholar]
  53. Goldschmidt, A.M. Biochar amendment of green roof substrate: Effect on vegetation, nutrient retention, and hydrologic performance. Ph.D. Thesis, University of Cincinnati, Cincinnati, OH, USA, 2018. [Google Scholar]
  54. Gan, L.; Garg, A.; Huang, S.; Wang, J.; Mei, G.; Zhang, K. Experimental and numerical investigation on rainwater management of dual substrate layer green roofs using biochar-amended soil. Biomass Convers. Biorefin. 2022, 1–10. [Google Scholar] [CrossRef]
  55. Gan, L.; Garg, A.; Wang, H.; Mei, G.; Liu, J. Influence of biochar amendment on stormwater management in green roofs: Experiment with numerical investigation. Acta Geophys. 2021, 69, 2417–2426. [Google Scholar] [CrossRef]
  56. Liao, W.; Drake, J.; Thomas, S.C. Biochar granulation, particle size, and vegetation effects on leachate water quality from a green roof substrate. J. Environ. Manag. 2022, 318, 115506. [Google Scholar] [CrossRef]
  57. Wang, H.; Garg, A.; Zhang, X.; Xiao, Y.; Mei, G. Utilization of coconut shell residual in green roof: Hydraulic and thermal properties of expansive soil amended with biochar and fibre including theoretical model. Acta Geophys. 2020, 68, 1803–1819. [Google Scholar] [CrossRef]
  58. Werdin, J.; Conn, R.; Fletcher, T.D.; Rayner, J.P.; Williams, N.S.; Farrell, C. Biochar particle size and amendment rate are more important for water retention and weight of green roof substrates than differences in feedstock type. Ecol. Eng. 2021, 171, 106391. [Google Scholar] [CrossRef]
  59. Seitz, S.; Teuber, S.; Geißler, C.; Goebes, P.; Scholten, T. How Do Newly-Amended Biochar Particles Affect Erodibility and Soil Water Movement?—A Small-Scale Experimental Approach. Soil Syst. 2020, 4, 60. [Google Scholar] [CrossRef]
  60. Liao, W.; Drake, J.; Thomas, S.C. Biochar granulation enhances plant performance on a green roof substrate. Sci. Total Environ. 2022, 813, 152638. [Google Scholar] [CrossRef]
  61. Omondi, M.O.; Xia, X.; Nahayo, A.; Liu, X.; Korai, P.K.; Pan, G. Quantification of biochar effects on soil hydrological properties using meta-analysis of literature data. Geoderma 2016, 274, 28–34. [Google Scholar] [CrossRef]
  62. Huang, S.; Garg, A.; Mei, G.; Huang, D.; Chandra, R.B.; Sadasiv, S.G. Experimental study on the hydrological performance of green roofs in the application of novel biochar. Hydrol. Process. 2020, 34, 4512–4525. [Google Scholar] [CrossRef]
  63. Wang, H.; Garg, A.; Huang, S.; Mei, G. Mechanism of compacted biochar-amended expansive clay subjected to drying–wetting cycles: Simultaneous investigation of hydraulic and mechanical properties. Acta Geophys. 2020, 68, 737–749. [Google Scholar] [CrossRef]
  64. Cai, W.; Huang, H.; Chen, P.; Huang, X.; Gaurav, S.; Pan, Z.; Lin, P. Effects of biochar from invasive weed on soil erosion under varying compaction and slope conditions: Comprehensive study using flume experiments. Biomass Convers. Biorefinery 2020, 1–20. [Google Scholar] [CrossRef]
  65. Zhu, Y. Can Hydrological Function and Vegetation Cover of Failed Green Roofs Be Restored with Wood-Waste-Derived Biochar? Master’s Thesis, University of Toronto, Toronto, ON, Canada, 2020. Available online: https://hdl.handle.net/1807/99102 (accessed on 26 May 2023).
  66. Kuoppamäki, K.; Setälä, H.; Hagner, M. Nutrient dynamics and development of soil fauna in vegetated roofs with the focus on biochar amendment. Nat. Based Solut. 2021, 1, 100001. [Google Scholar] [CrossRef]
  67. Kuoppamäki, K.; Hagner, M.; Lehvävirta, S.; Setälä, H. Biochar amendment in the green roof substrate affects runoff quality and quantity. Ecol. Eng. 2016, 88, 1–9. [Google Scholar] [CrossRef]
  68. Ricks, M.D.; Horne, M.A.; Faulkner, B.; Zech, W.C.; Fang, X.; Donald, W.N.; Perez, M.A. Design of a pressurized rainfall simulator for evaluating performance of erosion control practices. Water 2019, 11, 2386. [Google Scholar] [CrossRef]
  69. Carvalho, S.C.; de Lima, J.L.; de Lima, M.I.P. Increasing the rainfall kinetic energy of spray nozzles by using meshes. Land Degrad. Dev. 2016, 27, 1295–1302. [Google Scholar] [CrossRef]
  70. Blanquies, J.; Scharff, M.; Hallock, B. The design and construction of a rainfall simulator. In Proceedings of the International Erosion Control Association (IECA), 34th Annual Conference and Expo, Las Vegas, NV, USA, 24–28 February 2003. [Google Scholar]
  71. Holko, L.; Lichner, Ľ.; Kollár, J.; Šurda, P.; Danko, M.; Zvala, A.; Kidron, G.J. Runoff response of a hydrophobic soil under high intensity rains. Hydrol. Process. 2023, 37, e14899. [Google Scholar] [CrossRef]
  72. Dunkerley, D. Rain event properties in nature and in rainfall simulation experiments: A comparative review with recommendations for increasingly systematic study and reporting. Hydrol. Process. Int. J. 2008, 22, 4415–4435. [Google Scholar] [CrossRef]
  73. Jahanfar, A.; Drake, J.; Sleep, B.; Margolis, L. Evaluating the shading effect of photovoltaic panels on green roof discharge reduction and plant growth. J. Hydrol. 2019, 568, 919–928. [Google Scholar] [CrossRef]
  74. Kuppusamy, S.; Thavamani, P.; Megharaj, M.; Venkateswarlu, K.; Naidu, R. Agronomic and remedial benefits and risks of applying biochar to soil: Current knowledge and future research directions. Environ. Int. 2016, 87, 1–12. [Google Scholar] [CrossRef] [PubMed]
  75. Piscitelli, L.; Rivier, P.-A.; Mondelli, D.; Miano, T.; Joner, E.J. Assessment of addition of biochar to filtering mixtures for potential water pollutant removal. Environ. Sci. Pollut. Res. 2018, 25, 2167–2174. [Google Scholar] [CrossRef] [PubMed]
  76. Liao, W.; Sifton, M.A.; Thomas, S.C. Biochar granulation reduces substrate erosion on green roofs. Biochar 2022, 4, 61. [Google Scholar] [CrossRef] [PubMed]
Figure 1. The 50 m2 green roof on top of Building M at Victoria University’s Footscray Park Campus: (a) the green roof construction plan, (b) the green roof one month after completion.
Water 16 00482 g001
Figure 2. The six 1 m × 1 m green roof test beds on top of Building M at Victoria University, Footscray Park Campus.
Water 16 00482 g002
Figure 3. Biochar: (a) Fine particles (less than 1 mm), (b) Medium particles (1–3 mm).
Water 16 00482 g003
Figure 4. Illustration of the rainfall simulation system above a GR test bed.
Water 16 00482 g004
Figure 5. Runoff retention performance of the six green roof test beds for the nine artificial rainfall events.
Water 16 00482 g005
Figure 6. Cumulative runoff volume of the six green roof test beds after nine artificial rainfall events.
Water 16 00482 g006
Figure 7. Runoff outflow delays for the six green roof test beds during the nine artificial rainfall events.
Water 16 00482 g007
Figure 8. Runoff retention rates of the six green roof test beds under medium, high, and extreme rainfall events.
Water 16 00482 g008
Table 1. Characteristics of the six green roof test beds constructed for this study.
GR Test BedBiochar Amendment Rate (%)Biochar Application MethodBiochar Particle Size
GR-00NANA
GR-7.5M-M7.5MixedMedium
GR-7.5B-M7.5Bottom LayerMedium
GR-15M-M15MixedMedium
GR-7.5M-F7.5MixedFine
GR-7.5T-F7.5Top Dressing with WaterFine
Table 2. Characteristics of the nine artificial rainfall events.
EventDate (Time)Simulation Runtime
(min)
Estimated Rainfall Depth
(mm)
Antecedent Dry Weather Period
(Days)
Previous Rainfall Depth
(mm)
Medium A31 July 2023 (9 a.m.)108.203
Medium B31 July 2023 (2 p.m.)108.208.2
Medium C10 August 2023 (8 a.m.)108.20Light rain until 7AM *
High A3 August 2023 (8 a.m.)1512.328.2
High B4 August 2023 (10 a.m.)1512.3012.3
High C14 August 2023 (11 a.m.)1512.303.4
Extreme A7 August 2023 (10 a.m.)2016.4212.3
Extreme B11 August 2023 (9 a.m.)2016.408.2
Extreme C21 August 2023 (9 a.m.)2016.425.4
Note: * No recorded rainfall data.
Table 3. Hydrological performance of the six green roof test beds under nine artificial rainfall events.
EventTest BedInitial Soil Moisture (1 to 10)Estimated Rainfall Volume (L)Runoff Volume (L)Runoff Retention (%)Runoff Outflow Delay (s)
Medium A
31 July 2023 (9 a.m.)
GR-03 ± 18.24.841.46%470
GR-7.5M-M5 ± 18.23.8553.05%620
GR-7.5B-M5 ± 18.23.359.76%930
GR-15M-M8 ± 18.23.458.54%570
GR-7.5M-F10 ± 28.22.767.07%1200
GR-7.5T-F10 ± 28.24.545.12%740
Medium B
31 July 2023 (2 p.m.)
GR-05 ± 28.26.718.29%340
GR-7.5M-M7 ± 28.26.421.95%420
GR-7.5B-M7 ± 28.23.952.44%720
GR-15M-M10 ± 28.25.928.05%350
GR-7.5M-F15 ± 38.26.224.39%570
GR-7.5T-F12 ± 38.25.236.59%590
Medium C
10 August 2023 (8 a.m.)
GR-05 ± 18.25.236.59%405
GR-7.5M-M5 ± 18.24.446.34%570
GR-7.5B-M5 ± 18.2451.22%720
GR-15M-M7 ± 28.24.841.46%390
GR-7.5M-F10 ± 18.22.668.29%1260
GR-7.5T-F8 ± 28.22.865.85%1020
High A
3 August 2023 (8 a.m.)
GR-02 ± 112.37.539.02%630
GR-7.5M-M3 ± 112.37.3540.24%750
GR-7.5B-M5 ± 112.35.555.28%1050
GR-15M-M5 ± 212.35.7553.25%850
GR-7.5M-F8 ± 212.34.860.98%1335
GR-7.5T-F8 ± 212.34.464.23%1200
High B
4 August 2023 (10 a.m.)
GR-02 ± 112.3651.22%660
GR-7.5M-M5 ± 112.37.836.59%690
GR-7.5B-M5 ± 112.36.249.59%940
GR-15M-M7 ± 212.35.555.28%750
GR-7.5M-F9 ± 212.36.547.15%1200
GR-7.5T-F8 ± 212.36.249.59%1110
High C
14 August 2023 (11 a.m.)
GR-04 ± 112.38.134.15%525
GR-7.5M-M8 ± 112.37.935.77%660
GR-7.5B-M4 ± 112.36.249.59%900
GR-15M-M8 ± 112.37.539.02%645
GR-7.5M-F7 ± 112.34.563.41%1185
GR-7.5T-F5 ± 112.3467.48%1125
Extreme A
7 August 2023 (10 a.m.)
GR-01 ± 116.411.728.66%570
GR-7.5M-M1 ± 116.411.231.71%690
GR-7.5B-M4 ± 216.41039.02%900
GR-15M-M5 ± 216.411.529.88%540
GR-7.5M-F8 ± 216.48.846.34%1320
GR-7.5T-F7 ± 216.48.647.56%1140
Extreme B
11 August 2023 (9 a.m.)
GR-03 ± 116.412.126.22%555
GR-7.5M-M4 ± 116.411.629.27%510
GR-7.5B-M4 ± 116.410.535.98%885
GR-15M-M8 ± 216.411.927.44%420
GR-7.5M-F8 ± 216.4945.12%1230
GR-7.5T-F7 ± 216.48.250.00%1060
Extreme C
21 August 2023 (9 a.m.)
GR-05 ± 116.410.734.76%750
GR-7.5M-M4 ± 116.410.535.98%810
GR-7.5B-M5 ± 116.49.740.85%990
GR-15M-M6 ± 216.49.939.63%840
GR-7.5M-F7 ± 216.48.349.39%1320
GR-7.5T-F5 ± 1 16.4 7.951.83%1410
Disclaimer/Publisher’s Note: The statements, opinions and data contained in all publications are solely those of the individual author(s) and contributor(s) and not of MDPI and/or the editor(s). MDPI and/or the editor(s) disclaim responsibility for any injury to people or property resulting from any ideas, methods, instructions or products referred to in the content.

