Article

Spatial and Temporal Variability of Soil Moisture and Its Driving Factors in the Northern Agricultural Regions of China

1
College of Resources and Environment, Anhui Agricultural University, Hefei 230036, China
2
College of Information and Artificial Intelligence, Anhui Agricultural University, Hefei 230036, China
3
Hefei Meteorological Bureau, Hefei 230041, China
*
Author to whom correspondence should be addressed.
Water 2024, 16(4), 556; https://doi.org/10.3390/w16040556
Submission received: 12 January 2024 / Revised: 29 January 2024 / Accepted: 9 February 2024 / Published: 12 February 2024
(This article belongs to the Section Soil and Water)

Abstract

:
Soil moisture, as an important variable affecting water–heat exchange between land and atmosphere, is an important feedback to climate change. Soil moisture is of great concern in Northern China, where arable land is extensive, but water resources are distributed unevenly and extremely sensitive to climate change. Using measured soil moisture data collected by the China Meteorological Administration from 164 stations during 1980–2021, we explored the drivers of soil moisture variation by analyzing its spatiotemporal variability using linear regression, partial correlation analysis, and geostatistical methods. The results indicated that (1) soil moisture increased from northwest to southeast in Northern China, with the lowest soil moisture in the IM; (2) the overall trend of soil moisture in most regions decreased, especially in the arid northwest and northeast China. However, soil moisture in some regions began to increase gradually in recent years, such as in northwestern Xinjiang and the central-eastern part of IM; and (3) soil moisture in the whole region was negatively correlated with temperature and sunshine duration and positively correlated with precipitation and relative humidity. The results of the study can provide valuable guidance for timely agricultural irrigation and the adjustment of cropping structures, thereby ensuring agricultural production and food security.

1. Introduction

Climate change is the most concerning global issue today, and extreme weather events occur frequently around the world. The water cycle accelerates in the context of climate change, which has brought enormous challenges to sustainable water resources management and socio-economic systems. As the key factor in the land–atmosphere system, soil moisture represents the signal of dryness and wetness, regulates the water and energy balance through evaporation, runoff, and infiltration [1,2], and can cause climate effects similar to the El Niño–Southern Oscillation (ENSO) [3].
Soil moisture is influenced by a series of complex factors, such as climate, soil type, topography, and agricultural production activities, which govern the irrigation water demand of crops and affect agricultural grain yields. Northern China contributes 58% of the national grain production, with more than 60% of the arable land and only 19% of the total water resources [4,5,6]. However, the region, presenting a higher warming rate, is seriously sensitive to climate change with the phenomena of earlier spring, later autumn, and significantly higher minimum temperature in winter [7].
The dry and wet studies in China mainly focus on the northern regions, especially in the NW. Some studies suggested that arid areas will become wet, and semi-arid and semi-humid regions will change to arid by mainly employing precipitation data. Hu et al. [8] pointed out that arid regions have a trend of wetness based on the standardized precipitation index (SPI); Huang et al. [9] revealed that some semi-arid areas evolved into dried states due to the weakening of the East Asian monsoon in summer. Moreover, a large number of previous studies showed that soil moisture in Northern China had a downward tendency in the 20th century, such as Ma et al. [10], who presented the intensive dryness over this region by comparing SWI, precipitation, PDSI, and soil moisture. Wang et al. [11] revealed a drying trend from 1950 to 2006 in the NE China to the north-central China. Additionally, researchers also analyzed the driving factors of soil moisture variation in Northern China. Zhu et al. [12] indicated that precipitation and temperature were the key drivers in different climatic zones by using multivariate nonparametric analysis; Bai et al. [13] used maximum covariance to analyze the correlation between soil moisture and precipitation and temperature. Finally, relative contribution rate analysis was applied to quantify the impact of temperature and precipitation on the soil moisture changes. Currently, the commonly used methods for soil moisture monitoring include remote sensing, model simulation, and oven drying methods. With the features of a wide range and spatiotemporal continuity of satellite remote sensing monitoring, researchers carried out soil moisture retrievals at different scales using optical, infrared, and active and passive microwave sensors [14,15,16]. However, remote sensing monitoring for soil moisture has the disadvantage of short data time series, shallow observation depth, and coarse spatial resolution [17,18]. Models for simulating soil moisture include hydrological models, land surface models, and neural network models. Li et al. [19] ran a hydrological model to depict the spatiotemporal characteristics of soil moisture in China. However, the model approach is complex and unstable [20]. The oven drying method, which is simple to operate, has high measurement accuracy [21] and is often used as a calibration standard for other observation methods.
Previous studies lacked long time series and high-quality soil moisture observations, and most of them focused on administrative districts, which paid less attention to the overall spatiotemporal assessment of soil moisture and its driving factors at the national scale. Therefore, this study used regression analysis and partial correlation analysis to reveal the spatial and temporal variability of soil moisture based on the measured data by oven drying method and corresponding daily meteorological data (temperature, wind speed, sunshine hours, relative humidity, precipitation, etc.) from 150 agro-meteorological stations in Northern China during 1980–2021. Specifically, the whole area was divided into five subregions, and the soil moisture of the growing season (April to October) in each of which was analyzed. The results of the study provide a scientific basis for strengthening agricultural management and promoting regional high-quality development. Naturally, the temporal and spatial distribution of soil moisture has a significant effect on the land–atmosphere water circulation and heat balance. Precise information on soil moisture can help improve the accuracy of seasonal climate and weather prediction. However, since the 21st century, regional differences in soil moisture changes emerged, especially the changes in precipitation patterns in China in recent years, which may have an impact on soil moisture, so there is an urgent need to clarify the latest evolutionary patterns and driving mechanisms of soil moisture in China.

2. Materials and Methods
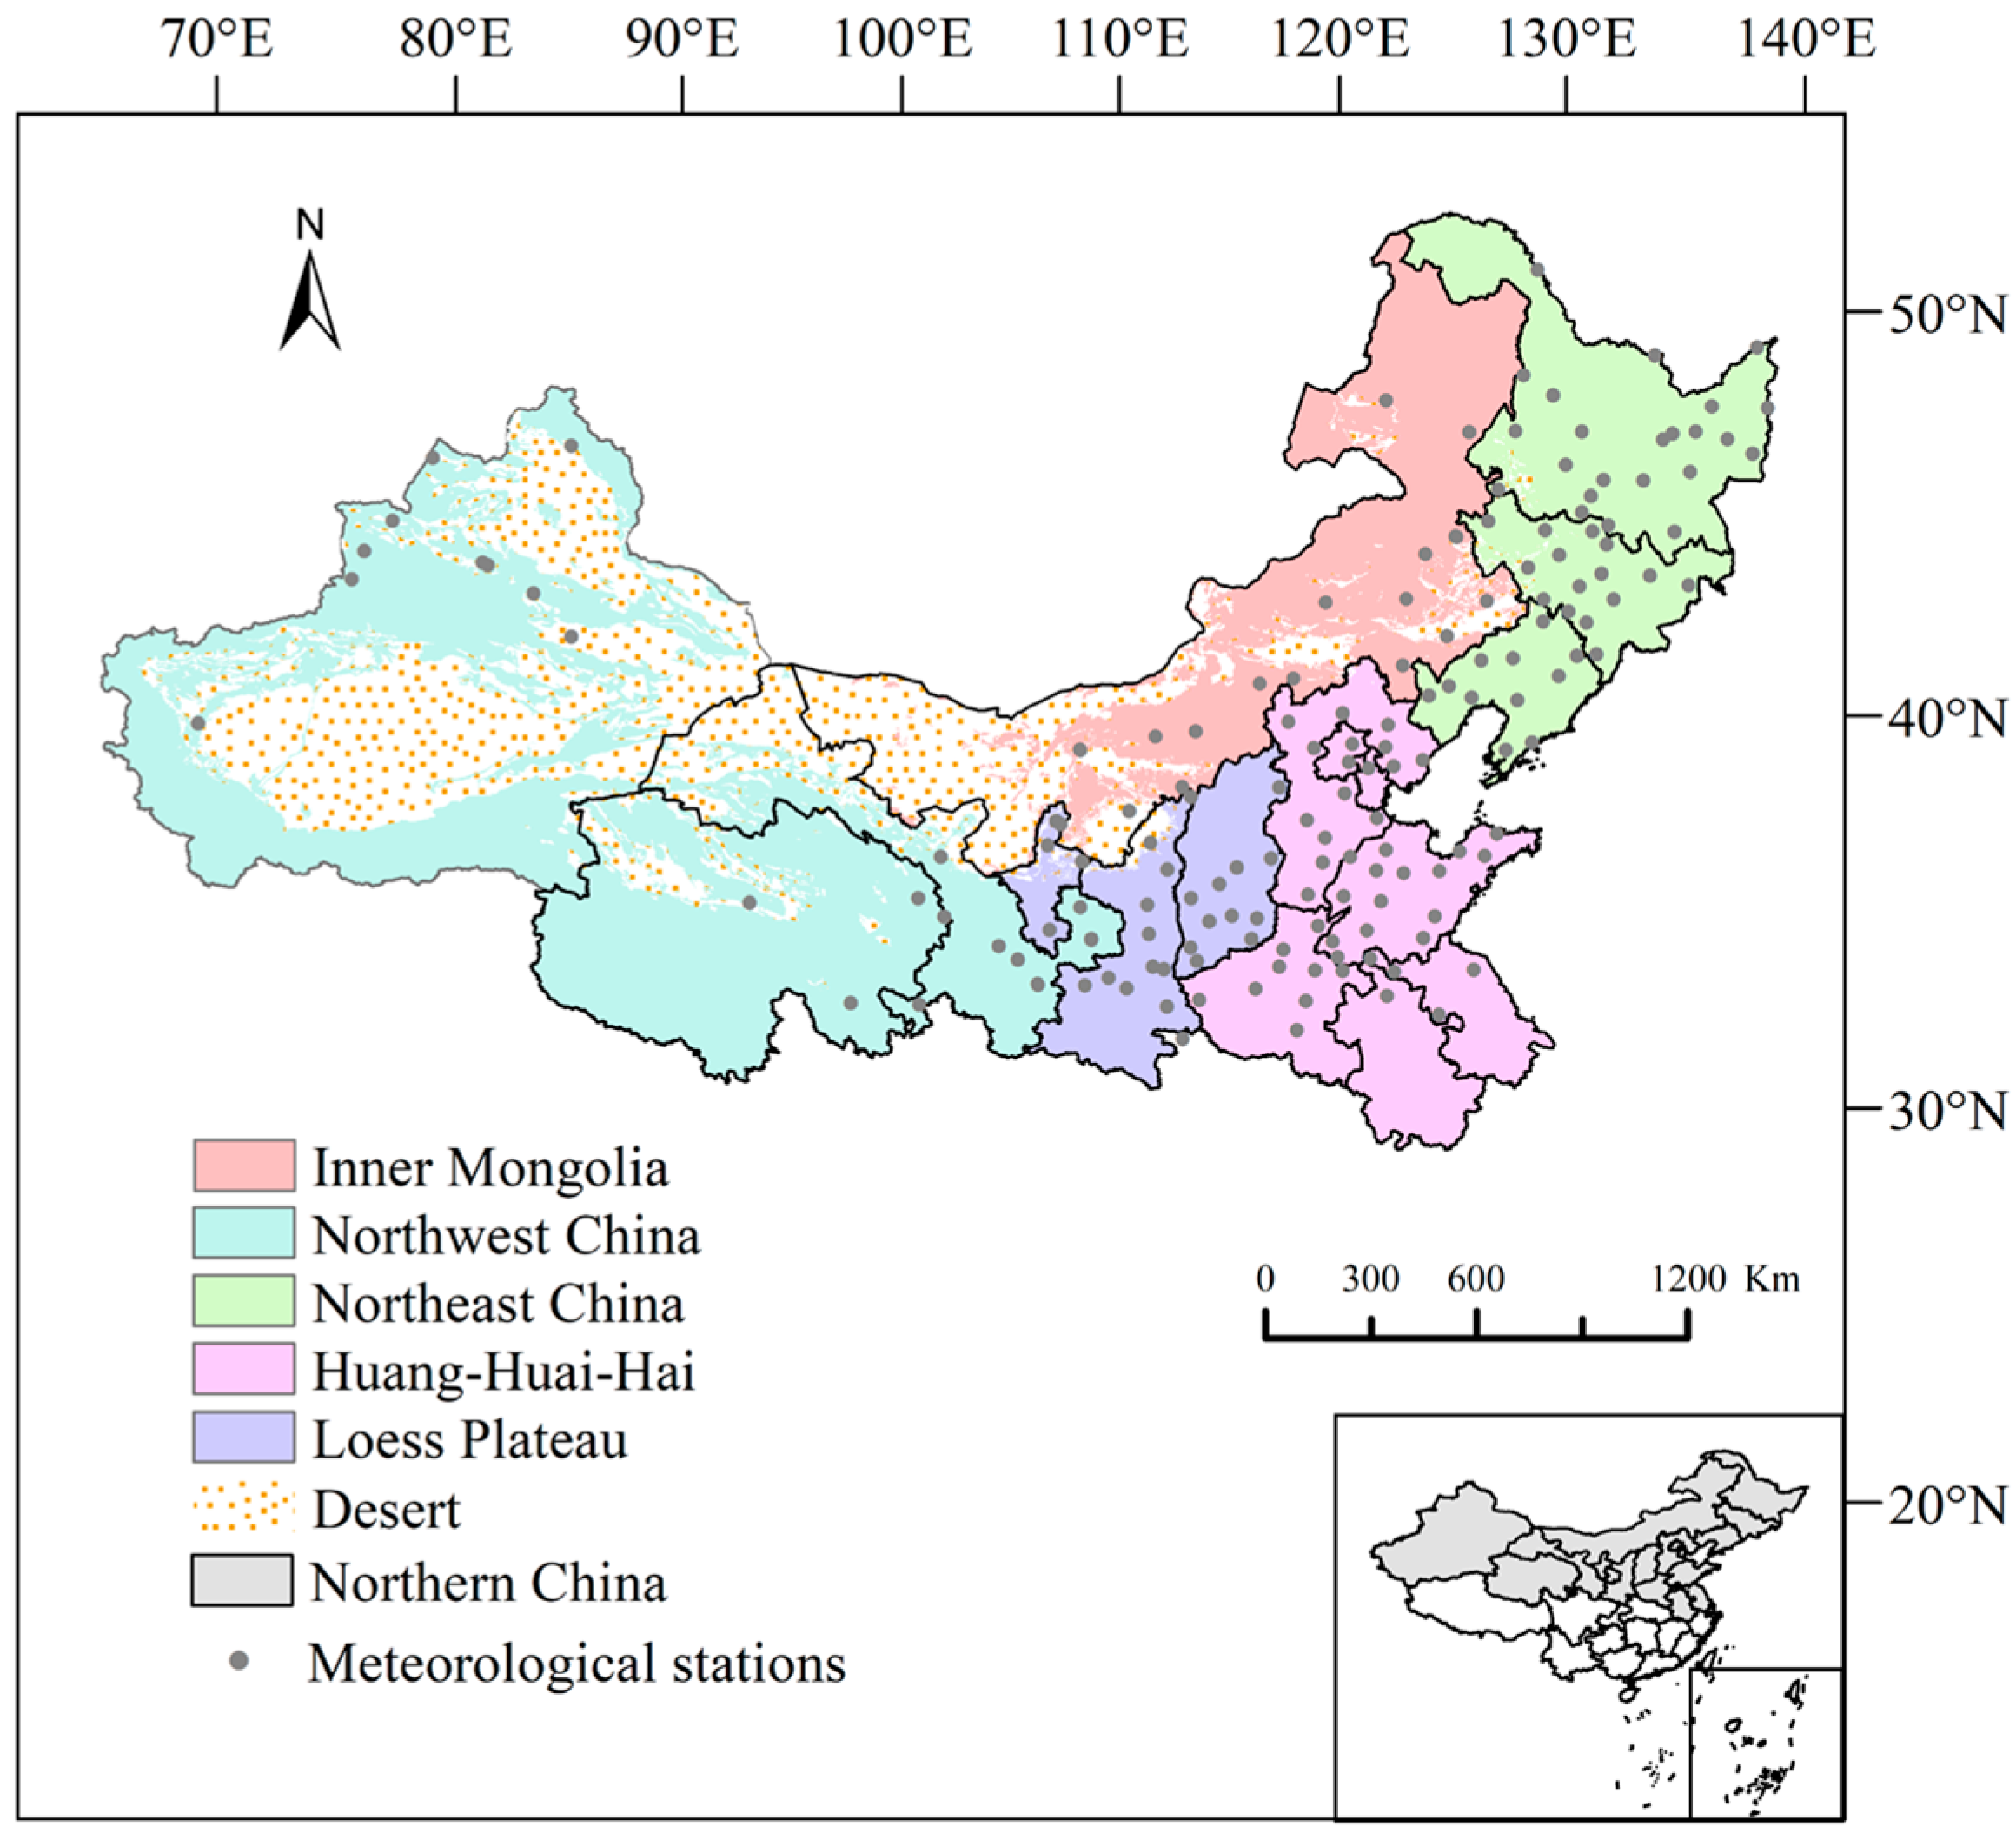
2.1. Study Area

The study area is located at 32.50°–53.50° N and 73.75°–134.75° E, covering about two-fifths of the area of China, which includes 17 provinces (municipalities) and is specifically divided into five major agro-ecological regions in this study: Northwest (NW), Northeast (NE), Huang-Huai-Hai (H-H-H), Inner Mongolia (IM), and Loess Plateau (LP) (Figure 1). The overview of each agro-ecological region is shown in Table 1.
Precipitation in most agro-ecological regions is less than 750 mm during the growing seasons, and water resources are unevenly distributed. The northern arid region is inland, with low annual precipitation and high evapotranspiration. In semi-arid and semi-humid regions, the monsoon circulation plays an important role in the transport of water vapor, and the anomalies of the summer rain bands can cause an uneven distribution of precipitation in these regions.

2.2. Data

The historical soil weight moisture data used for the study were collected by the National Meteorological Information Centre of the China Meteorological Administration (https://data.cma.cn/, accessed on 5 February 2022) from 1980 to 2021, which were observed on the 8th, 18th, and 28th of each month at different depths (0–10, 10–20, 20–30, 30–40, 40–50 cm) by using the oven drying method. Data pre-processing included quality control, such as the outlier detection (mean ± 3σ) and the vertical consistency detection, to screen out 150 agro-meteorological stations with complete time series. In addition, due to the existence of a soil freezing period in Northern China, soil moisture observations are not performed during this period. Therefore, only the variation of soil moisture from April to October each year was considered, and the average condition at the stage was counted.
In addition, the corresponding daily historical meteorological data of each agro-meteorological station were used to analyze the effects of climate change on soil moisture. The specific meteorological elements included precipitation (P), average temperature (T), relative humidity (RH), sunshine hours (SD), and wind speed at 2 m height (W), which had good continuity and were filled by linear interpolation for little missing data. Then, the average temperature, average relative humidity, average wind speed, total precipitation, and total sunshine hours were counted separately for each site year by year (April to October).

2.3. Methods

2.3.1. Climate Tendency Rate

Linear regression is a commonly used parametric method to identify the linear trends of in time series. We fitted the linear regression equation between soil moisture and time series through Equation (1) and analyzed the characteristics of soil moisture changes over time based on the regression coefficients.
S M = k t + c
where SM is the soil moisture, which is the average soil moisture during the crop growth season from 1980 to 2021; t is the year; c is the intercept; k is the regression coefficient; and 10 k is called the climate tendency rate. Moreover, k < 0 and k > 0 indicate the decreasing and increasing trends, respectively.

2.3.2. Partial Correlation Analysis

Partial correlation coefficient, also known as net correlation analysis, represents the correlation between two variables by controlling the effects of other variables [22], as expressed in Equation (2). This study used fourth-order partial correlation analysis to calculate the partial correlation coefficients of SM with P, T, RH, SD, and W in order to reveal the driving factors of soil moisture.
r x y , z = r x y r x z · r y z ( 1 r x z 2 ) ( 1 r y z 2 )
where r x y , z denotes the partial correlation coefficient between x and y after excluding the variable z; r x y , r x z , and r y z denote the correlation coefficients between x and y, x and z, and y and z, respectively.

2.3.3. Geostatistical Analysis

The Kriging interpolation method, built into ArcGIS, takes into account the spatial autocorrelation of the variables to obtain the best linear unbiased estimate [23,24]. The variance function combined with the Kriging method was employed to estimate the soil moisture at the regional level based on the site information.

3. Results

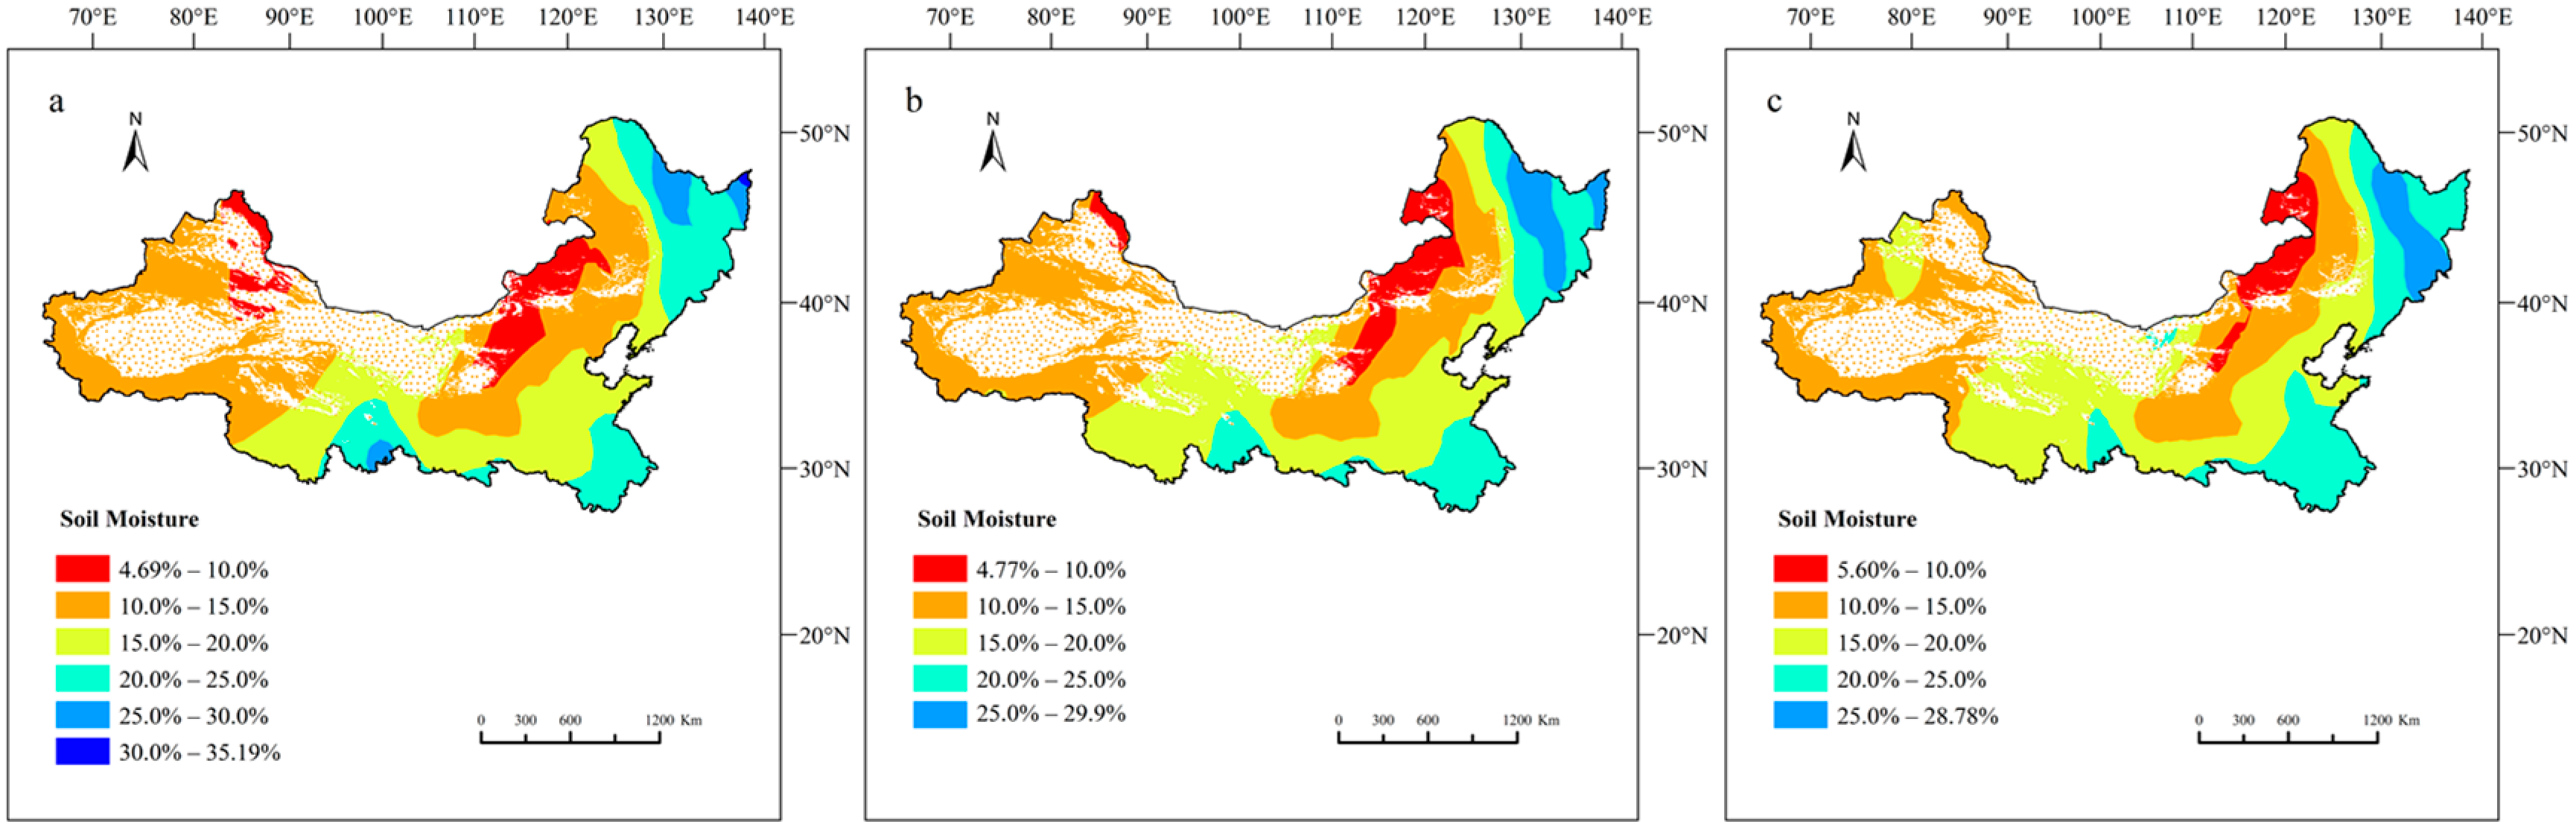
3.1. Spatial Distribution of Soil Moisture

Soil moisture in the agricultural region of northern China shows a spatial distribution pattern of low in the north and high in the south, as well as low in the west and high in the east, with the average value of soil moisture in the growing season ranging from 4.7% to 36% (Figure 2). Soil moisture in most of the IM region ranged from 5.0% to 15.0%, and the values decreased from south to north. Soil moisture in the LP region was above 12.0%. The lowest soil moisture was concentrated in regions of NW China, such as Southern Xinjiang, south of Northern Xinjiang, Eastern Xinjiang, the Alxa Plateau, and the central-western part of the IM, where soil moisture is as low as 4.7%. These areas are mainly basins, Gobi, deserts, and plateaus. Low precipitation and high evaporation are the main reasons for the low soil moisture content; the soil moisture is relatively high in the NE, the southeastern part of the H-H-H, the southern part of the LP, and the Kunlun and Tianshan Mountain ranges in NE China, where the soil weight moisture content generally reaches 20%. The replenishment of rivers and the water conservation function of forest land in mountainous areas maintain the soil moisture content at a high level. Compared with the surface layer, soil moisture in 20~30 cm and 40–50 cm are slightly higher in most regions, such as over 25% in the southeastern H-H-H and parts of northeast China and around 14% in most regions of Xinjiang. Overall, the surface soil moisture is, overall, lower than the middle layer due to rainfall, evaporation, runoff, and other processes and is subject to evapotranspiration conditions for a long time [25].

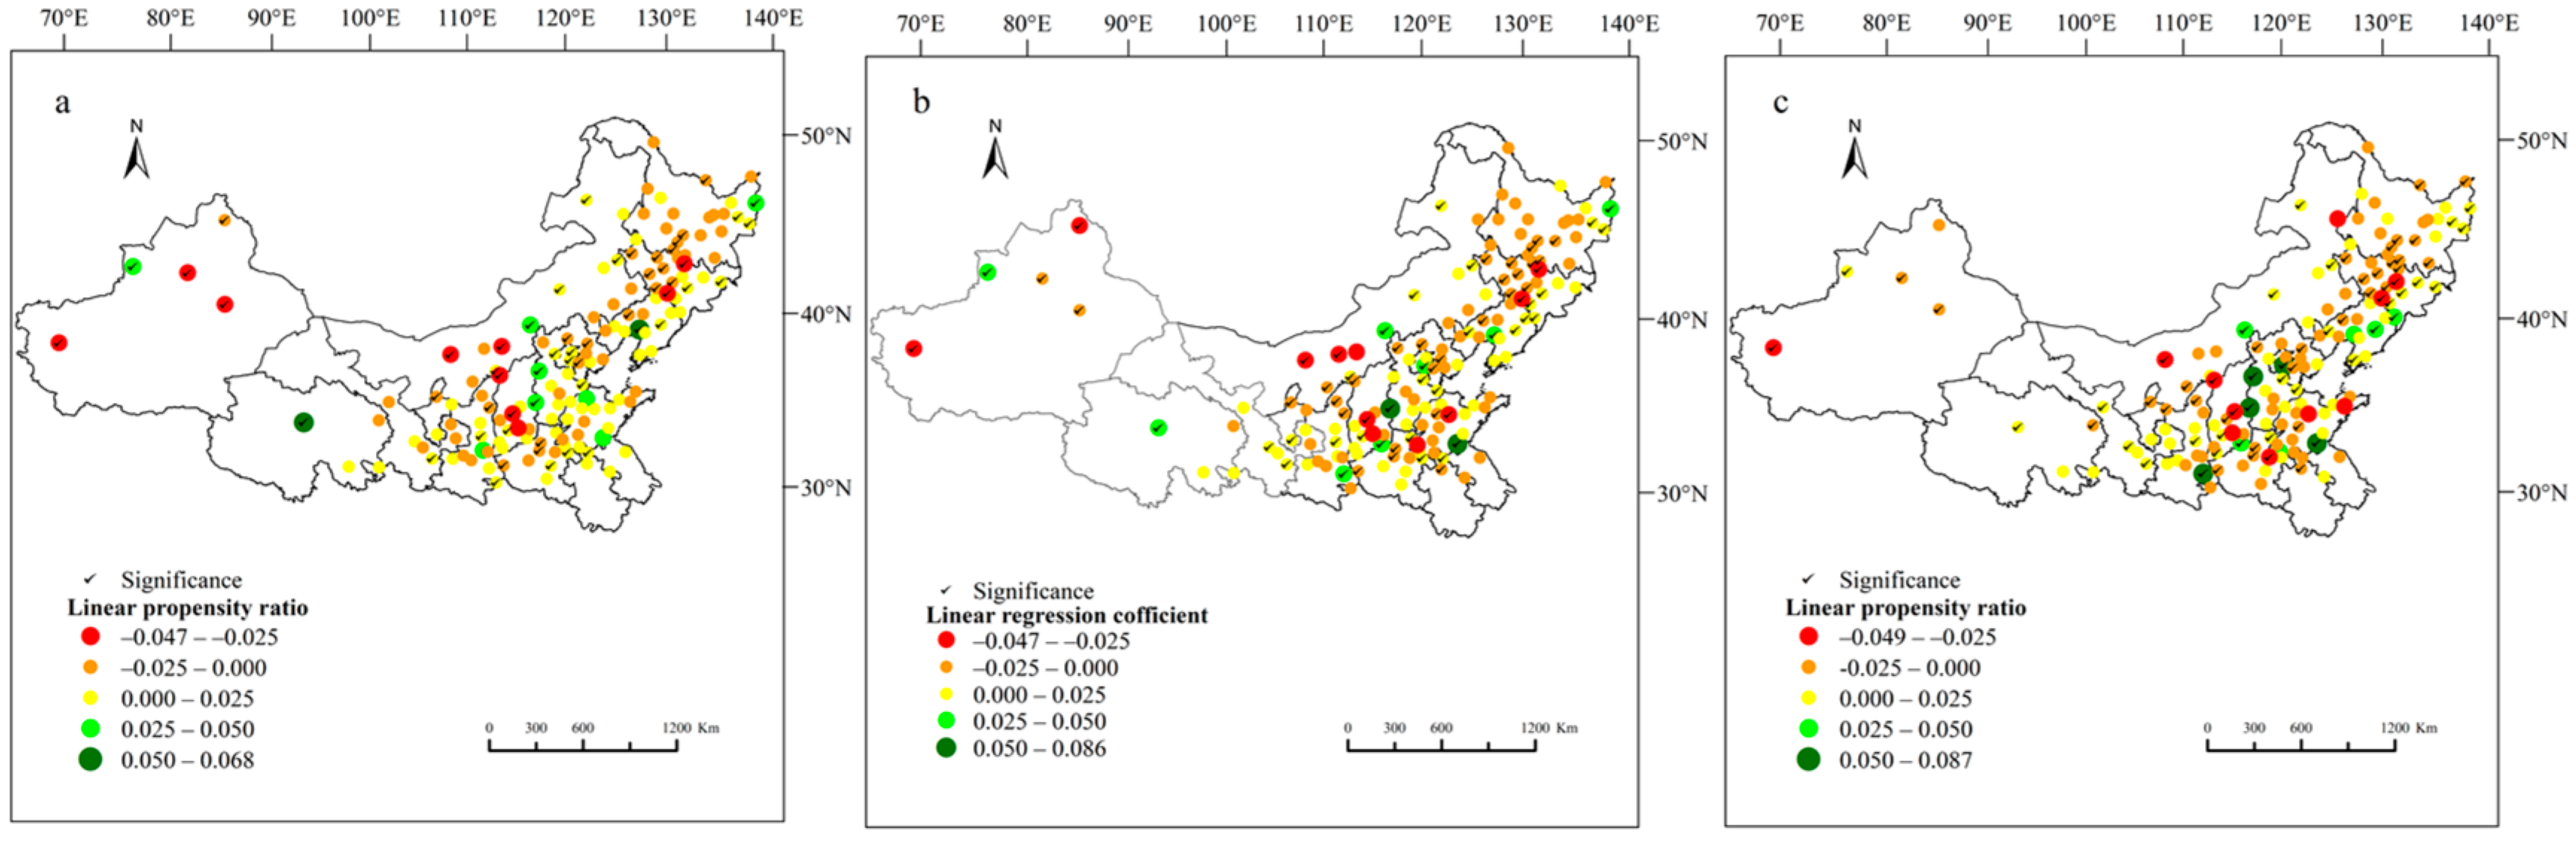
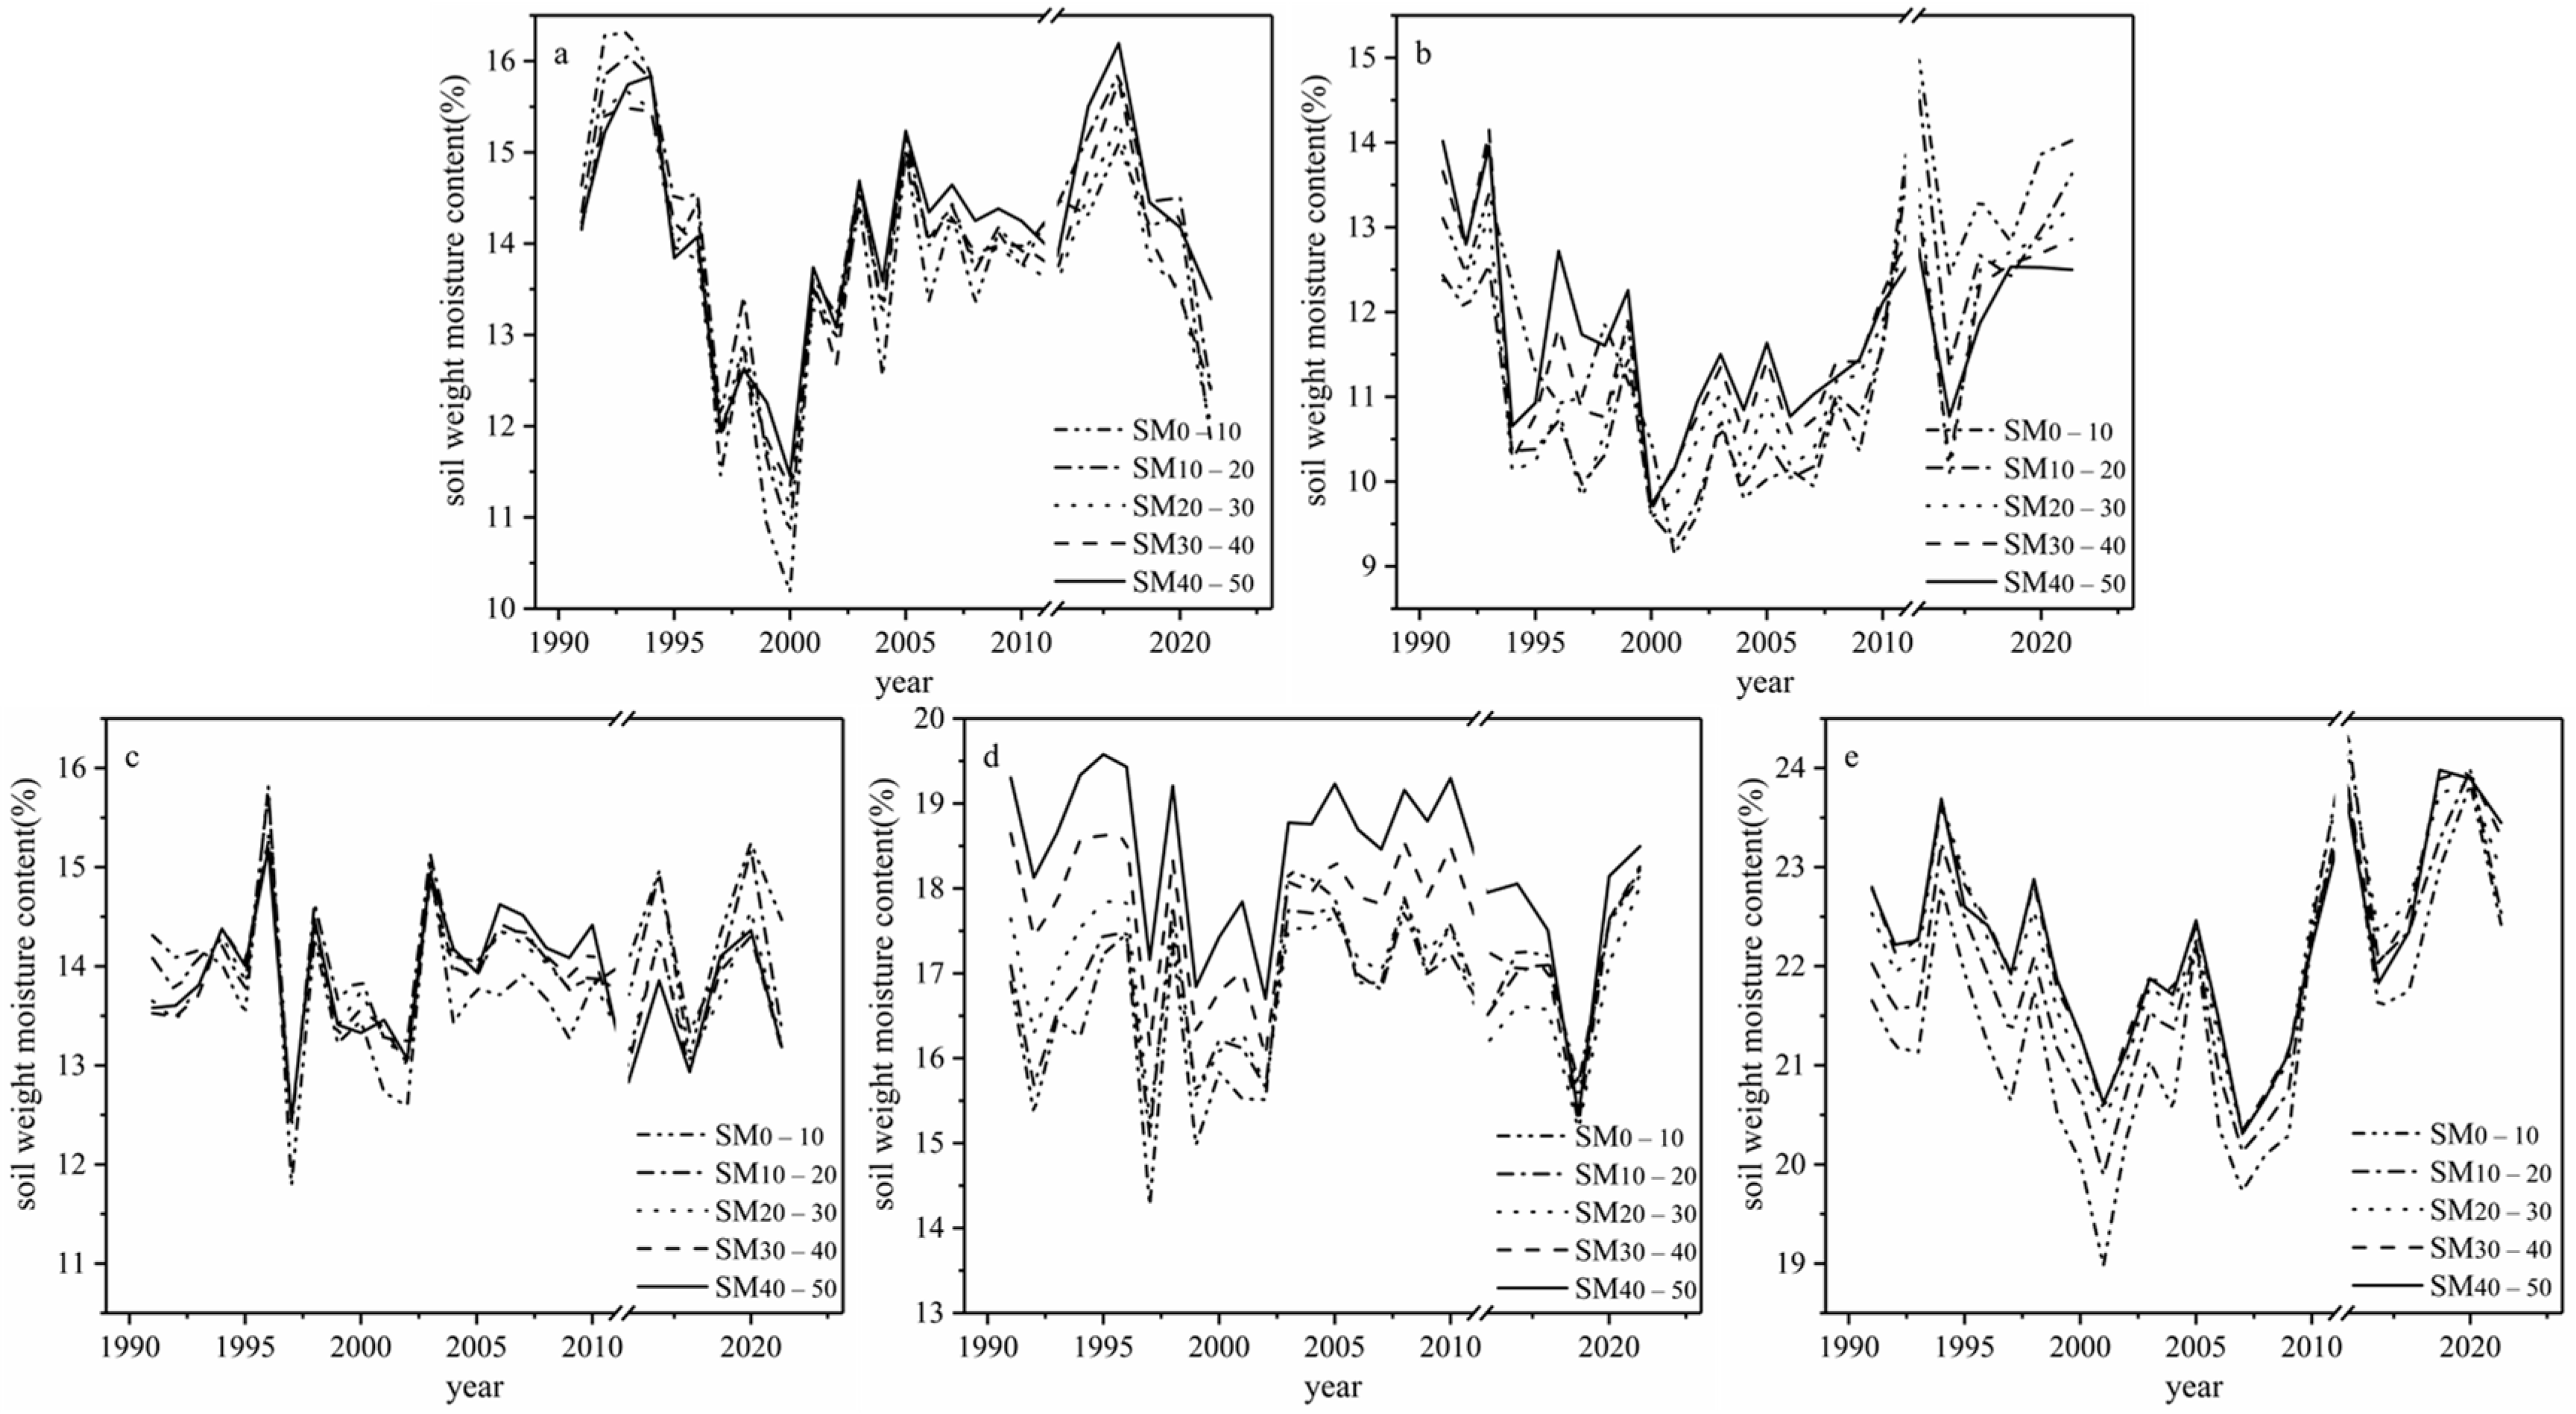
3.2. Temporal Variation of Soil Moisture

Soil drying and wetting changes in the northern agricultural regions of China are regionalized, polarized, and discontinuous (Figure 3). The soil drying trend is more significant, especially in the central-western part of IM, north-central NE China, Northern LP, and southern Xinjiang, with a maximum climate tendency rate of −4.7%·10a−1. At the same time, in northwestern Xinjiang, Qinghai, Gansu, southern Shanxi, the eastern part of IM, and some parts of H-H-H, the soil shows a trend toward wet, and the climate tendency rate reaches 6–9%·10a−1 at some stations. H-H-H is affected by a combination of climate warming, precipitation, and human activities, such as Tai’an and Zibo becoming dry, while Tongzhou and Linyi gradually get wet. From the change of soil moisture in the middle layer, soil moisture in the H-H-H region decreases more significantly than the surface layer. For agrometeorological stations where all layers are significantly drier, such as Shache, Linhe, Hequ, Jiexiu, and Liaoyuan, extra attention should be paid to the adverse effects of long-term soil drying on agriculture. In addition, coastal regions have the least variation in soil moisture, which may be more significantly regulated by the ocean. Affected by the Asian monsoons, coastal regions experience abundant rainfall during monsoon periods, especially in summer and autumn. A large amount of precipitation leads to high soil moisture, which helps maintain a smaller fluctuation of soil moisture variation.
Because of the large scale of the study area, the spatial–temporal analysis of soil moisture was carried out in five agricultural ecological regions in Northern China. The interannual variation characteristics of soil moisture in each sub-region have some regional and periodic changes (Figure 4). At the end of the 20th century, soil moisture decreased rapidly and reached its lowest value around 2000. Subsequently, soil moisture in the northwest and northeast slowly increased and then fluctuated and decreased, while soil moisture in IM began to slowly increase after 2000. The trough values of soil moisture in each region occurred in 1997, 2000, 2007, and 2021, and the peak values appeared in 1998, 2016, 2018, and 2020, among which the H-H-H and LP were the most significant in 1997 and 2018, while the NW, NE, and IM regions appeared more significantly in 2000 and 2016, with the climatic characteristics of the corresponding years are closely related. The peaks and valleys in the soil moisture series occurred at the same time as those in the precipitation series. In addition, soil moisture in LP was relatively stable for the last 40 years, while interannual fluctuations in soil moisture are greatest in the H-H-H due to agricultural production and monsoon rainfall. Overall, the interannual fluctuations of soil moisture in the five major agro-ecological regions gradually decreased with increasing soil layer, but in recent years, the surface soil moisture in IM and the LP showed the phenomenon that the surface moisture is higher than the middle layer. In IM, due to the low precipitation and high evapotranspiration, precipitation is consumed by evaporation before it can percolate down to 20 cm. Although the climate in the LP region is generally rainy and hot in the same season, the seasonal drought in summer is also very significant and is mainly compensated by precipitation. Furthermore, groundwater is buried deeper, which is likely to result in the consequences of the over-utilization of water stored in the deep soil by plants and difficulty in compensation. Attention should also be paid to the problem of soil erosion caused by high surface runoff [13].

3.3. Driving Factors of Soil Moisture

For surface soil moisture (0–10 cm), SM was positively partially correlated with P at most stations (Figure 5). In the eastern monsoon region of China, where rain and heat coincide, soil moisture is significantly influenced by precipitation factors, and the partial correlation coefficients in most areas range from 0.6 to 0.9. SM is negatively partially correlated with T in most regions, and the partial correlation coefficients ranging from −0.3 to −0.6. W is an important factor affecting evapotranspiration and indirectly acting on SM. SM has a weak positive partial correlation with RH, while SM has a negative partial correlation with SD. RH is a necessary factor for precipitation formation, and the longer RH is maintained at a high level, the less SM is lost. Sunlight mainly affects the amount of evapotranspiration; the more abundant the sunlight, the higher the physiological activity of crops, the more water consumption via transpiration, and the lower the SM. Compared with the surface layer, the partial correlation between soil moisture and each meteorological factor in the middle layer (40–50 cm) was weaker than that in the surface layer, with RH being the most obvious.
The above analyses indicate that precipitation was the dominant factor that affected the spatiotemporal patterns of soil moisture trends. However, the impacts of temperature should not be neglected, as it also plays an important role in regulating soil moisture. For some regions in the northern parts with less precipitation, the regulating role of temperature was especially important. Compared with the surface layer, SM in the middle layer was consistent with the surface layer (Figure 6). Most of the regions showed a negative partial correlation between SM and T, SD, and a significant positive partial correlation between SM and P, RH. In the northwest, some stations showed a weak negative correlation between P and SM. The middle layer SM was more regulated by the upper layer SM, and the partial correlation with each meteorological factor was weaker than that of the surface layer, with RH being the most obvious. The deeper the soil layer, the farther it is from the atmospheric hydrothermal effect and the less it is influenced by the driving factors.
There were regional differences in the driving factors of soil moisture in Northern China (Table 2). The partial correlation between soil moisture and each meteorological element was weak in both IM and LP. Except for IM, soil moisture was positively partially correlated with P in all regions, and the partial correlation coefficient was the largest in the H-H-H, reaching 0.758; the significant partial correlation with W was in the northwest and northeast, where the SM in the northwest was significantly negatively partially correlated with W, reaching −0.693 in the surface layer, while the SM in the northeast was positively partial with W, with the maximum value occurring in the middle layer of the soil, with a partial correlation coefficient of 0.525; T has a significant impact on SM in the NE and H-H-H, with the NE region being the most significant on the surface, reaching −0.528. The H-H-H region appeared in the middle layer, reaching 0.526. Overall, the partial correlation between the middle layer of the soil and the meteorological elements was less than that of the surface layer. The influence of RH and SD on soil moisture was smaller in all regions, with the value of the partial correlation coefficient generally lower than 0.3.

4. Discussion

4.1. Spatial Distribution of Soil Moisture

Land–atmosphere coupling is important to regional climate and weather prediction. Changes in soil moisture are the result of long-term interaction of the land–atmosphere system, and summer precipitation is an important factor affecting soil moisture in most northern regions. The sensitivity experiment conducted by Rowntre et al. [26] showed that dry soils are conducive to atmospheric temperature but detrimental to precipitation and that the feedback mechanism between soil moisture and precipitation plays an important role in short-term climate prediction. Similarly, temperature changes generated by soil moisture variation can significantly affect near-surface climate and are closely related to extreme heat and heat wave events. Low SM will lead to an increase in land surface sensible heat flux and, thus, a rise in land surface temperature. Then, the increased land surface temperature further accelerates land surface evaporation, leading to lower SM [27]. According to the IPCC Sixth Assessment Report, the global surface temperature was 1.09 °C higher in 2011–2020 than in 1850–1900 [28]. The Bluebook on Climate Change in China (2022) shows that from 1961 to 2021, the average annual precipitation increased at a rate of 5.5 mm per decade from 1961 to 2021 in China, with significant inter-annual variability. They concluded that the variation trends and intensity of SW changed notably over arid and semi-arid regions (north of 35 N) [29,30].
The spatial distribution of soil moisture increased gradually from Northwest to Southeast, and the soil moisture in the NE and H-H-H is generally at a high level but with large inter-annual fluctuations. The driving factors of soil moisture in the H-H-H region are complicated because of climate change and human activities. The direct effects of cropping patterns, crop types, fallow fertilization, and irrigation on soil moisture cannot be ignored, and high-intensity agricultural activities can also exacerbate drought in northern agricultural regions in China [29,30]. However, with more efficient agro-meteorological services and improved irrigation levels, SM has started to rise in recent years. For example, Dingxi, in central Gansu, uses farmland catchment irrigation (promoting sprinkler and drip irrigation techniques), ground-film cover, small watershed management, and other techniques to realize the efficient use of precipitation in China’s semi-arid zones. Intensive human activities broke the water–energy balance in many regions and led to climate change. The rational regulation of soil hydrothermal processes is the core of sustainable land management. Moreover, SW at the 0~10 cm depth fluctuated more and varied randomly than the other two depths. This was reasonable because surface soil was exposed to solar radiation and influenced by atmospheric conditions [30].

4.2. The Reasons for Soil Moisture Change

Combined with the spatial distribution and spatial–temporal variation characteristics of soil moisture, it was found that soil moisture in NE China, the LP region, and the H-H-H region was generally at a relatively high level but fluctuated greatly with time and season. In NE China, soil moisture in some local areas showed an obvious trend of drying over the last 40 years, which was consistent with the other research [31]. Soil moisture can be seen as the result of a combined balance between precipitation and subsequent evaporation from the soil and transpiration from plants (i.e., evapotranspiration), and potential evapotranspiration in the north-central part of NE China has been rising year by year, causing soil moisture to decrease [32]. In contrast, northern Xinjiang started to become wetter, such as in Yili, Altay, and Shawan County, which is consistent with the results of this study [33]. The source of water vapor in northern Xinjiang is complex; most of it comes from the North Atlantic Ocean and the Mediterranean–Black Sea–Caspian Sea–Aral Sea line, and the temperature variation in this region is mainly controlled by the seasonal variation of solar radiation. Some studies pointed out that droughts in northern, southern, and eastern Xinjiang, as well as in the Tianshan Mountains, were generally increasing before 2008 and then weakened after 2008 [34]. Maybe the changes in soil moisture after 2008 need to be explained individually. However, soil moisture monitoring stations in Xinjiang are relatively scarce, and further research should include more stations and a longer data time series.

4.3. The Correlation between Soil Moisture and Driving Factors

The combined effects of multiple influencing factors, such as land use (vegetation, topography, etc.), meteorological factors (precipitation, air temperature, wind speed, sunshine hours, relative humidity, etc.), and soil properties, result in temporal and spatial changes in soil moisture. Soil moisture retention, diffusion, and loss can all be impacted by rising air temperatures [35].
Precipitation can increase atmospheric relative humidity and soil moisture, while sunshine hours and wind speed can influence solar radiation and the evaporation of soil moisture. Changes in sunshine hours have a significant impact on soil moisture, affecting both the maintenance and movement of soil moisture [36,37].
It is difficult to sort out the positive and negative effects of wind speed on soil moisture. Wind speed is another important factor affecting non-precipitating moisture. Moderate wind speeds help to spread water vapor from the surface layer to the surface, keeping the surface with relatively high water vapor; they are also conducive to the transfer of heat fluxes from the surface to the atmosphere, keeping the surface at a lower temperature, which is conducive to dew formation. If the wind speed is too high, it will increase evapotranspiration and make the surface layer lose water vapor, which is not conducive to the formation of dew but is conducive to moisture adsorption [34]. Therefore, the correlation might be more accurate if the study area is refined in the future.

4.4. Future Prospects and Recommendations

In addition, the continuous monitoring of regional soil moisture is still challenging, and traditional soil moisture monitoring methods can only collect information at the site scale, which makes it difficult to meet objective and real-time monitoring of soil moisture in large regions. In the future, it is still necessary to strengthen the construction of automatic soil moisture observation stations in agricultural regions and adopt multi-source data fusion technology to grid soil moisture data nationwide to enhance the usefulness of the data. And it would take considerable research to identify the mechanism of soil moisture change for the agricultural regions in Northern China. Soil moisture variation accompanies agricultural activities. The mechanism of soil moisture change and regional hydrological cycle change, as well as the effect of human activities on this process, still calls for further study.

5. Conclusions

Using soil moisture data measured at 150 agricultural agro-meteorological stations in Northern China, linear regression, partial correlation analysis, and geostatistical analysis methods were adopted to explore the spatiotemporal variation patterns of soil moisture and analyze its driving factors. The following conclusions can be drawn.
  • The average annual value of soil weight moisture during the growing season in Northern China ranged from 4.7% to 36% from 1980 to 2021 and increased from northwest to southeast, with the highest soil moisture in the NE and the Huang-H-H regions and the lowest soil moisture in the central and western IM and the arid NW region.
  • In general, soil moisture decreased in the northern regions, among which south-central Xinjiang, western IM, north-central parts of NE China, and the northern LP region decreased significantly with a rate of 2.5~4.7% (10a−1). However, surface soil moisture in the southern Huang-Huai-Hai, southern Gansu and southeastern Qinghai, and eastern IM showed an increasing trend.
  • Soil moisture was positively affected by P and RH and negatively affected by T and SD by means of partial correlation. Moreover, soil moisture had a strong partial correlation with P, followed by T. From a regional point of view, soil moisture was significantly affected by water and heat in the NE and Huang-Huai-Hai regions and influenced mostly by W in the Northwest region.

Author Contributions

Methodology, J.C.; software, J.C.; investigation, B.Z. and X.W.; validation, S.C.; data curation, F.W., Z.C., S.Y. and X.M.; writing—original draft preparation, J.C.; writing—review and editing, D.W. All authors have read and agreed to the published version of the manuscript.

Funding

This research was funded by the Natural Science Foundation of Anhui province, grant number 2208085QD120, and Talent Funding of Anhui Agricultural University, grant number rc522111.

Data Availability Statement

The data that support the findings of this study are available upon request from the corresponding author [D.W.].

Conflicts of Interest

The authors declare no conflicts of interest.

References

  1. Berg, A.; Sheffield, J. Climate change and drought: The soil moisture perspective. Curr. Clim. Change Rep. 2018, 4, 180–191. [Google Scholar] [CrossRef]
  2. Morgenroth, J.; Buchan, G.; Scharenbroch, B.C. Belowground effects of porous pavements—Soil moisture and chemical properties. Ecol. Eng. 2013, 51, 221–228. [Google Scholar] [CrossRef]
  3. Daba, M.H.; Bazi, Z.; Belay, A. Effects of climate change on soil and water resources: A review. J. Environ. Earth Sci. 2018, 8, 71–80. [Google Scholar]
  4. Deng, X.P.; Shan, L.; Zhang, H.; Turner, N.C. Improving agricultural water use efficiency in arid and semiarid areas of China. Agric. Water Manag. 2006, 80, 23–40. [Google Scholar] [CrossRef]
  5. Sun, S.; Wang, Y.; Engel, B.A.; Wu, P. Effects of virtual water flow on regional water resources stress: A case study of grain in China. Sci. Total Environ. 2016, 550, 871–879. [Google Scholar] [CrossRef]
  6. Berg, P.; Moseley, C.; Haerter, J.O. Strong increase in convective precipitation in response to higher temperatures. Nat. Geosci. 2013, 6, 181–185. [Google Scholar] [CrossRef]
  7. Riedel, T.; Weber, T.K. The influence of global change on Europe’s water cycle and groundwater recharge. Hydrogeol. J. 2020, 28, 1939–1959. [Google Scholar] [CrossRef]
  8. Hu, Z.Y.; Zhou, J.J.; Zhang, L.L.; Wei, W.; Cao, J.J. Climate dry-wet change and drought evolution characteristics of different dry-wet areas in northern China. Acta Ecol. Sin. 2018, 38, 1908–1919. [Google Scholar]
  9. Huang, J.; Ji, M.; Xie, Y.; Wang, S.; He, Y.; Ran, J. Global semi-arid climate change over last 60 years. Clim. Dyn. 2016, 46, 1131–1150. [Google Scholar] [CrossRef]
  10. Li, M.; Ma, Z.; Niu, G.Y. Modeling spatial and temporal variations in soil moisture in China. Chin. Sci. Bull. 2011, 56, 1809–1820. [Google Scholar] [CrossRef]
  11. Wang, A.; Lettenmaier, D.P.; Sheffield, J. Soil moisture drought in China, 1950–2006. J. Clim. 2011, 24, 3257–3271. [Google Scholar] [CrossRef]
  12. Zhu, P.; Jia, X.; Zhao, C.; Shao, M. Long-term soil moisture evolution and its driving factors across China’s agroecosystems. Agric. Water Manag. 2022, 269, 107735. [Google Scholar] [CrossRef]
  13. Bai, W.; Chen, X.; Tang, Y.; He, Y.; Zheng, Y. Temporal and spatial changes of soil moisture and its response to temperature and precipitation over the Tibetan Plateau. Hydrol. Sci. J. 2019, 64, 1370–1384. [Google Scholar] [CrossRef]
  14. Setia, R.; Pandey, D.K.; Putrevu, D.; Misra, A.; Pateriya, B. Soil moisture retrieval techniques using satellite remote sensing. Geospat. Technol. Crops Soils 2021, 357–385. [Google Scholar]
  15. Yao, X.L.; Jiang, Q.; Liu, Y.; Li, L.Y.; Wang, Q.Y.; Yu, J.S. Spatiotemporal variation of soil moisture in Northern China based on climate change initiative data. Agron. J. 2021, 113, 774–785. [Google Scholar] [CrossRef]
  16. Lu, X.J.; Huang, Y.H.; Yan, H.B.; Wu, C.L.; Luo, L.; Zhou, B. Temporal and Spatial Variation of Soil Moisture in China Based on Smap Data. Int. Arch. Photogramm. Remote Sens. Spat. Inf. Sci. 2020, 42, 775–781. [Google Scholar] [CrossRef]
  17. Petropoulos, G.P.; Ireland, G.; Barrett, B. Surface soil moisture retrievals from remote sensing: Current status, products future trends. Phys. Chem. Earth Parts A/B/C 2015, 83, 36–56. [Google Scholar] [CrossRef]
  18. Li, Z.L.; Leng, P.; Zhou, C.; Chen, K.S.; Zhou, F.C.; Shang, G.F. Soil moisture retrieval from remote sensing measurements: Current knowledge and directions for the future. Earth-Sci. Rev. 2021, 218, 103673. [Google Scholar] [CrossRef]
  19. Li, M.; Ma, Z. Soil moisture-based study of the variability of dry-wet climate and climate zones in China. Chin. Sci. Bull. 2013, 58, 531–544. [Google Scholar] [CrossRef]
  20. Houser, P.R.; Shuttleworth, W.J.; Famiglietti, J.S.; Gupta, H.V.; Syed, K.H.; Goodrich, D.C. Integration of soil moisture remote sensing and hydrologic modeling using data assimilation. Water Resour. Res. 1998, 34, 3405–3420. [Google Scholar] [CrossRef]
  21. Walker, J.P.; Willgoose, G.R.; Kalma, J.D. In situ measurement of soil moisture: A comparison of techniques. J. Hydrol. 2004, 293, 85–99. [Google Scholar] [CrossRef]
  22. Liang, L.; Zhao, S.H.; Qin, Z.H.; He, K.X.; Chong, C.H.E.N.; Luo, Y.X.; Zhou, X.D. Drought change trend using MODIS TVDI and its relationship with climate factors in China from 2001 to 2010. J. Integr. Agric. 2014, 13, 1501–1508. [Google Scholar] [CrossRef]
  23. Pandey, V.; Pandey, P.K. Spatial and temporal variability of soil moisture. Int. J. Geosci. 2010, 1, 87. [Google Scholar] [CrossRef]
  24. Shen, Q.; Wang, Y.; Wang, X.; Liu, X.; Zhang, X.; Zhang, S. Comparing interpolation methods to predict soil total phosphorus in the Mollisol area of Northeast China. Catena 2019, 174, 59–72. [Google Scholar] [CrossRef]
  25. Yao, J.; Zhao, Y.; Yu, X. Spatial-temporal variation and impacts of drought in Xinjiang (Northwest China) during 1961–2015. PeerJ 2018, 6, e4926. [Google Scholar] [CrossRef] [PubMed]
  26. Rowntree, P.R.; Bolton, J.A. Simulation of the atmospheric response to soil moisture anomalies over Europe. Q. J. R. Meteorol. Soc. 1983, 109, 501–526. [Google Scholar] [CrossRef]
  27. Seneviratne, S.I.; Corti, T.; Davin, E.L.; Hirschi, M.; Jaeger, E.B.; Lehner, I.; Orlowsky, B.; Teuling, A.J. Investigating soil moisture-climate interactions in a changing climate: A review. Earth Sci. Rev. 2010, 99, 125–161. [Google Scholar] [CrossRef]
  28. IPCC. Climate Change 2021: The Physical Science Basis. Contribution of Working Group I to the Sixth Assessment Report of the Intergovernmental Panel on Climate Change; Cambridge University Press: Cambridge, MA, USA, 2021. [Google Scholar]
  29. Liu, M.; Guo, Y.; Wang, Y.; Hao, J. Changes of Extreme Agro-Climatic Droughts and Their Impacts on Grain Yields in Rain-Fed Agricultural Regions in China over the Past 50 Years. Atmosphere 2021, 13, 4. [Google Scholar] [CrossRef]
  30. Chen, X.; Li, Y.; Chau, H.W.; Zhao, H.; Li, M.; Lei, T.; Zou, Y. The spatiotemporal variations of soil water content and soil temperature and the influences of precipitation and air temperature at the daily, monthly, and annual timescales in China. Theor. Appl. Climatol. 2020, 140, 429–451. [Google Scholar] [CrossRef]
  31. Gao, G.; Chen, D.; Xu, C.Y.; Simelton, E. Trend of estimated actual evapotranspiration over China during 1960–2002. J. Geophys. Res. Atmos. 2007, 112, D11. [Google Scholar] [CrossRef]
  32. Han, G.; Wang, J.; Pan, Y.; Huang, N.; Zhang, Z.; Peng, R.; Pan, Z. Temporal and spatial variation of soil moisture and its possible impact on regional air temperature in China. Water 2020, 12, 1807. [Google Scholar] [CrossRef]
  33. Cong, D.; Zhao, S.; Chen, C.; Duan, Z. Characterization of droughts during 2001–2014 based on remote sensing: A case study of Northeast China. Ecol. Inform. 2017, 39, 56–67. [Google Scholar] [CrossRef]
  34. Li, H.; Yin, Y.; Zhou, J.; Li, F. Improved Agricultural Drought Monitoring with an Integrated Drought Condition Index in Xinjiang, China. Water 2024, 16, 325. [Google Scholar] [CrossRef]
  35. Qiu, G.; Ben-Asher, J. Experimental determination of soil evaporation stages with soil surface temperature. Soil Sci. Soc. Am. J. 2010, 74, 13–22. [Google Scholar] [CrossRef]
  36. Cho, E.; Choi, M. Regional scale spatio-temporal variability of soil moisture and its relationship with meteorological factors over the Korean peninsula. J. Hydrol. 2014, 516, 317–329. [Google Scholar] [CrossRef]
  37. Hao, X.M.; Li, C.; Guo, B.; Ma, J.X.; Ayup, M.; Chen, Z.S. Dew formation and its long-term trend in a desert riparian forest ecosystem on the eastern edge of the Taklimakan Desert in China. J. Hydrol. 2012, 472–473, 90–98. [Google Scholar] [CrossRef]
Figure 1. Locations of the five agro-ecological zones and the distribution of 164 agro-meteorological stations.
Water 16 00556 g001
Figure 2. Spatial distribution of soil moisture within 0~10 cm (a), 20~30 cm (b), and 40~50 cm (c).
Water 16 00556 g002
Figure 3. Trend variation of soil moisture in the 0–10 cm (a), 20~30 cm (b), and 40–50 cm (c) layers.
Water 16 00556 g003
Figure 4. Temporal variation characteristics of soil moisture at different layers in major agricultural regions in Northern China ((a): NW; (b): IM; (c): LP; (d): HHH; (e): NE).
Water 16 00556 g004
Figure 5. Partial correlation between soil moisture within 0–10 cm and different meteorological factors. ((a): T; (b): W; (c): RH; (d): SD; (e): P) in Northern China.
Water 16 00556 g005
Figure 6. Partial correlations of soil moisture at 40–50 cm with different meteorological factors. ((a): T; (b): W; (c): RH; (d): SD; (e): P) in Northern China.
Water 16 00556 g006
Table 1. Overview of the five major agro-ecological zones.
Agro-Ecological RegionProvinceMain CropsAnnual PrecipitationAnnual TemperatureArid and Humid Climate Region
NorthwestXinjiang, Qinghai, GansuSpring wheat, cotton<200 mm5~14 °CArid and semi-arid region
NortheastHeilongjiang, Liaoning, JilinSpring wheat, sugar beet500~700 mm−2~10 °CHumid and semi-humid region
Huang-Huai-HaiHebei, Beijing, Tianjin, Shandong, Jiangsu, AnhuiWinter wheat, summer maize500~950 mm8~15 °CHumid and semi-humid region
Inner MongoliaInner MongoliaSpring wheat, soybeans50~450 mm−1~10 °CArid and semi-arid region
Loess PlateauShanxi, ShanxiSpring wheat, soybeans400~600 mm6~14 °CArid and semi-arid region
Table 2. Partial correlation between soil moisture and meteorological elements in each region.
RegionMeteorological FactorsSoil Layers
0~10 cm10~20 cm20~30 cm30~40 cm40~50 cm
Northwest ChinaT−0.310−0.260−0.387−0.322−0.378
W−0.693 *−0.596 **−0.594 **−0.536 *−0.587 *
RH−0.254−0.209−0.266−0.234−0.337
SD0.3360.3340.2900.2840.322
P0.640 **0.624 **0.649 **0.597 **0.623 **
Inner MongoliaT−0.039−0.0380.017−0.111−0.154
W−0.010−0.136−0.224−0.251−0.209
RH−0.080−0.274−0.252−0.244−0.160
SD−0.223−0.315−0.243−0.188−0.114
P0.2800.3040.2800.1930.139
Loess PlateauT−0.407−0.211−0.214−0.190−0.247
W0.124−0.207−0.292−0.290−0.382
RH0.2430.2390.1130.054−0.036
SD0.2620.3530.2400.0970.062
P0.438 *0.4220.4000.3690.393 *
Huang-Huai-HaiT−0.235 *−0.081−0.455 *−0.496 *−0.526 *
W0.1480.2020.029−0.276−0.324
RH−0.0650.1810.1580.1680.133
SD0.0450.1110.2240.2910.441 *
P0.758 **0.762 **0.716 **0.645 **0.616 **
Northeast ChinaT−0.528 *−0.530 *−0.534 *−0.476 *−0.407
W0.4210.4230.512 *0.556 *0.525 *
RH0.1600.0690.0930.2160.224
SD−0.285 *0.3530.2400.0970.062
P0.680 **0.628 **0.653 **0.624 **0.597 **
Note: ** is p = 0.01 significant level, * is p = 0.05 significant level.
Disclaimer/Publisher’s Note: The statements, opinions and data contained in all publications are solely those of the individual author(s) and contributor(s) and not of MDPI and/or the editor(s). MDPI and/or the editor(s) disclaim responsibility for any injury to people or property resulting from any ideas, methods, instructions or products referred to in the content.

