Article

Representing Hourly Energy Prices in a Large-Scale Monthly Water System Model

1
Department of Civil Engineering, Aksaray University, Aksaray 68100, Türkiye
2
Department of Civil and Environmental Engineering, University of California, Davis, One Shields Avenue, Davis, CA 95616, USA
*
Author to whom correspondence should be addressed.
Water 2024, 16(4), 562; https://doi.org/10.3390/w16040562
Submission received: 22 December 2023 / Revised: 3 February 2024 / Accepted: 6 February 2024 / Published: 12 February 2024
(This article belongs to the Topic Hydroelectric Power)

Abstract

:
Water system management models represent different purposes, such as water supply, flood control, recreation, and hydropower. When building large-scale system models to represent these diverse objectives, their most appropriate time steps for each purpose often do not coincide. A monthly time step is usually sufficient for water supply modeling, but it can be too coarse for flood control, hydropower, and energy operations, where hourly time steps are preferred. Large-scale water management and planning models mostly employ monthly time steps, but using monthly average energy prices underestimates hydropower revenue and overestimates pumping energy cost because these plants tend to operate during times with above- or below-average energy prices within any month. The approach developed here uses hourly varying prices depending on the percent of monthly operating hours. This paper examines an approach that approximately incorporates hourly energy price variations for hydropower and pumping into large-scale monthly time-step water system model operations without affecting water delivery results. Results from including hourly varying energy prices in a large-scale monthly water supply model of California (CALVIN) are presented. CALVIN is a hydroeconomic linear programming optimization model that allocates water to agricultural and urban users with an objective to minimize total scarcity costs, operating costs, and hydropower revenue loss. Thirteen hydropower plants are modeled with hourly varying prices, and their revenue increased by 25 to 58% compared to revenue calculated with monthly average constant energy prices. Hydropower revenue improvements are greater in critically dry years. For pumping plants modeled with hourly varying prices, the energy use cost decreased by 10 to 59%. This study improves system representation and results for large-scale modeling.

1. Introduction

Computer models help operators and policymakers explore and compare management alternatives, better operate complex water resources systems, and predict the future performance of existing or proposed decisions and conditions [1]. Model use can increase the benefits or decrease the costs of managing water for wide-ranging purposes, such as agricultural, urban, and wildlife water supply; hydropower; flood control; recreation; and navigation [2,3,4]. Yeh [5], Wurbs [6], and Labadie [7] reviewed water resource system models, including simulation and optimization models, ranging from small- to large-scale. Integrated river basin management models provide a framework for more efficiently managing scarce water among users, at different locations and times, considering economic and hydrologic variables [8,9]. Davis [10] defines integrated water management as a facilitated stakeholder process to promote coordinated activities in pursuit of common objectives for better development and management. Marques and Tilmant [11] point out that operational coordination is critical to maintain and increase system-wide benefits under uncertain conditions in multireservoir water systems. Li et al. [12] reviewed uncertainties in integrated simulation–optimization modeling.
Many methods are available in water resource modeling. However, energy prices are often omitted or greatly simplified compared to other parameters. Several studies explicitly address energy price representation [13,14,15], which is especially important for hydropower and pumping operations. Models exist for simulating energy market operations [16,17,18,19], but they often are not integrated with water system models, or their integration with complex water models is computationally difficult, isolating market price models from water system models. Additionally, the availability of hourly input data often limits the explicit representation of energy prices in many places.
Water resource system models use different time scales, varying from fractions of an hour to annual. Short-term models have hourly to daily time steps. Time steps for long-term models range from weekly to annual. Long-term models can be useful for short-term models by providing preliminary promising solution regions [20,21]. Hourly or shorter-peak and off-peak times and energy value rates are important for hydropower decisions and pumping plant operations. Short-term models, with hourly time steps and time horizons of a few days, can directly represent hourly price variations in their operations. Long-term models rarely use hourly time steps due to computational demands; instead, monthly time steps are preferred. However, using monthly average energy prices for long-term planning and management often underestimates hydropower values [15] and overestimates pumping costs. This is because, with economically optimal operations, reservoirs with an afterbay operate during the most economically advantageous hours [13], the so-called peak hours. Similarly, pumping plants with a forebay or afterbay operate during off-peak hours, when energy prices are lower.
Hourly price variations can be represented with an implicit method that uses different prices depending on capacity use [15]. The method assumes that to maximize revenue, a hydropower plant with reservoir storage and an afterbay allocates hydropower releases preferentially to peak price times, when energy demand and prices are highest [22]. The reservoir operator is assumed to have good short-term foresight of energy prices, allowing revenue-maximizing releases during peak times. Energy prices are exogenous, so the operator cannot influence them. Tejada-Giubert et al. [13] used such a method to maximize the Central Valley Project energy revenue. A monthly capacity factor for each plant is assigned to the price duration curve factors, assuming each plant can be dispatched and operated during the most economically valued hours in a month.
Using variable energy prices, rather than constant prices, increases overall hydropower revenue. Olivares and Lund [15] studied the representation of energy prices in long- and medium-term hydropower operations. Their model, focusing on a single reservoir, relates hourly energy prices with the proportion of monthly hours available for energy generation. Hourly varying prices are estimated with a moving average method, a function of the percentage volume allocation. Madani and Lund [14] used energy prices that vary with the number of hours of operation in a suite of optimization models for California’s high-elevation hydropower plants. The model assumes that a power plant will prioritize releasing water during high-valued times of the month. It only releases water during lower-valued times when water is abundant, if the objective is solely hydropower operation. These studies concluded that there is a great benefit of incorporating hourly energy price variations in long-term models. Former studies focused on regional hydropower modeling with small reservoir storage capacities or with a limited number of large-scale reservoirs with hourly price variations. The effects of hourly price variations on pumping operations have not been studied.
This study presents an implicit incorporation of hourly energy price variations in a large-scale long-term model of California’s extensive water supply system, CALVIN, that uses monthly time steps over an 82-year hydrologic record. CALVIN is useful for planning, management, and policy studies [23,24]. It integrates and economically optimizes reservoir, power plant, pumping plant, and other water supply operations. The method used here is similar to earlier hydropower studies, except at a much larger scale. Also, hourly varying energy prices are applied to pumping operations with a few modifications to the method. CALVIN is operated with both constant and hourly varying energy prices. Generation, revenue, and agricultural and urban water scarcity results are compared to assess the most effective representation of prices for long-term, multi-purpose modeling.

2. Materials and Methods

2.1. CALVIN Hydroeconomic Model

CALVIN (CALifornia Value Integrated Network) is a hydro-economic deterministic optimization model for California’s inter-tied water supply and delivery system [23]. CALVIN represents California’s water infrastructure with 49 surface reservoirs, 38 groundwater reservoirs, 600+ conveyance links, 1250+ nodes, and 36 agricultural, 41 urban and 8 wildlife refuge water demand areas, where the full-size model has more than 5 million decision variables. The CALVIN model covers about 88 percent of California’s irrigated acreage and 92 percent of the state’s urban population. Prescribed CALVIN operations are based on 82 years of historical data to represent hydrologic variability. CALVIN is a linear programming model that uses a generalized network-flow optimization, where operations are driven by convex cost-based piecewise linear penalty functions (for hydropower plants and agricultural and urban demands) or operating cost curves (for pumping and treatment plants). CALVIN operates and allocates surface and groundwater resources with deterministic hydrologic inflows under demand conditions of the year 2050, within physical and environmental constraints [23]. CALVIN is modeled with Pyomo, a high-level optimization modeling library in Python, and can connect to freely available solvers that provide a solution for the network-flow optimization problem [24]. CALVIN has an economics-driven objective, shown in Equation (1), to minimize system-wide operating costs (such as pumping and treatment) and scarcity costs to water users. Scarcity volume is defined as the amount of water that the user is willing to pay for but did not receive. Whenever a user’s target demand is not met, scarcity occurs with a cost derived from the user’s willingness to pay. The physical system is represented by a set of nodes ( N ) and links (or arcs) ( A ) in network-flow optimization, shown in Figure 1. Links are defined by ( i , j , k ) A , where i is the origin node, j is the terminal node, and k is the index of the piecewise linear component for links [24].
CALVIN’s objective function and constraints are
min z = i j k c i j k X i j k
subject to
X i j k u i j k ,   ( i , j , k ) A
X i j k l i j k ,   ( i , j , k ) A
i k X j i k = i k a i j k X i j k ,   j N
where z is a summation over all links ( i ,   j ,   k ) and represents total scarcity and operating costs. X i j k is the decision variable and represents the flow conveyed in a link. u i j k and l i j k are upper- and lower-bound constraints, respectively. a i j k is the amplitude and represents losses (<1) or reuse (>1) within the system. Equations (2)–(4) enforce upper and lower bounds on each link and mass balance on each node, respectively.
CALVIN assumes a decentralized energy market in California with hydropower as a price-taker. Each facility allocates hydropower releases during the most valuable hours while considering water scarcity costs for agricultural and urban users, as well as downstream minimum in-stream flow requirements. Hydropower and water scarcity penalty curves dictate the economically optimal release time and volume. Seasonally, it is fortunate that California’s energy and water use peaks generally coincide, reducing conflicts across these purposes.
CALVIN’s limitations include its perfect hydrologic foresight (except for Arnold [25]); the linearization of nonlinear operations, such as hydropower; and simplified environmental regulations, water quality, and stream–aquifer interaction behavior. CALVIN currently provides a minimal representation of flood control and recreation operations [23]. Despite its limitations, CALVIN can simulate various water management scenarios and offer insights for statewide and regional water policy and planning decisions.

2.2. Representing Hourly Varying Energy Prices in Monthly Models

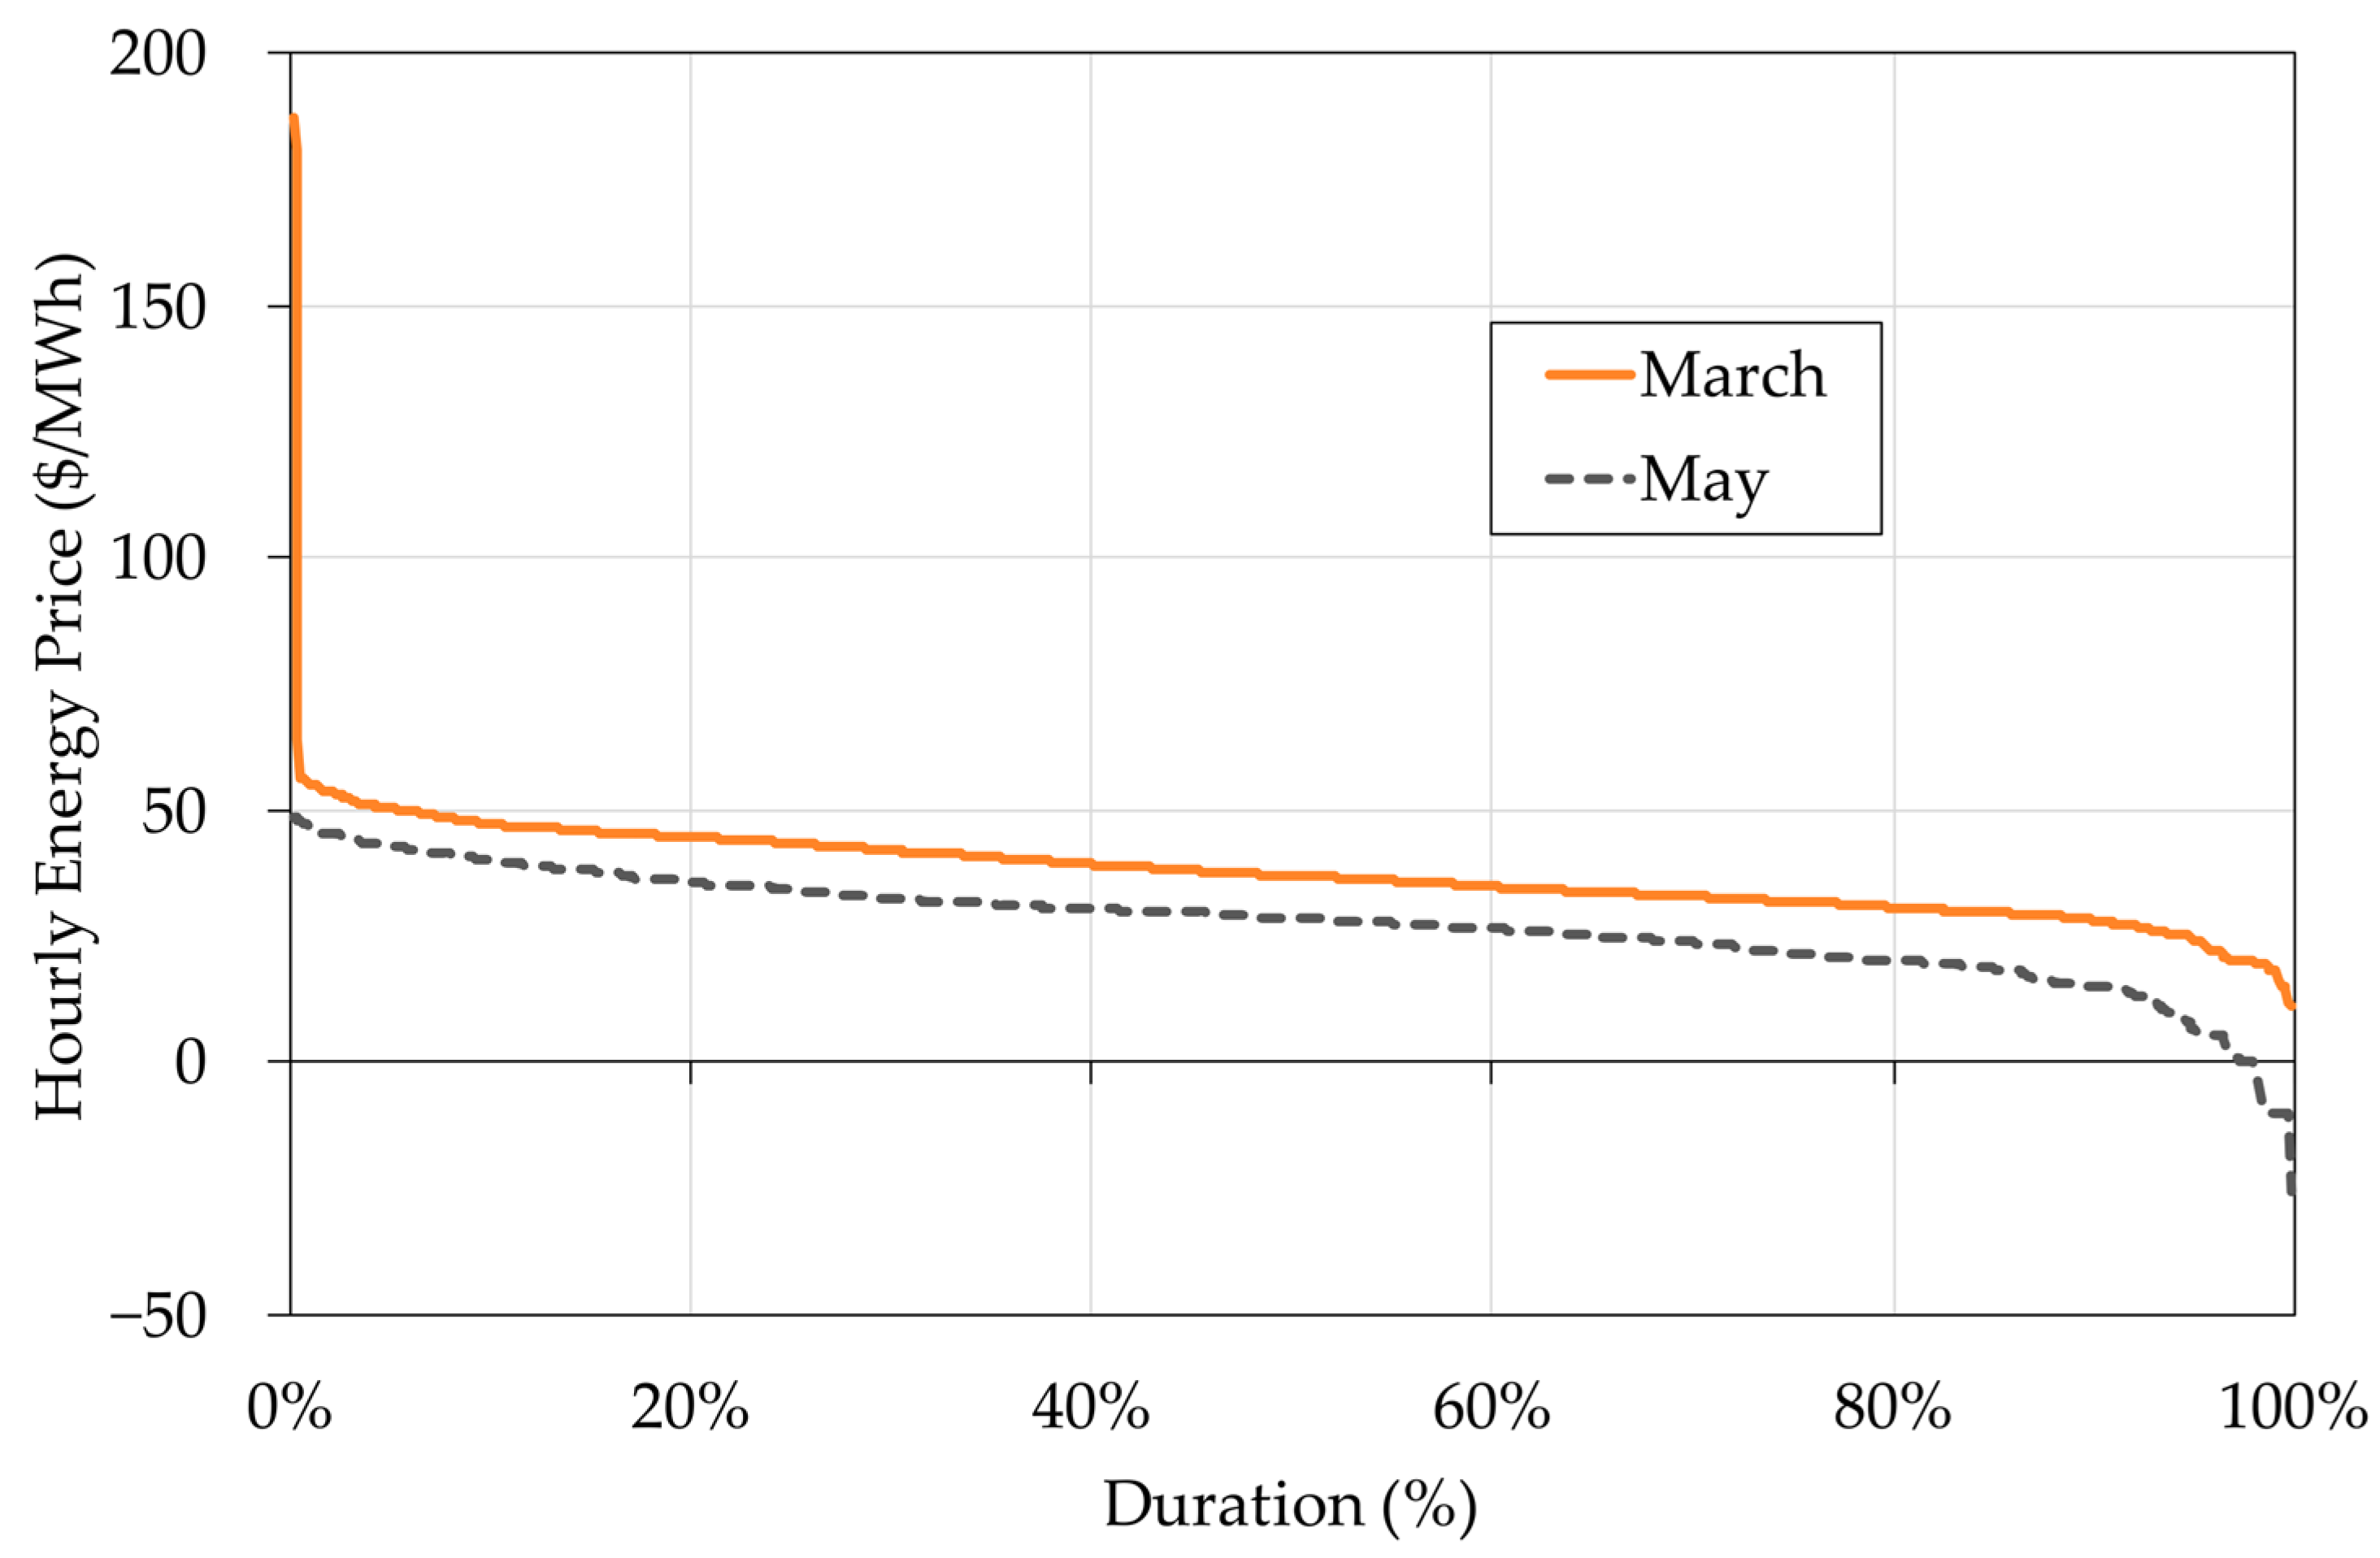
CALVIN operates explicitly to minimize statewide operating and scarcity costs. Hydropower in CALVIN is modeled using economic penalty curves, which represent the benefits lost from not generating hydropower. Hourly wholesale energy prices for the year of 2010 are obtained from the California Independent System Operator [26]. The moving average method proposed by Olivares and Lund [15] is used to represent hourly varying energy prices in the monthly model. This method relates the monthly percentage of hours of generation at turbine capacity with a price duration curve (Figure 2). Prices are averaged up to percent use. As seen in Figure 3, marginal variable energy prices decrease with increased hours of generation. This trend represents electricity market operations. Small releases have greater marginal benefits (energy prices), and as the hours of operation increase, the marginal hydropower revenue decreases, whereas the marginal revenue does not change with constant average monthly prices. For economically optimal hydropower operations with hourly varying prices, CALVIN makes small releases when the marginal energy price is high, and the lowest average price occurs when energy is generated at the monthly turbine capacity [14]. CALVIN is a deterministic model with fixed monthly price fluctuations, allocating water for maximum profitability. The total hydropower generation ( G ) in month i can be calculated as follows:
G Q i , h i = μ · γ · Q i · h i · t
where Q is the release obtained from CALVIN; h is the head, which is dynamically calculated from a polynomial function depending on reservoir storage; μ is efficiency; γ is the specific weight of water; and t is the time period.
Defining Q c a p as the plant’s turbine release capacity and G c a p = μ · γ · Q c a p · h i · t as the plant’s generation capacity, the percentage of hours of generation at full capacity ( f ) can be obtained as
f = G i G c a p
Multiplying generation ( G ) with energy prices ( P i ) yields the hydropower revenue ( B ) in month i , which can be written as
B i = P G ¯ ( f ) i · G i
C i = P P ¯ ( f ) i · E i
where P G ¯ ( f ) i is the average of all prices exceeding P ( f ) , with the price obtained from the moving average price curve (Figure 3). For the energy cost of pumping plants ( C i ) , the unit energy price ( P P ¯ ( f ) i ) , the average of all prices not exceeding P ( f ) , is multiplied with the total energy use ( E i ) .
Afterbays provide operational flexibility to large-scale reservoir operations. Several California hydropower facilities effectively use afterbays to regulate reservoir releases. These large-storage power plants are used to meet peak-time electricity demand. A total of 13 out of 33 CALVIN facilities with a large storage capacity and an afterbay are modeled with hourly varying energy prices. The remaining facilities, including run-of-river hydropower plants, use monthly constant average energy prices. Run-of-river plants are not modeled with hourly varying energy prices because they are operated continuously, depending on stream conditions. Meanwhile, pumping plants with a forebay or afterbay can also optimize pumping hours to minimize pumping costs. Six of twenty-four CALVIN pumping facilities have forebays and are modeled with hourly varying energy prices. CALVIN’s hydropower and pumping plants are listed in Table 1 and Table 2, respectively.
Figure 4 illustrates the run procedure of CALVIN with conventional constant average and proposed hourly varying energy prices. First, the input data are organized. These data include unit costs for moving water, economic demands for users (agricultural, urban, and hydropower), and hydrological time series, such as reservoir inflow, local inflow, and groundwater recharge. In the conventional model run, hydropower and pumping plant operating curves are modeled based on monthly constant average prices. CALVIN’s objective is to minimize total costs. Therefore, a hydropower penalty curve, which is the inverse of its benefit curve, represents the loss for not generating hydropower, depending on the turbine discharge rate. For a model run with the proposed method to incorporate hourly energy price variations, moving average energy prices are used to generate piecewise linear operating curves. Third, the CALVIN model is run with defined energy prices, and optimized flow and reservoir storage decisions are obtained. Finally, hydropower generation and revenue, as well as pumping costs, are postprocessed and compared, as presented in Section 3.

3. Results

3.1. Power Generation and Revenue

CALVIN is run with both monthly constant average prices and hourly varying prices. With hourly varying prices, the model tends to allocate small releases with higher hydropower benefits. As the operating time at turbine capacity increases, the marginal benefits decrease. With hourly varying prices, statewide total hydropower generation is slightly less than with constant monthly prices, but the energy revenue is significantly greater (Table 3). With constant monthly average prices, the annual total modeled hydropower revenue is about USD 550 million per year, which increases by 24% to USD 681 million per year when modeled with hourly variable prices. The hydropower generation of plants modeled with variable prices does not notably change, except for Holm and O’Neill, where annual average hydropower generation and revenue decrease. Holm is upstream of Don Pedro and O’Neill is between the California Aqueduct and Delta–Mendota Canal. California’s intertied water system allows other supply routes to be utilized in the model using hourly varying prices, without impacting overall agricultural and urban deliveries. With hourly varying prices, less water is pumped from O’Neill (discussed later), reducing the hydropower generation of this pumped-storage plant. For other plants modeled with variable prices, the average annual revenues increase by 25 to 58%.
Figure 5 shows the monthly statewide modeled hydropower generation and revenue with constant and variable prices. Overall, the monthly generation and revenue patterns do not differ greatly. Generation and revenue have a similar monthly trend, higher in the summer. Hydropower revenue with variable prices (VPs) is greater than with constant prices (CPs) in all months. Hydropower generation is greater with variable prices in the spring (April–June) when average energy prices are the lowest, but the hourly price fluctuations are the highest. In these months, with price fluctuations, the differences between constant and variable price revenues are much greater. In other months, constant prices lead to higher hydropower generation but lower revenue (underestimating with constant prices). As the hourly price fluctuations decrease, the moving average of variable prices gradually approaches constant average prices. Months with identical power generation or revenue can be compared for analysis. For example, for March, the power generation in both price schemes is quite close (1.38 TWh and 1.39 TWh for constant and variable prices, respectively) but with a big difference in revenue. In March, with constant prices, the revenue is about USD 52 million, while the revenue with variable prices is USD 62 million. In October, January, and February, the revenue difference between variable and constant prices is fairly small, although generation with constant prices is higher. Using constant monthly average prices rather than hourly varying prices underestimates hydropower revenue.
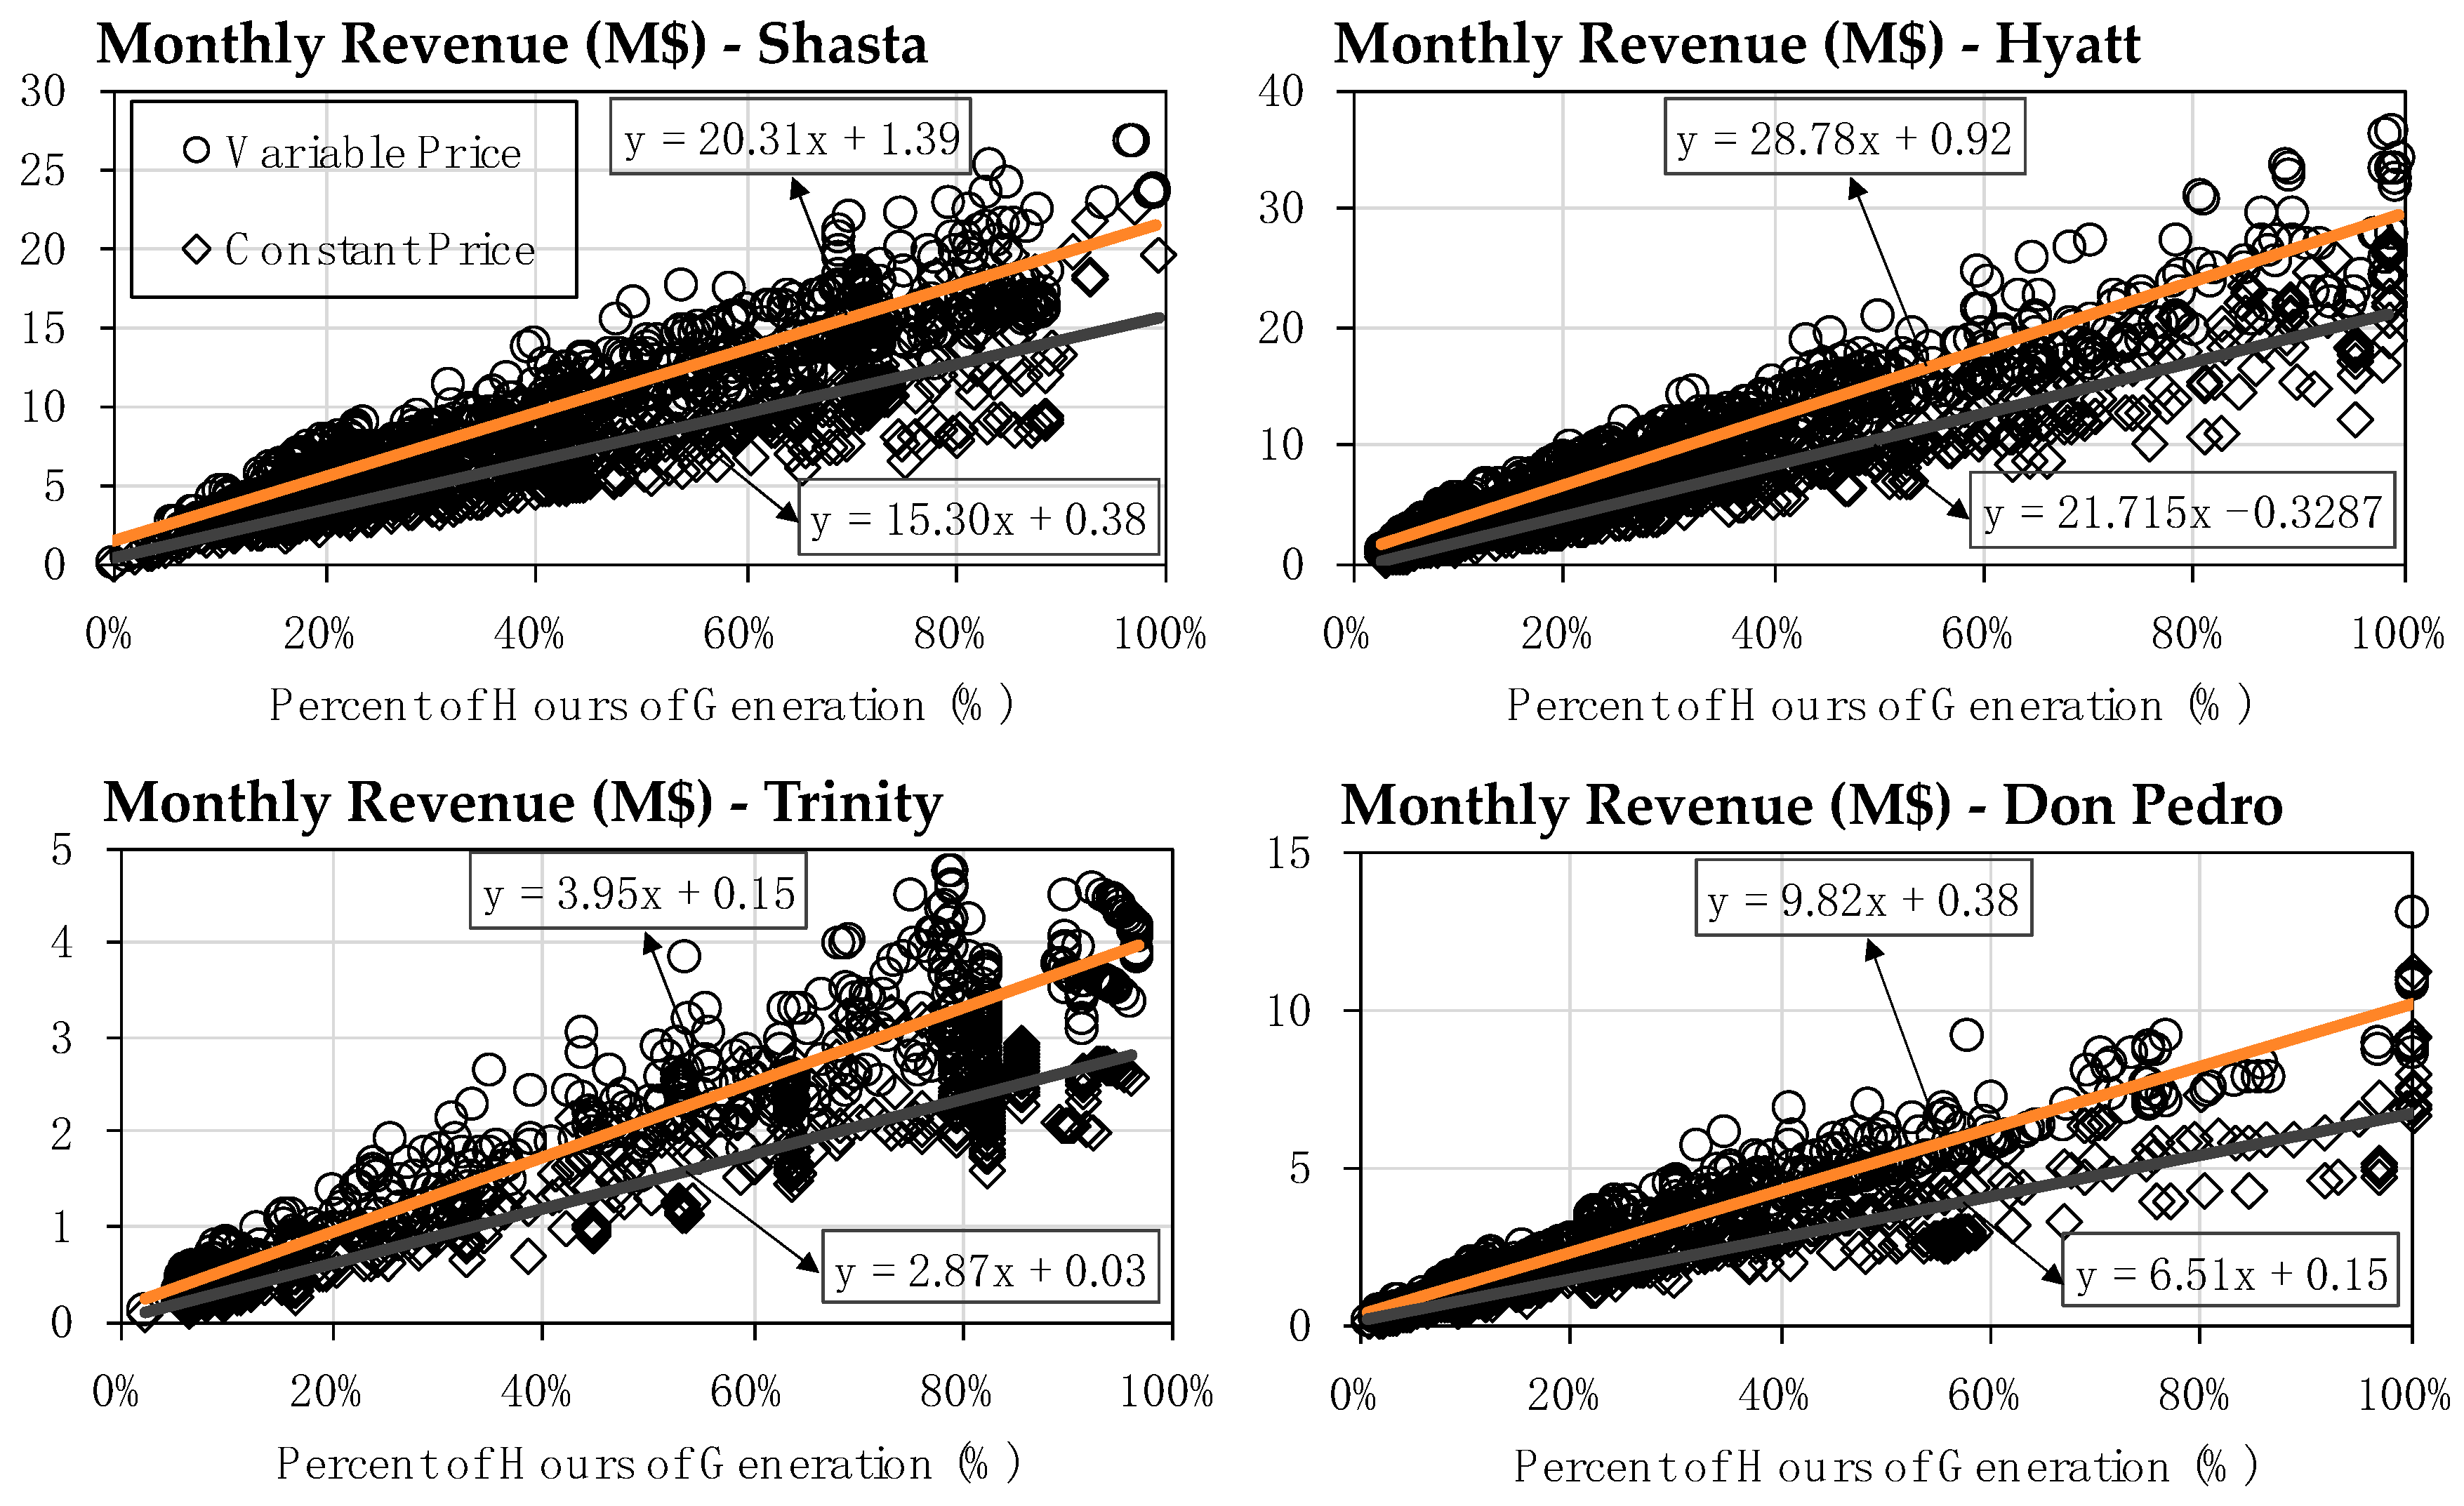
Figure 6 shows monthly revenue from the 82-year (October 1921 to September 2003) modeling period by the percent of hours of generation at turbine capacity for selected CALVIN hydropower facilities with integrated hydropower and water supply operations. The proposed hourly varying energy price scheme increases the revenue per capacity use, as indicated by the slopes of the linear regression lines. The divergent regression lines also imply that these hydropower plants are mostly operated for shorter durations in a given month. Hyatt is operated more at turbine capacity compared to other modeled plants. When water availability is greater, such as in wet months and years, plants are operated during most hours and generate more revenue.
CALVIN covers Sacramento, the San Joaquin Valley, and southern California. Water year types (WYTs) are runoff indices used in Sacramento and the San Joaquin Valley, the northern and southern parts of the Central Valley [27]. Since a WYT index is unavailable for the much drier southern California region, plants in this area are excluded from the WYT analysis. Hydropower generation increases during wetter years. The average hydropower generation in the Central Valley CALVIN facilities differs by water year types, as shown in Table 4. In wet and above-normal years, generation with constant monthly prices is higher, whereas generation in other year types is fairly similar. During periods of abundant water, hydropower operations become more prominent. As water becomes scarce, water supply operations for agricultural and urban users dominate over hydropower operations, so more hydropower production becomes incidental. As water availability decreases from wet to critically dry years, discrepancies in generation and revenue between the two pricing types increase. In wet years, revenues are highest, while the average annual generation with constant prices, 16.3 TWh per year, exceeds generation with variable prices, 15.7 TWh per year. When the WYT is below normal, the average annual generations are equal, although revenue with variable prices, USD 501 million per year, exceeds the annual average revenue of USD 367 million per year with constant prices. Only in dry years does variable price generation exceed constant price generation. Because water year types are not evenly distributed, the overall average generation and revenue with constant and variable prices do not align with historical averages. Hydropower revenue is underestimated for all year types with constant average prices. With hourly varying prices, hydropower revenue increases by 28% in wet years to 40% in critically dry years, with an overall average increase of 33% for all Central Valley facilities.

3.2. Water Supply Operations

Scarcity occurs when a user’s demand is not completely fulfilled (when scarcity costs are positive). CALVIN has water delivery targets for development, land use, and population estimates, for each agricultural and urban demand area, for the year 2050. Water is allocated from the statewide water system to agricultural, urban, and environmental users to meet these target demands. The difference between target demand and actual delivery is defined as the water shortage or scarcity amount. The objective of CALVIN is to minimize statewide scarcity and operating costs.
The proposed hourly varying price scheme has little overall effect on water supply operations from surface reservoirs (Figure 7). Shasta’s storage is slightly greater in March and Don Pedro’s storage is greater in June through November with hourly variable energy prices. Consistent water supply operations alongside higher hydropower revenue suggest an improved representation of hydropower with hourly varying energy prices.

3.3. Pumping Plant Operations

A similar variable energy pricing method is also applied to CALVIN’s pumping plant operations. However, in this case, moving average curves of hourly energy prices are calculated in descending order of prices, meaning that for economically optimal pumping operations, plants should operate when prices are lowest (Figure 3). This is easier achieved when pumping plants have forebays and afterbays. Plants with a forebay can store water during high-energy-price periods (peak times) and commence operations during low-energy-price periods (off-peak times). Six of twenty-four pumping plants have major afterbays and are modeled with variable average prices in CALVIN. The remaining pumping plants use constant monthly average energy prices.
When hourly varying prices are used, the annual average pumping energy costs decrease by 10 to 59% (Table 5). The Banks pumping plant’s energy use increases by 30 GWh, while O’Neill’s energy use decreases by 6 GWh per year with variable prices. However, the total statewide energy usage remains constant. With constant monthly average energy prices, CALVIN’s pumping plants use 12,574 GWh of energy with an annual cost of USD 442 million per year. However, without causing significant changes to agricultural and urban deliveries, the statewide optimized annual average pumping cost was reduced to USD 430 million by simply using hourly varying energy prices in modeling pumping operations, resulting in a savings of about USD 12 million per year (a 3% reduction). The difference in pumping costs between constant and hourly varying price schemes may be small compared to the annual total pumping cost. This could be partly because either the plants modeled with hourly varying prices have small capacities or their pumping capacity is not fully utilized. Additionally, only 6 of 24 pumping plants are modeled with varying energy prices due to data availability and the applicability of the method. However, this shows that plants with a forebay have more flexibility for operations and reduced operating costs.
Figure 8 shows the monthly energy cost by percent of hours of operation for the Banks and Oso pumping plants. Overall, the energy costs are lower with hourly varying prices for both plants. But the Banks pumping plant is operated in most hours of a given month, so its regression line has greater slope with variable prices. As discussed earlier, when a plant operates during most hours, the constant average and hourly varying energy price schemes converge. Operations at the Oso pumping plant do not exceed 50% of hours in a given month. So, using constant average monthly prices greatly overestimates pumping energy costs.

4. Discussion

Hydropower plants with large water storage capacities are operated mostly to meet peak energy demands, especially when they have afterbays, while run-of-river plants run continuously, depending on water availability. For plants with large storage capabilities, energy releases in peak hours have greater profits because energy prices during these hours are much higher. So, in a given month, these peak hours are targeted to maximize hydropower revenue. For plants with small storage capacities or run-of-river plants, the effectiveness of the proposed hourly varying energy prices method is limited, as they operate continuously throughout most of a given month. In addition, when there is less energy price variation, constant monthly average and variable prices converge and variable energy prices does not improve revenue estimates. However, in energy markets with significant variations, assuming constant energy prices for monthly models greatly underestimates hydropower revenue and overestimates pumping energy costs.

5. Conclusions

A simple method was used to implicitly represent hourly varying energy prices in monthly time-step, large-scale model operations, without affecting model runtime and water supply operations. Instead of having to run in hourly time steps, the method uses price duration curves and estimates hourly varying prices as a function of hours of operation at turbine or pumping plant capacity to capture hourly price variations in models with large time steps and better represent hydropower and pumping plant operations. The proposed method was applied to CALVIN, a hydroeconomic optimization model for California’s intertied water supply system. Thirteen of thirty-three hydropower plants with afterbays and 6 of 24 pumping plants with forebays are modeled with hourly varying prices in CALVIN.
The model results were improved with variable prices, leading to increased hydropower revenue with a slight reduction in generation and decreased pumping costs. Overall, the use of constant energy prices tends to underestimate hydropower benefits and overestimate pumping costs.
The representation of hourly energy price variability had only a small, but sometimes significant, impact on overall water operations, particularly in drier years when water availability is limited. The proposed method did not increase water shortages, and water supply operations from reservoirs remained unchanged. The existence of afterbays and forebays in hydropower and pumping facilities provides operational flexibility and supports the utilization of hourly energy price variability to increase benefits and reduce costs. Forebays and afterbays also facilitate the implicit representation of variable energy prices in monthly models. This technique and its application demonstrate that it is sometimes possible to adequately represent short-period (hourly) phenomena and performance in long-period (monthly) models. This method can be applied to any model representing a hydropower facility with an effective afterbay or a pumping facility with a forebay, thereby improving the integration of hydropower and pumping operations into longer-term water resource system models.

Author Contributions

Conceptualization, M.S.D. and J.R.L.; analysis, M.S.D., E.W. and Y.Y.; writing—original draft preparation, M.S.D.; writing—review and editing, M.S.D., E.W., Y.Y. and J.R.L.; visualization, M.S.D.; supervision, J.R.L. All authors have read and agreed to the published version of the manuscript.

Funding

This research received no external funding.

Data Availability Statement

The data that support the findings of this study, the model’s documentation, the supplementary material, and the source code are openly available at https://github.com/ucd-cws/calvin (accessed on 4 December 2023) and https://github.com/ucd-cws/calvin-network-data (accessed on 4 December 2023).

Conflicts of Interest

The authors declare no conflicts of interest.

References

  1. Loucks, D.P. Water resource systems models: Their role in planning. J. Water Resour. Plan. Manag. 1992, 118, 214–223. [Google Scholar] [CrossRef]
  2. Yeh, W.W.-G.; Becker, L. Multiobjective analysis of multireservoir operations. Water Resour. Res. 1982, 18, 1326–1336. [Google Scholar] [CrossRef]
  3. Savic, D.A.; Simonovic, S.P. An interactive approach to selection and use of single multipurpose reservoir models. Water Resour. Res. 1991, 27, 2509–2521. [Google Scholar] [CrossRef]
  4. Leta, M.K.; Demissie, T.A.; Tränckner, J. Optimal operation of Nashe hydropower reservoir under land use land cover change in Blue Nile River Basin. Water 2022, 14, 1606. [Google Scholar] [CrossRef]
  5. Yeh, W.W.-G. Reservoir management and operations models: A state-of-the-art review. Water Resour. Res. 1985, 21, 1797–1818. [Google Scholar] [CrossRef]
  6. Wurbs, R.A. Reservoir-system simulation and optimization models. J. Water Resour. Plan. Manag. 1993, 119, 455–472. [Google Scholar] [CrossRef]
  7. Labadie, J.W. Optimal operation of multireservoir systems: State-of-the-art review. J. Water Resour. Plan. Manag. 2004, 130, 93–111. [Google Scholar] [CrossRef]
  8. Ward, F.A.; Lynch, T.P. Integrated river basin optimization: Modeling economic and hydrologic interdependence. J. Am. Water Resour. Assoc. 1996, 32, 1127–1138. [Google Scholar] [CrossRef]
  9. Vichete, W.D.; Méllo Júnior, A.V.; Soares, G.A.d.S. A water allocation model for multiple uses based on a proposed hydro-economic method. Water 2023, 15, 1170. [Google Scholar] [CrossRef]
  10. Davis, M.D. Integrated water resource management and water sharing. J. Water Resour. Plan. Manag. 2007, 133, 427–445. [Google Scholar] [CrossRef]
  11. Marques, G.F.; Tilmant, A. The economic value of coordination in large-scale multireservoir systems: The Parana River case. Water Resour. Res. 2013, 49, 7546–7557. [Google Scholar] [CrossRef]
  12. Li, C.; He, L.; Liu, D.; Feng, Z. A Scientometric review for uncertainties in integrated simulation–optimization modeling system. Water 2024, 16, 285. [Google Scholar] [CrossRef]
  13. Tejada-Guibert, J.A.; Stedinger, J.R.; Staschus, K. Optimization of value of CVP’s hydropower production. J. Water Resour. Plan. Manag. 1990, 116, 52–70. [Google Scholar] [CrossRef]
  14. Madani, K.; Lund, J.R. Modeling California’s high-elevation hydropower systems in energy units. Water Resour. Res. 2009, 45. [Google Scholar] [CrossRef]
  15. Olivares, M.A.; Lund, J.R. Representing energy price variability in long-and medium-term hydropower optimization. J. Water Resour. Plan. Manag. 2012, 138, 606–613. [Google Scholar] [CrossRef]
  16. Ring, B.J. Dispatch Based Pricing in Decentralised Power Systems. Ph.D. Dissertation, University of Canterbury, Christchurch, New Zealand, 1995. [Google Scholar]
  17. Madrigal Martinez, M. Optimization Models and Techniques for Implementation and Pricing of Electricity Markets. Ph.D. Dissertation, University of Waterloo, Waterloo, ON, Canada, 2001. [Google Scholar]
  18. Pritchard, G.; Philbot, A.; Neame, P. Hydroelectric reservoir optimization in a pool market. Math. Program. 2004, 103, 445–461. [Google Scholar] [CrossRef]
  19. Wu, Y.; Su, C.; Liu, S.; Guo, H.; Sun, Y.; Jiang, Y.; Shao, Q. Optimal decomposition for the monthly contracted electricity of cascade hydropower plants considering the bidding space in the day-ahead spot market. Water 2022, 14, 2347. [Google Scholar] [CrossRef]
  20. Liu, S.; Luo, J.; Chen, H.; Wang, Y.; Li, X.; Zhang, J.; Wang, J. Third-monthly hydropower scheduling of cascaded reservoirs using successive quadratic programming in trust corridor. Water 2023, 15, 716. [Google Scholar] [CrossRef]
  21. Li, J.; Saw, M.M.M.; Chen, S.; Yu, H. Short-term optimal operation of Baluchaung II hydropower plant in Myanmar. Water 2020, 12, 504. [Google Scholar] [CrossRef]
  22. Dogan, M.S. Integrated Water Operations in California: Hydropower, Overdraft, and Climate Change. Master’s Thesis, University of California, Davis, CA, USA, 2015. [Google Scholar]
  23. Draper, A.J.; Jenkins, M.W.; Kirby, K.W.; Lund, J.R.; Howitt, R.E. Economic-engineering optimization for California water management. J. Water Resour. Plan. Manag. 2003, 129, 155–164. [Google Scholar] [CrossRef]
  24. Dogan, M.S.; Fefer, M.A.; Herman, J.D.; Hart, Q.J.; Merz, J.R.; Medellin-Azuara, J.; Lund, J.R. An open-source Python implementation of California’s hydro-economic optimization model. Environ. Model. Softw. 2018, 108, 8–13. [Google Scholar] [CrossRef]
  25. Arnold, W. The Economic Value of Carryover Storage in California’s Water Supply System with Limited Hydrologic Foresight. Master’s Thesis, University of California, Davis, CA, USA, 2021. [Google Scholar]
  26. Locational Marginal Energy Price Data. Available online: http://www.caiso.com (accessed on 6 December 2023).
  27. Chronological reconstructed Sacramento and San Joaquin Valley Water Year Hydrologic Classification Indices. Available online: https://cdec.water.ca.gov/reportapp/javareports?name=WSIHIST (accessed on 22 January 2024).
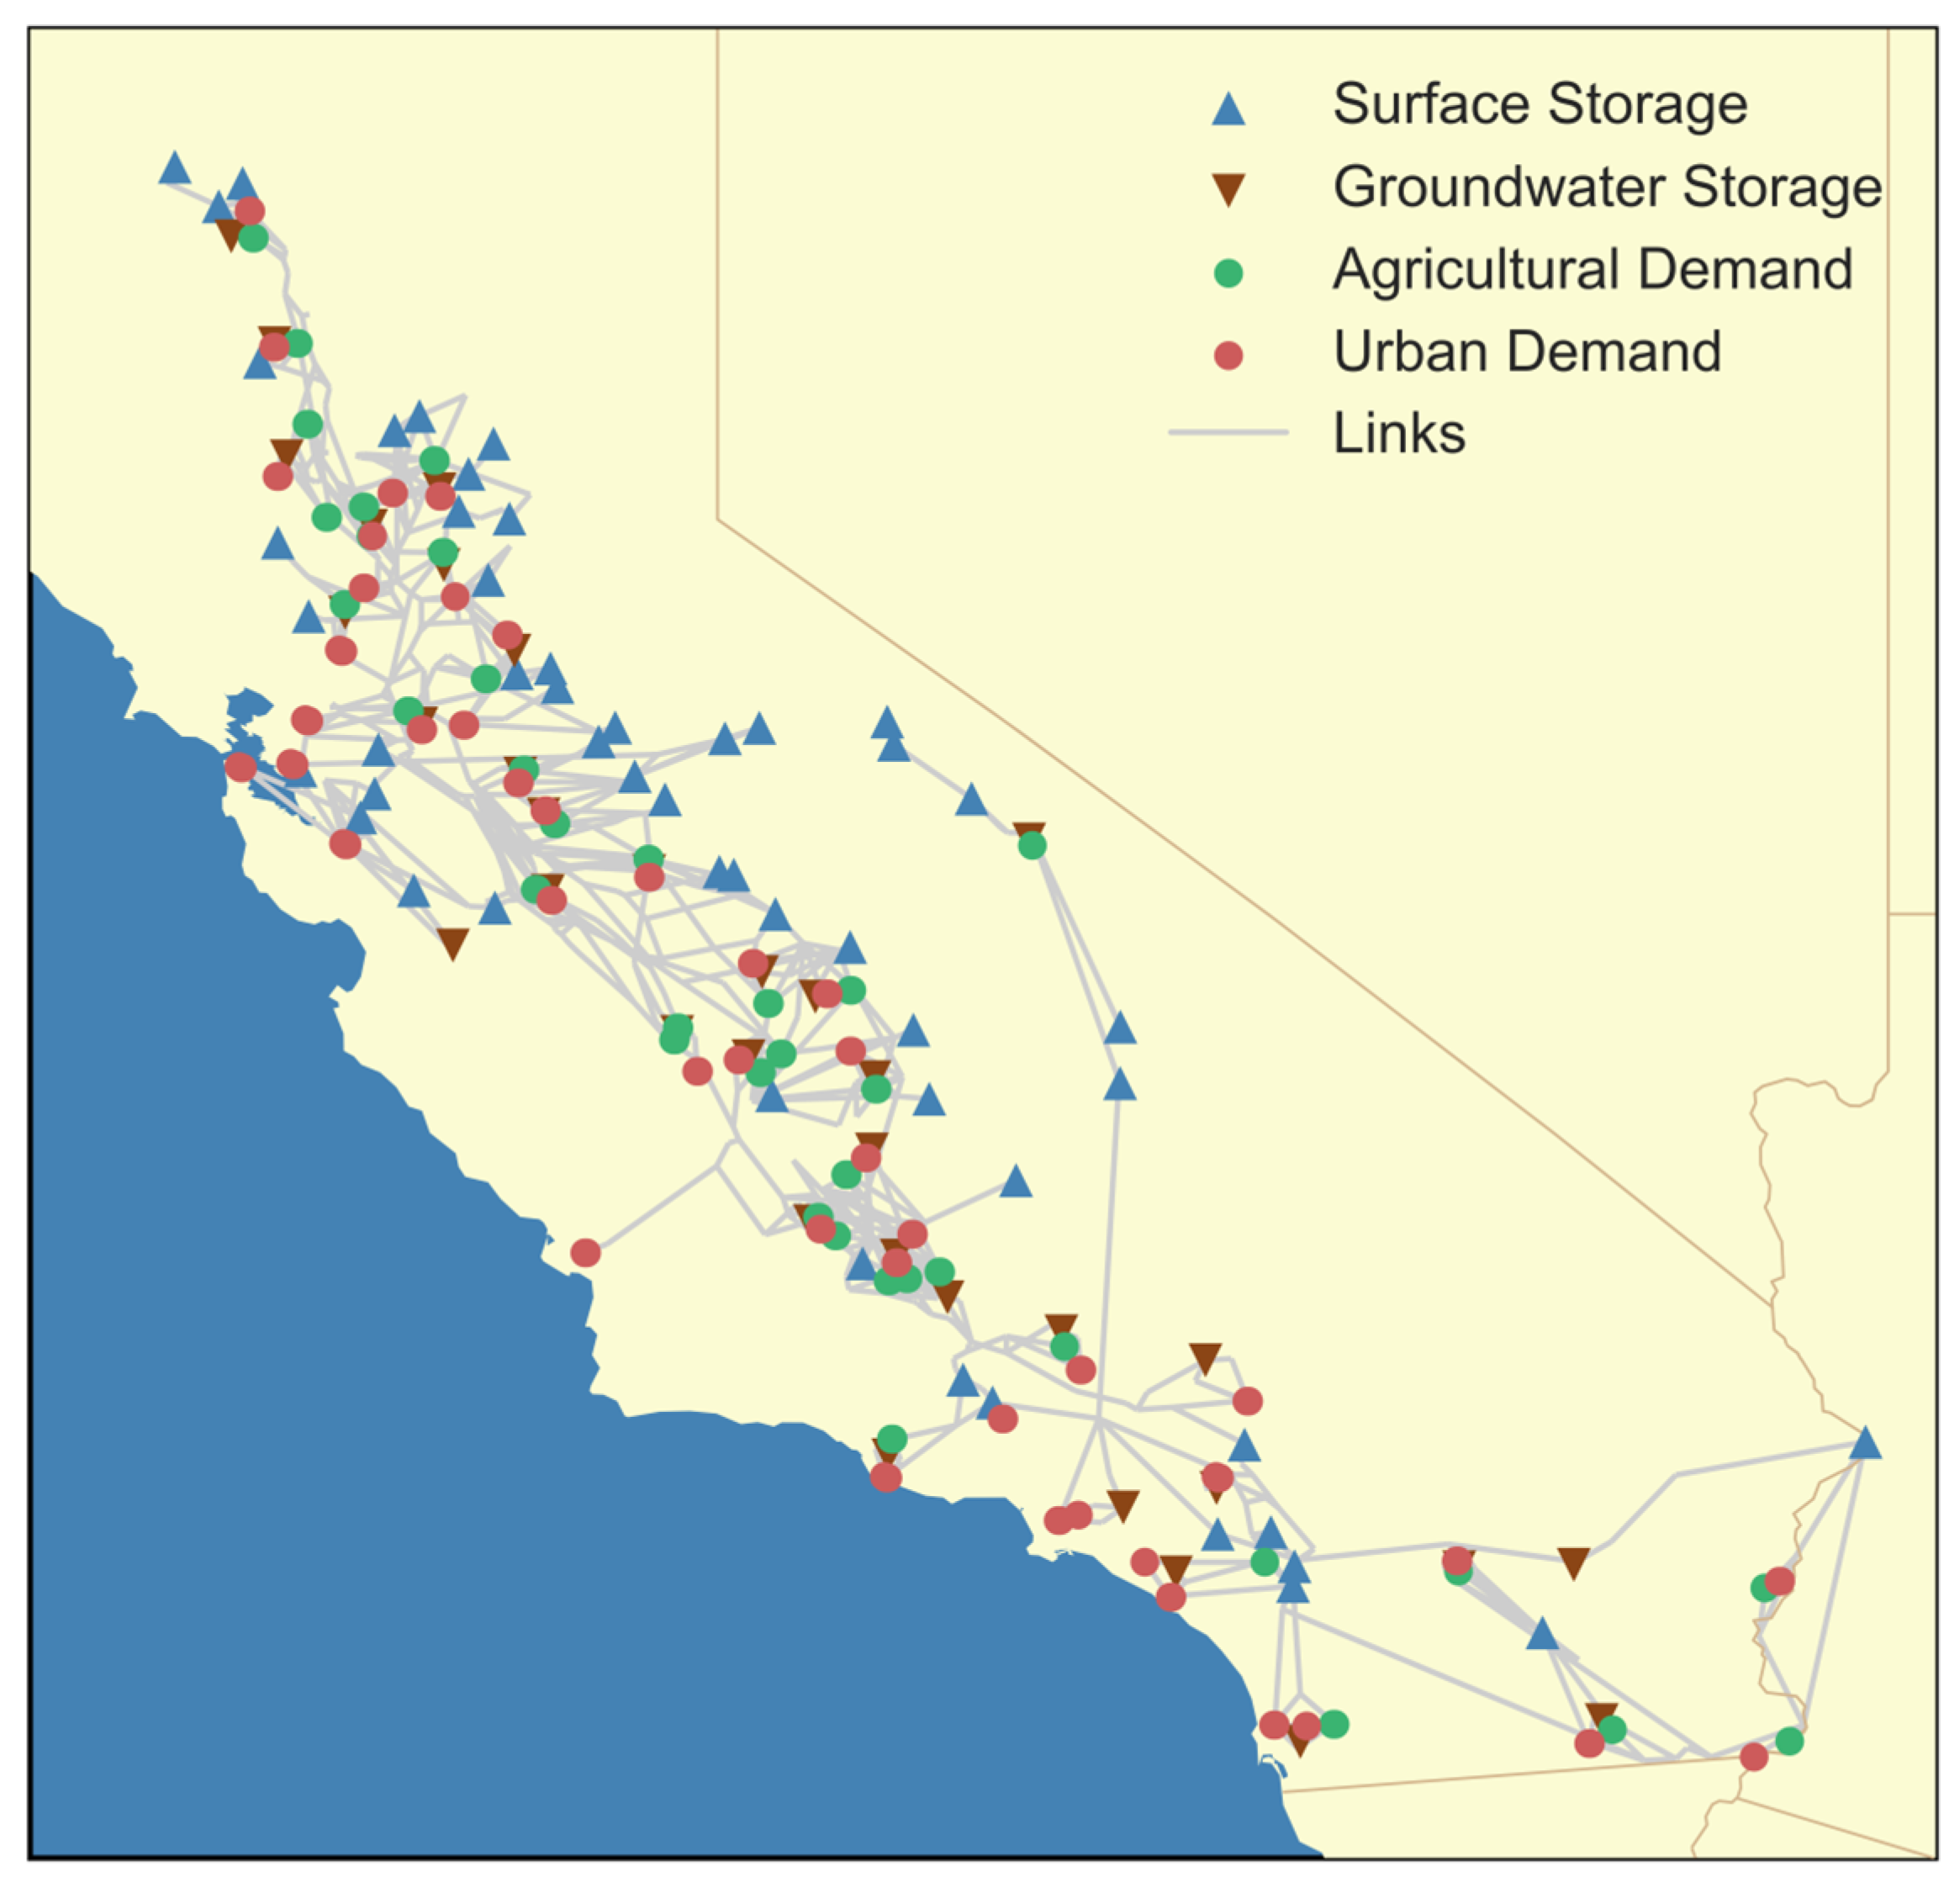
Figure 1. Network representation of California’s water supply system in CALVIN [24].
Water 16 00562 g001
Figure 2. Price duration curves of hourly energy prices for months of March and May. Each month has a different hourly price variation pattern.
Water 16 00562 g002
Figure 3. Moving average curves for months of March and May. The marginal variable energy price slope of the continuous and dashed price curves above decrease with increased hours of generation. Constant prices oversimplify plants that operate based on the marginal value.
Water 16 00562 g003
Figure 4. Modeling procedure with conventional constant and proposed hourly varying energy prices.
Water 16 00562 g004
Figure 5. Modeled statewide monthly hydropower generation and power revenue with constant and variable energy prices. Revenues tend to diverge more in the months with greater energy price variations between the two methods.
Water 16 00562 g005
Figure 6. Modeled monthly generation and percent hours of generation in a given month for selected hydropower plants. Variable energy prices increase revenue by percent of generation hours.
Water 16 00562 g006
Figure 7. Modeled monthly average reservoir storage of selected facilities. Reservoir operations are little affected when variable energy prices are used.
Water 16 00562 g007
Figure 8. Modeled monthly energy and percent of hours of operation in a given month for pumping selected facilities. Pumping energy costs are smaller with variable energy prices, but as hours of operation increase, cost calculations from two methods become closer.
Water 16 00562 g008
Table 1. Modeled CALVIN hydropower facilities and plant characteristics.
Hydropower FacilityPower Plant
Capacity (MW)
Reservoir Storage Capacity (106 m3)Turbine Release
Capacity (m3/s)
Shasta a6295612561
Spring Creek a180296143
Carr15429697
Trinity a1403019132
Keswick11729494
Hyatt a6444367523
Colgate a3251147107
Folsom a1991205245
New Narrows4986121
Thermalito Fore/Afterbay11570503
New Melones a3002953270
Don Pedro a2032504260
Holm a15737223
Kirkwood a12244421
New Exchequer95126389
Gianelli a4242518376
Moccasin a104119
O’Neill a257042
Pine Flat1901233231
Castaic1247401123
Devil Canyon2809046
Warne78747
San Francisquito 1 and 2123-22
Gorges112-23
Mojave32-56
Others92-359
Note: a Modeled with hourly varying prices.
Table 2. Modeled CALVIN pumping facilities and plant characteristics.
Pumping FacilityPumping Plant Capacity (MW)Flow Capacity (m3/s)
Badger Hill6270
Banks a212245
Buena Vista90146
Contra Costa 139
Dos Amigos99340
Del Valle a03
Eagle7252
Edmonston622127
Gianelli a,b151317
Iron7252
Julian Hinds7252
Los Vaqueros236
Las Perillas2270
Mallard Slough51
Old River367
O’Neill a,b19121
Oso a3790
Pearlblossom9583
South Bay a49
Tracy92133
Walnut Creek6114
Wheeler Ridge107127
Chrisman233127
Notes: a Modeled with hourly varying prices; b operated for both pumping and power generation.
Table 3. Modeled annual average hydropower operations with constant and hourly varying prices. Facilities modeled with variable energy prices show a greater change (mostly positive) in the revenue reported from the model.
FacilityTurbine Release (m3/s)Generation (GWh/Year)Revenue (USD M/Year)Revenue
Constant PriceVariable PriceConstant PriceVariable PriceConstant PriceVariable PriceChange (%)
Shasta a2172162286228575.5110.646.5
Spring Creek a323138138113.519.443.4
Carr252535435412.212.41.5
Trinity a484840840913.019.046.7
Keswick24424346546415.515.4−0.8
Hyatt a1541522190218376.7111.645.5
Colgate a47461356136145.864.039.9
Folsom a1009965565322.132.044.6
New Narrows60602772779.59.4−1.0
Thermalito13713629329010.310.2−0.9
New Melones a404049549615.925.258.5
Don Pedro a565561161018.629.558.2
Holm a171386967330.627.8−9.2
Kirkwood a131336435512.615.825.1
New Exchequer36362752778.58.61.0
Gianelli a0000000
Moccasin a13131671675.87.427.4
O’Neill a37103391.20.4−68.0
Pine Flat606044544413.213.2−0.1
Castaic353587287233.233.20.0
Devil’s Canyon37371051105137.237.20.0
Warne363652252219.219.20.0
San Francisquito 1 and 2141462962923.123.10.1
Gorges7736636612.512.50.0
Mojave373790903.23.20.0
Others24424264264220.520.5−0.3
Statewide1745170416,09415,85755068124
Note: a Modeled with hourly varying prices.
Table 4. Modeled generation and power revenue in different water year types for the Central Valley facilities. The drier the year, the more the revenue changes and the more impactful having variable pricing schemes are.
Year TypeAverage Generation (TWh/Year)Average Revenue (USD M/Year)Revenue Change (%)
Constant PriceVariable PriceConstant PriceVariable Price
Wet16.315.754870128
Above Normal12.812.443656931
Below Normal10.910.936750136
Dry9.49.531343539
Critical7.37.224233840
Central Valley Average12.011.840353533
Table 5. Modeled annual average pumping plant operations with constant and hourly varying energy prices. Variable energy price scheme results in less pumping costs.
FacilityDischarge Rate (m3/s)Energy Use (GWh/Year)Energy Cost (USD M/Year)Energy Cost Change (%)
Constant PriceVariable PriceConstant PriceVariable PriceConstant PriceVariable Price
Banks a148.71152.69113011603936−10
Del Valle a0.060.060.100.100.00440.0018−59
Gianelli a,b31.8331.8119819895−41
O’Neill a,b24.4920.54373121−40
Oso a31.3731.3722522585−41
South Bay a0.060.061.281.280.05550.0242−56
Others845.95841.9010,98310,9593843830
Statewide1928192012,57412,574442430−3
Notes: a Modeled with hourly varying prices; b operated for both pumping and power generation.
Disclaimer/Publisher’s Note: The statements, opinions and data contained in all publications are solely those of the individual author(s) and contributor(s) and not of MDPI and/or the editor(s). MDPI and/or the editor(s) disclaim responsibility for any injury to people or property resulting from any ideas, methods, instructions or products referred to in the content.