

Research on Spatial Distribution Pattern of Stability Inter-Controlled Factors of Fine-Grained Sediments in Debris Flow Gullies—A Case Study

 , and
, and
Abstract
:1. Introduction
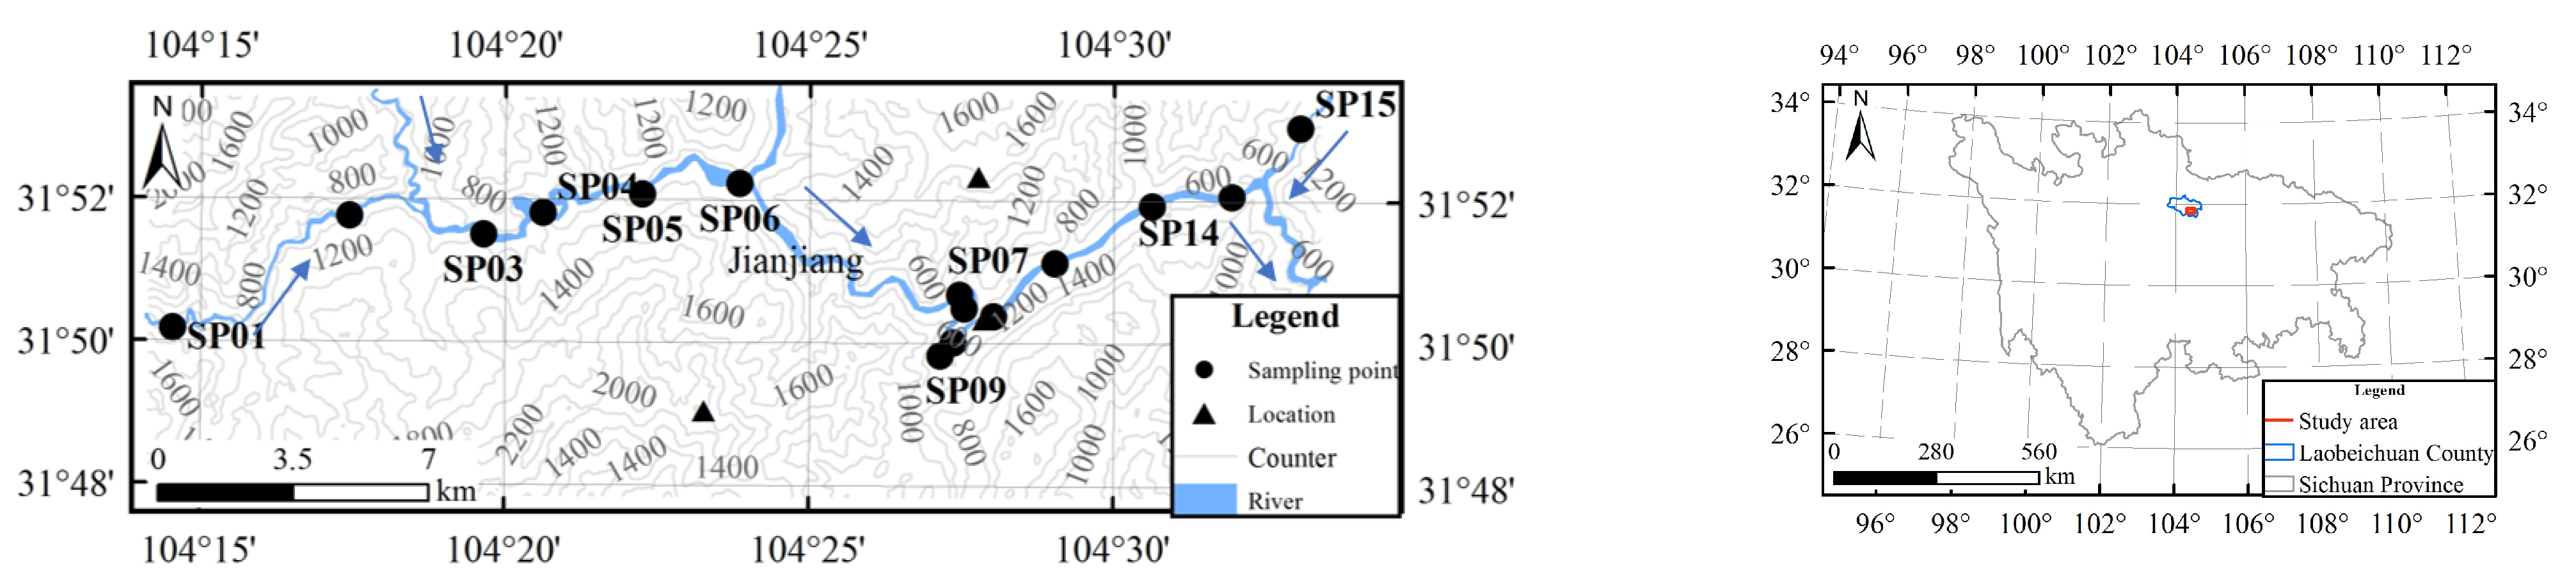
2. Study Area
3. Data and Equipment
4. Methodology
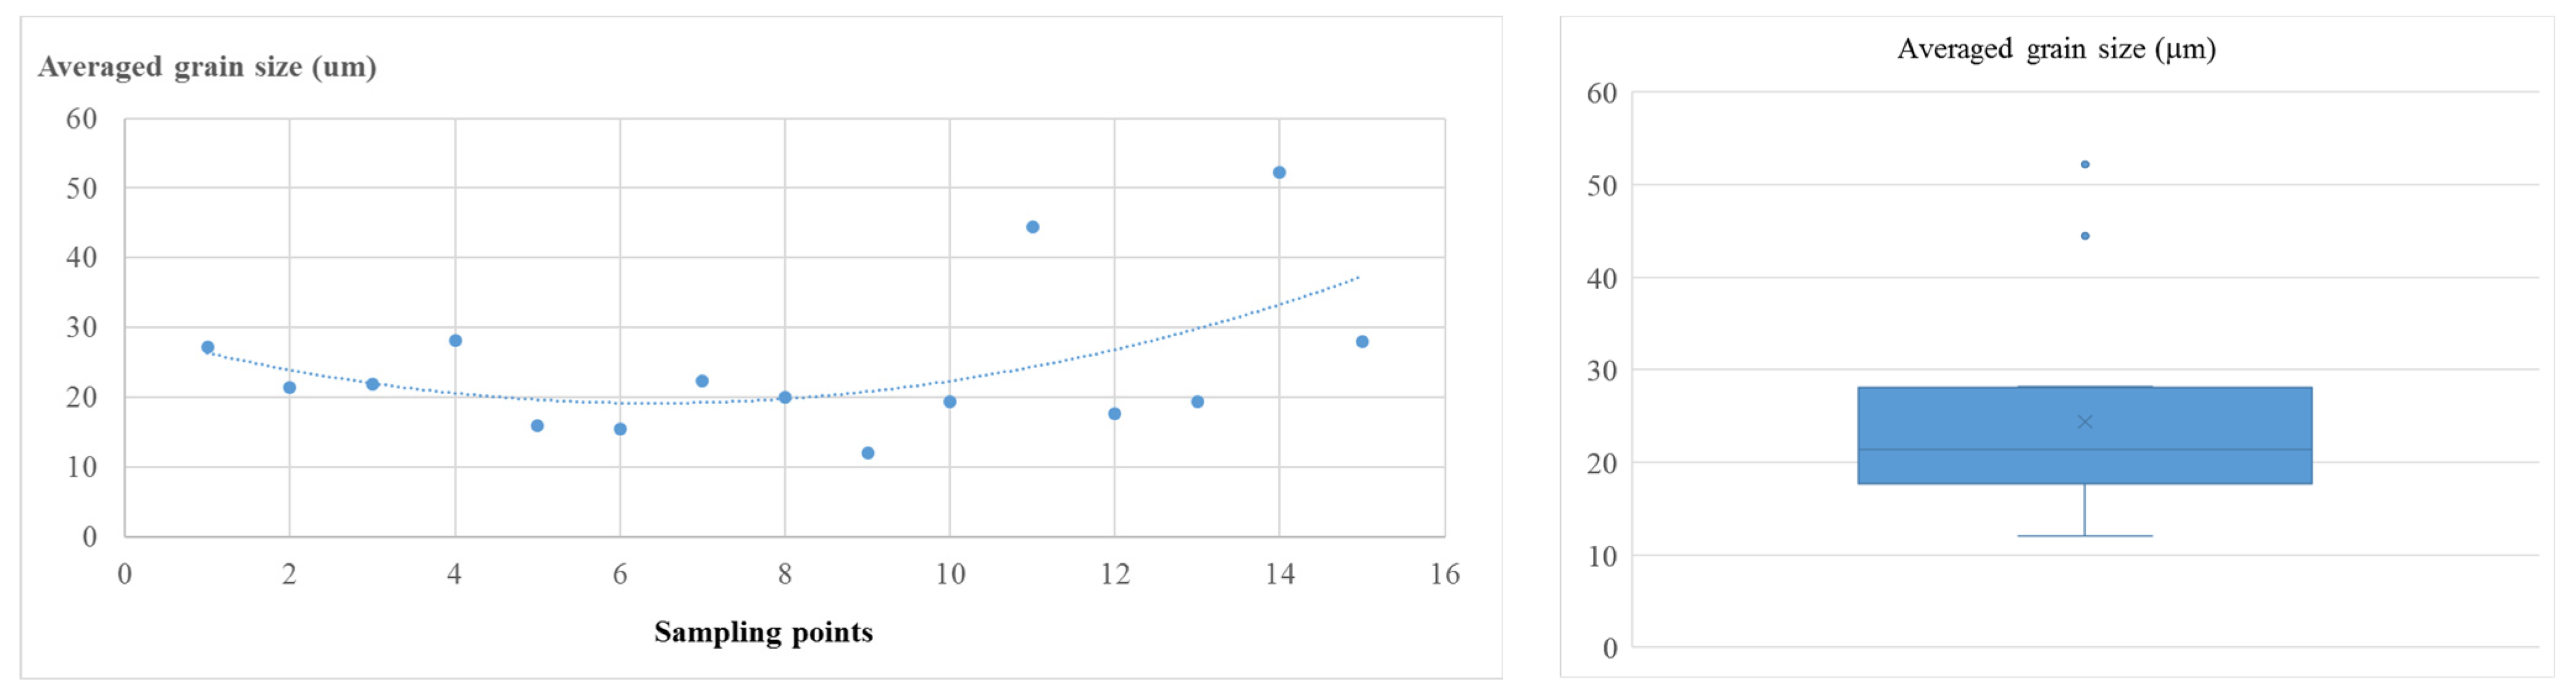
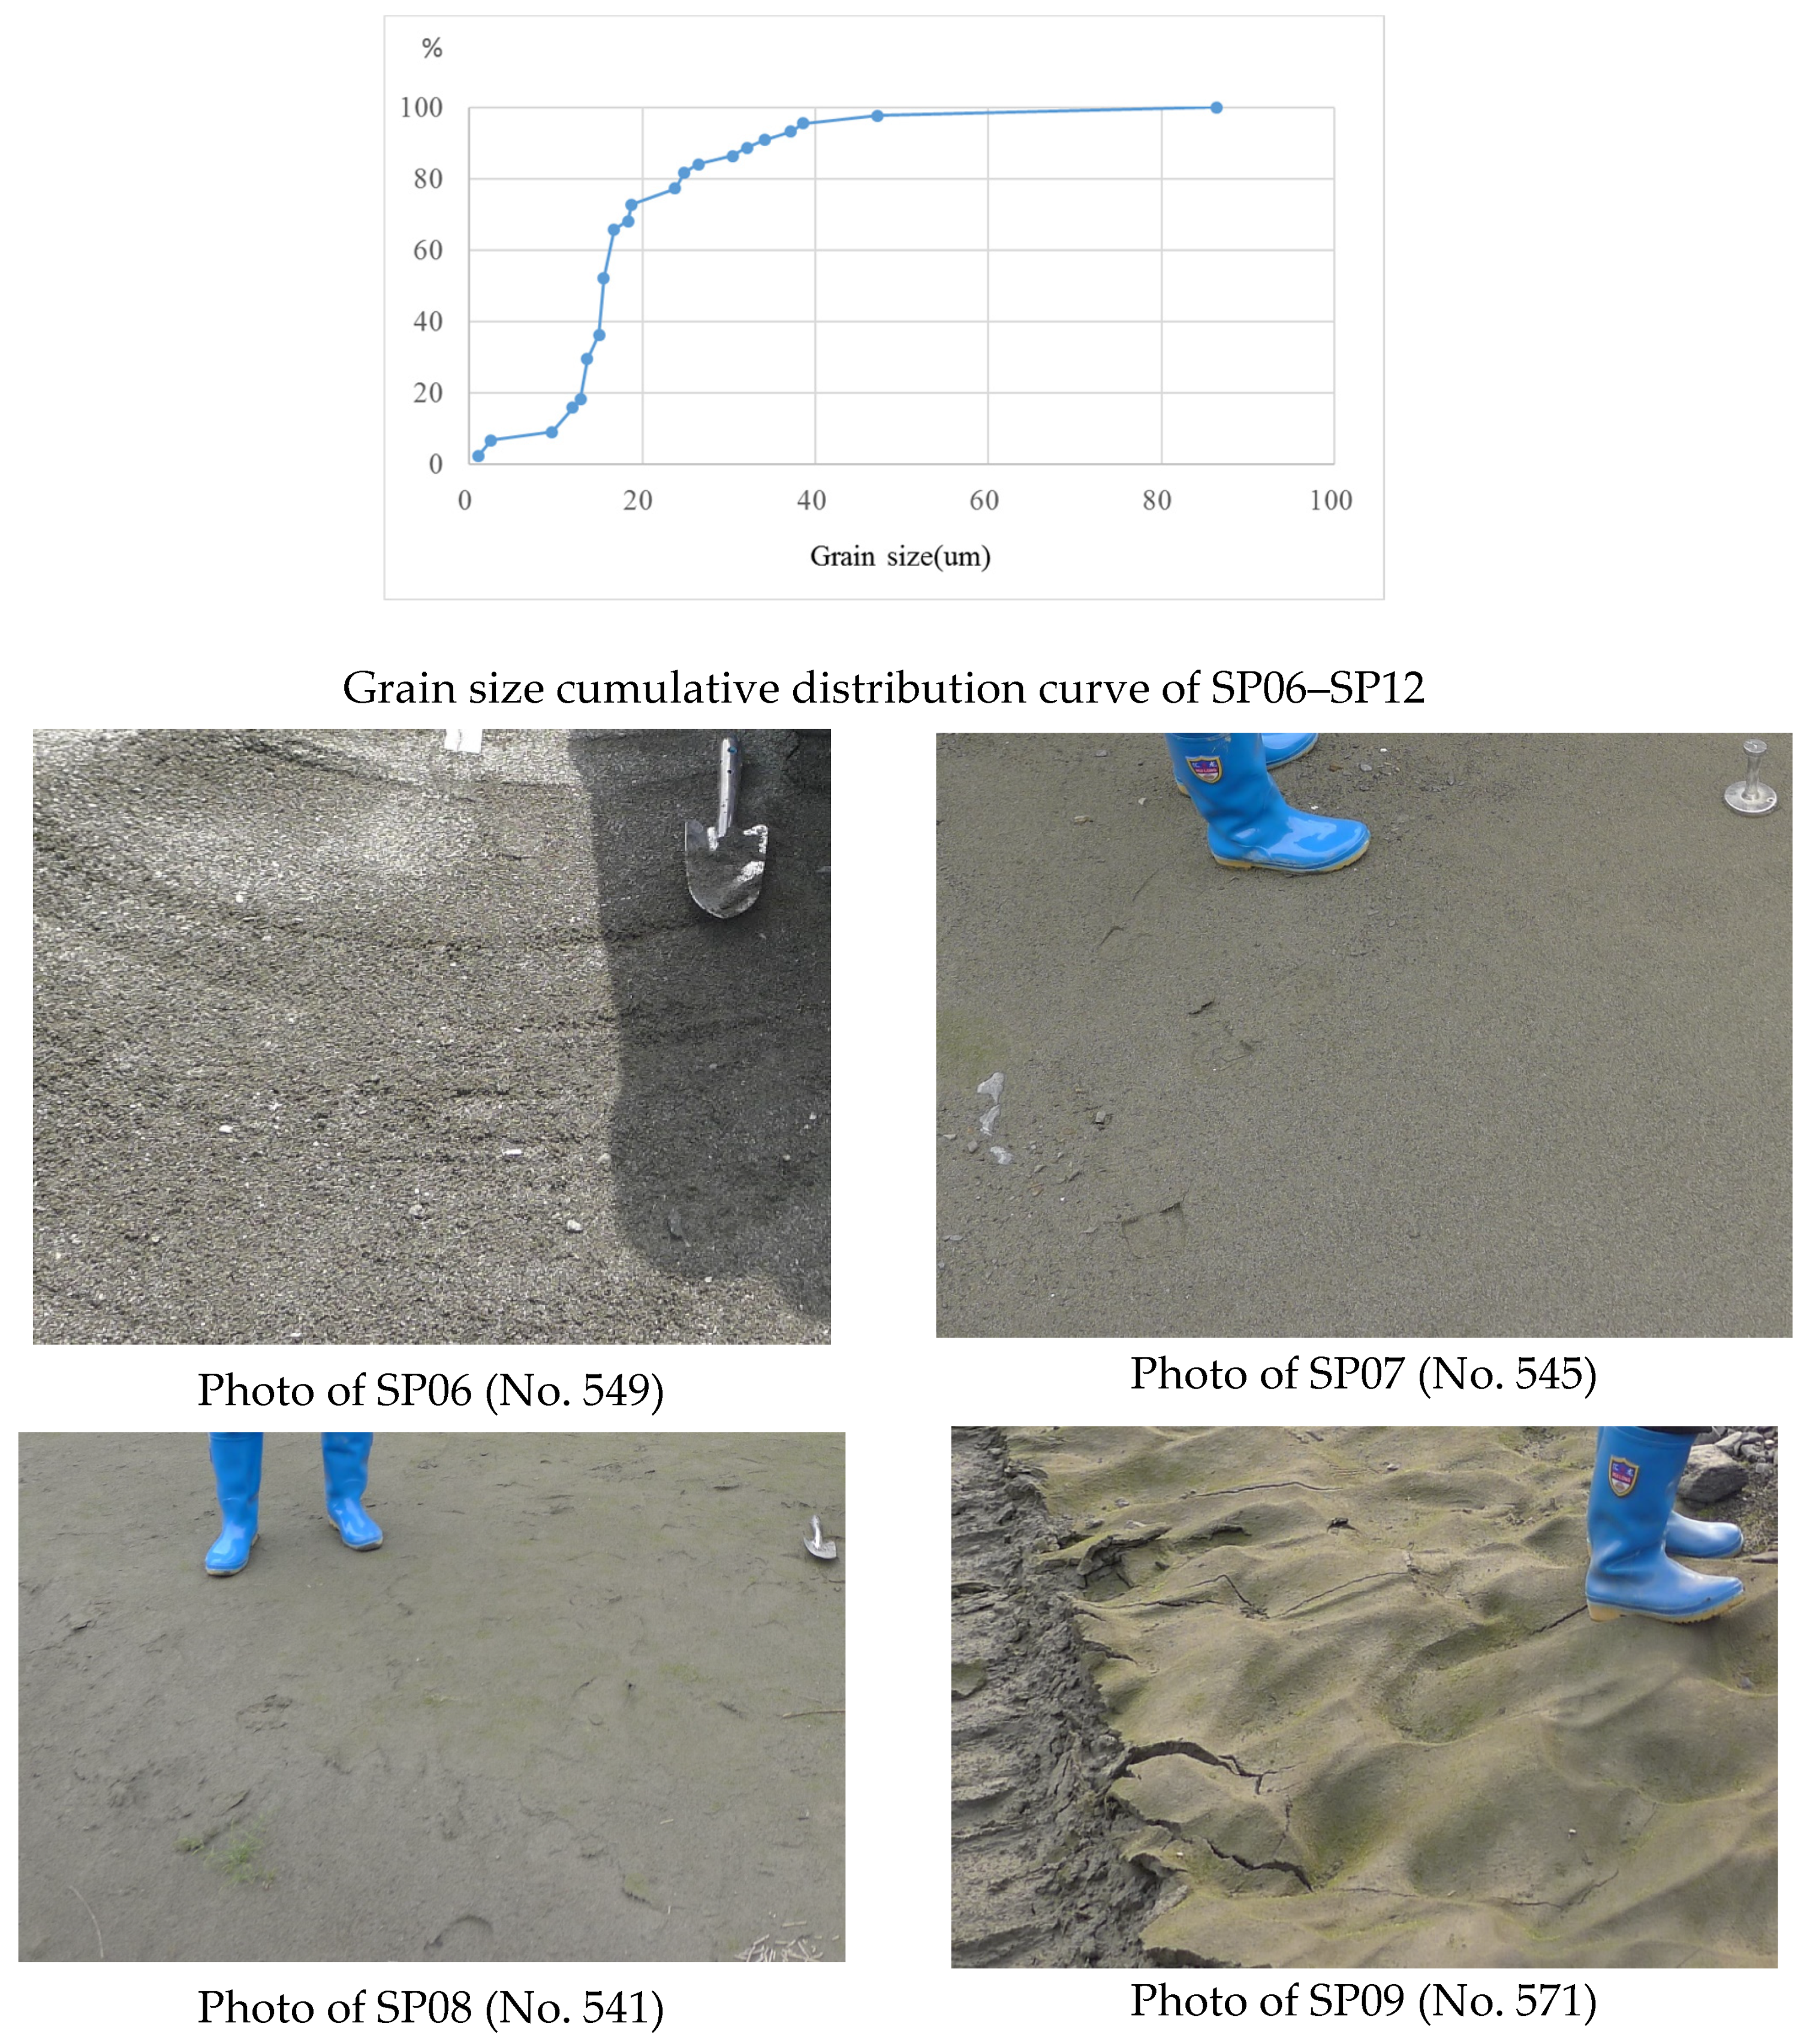
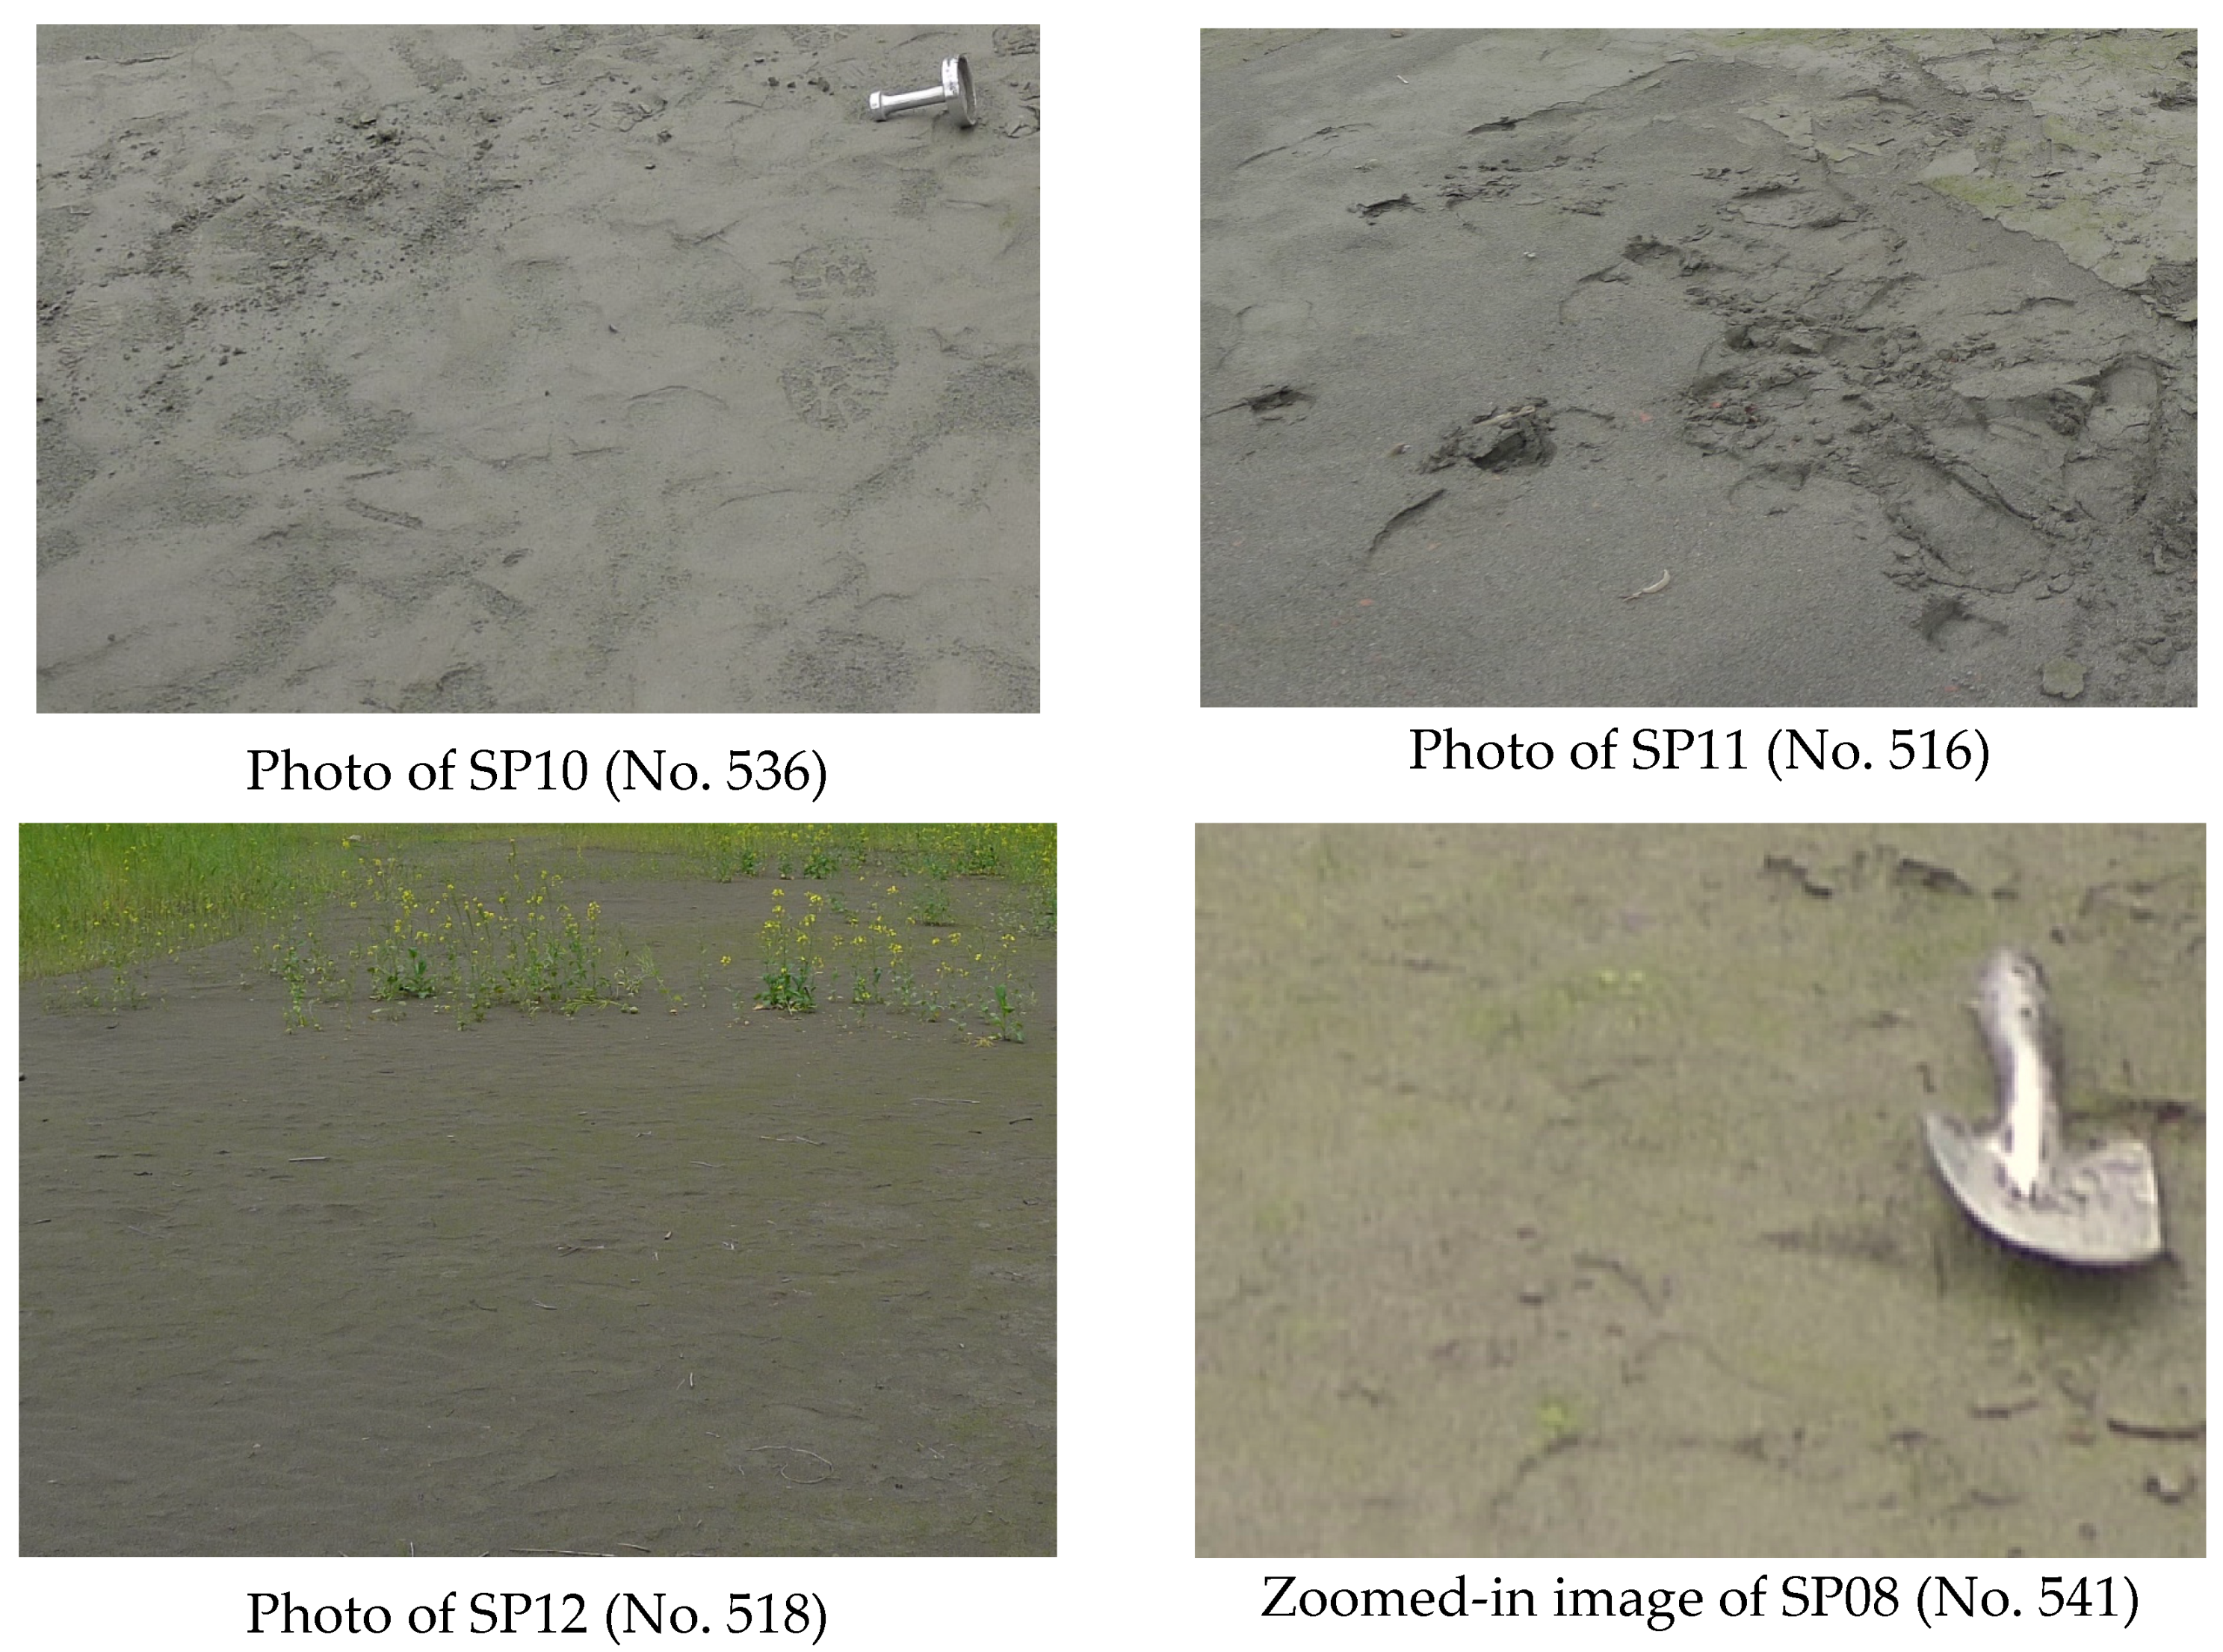
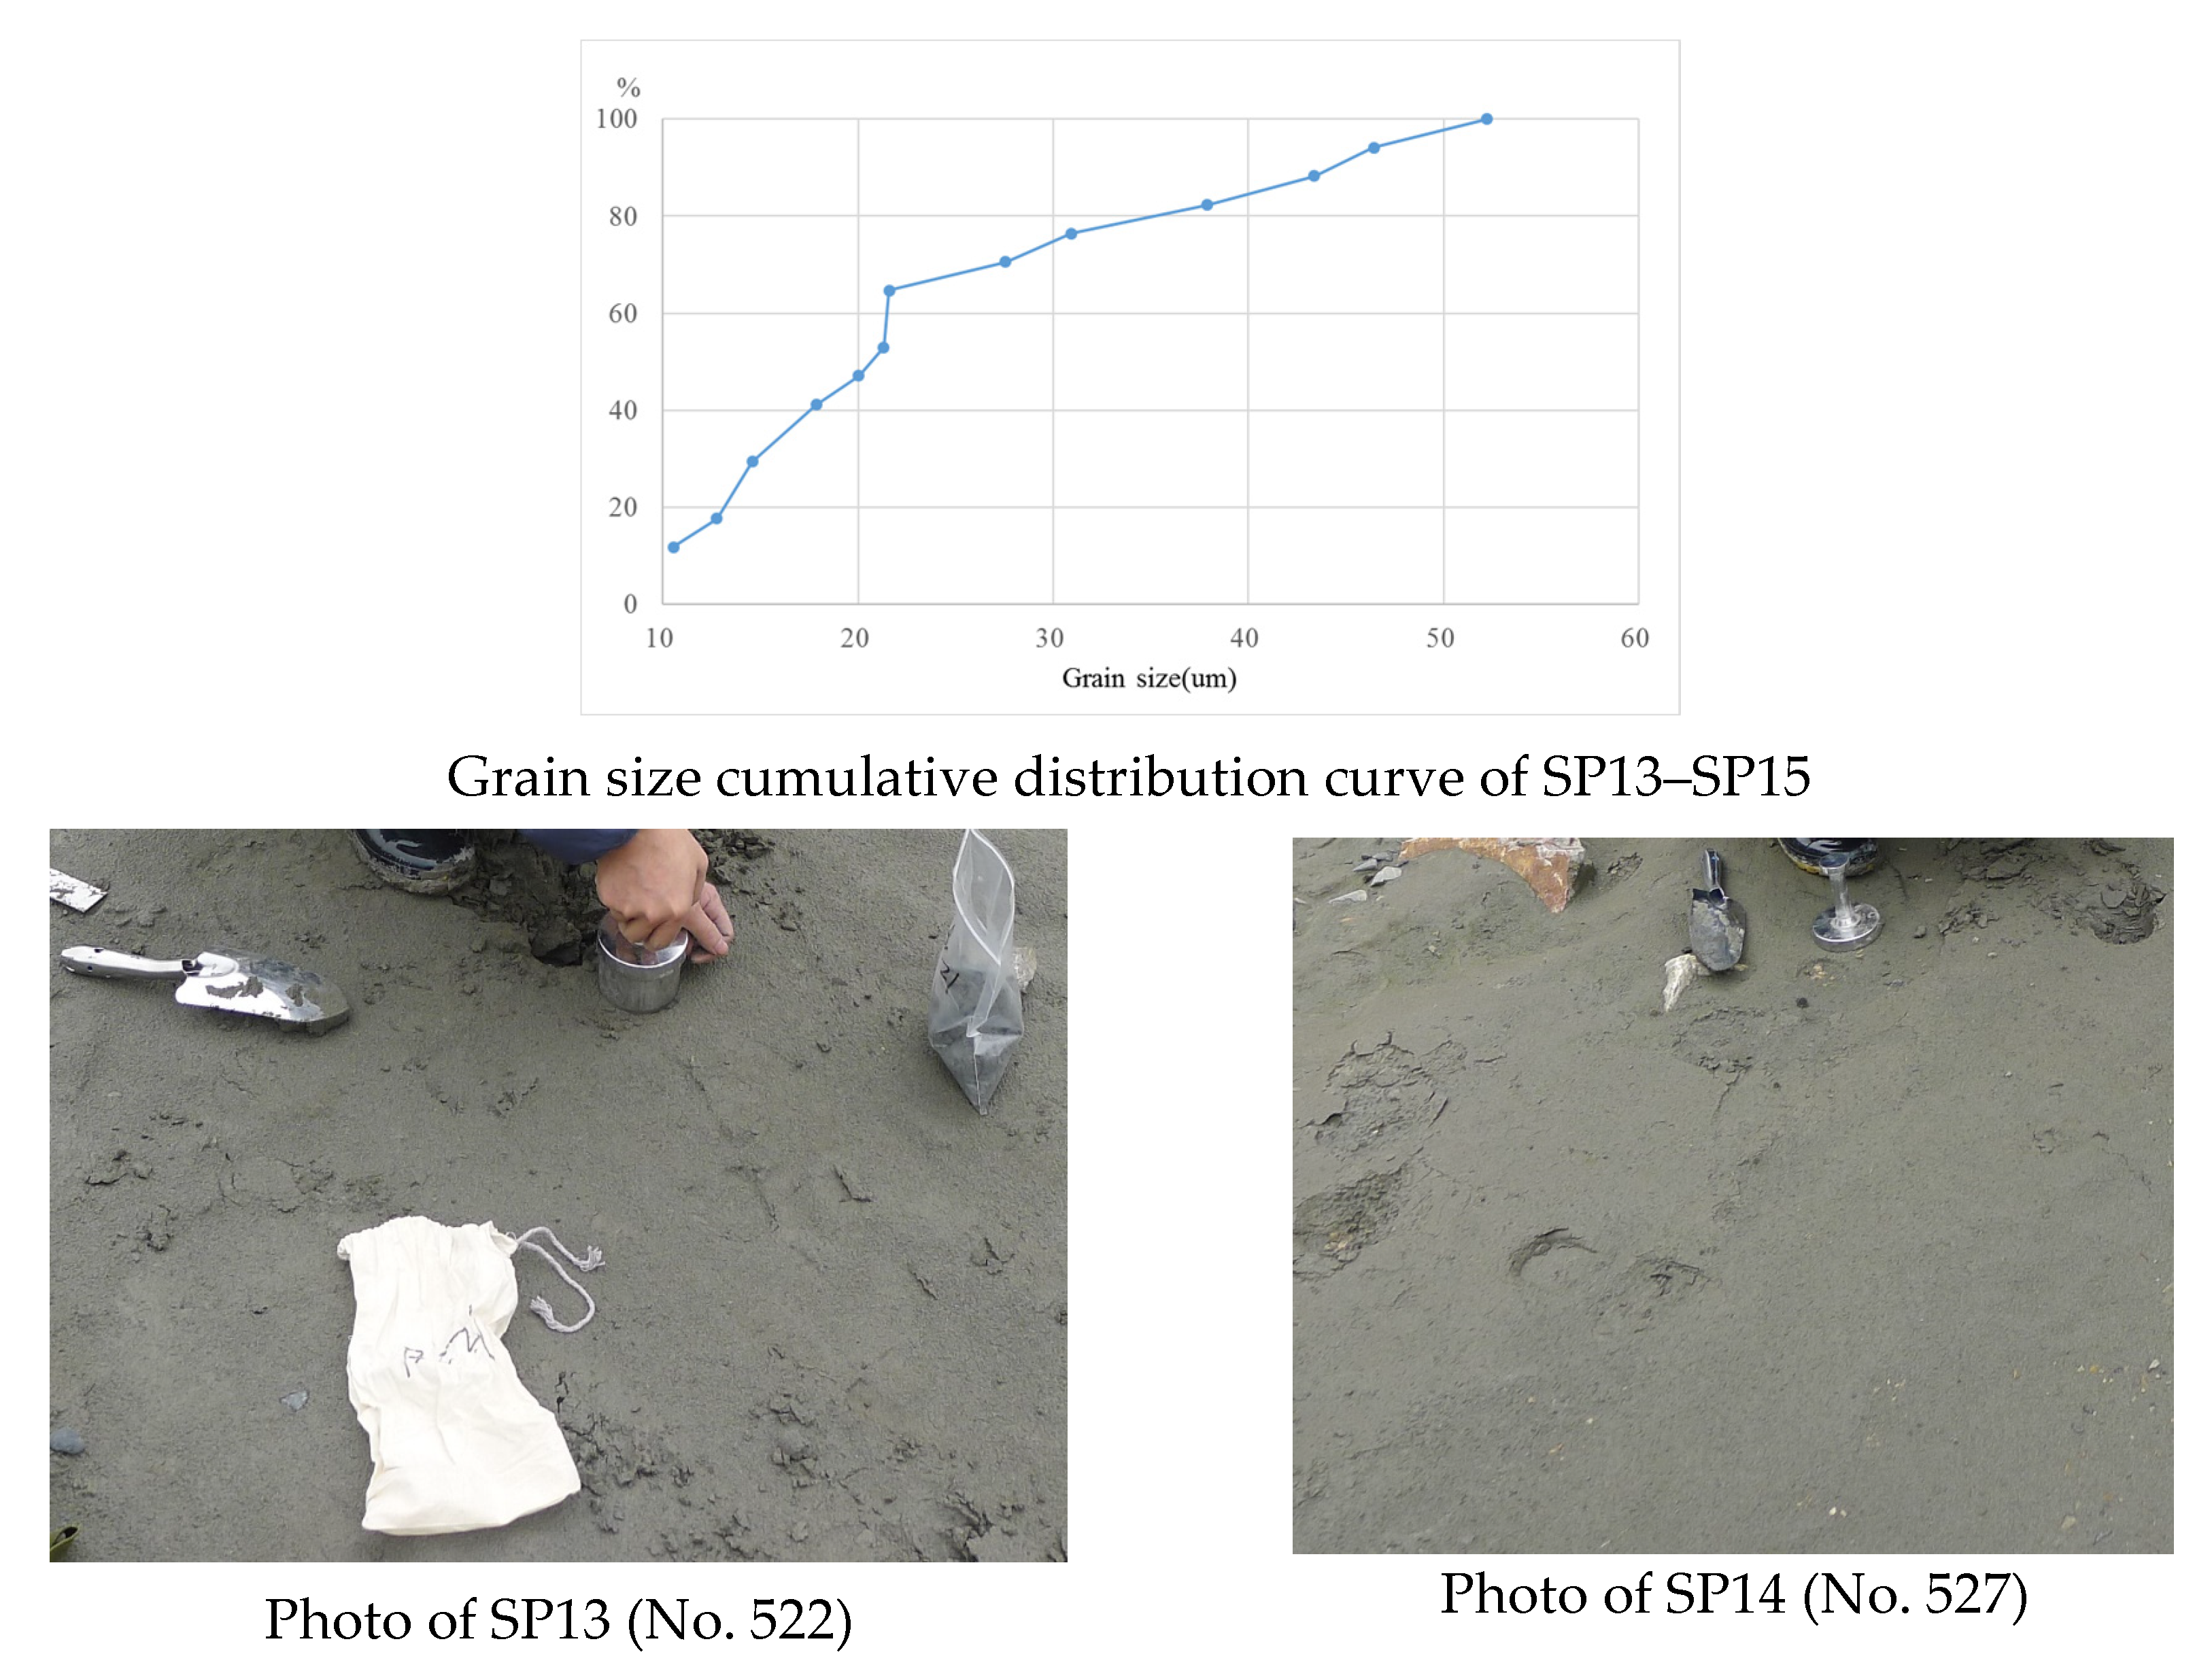
4.1. Grain Size Measurement
4.2. Permeability Coefficient Measurement
4.3. Shear Strength Measurement
4.4. Porosity Measurement
5. Results
6. Discussion
7. Conclusions
- (1)
- The spatial distribution pattern of stability inter-controlled factors of fine-grained sediments in debris flow gullies is summarized.
- (2)
- A relationship between stability inter-controlled factors of fine-grained sediments and outbreak probability of debris flow disasters has been discussed.
Author Contributions
Funding
Data Availability Statement
Conflicts of Interest
References
- Qu, Y. The research on the Dynamic Characteristics of Urgent Steep-channel Debris Flows in Meizoseismal Area. Ph.D. Thesis, Chengdu University of Technology, Chengdu, China, 2016. Available online: https://kns.cnki.net/KCMS/detail/detail.aspx?dbname=CDFDLAST2020&filename=1019216954.nh (accessed on 1 October 2023).
- Li, Z. Study on the characteristics and outthrust of debris flow in steep gully in earthquake region. Master’s Thesis, Chengdu University of Technology, Chengdu, China, 2019. Available online: https://kns.cnki.net/KCMS/detail/detail.aspx?dbname=CMFD202001&filename=1019216296.nh (accessed on 1 October 2023).
- Qi, X.; Yu, B.; Zhu, Y. Experimental Study on the clastic deposition forming Debris Flow. J. Jilin Univ. 2014, 44, 1950–1959. [Google Scholar] [CrossRef]
- Suo, W. Study on the Grain-size Distribution for Initiation and Catastrophe Mechanism of Slag-type Debris Flow. Master’s Thesis, Chang’an University, Xi’an, China, 2019. Available online: https://kns.cnki.net/KCMS/detail/detail.aspx?dbname=CMFD202001&filename=1019674844.nh (accessed on 1 October 2023).
- Fan, S. Solid Source Characteristics and Early Warning of Debris Flow in Zhouqu. Ph.D. Thesis, Lanzhou University, Lanzhou, China, 2018. Available online: https://kns.cnki.net/KCMS/detail/detail.aspx?dbname=CDFDLAST2018&filename=1018829194.nh (accessed on 1 October 2023).
- Xiong, K. Study on Material Erosion Characteristics of Loose Accumulation on Slope after Jiuzhaigou Earthquake. Master’s Thesis, Chengdu University of Technology, Chengdu, China, 2021. Available online: https://kns.cnki.net/KCMS/detail/detail.aspx?dbname=CMFD202301&filename=1022671932.nh (accessed on 1 October 2023).
- Zhang, Z. Study On Erosion and Initiation Characteristics of Debris Flow Deposition Under the Influence of Rainfall and Over-dam Flow: A Case Study of Chutou Gully, Wenchuan, Sichuan. Master’s Thesis, JiLin University, Changchun, China, 2022. Available online: https://kns.cnki.net/KCMS/detail/detail.aspx?dbname=CMFD202202&filename=1022529781.nh (accessed on 1 October 2023).
- Gu, W. Study on Provenance Characteristics and Initiation Mechanism of Debris Flows in Meizoseismal Areas of Wenchuan Earthquake—Taking Study Areas, Gaochuan Village, Qingping Village and Yinxiu Town as Example. Master’s Thesis, Chengdu University of Technology, Chengdu, China, 2015. Available online: https://kns.cnki.net/KCMS/detail/detail.aspx?dbname=CMFD201601&filename=1015312750.nh (accessed on 1 October 2023).
- Yang, F.; Zhou, H.; Huo, M.; Cao, H.; Liang, Y.; Lin, K. Rainfall Induced Debris Flow Characteristics and Mechanisms of Plagues after the Outbreak of the Earthquake in Wenchuan. China Rural. Water Hydropower 2016, 12, 38–42+48. [Google Scholar]
- Yu, Z.; Yuan, L.; Liu, J.; Liu, P.; Wu, H. Study on Distribution and Activity Characteristics of Giant Debris Flow in Wenchuan Earthquake Zone. Subgrade Eng. 2018, 1, 209–215. [Google Scholar] [CrossRef]
- Tang, C.; Tie, Y. Reconnaissance and Analysis on the Rainstorm induced Debris Flow in Weijiagou Valley of Beichuan City after Wenchuan Earthquake. J. Mt. Sci. 2009, 27, 625–630. [Google Scholar]
- Tie, Y.; Tang, C. Response Characteristics between Wenchuan Earthquake and the Rainfall Induced Debris Flow in Beichuan Country, Sichuan. J. Catastrophology 2011, 26, 73–75+81. [Google Scholar]
- Luo, C.; Chen, T.; Fu, Q.; Chen, G.; Li, S. Analysis of Characteristics and Cause of Debris Flow in Yangjia Gully in Beichuan County. J. Southwest Univ. Sci. Technol. 2019, 34, 25–31. [Google Scholar]
- Liu, S.; Kou, G.; Feng, J. Discussion on the geological environment of the causes on the debris flow in Beichuan County. Technol. Innov. Appl. 2018, 01, 177–179. [Google Scholar]
- Legiman, M.K.A.; Mohamad, E.T.; Hasbollah, D.Z.A.; Suparmanto, E.K.; Rathinasamy, V. An overview of debris-flow mathematical modelling. Phys. Chem. Earth 2023, 129, 103301. [Google Scholar] [CrossRef]
- Xia, X.; Jarsve, K.; Dijkstra, T.; Liang, Q.; Meng, X.; Chen, G. An integrated hydrodynamic model for runoff-generated debris flows with novel formulation of bed erosion and deposition. Eng. Geol. 2023, 326, 107310. [Google Scholar] [CrossRef]
- Jiang, X.; Wörman, A.; Chen, X.; Zhu, Z.; Zou, Z.; Xiao, W.; Lia, P.; Liu, G.; Kang, D. Internal erosion of debris-flow deposits triggered by seepage. Eng. Geol. 2023, 314, 107015. [Google Scholar] [CrossRef]
- Domènech, G.; Fan, X.; Scaringi, G.; van Asch, T.W.J.; Xu, Q.; Huang, R.; Hales, T.C. Modelling the role of material depletion, grain coarsening and revegetation in debris flow occurrences after the 2008 Wenchuan earthquake. Eng. Geol. 2019, 250, 34–44. [Google Scholar] [CrossRef]
- Ma, C.; Hu, K.; Tian, M. Post-earthquake relationships of maximum runout amount and loose matter mass in debris flow gully. J. Nat. Disasters 2013, 22, 76–84. [Google Scholar] [CrossRef]
- Wang, J. The Development Characteristics and Risk Assessment of High Debris Flow in Wenchuan Earthquake Area. Master’s Thesis, Chengdu University of Technology, Chengdu, China, 2014. Available online: https://kns.cnki.net/KCMS/detail/detail.aspx?dbname=CMFD201801&filename=1016227078.nh (accessed on 1 October 2023).
- Zhang, X. Study on Source Erosion, Movement Characteristics and Risk Assessment of Debris Flows—A Case Study of Debris Flows Along Du-Wen Highway. Master’s Thesis, Chengdu University of Technology, Chengdu, China, 2015. Available online: https://kns.cnki.net/KCMS/detail/detail.aspx?dbname=CMFD201601&filename=1015312745.nh (accessed on 1 October 2023).
- Wei, B.; Zhao, Q.; Han, G.; Zhang, H. Grey Correlation Method Based Hazard Assessment of Debris Flow in Quake-Hit Area—Taking Debris Flows in Beichuan as An Example. J. Eng. Geol. 2013, 21, 525–533. [Google Scholar]
- Chang, M.; Dou, X.; Fan, X.; Yao, C. Critical Rainfall Patterns for Rainfall-induced Debris Flows in the Wenchuan Earthquake Area. Geoscience 2018, 32, 623–630. [Google Scholar] [CrossRef]
- Chu, S. The Weathering Factor Study on the Formation of Gully—Type Debris Flow—Take Wenchuan Earthquake as an Example. Master’s Thesis, Chengdu University of Technology, Chengdu, China, 2012. Available online: https://kns.cnki.net/KCMS/detail/detail.aspx?dbname=CMFD201301&filename=1012500162.nh (accessed on 1 October 2023).
- Shi, S.; Tu, L.; Shen, W. Geological Characteristics and Dynamics Features of the Debris Flow in Yingtao Gully of Beichuan County, Sichuan Province. Geol. Surv. Res. 2014, 37, 34–38. [Google Scholar]
- Wang, X. Hazard Assessment and Prevention of Wuxinggou Debris Flow in Beichuan County. Master’s Thesis, Southwest University of Science and Technology, Mianyang, China, 2014. Available online: https://kns.cnki.net/KCMS/detail/detail.aspx?dbname=CMFD201801&filename=1017720833.nh (accessed on 1 October 2023).
- Hu, S. The Prediction Explores of Secondary Geological Disaster Caused by 5.12 Earthquake in Beichuan County. Master’s Thesis, Sichuan Normal University, Chengdu, China, 2015. Available online: https://kns.cnki.net/KCMS/detail/detail.aspx?dbname=CMFD201601&filename=1015372910.nh (accessed on 1 October 2023).
- Mei, Y. 5.12 Earthquake in Beichuan County, Sichuan Province Area Debris Flow Hazard Assessment. Master’s Thesis, Chengdu University of Technology, Chengdu, China, 2011. Available online: https://kns.cnki.net/KCMS/detail/detail.aspx?dbname=CMFD2012&filename=1011235513.nh (accessed on 1 October 2023).
- Zhang, Q.; Pan, Q.; Chen, Y.; Luo, Z.; Shi, Z.; Zhou, Y. Characteristics of landslide-debris flow accumulation in mountainous areas. Heliyon 2019, 5, e02463. Available online: http://creativecommons.org/licenses/by-nc-nd/4.0/ (accessed on 1 October 2023).
- Hu, T. The Research on Formation Mechanism and Mitigation Measures of Large-Scale Debris Flow in the Wenchuan Earthquake Area. Ph.D. Thesis, Chengdu University of Technology, Chengdu, China, 2017. Available online: https://kns.cnki.net/KCMS/detail/detail.aspx?dbname=CDFDLAST2020&filename=1019216142.nh (accessed on 15 October 2023).
- Zhang, S.; He, Y.; He, M. Source analysis and prevention plan determination of debris flow in Yangjiagou, Beichuan earthquake stricken area. Sichuan J. Geol. 2014, 34, 80–84. [Google Scholar]
- Li, C.; Dong, T. Types and characteristics of geological disasters in Beichuan County. J. Mianyang Teach. Coll. 2017, 36, 93–97. [Google Scholar] [CrossRef]
- Wang, Y. Hazard Assessment on Rainstorm Induced Debris Flows in Beichuan County of Wenchuan Earthquake Affected Area. Master’s Thesis, Chengdu University of Technology, Chengdu, China, 2009. Available online: https://kns.cnki.net/KCMS/detail/detail.aspx?dbname=CMFD2010&filename=2009221507.nh (accessed on 15 October 2023).
- Yuan, L.; Chen, X.; Wu, H.; Qiu, E. Study on Formation Mechanism of Debris Flow in Xijia Valley and the Engineering Measures for Control. Subgrade Eng. 2020, 4, 212–221. [Google Scholar] [CrossRef]
- Hu, K.; You, Y.; Zhuang, J.; Chen, X. Characteristics and Countermeasures of Debris Flows in Beichuan’s Meizoseismal Area. Sci. Geogr. Sin. 2010, 30, 566–570. [Google Scholar] [CrossRef]
- Yu, Y.; Wei, L.; Chen, T. Characteristics of Debris flows and Control in Jiangjia Gully of Beichuan, Sichuan. J. Geol. Hazards Environ. Preserv. 2012, 23, 5–9. [Google Scholar]
- Wu, Q.; Xu, L.; Zhou, K.; Liu, Z. Starting analysis of loose accumulation of gully-startup debris flow. J. Nat. Disasters 2015, 24, 89–96. [Google Scholar] [CrossRef]
- Xie, M.; Wang, Y.; Zhang, H.; Zhao, Y.; Zhao, R. The Deposite Analysis of Water Dynamic Conditions to Form Debris Flow and to Set up Mathematical Model in Debris Flow Valley. J. Beijing For. Univ. 1993, 15, 1–11. [Google Scholar]
- Xu, X.; Chen, J.; Shan, B. Study of Grain Distribution Characteristics of Solid Accumulation in Debris Flow. Yangtze River 2015, 46, 51–54. [Google Scholar] [CrossRef]
- Wang, Q.; Xie, J.; Yang, J.; Liu, P.; Chang, D. A hyperspectral detection model for permeability coefficient of debris flow fine-grained sediments, Southwestern China. Int. J. Digit. Earth 2023, 16, 1589–1606. [Google Scholar] [CrossRef]
- Wang, Q.; Xie, J.; Yang, J.; Liu, P.; Chang, D.; Xu, W. A Model between Cohesion and Its Inter-Controlled Factors of Fine-Grained Sediments in Beichuan Debris Flow, Sichuan Province, China. Sustainability 2022, 14, 12832. [Google Scholar] [CrossRef]
- Wang, Q.; Xie, J.; Yang, J.; Liu, P.; Chang, D.; Xu, W. A Research on Cohesion Hyperspectral Detection Model of Fine-Grained Sediments in Beichuan Debris Flow, Sichuan Province, China. Land 2022, 11, 1609. [Google Scholar] [CrossRef]
- Wang, Q.; Xie, J.; Yang, J.; Liu, P.; Chang, D.; Xu, W. Research on Permeability Coefficient of Fine Sediments in Debris-Flow Gullies, Southwestern China. Soil Syst. 2022, 6, 29. [Google Scholar] [CrossRef]
- Yu, J. Study on Permeability Characteristic and Fine Particle Migration Law of Deposited Soil in Debris Flow Channel. Master’s Thesis, Sichuan Normal University, Chengdu, China, 2020. Available online: https://kns.cnki.net/KCMS/detail/detail.aspx?dbname=CMFD202101&filename=1020746689.nh (accessed on 20 October 2023).
- GB/T 50145-2007; Engineering Classification Standard for Soil. China Planning Press: Beijing, China, 2008.
- Liu, Y. Research on Test Method for Permeability Coefficient of Cohesionless Coarse grained Soil in Hydraulic Engineering. Shaanxi Water Resour. 2020, 12, 211–213. [Google Scholar]
- Sun, X.; Wang, D. Analysis of Soil Cohesion Values. Liaoning Build. Mater. 2010, 3, 39–42. [Google Scholar]


| Materials | Equipment | Manufacturer/Provider |
|---|---|---|
| Remote sensing images | Gaofen-2 (GF-2) | Land satellite remote sensing application center, Beijing, China |
| Digital elevation model (DEM) | Advanced Spaceborne Thermal Emission and Reflection Radiometer (ASTER) | Ministry of International Trade and Industry, Tokyo, Japan |
| Soil | Ring knife (200 mL) | Longnian Hardware Tools Store, Suqian, China |
| Particle size | Mhcrotra-S3500 | Microtrac MR B, Montgomeryville, PA, USA |
| Permeability coefficient | TST-55 permeameter | Zhejiang Dadi Instrument Co., Ltd., Shaoxing, Zhejiang, China |
| Density | MDJ-300A solid densitometer | Shanghai Lichen Instrument Technology Co., Ltd., Shanghai, China |
| Porosity | TST-55 permeameter | Zhejiang Dadi Instrument Co., Ltd., Shaoxing, Zhejiang, China |
| Shear strength | ZJ strain-controlled direct shear instrument | Nanjing soil instrument factory Company Limited (Co., Ltd.), Nanjing, Jiangsu, China |
| Sampling Points | Number | Sampling Points | Number |
|---|---|---|---|
| SP01 | 20 | SP09 | 20 |
| SP02 | 15 | SP10 | 10 |
| SP03 | 15 | SP11 | 10 |
| SP04 | 15 | SP12 | 10 |
| SP05 | 20 | SP13 | 10 |
| SP06 | 15 | SP14 | 10 |
| SP07 | 10 | SP15 | 10 |
| SP08 | 10 | ||
| Total | 200 |
Disclaimer/Publisher’s Note: The statements, opinions and data contained in all publications are solely those of the individual author(s) and contributor(s) and not of MDPI and/or the editor(s). MDPI and/or the editor(s) disclaim responsibility for any injury to people or property resulting from any ideas, methods, instructions or products referred to in the content. |
© 2024 by the authors. Licensee MDPI, Basel, Switzerland. This article is an open access article distributed under the terms and conditions of the Creative Commons Attribution (CC BY) license (https://creativecommons.org/licenses/by/4.0/).
Share and Cite
Wang, Q.; Xie, J.; Yang, J.; Liu, P.; Xu, W.; Yuan, B. Research on Spatial Distribution Pattern of Stability Inter-Controlled Factors of Fine-Grained Sediments in Debris Flow Gullies—A Case Study. Water 2024, 16, 634. https://doi.org/10.3390/w16050634
Wang Q, Xie J, Yang J, Liu P, Xu W, Yuan B. Research on Spatial Distribution Pattern of Stability Inter-Controlled Factors of Fine-Grained Sediments in Debris Flow Gullies—A Case Study. Water. 2024; 16(5):634. https://doi.org/10.3390/w16050634
Chicago/Turabian StyleWang, Qinjun, Jingjing Xie, Jingyi Yang, Peng Liu, Wentao Xu, and Boqi Yuan. 2024. "Research on Spatial Distribution Pattern of Stability Inter-Controlled Factors of Fine-Grained Sediments in Debris Flow Gullies—A Case Study" Water 16, no. 5: 634. https://doi.org/10.3390/w16050634