Abstract
With the increase in both rainfall and intensity due to climate change, the risk of debris flows is also increasing. In Korea, the increasing damage caused by debris flows has become a social issue, and research on debris-flow response is becoming increasingly important. Understanding the rainfall that induces debris flows is crucial for debris-flow response, and methods such as the I-D method have been used to evaluate and predict the risk of debris flows. However, previous studies on debris flow-induced rainfall analysis have been limited by the subjective decision of the researcher to select the impact meteorological stations, which greatly affects reliability. In this paper, in order to establish an objective standard, various maximum allowable distances between debris-flow disaster areas and meteorological stations were adjusted to 1, 3, 5, 7, 9, 11, 13, and 15 km using the CTRL-T automatic calculation algorithm, and the optimal maximum allowable distance suitable for Korean terrain was derived through parameter sensitivity analysis. Based on this, we developed a nomogram for sediment disaster risk prediction and warning in Gangwon-do, and applied it to past disaster cases, and found that, although the prediction time for each stage varies depending on the maximum allowable distance, on average, it is possible to predict the risk of sediment flows 4 to 5 h in advance. It is believed that the results of this study can be used to reduce sediment flow damage in advance.
1. Introduction
Increasing rainfall intensity due to climate change has raised the hazard of a debris-flow disaster in the vicinity of mountainous areas in Korea, resulting in higher risks to human lives and properties [1]. In particular, 43 people died from torrential rains caused by debris-flow disaster damage in Woomyeonsan in Seoul and Majeoksan in Chuncheon City in July 2011. In 2020, five deaths occurred in Gokseong-gun, Jeollanam-do. The damage caused loss of life and property, further emphasizing the social issue at hand. To address debris-flow disasters, establishing standards for early forecasting and alert issuance is essential. Preceding rainfall conditions, which influence soil stress and pore water pressure, are crucial factors that should be considered the direct cause of a debris-flow disaster [2,3,4,5].
Many studies have been conducted on debris-flow disaster research recently. Ref. [6] developed a low-cost tilt-based rainfall-induced landslide monitoring system using the economical and precise MEMS sensor to record displacement and volumetric water content. Ref. [7] introduced a methodology for establishing rainfall thresholds critical for debris flow early warnings in regions lacking extensive data, utilizing a hydraulic initiation model. This research confirmed the approach’s reliability through analysis in the Guojuan Gorge, further suggesting an early warning model based on precise rainfall thresholds. Such advancements are pivotal for improving disaster response and mitigation efforts in mountainous territories with similar geographical characteristics. Ref. [8] studied the specific rainfall intensity and cumulative precipitation levels required for the initiation of soil flow in the region through an in-depth analysis of three major storms in Beijing and proposed integrating real-time rainfall intensity for accurate soil flow prediction and early warning systems. Ref. [9] employed rainfall data spanning 2012 to 2015 to elucidate rainfall patterns and identify critical thresholds that instigate periglacial debris flows in the Parlung Zangbo Basin, located in the southeastern Tibetan Plateau. The study underscored the significant influence of varied sediment conditions and rainfall dynamics on the initiation of debris flows, advocating for the necessity of conducting site-specific assessments to enhance the precision and reliability of debris flow monitoring and early warning mechanisms. Ref. [10] details a data-driven methodology combining artificial neural networks (ANNs) and particle swarm optimization (PSO) for establishing rainfall thresholds crucial for debris flow initiation. This approach, when applied to the Beijing and Wenchuan earthquake regions, refines early warning models by accurately identifying intricate, non-linear thresholds for rainfall intensity and duration. This strategy surpasses traditional linear regression techniques in enhancing debris flow hazard prediction and management efficacy. Ref. [11] developed and tested an algorithm for the objective and reproducible reconstruction of rainfall events that have resulted in landslides. Ref. [12] used a new release of the algorithm that allows calculating reproducible rainfall thresholds from multiple ED rainfall conditions that have resulted in landslides. and tested the algorithm in Sicily, southern Italy.
In a previous study on the threshold rainfall that triggers debris flows, ref. [13] identified 683 rainfall-induced landslides in Lombardy over the period 1927–2008 and calculated thresholds using mean annual precipitation (MAP)-normalized intensity–duration thresholds. The results showed that debris flows frequently occurred within 1 to 3 h of the maximum recorded rainfall intensity in summer and within 5 h in spring or fall. Ref. [14] proposed an equation to determine the rainfall duration–intensity threshold for predicting debris flows using data from the Sichuan region of China, and indicated that . Ref. [15] indicated that although debris flows and warning thresholds have been derived from existing 30-year studies, they vary across the United States and thresholds should be derived for each region, using soil wetting functions, precipitation characteristics, etc. Ref. [16] defined four groups of rainfall thresholds for landslide occurrence using regression values at each quantile level of quantile regression based on landslides that occurred in China from 1998 to 2017, including the original rainfall event–duration (E-D) threshold and the normalized (normalizing cumulative rainfall to annual mean rainfall) and merged (EMAP-D) rainfall and Climate Prediction Center Morphing Technique (CMORPH) rainfall products, respectively. The E-D thresholds defined in the paper were generally lower than other thresholds in previous studies on a global scale and on a regional or national scale in China, suggesting that this was due not only to the larger number of landslide cases used, but also to the combined effects of China’s special geological environment, climatic conditions, and human activities. Ref. [17] analyzed 85 debris flows from 1910 to 2019 in the protofino promotor and used 69 clusters of rainfall events that triggered 94 slope failures for which landslide and rainfall information were known with sufficient geographic and temporal accuracy to set empirical ID thresholds adopting a frequentist approach, and used the Mann–Kendall test and Hurst exponent to detect potential trends. The analysis of the long-term rainfall time series showed a statistically significant increasing trend in short-term precipitation events and rainfall amounts, suggesting the possibility of future scenarios where thresholds are exceeded more frequently and landslide risk increases. Ref. [18] analyzed the occurrence of debris flows in Taiwan and presented short-term (less than 12 h) high-intensity rainfall, high-intensity and cumulative rainfall, and long-term (more than 36 h) high-accumulative rainfall as rainfall characteristics that trigger landslides. The study proposed a combination of warning models for landslides from cumulative rainfall–duration plots with rainfall intensity classification and average rainfall–duration plots with cumulative rainfall classification, and suggested that the thresholds are being lowered due to climate change.
The concept of marginal rainfall using prior rainfall and rainfall intensity was proposed [19]. Subsequently, an equation for the rainfall intensity-duration curve has been derived from empirical debris-flow data, leading to the development of various methodologies aimed at the probabilistic forecasting of debris flows [20,21,22]. Recently, ref. [23] introduced a methodology for automatically selecting rainfall observatories that affect debris-flow disasters using rainfall and topographic data and calculating the preceding rainfall for debris-flow disasters. Meanwhile, ref. [24] applied the relevant algorithm to Slovenia to establish an early warning system for debris-flow disasters. Then, ref. [25] suggested improving the algorithm’s results using neural networks. Ref. [26] used GLDAS (Global Land Data Assimilation System) to analyze the effects of air temperature and precipitation on the characteristics of soil moisture in the eastern region of China from 1961 to 2011, and found that the temperature and precipitation in different seasons have different degrees of influence on the characteristics of soil moisture in each layer. Ref. [27] introduced and applied the innovative RSI-Net, which aims to improve the distinguishability of correlations among adjacent land covers and address the issue of boundary blurring in high-resolution remote sensing imagery. Ref. [28] proposed an improved bat algorithm for dam deformation prediction based on a hybrid-kernel extreme learning machine.
Ref. [29] develops slope-specific thresholds for dimensionless discharge and Shields stress to forecast debris flow initiation following wildfires. This work further presents a process-oriented approach for deriving rainfall intensity-duration thresholds, showcasing their consistency with empirical data. This synergy between process-based hydrologic models and empirical observations significantly advances the accuracy of debris flow warning systems. Ref. [30] presented the capability of a deep learning algorithm to determine the distribution of landslide rainfall thresholds in a potential large-scale landslide area and to assess the distribution of recurrence intervals using probability density functions, as well as to assist decision makers in early responses to landslides and reduce the risk of large-scale landslides. Ref. [31] analyzed Kalimpong town in the Darjeeling Himalayas, which is among the regions most affected by landslides, using the SIGMA model, and calculated threshold rainfall. Among domestic research cases, refs. [3,32] applied the Rainfall Triggering Index (RTI), which is the product of the preceding rainfall duration and intensity, to Korea, and proposed a debris-flow risk criteria using a probability density function. Ref. [33] proposed the risk criterion using quantile regression analysis based on the duration and the intensity of rainfall before the occurrence of a debris-flow disaster. To establish a Korean early warning system for a debris-flow disaster, a program-based automation algorithm is required, and an evaluation of the applicability of such an automation algorithm is deemed necessary.
Based on the above studies, it was found that existing empirical equations are mainly used in studies to analyze the damage of debris flows or to calculate the critical rainfall amount that causes debris flows. In this paper, we selected Gangwon-do province, where many landslides have occurred, as the target area, and collected debris flow occurrence information, as well as rainfall and topography information. Using this information, we conducted an analysis using statistical techniques, and finally defined various maximum allowable distances from debris-flow damage points and meteorological zones to establish objective criteria. Through the parameter sensitivity analysis of the algorithm proposed by [12], we derived the optimal maximum allowable distance suitable for Korean terrain.
2. Theoretical Background
2.1. Automated Rainfall Estimation Program for Debris Flow Disasters
Rainfall standards that cause debris-flow disasters are mainly presented using the intensity–duration (I-D) method, which analyzes the relationship between rainfall intensity and duration, and various domestic and overseas studies have been conducted in this regard. In using the I-D method, selecting meteorological stations and the maximum allowed delay time between the end of the rainfall season and the occurrence of the debris-flow disaster are important input parameters that researchers may define differently. Ref. [22] proposed an automatic rainfall threshold calculation tool to predict debris flows applicable in southern Sicily, Italy, to address this issue objectively. In this study, the tool proposed by [12] was adapted and developed with the R language to suit the Korean terrain. Figure 1 shows the flowchart of this study, while Figure 2 shows the algorithm components of the rainfall threshold. In the input section, information on the occurrence of debris-flow disasters (debris-flow.csv), rain gauge stations (table_of_raingauge.csv), and rainfall time series (TimeSeries_Sensor.csv) are provided. The computation section comprises utils, a useful utility for programming and developing R packages; caTools for encoders, decoders, and classifiers; ggmap for spatial data visualization; and MASS for statistical functions. Finally, the output section provides reconstructed rainfall events affecting debris-flow disasters and the analysis results of reconstructed rainfall conditions and thresholds.
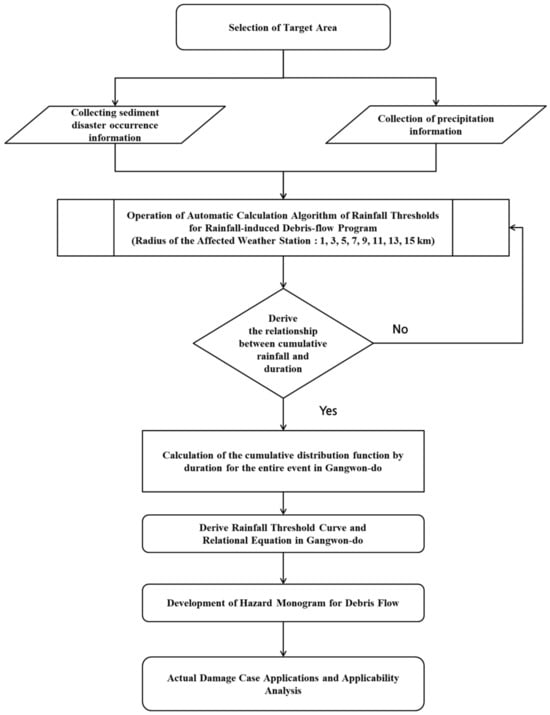
Figure 1.
Flow chart of study.
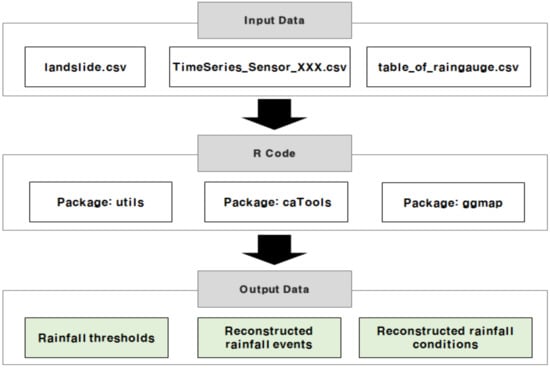
Figure 2.
Components of algorithm for the rainfall threshold.
2.2. Algorithm for Calculating Debris Flow-Induced Rainfall Thresholds
The computation of the debris flow-induced rainfall threshold is based on the continuous time rainfall data, geographical coordinates of debris-flow disaster locations, and the occurrence time of the debris-flow disaster. The algorithm reconstructs rainfall events and determines the events influencing debris-flow disasters. In this process, the maximum allowed distance between the representative rain gauge and the debris-flow disaster location and the maximum allowed delay time between the end of the rainfall event and the occurrence of the debris-flow disaster are defined. In this study, the maximum allowed distance was defined as 15 km, and the maximum allowed delay time was defined as 48 h.
Separate blocks perform threshold calculation in the automatic threshold calculation program, and each block performs a specific operation (Figure 3). In the first block, the individual rainfall ideology is reconstructed based on a continuous rainfall time series, and the duration (D, h) and cumulated rainfall (E, mm) for each rainfall event are calculated. The separation of continuous rainfall time series is based on climate and seasonal environments. This study defined the suitable period for Korea, the warm season (March–August). In the second block, the rain gauge closest to the area where the debris flow occurred is selected. At this time, the maximum allowed distance between the debris-flow disaster occurrence point and the rain gauge is selected within a circular area with the defined allowed distance radius, and the inverse distance weighting (IDW) method is used to determine the multiple rainfall conditions (MRCs). The stations near the debris flow occurrence site are weighted by the distance of the rainfall station from the rainfall duration () and cumulative rainfall () to select the stations most associated with debris flows [15].
where is a weighting factor for the impact on debris flow occurrence, is the cumulative rainfall, and is the duration. When reconstructing the rainfall event, missing data along with no rainfall (0.2 mm) are removed to construct the rainfall event.
Lastly, in the third block, the different exceedance probabilities (EPs) are used to calculate the relationship between the cumulated rainfall (E) and duration (D). At this time, the threshold is defined using a frequency approach (Equation (2)) and calculated as a power function.
where α is the scaling parameter (the intercept) and γ is the shape parameter (that defines the slope of the power law curve). ∆α and ∆γ represent the relative uncertainty of the two parameters. See Ref. [34] for a detailed description of the above equation.

Figure 3.
Data analysis process by block intervals [35].
Figure 3.
Data analysis process by block intervals [35].

3. Calculation and Verification of Rainfall Thresholds
3.1. Collection of Information on the Occurrence of Debris-Flow Disasters
The area of Gangwon Province, characterized by its mountainous terrain which accounts for more than 80% of Korea’s frequent debris flow incidents, was selected as the focal region for this investigation. The geographical distribution of these debris flows is illustrated in the subsequent figure (Figure 4). Furthermore, an exhaustive literature review was conducted to amass a historical dataset of debris flow occurrences, with entries lacking precise locational and temporal data being systematically eliminated. As a result, the specific locations and times of occurrence for 18 debris flow events between 27 July 2011 and 5 August 2020 were compiled (Table 1). Additionally, rainfall data were sourced from the Korea Meteorological Administration (https://www.weather.go.kr). While the conventional methodology relied on the nearest rain gauge to establish a link between debris flows and rainfall, this study introduces an advanced methodology that automatically incorporates all viable gauges within a defined radius. This method applies weighting factors that account for both the spatial distance between the debris flow site and the gauge and hydrological attributes such as the volume of rainfall and the event’s duration, recognizing that a debris flow may be precipitated by multiple rainfall events. Moreover, the applicability of the proposed methodology was validated through its application to the 2019 debris-flow disaster in Gangwon-do, which tragically resulted in human casualties.
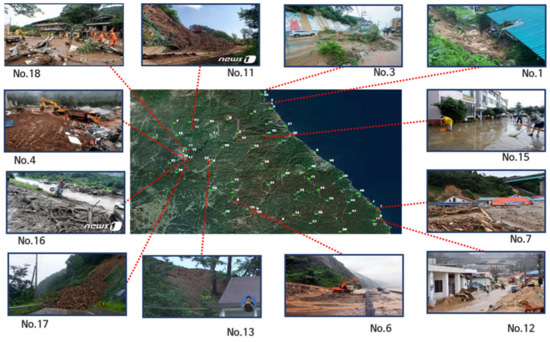
Figure 4.
Analysis area and historical damage [35].

Table 1.
Status of debris flow occurrence time and location.
3.2. Meteorological Stations and Collection of Rainfall Information
As shown in Figure 4, we collected weather and rainfall data from 46 Automatic Weather System (AWS) locations in Gangwon Province provided by the Korea Meteorological Administration. The data included hourly rainfall data from 00:00 on 1 January 2010 to 23:00 on 31 December 2020. Only 22 of the 46 rain gauges corresponded to the rainfall that caused the debris-flow disaster and were used to build the data. The final data, including the ID, name, and location of the 46 weather stations, are shown in Table 2.
Table 2.
Location of meteorological stations and points.
3.3. Setting the Influence Distance of Meteorological Stations
The radius was adjusted to 1, 3, 5, 7, 9, 11, 13, and 15 km from the individual debris-flow disaster point to analyze the parameter sensitivity of the automatic rainfall threshold calculation algorithm. Here, the reason why the maximum threshold is assumed to be 15 km is that Korea has a small land area and a close distance between weather stations. Stations within the affected radius from the location of the individual debris-flow disaster were selected, and the cumulative rainfall for each duration of the disaster was calculated for 24 h before the occurrence of the debris-flow disaster (Figure 5).
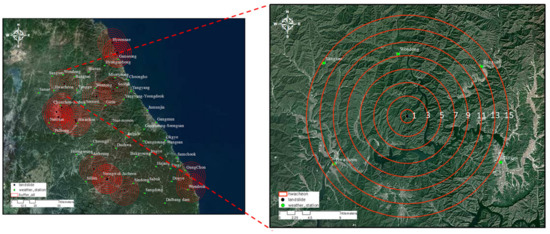
Figure 5.
Status map of the influence distance setting for meteorological stations.
4. Analysis Results
Using the debris flow-induced rainfall threshold calculation program, 16,423 rainfall events were reconstructed during the study’s target period (2010–2020). In addition, it was derived that 14 of the 18 debris-flow disaster events entered, considering the location of the debris-flow disaster and the distance from the rain gauge, were caused by rainfall. thirty-six rainfall events were identified as being closely associated with the occurrence of fourteen debris-flow disaster events. For these, the logarithmic distribution of cumulative event rainfall (EL) and rainfall event duration (DL) is shown in Figure 6a. Meanwhile, the empirical cumulative distribution function (ECDF) and duration relationship curve (Figure 6b) and ECDF and cumulative rainfall (E) relationship curve (Figure 6c) were derived. As a result of the derivation, it was found that about 40% of debris-flow disasters occurred within 24 h and 80% occurred in the cumulative rainfall section of less than 200 mm. It can be seen that debris-flow disasters take place due to torrential rains that occur in a short period of time. In the final nomogram, a logarithmic scale was not utilized to examine the sensitivity of station distance to debris flow occurrences. Instead, the focus was on determining the amount of lead time that can be secured prior to a debris flow event, based on the time of day.
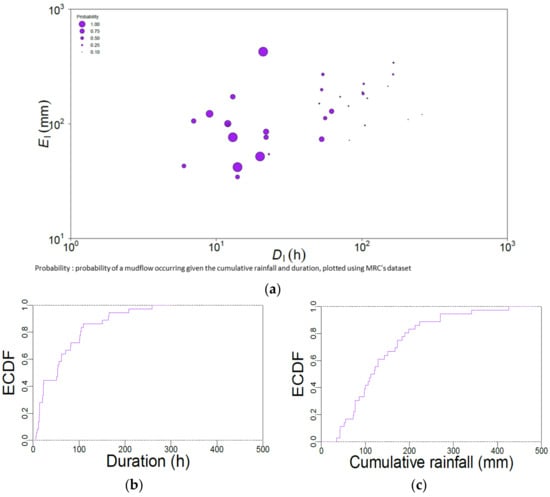
Figure 6.
(a) Distribution of the DL (rainfall event duration) and EL (cumulated event rainfall) pairs, in log-log coordinates (purple dots); (b) ECDF (the empirical cumulative distribution function) of D (duration); (c) ECDF of E (cumulated rainfall) [35].
Utilizing the compiled datasets of rainfall and debris-flow incidents, thresholds for cumulative rainfall (E) and event duration (D) across the designated study area were established. Subsequently, correlation analyses yielded graphs and equations linking cumulative precipitation to duration for exceedance probabilities (EPs) of 70% (represented in blue), 50% (in gray), and 10% (in yellow), as illustrated in Figure 7. Nevertheless, the absence of meteorological stations precluded the generation of graphs for maximum permissible distances of 1, 3, 5, and 7 km. Conversely, at extended distances of 9, 11, 13, and 15 km, significant correlations were identified. The analysis indicated an increase in the optimal maximum allowable distance for cumulative rainfall duration at 11 km compared to 9 km, with a subsequent decrease in correlation strength at distances of 13 and 15 km.
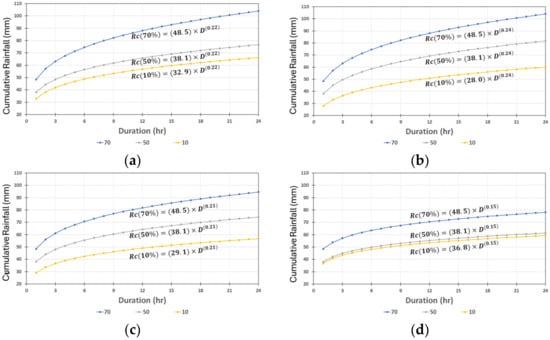
Figure 7.
Plot with the ED (cumulative event rainfall–duration) conditions that triggered debris-flow corresponding to 70%, 50%, and 10% thresholds (maximum allowed distance: 9 km (a), 11 km (b), 13 km (c), and 15 km (d)).
Table 3 details the parameters α and γ, along with the outcomes of the analysis on the relationship between cumulative rainfall and duration, contingent upon the maximum permissible distance from the influencing meteorological station. Table 4 summarizes the results of calculating cumulative rainfall and rainfall intensity according to the duration of each maximum allowed distance.
Table 3.
Parameters α and γ, at various exceedance probabilities.
Table 4.
Rainfall analysis results Based on exceedance probability by maximum allowed distance.
Using the results of Table 4 and debris-flow disaster occurrence information and rainfall information in Gangwon-do, a soil disaster risk nomogram according to the maximum allowable distance (9, 11, 13, and 15 km) by excess probability (70%, 50%, and 10% range) was developed. In this paper, the warning stage was classified according to the excess probability, and the 10–50% section was classified as alert, the 50–70% section as warning, and emergency when it was 70% or more. Based on the case of Samcheok Sinnam Village, an area affected by the debris-flow disaster in October 2019, the applicability of the time-specific risk matrix was reviewed. Figure 8a illustrates the hyetograph for a case where a debris flow occurred. In Figure 8b, the formula based on exceedance probability is presented, with the vertical dashed line indicating the moment when the debris flow occurred. Figure 8c shows the warning levels according to cumulative rainfall. When applying the nomogram with a maximum allowed distance of 9 km, it was observed that it reached the most dangerous “severe” level about 4 h before the debris-flow disaster occurred (3 October 2019, 01:00), as shown in Figure 8.
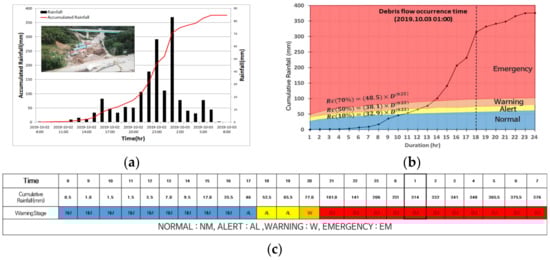
Figure 8.
Application to Samcheok Sinnam Village damage case and risk rating status [35].
Upon applying the nomogram to each maximum allowable distance, the analysis revealed that Figure 9a entered the severe level approximately 4 h prior to the debris flow disaster, based on a maximum allowable distance of 9 km. Figure 9b entered the severe level about 4 h before, with a maximum allowed distance of 11 km. Figure 9c, with a maximum allowed distance of 13 km, entered the severe level about 5 h before, and Figure 9d, with a maximum allowed distance of 15 km, was found to enter the severe level about 5 h before. In this context, the arrow indicates the transition from a warning to an emergency phase, while the black circle denotes the moment when the debris flow occurred.
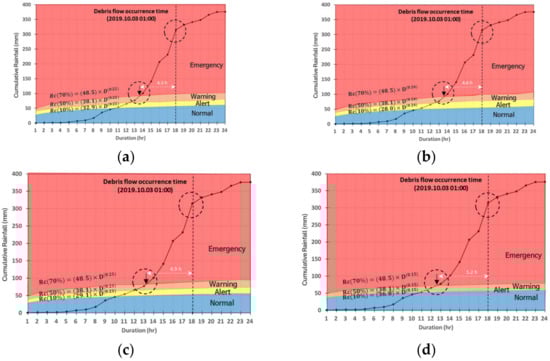
Figure 9.
Results by maximum allowable distance ((a) maximum allowable distance 9 km: entered emergency stage about 4.3 h before the debris-flow disaster event occurred; (b) maximum allowable distance 11 km: entered emergency stage about 4.6 h before; (c) maximum allowable distance 13 km: entered emergency stage about 4.9 h before; and (d) maximum allowable distance 15 km: entered emergency stage about 5.2 h before).
In [32], radar rainfall was used to estimate the rainfall of localized debris flows in mountainous areas, and a radar rainfall calibration model was developed using machine learning techniques. The basin average rainfall of the calibrated radar rainfall was calculated and applied to the same area as the subject of this study. The result of [32] showed a forecasting time of 3 h, as shown in Figure 10, but in this study, an average forecasting time of 4 to 5 h can be obtained.
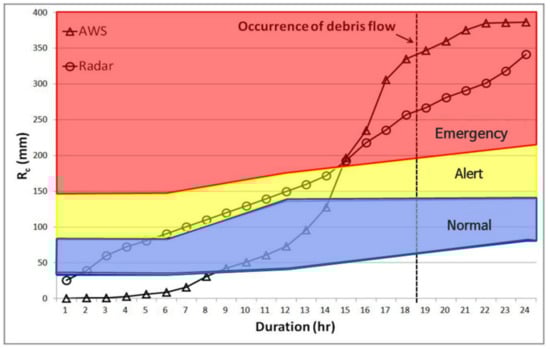
Figure 10.
Evaluation and verification of applicability to debris-flow forecasting using mean areal rainfall [32] (: Critical Accumulated Rainfall).
When comparing the results of this study with other studies, it was found that appropriate values were obtained, and although there are limitations in the terrain characteristics of Gangwon-do, it was concluded that the influence range of each rain gauge could be applied up to 15 km.
5. Summary and Conclusions
Due to climate change, there has been an increase in rainfall intensity over time, leading to an escalation in debris-flow occurrence and damages, making it a significant social issue. Rainfall is a direct factor that causes debris-flow disasters. Therefore, analyzing the relationship between rainfall and debris-flow disasters is essential as a proactive measure in developing debris-flow disaster forecasting and response systems. In this study, the tool proposed by [21] was adapted to calculate the amount of debris flow-induced rainfall suitable for the Korean terrain through a parameter sensitivity analysis of the automatic threshold estimation algorithm of rainfall for debris-flow disasters. The main research content and conclusions are as follows:
- (1)
- Rainfall criteria that cause sediment disasters are mainly presented using the I-D method for analyzing the relationship between rainfall intensity and duration. However, the methodologies for selecting the representative rain gauge and the definition of rainfall that causes debris-flow disasters may vary. Thus, it is necessary to use an automatic program that can derive objective results for them. Overseas, the development and applicability evaluation of automatic rainfall calculation programs for debris-flow disasters has been conducted in Italy and India. This study conducted basic research to develop programs suitable for Korea and evaluate their applicability.
- (2)
- In previous studies, there were limitations in using subjective methodologies for selecting impact meteorological stations and preceding rainfall, which had a high impact on the reliability of the criteria for debris flow-induced rainfall. This study adjusted the maximum allowed distance to 1, 3, 5, 7, 9, 11, 13, and 15 km using an automatic calculation algorithm for debris flow-induced rainfall thresholds, and a sensitivity analysis was performed automatically. As a result of applying the automatic calculation algorithm and the maximum allowed distance scenario to the Gangwon-do region, quantitatively checking the change in the cumulative rainfall by duration according to EPs was possible. Based on this information, a nomogram was developed for the prediction and warning of the risk of sediment disasters in the Gangwon-do region.
- (3)
- The results of applying this study to Sinnam Village, Samcheok City, which was affected by a debris-flow disaster in 2019, showed that the risk of debris-flow disasters increases with the occurrence of rainfall, and that the risk forecast for the severe stage can be predicted as early as 4.3, 4.6, 4.9, and 5.2 h in advance of the very severe stage, depending on the maximum allowable distance from the rain gauge (9, 11, 13, and 15 km, respectively).
In this study, an algorithm-based approach was utilized to determine rainfall thresholds for the major debris flow occurrence areas in Korea. By deriving quantitative rainfall thresholds based on the relationship with the maximum allowable distance of rain gauges from debris-flow disaster site information, we presented a practical methodology that complements the theoretical limitations of existing studies. The results proposed in this study were analyzed assuming a maximum allowable distance of 15 km, but the applicability of the results by expanding the range requires further analysis and further research in conjunction with predicted rainfall information. In addition, since this study utilized only debris-flow disaster information limited to the Gangwon region, it is necessary to verify and improve the algorithm by expanding the region, and further verification through comparison with physics-based debris flow models is required. If the algorithm and its accuracy are improved through further research, it is believed that the algorithm used in this study can be applied to the system to reduce damage before a debris-flow disaster occurs.
Author Contributions
K.-S.C. and J.-R.C. carried out the survey of previous research and prepared the graphs of the data. B.-H.L. conducted methodology and data analysis. B.-S.K. suggested the idea of the study and contributed to the writing of the paper. All authors have read and agreed to the published version of the manuscript.
Funding
This research was supported by a grant (2021-MOIS37-001) from the Intelligent Technology Development Program on Disaster Response and Emergency Management funded by the Ministry of Interior and Safety of the Korean government (MOIS, Republic of Korea).
Data Availability Statement
The data used in the current study are available from the corresponding author upon reasonable request.
Conflicts of Interest
The authors declare no conflicts of interest.
References
- Choi, J.R. An Analysis of Debris-Flow Propagation Characteristics and Assessment of Building Hazard Mapping Using FLO-2D–The Case of Chuncheon Landslide Area. Crisis Emerg. Manag. 2018, 14, 91–99. [Google Scholar] [CrossRef]
- Gariano, S.L.; Melillo, M.; Peruccacci, S.; Brunetti, M.T. How much does the rainfall temporal resolution affect rainfall thresholds for landslide triggering? Nat. Hazards 2019, 100, 655–670. [Google Scholar] [CrossRef]
- Chae, B.-G.; Choi, J.; Jeong, H.K. A Feasibility Study of a Rainfall Triggeirng Index Model to Warn Landslides in Korea. J. Eng. Geol. 2016, 26, 235–250. [Google Scholar] [CrossRef][Green Version]
- Aleotti, P. A warning system of rainfall-induced shallow failure. Eng. Geol. 2004, 73, 247–265. [Google Scholar] [CrossRef]
- Keefer, D.K.; Wilson, R.C.; Mark, R.K.; Brabb, E.E.; Brown, W.M., III; Ellen, S.D.; Harp, E.L.; Wieczorek, G.F.; Alger, C.S.; Zatkin, R.S. Realtime landslide warning during heavy rainfall. Science 1987, 238, 921–925. [Google Scholar] [CrossRef] [PubMed]
- Paswan, A.P.; Shrivastava, A.K. Evaluation of a Tilt-Based Monitoring System for Rainfall-Induced Landslides: Development and Physical Modelling. Water 2023, 15, 1862. [Google Scholar] [CrossRef]
- Pan, H.-L.; Jiang, Y.-J.; Wang, J.; Ou, G.-Q. Rainfall threshold calculation for debris flow early warning in areas with scarcity of data. Nat. Hazards Earth Syst. 2018, 18, 1395–1409. [Google Scholar] [CrossRef]
- Wang, H.; Xu, B.; Zhang, J.; Guo, X.; Zeng, Q.; Zhang, L. Rainfall thresholds of debris flows based on varying rainfall intensity types in the mountain areas of Beijing. Geomat. Nat. Hazards Risk 2022, 13, 2166–2181. [Google Scholar] [CrossRef]
- Deng, M.; Chen, N.; Ding, H. Rainfall characteristics and thresholds for periglacial debris flows in the Parlung Zangbo Basin, southeast Tibetan Plateau. J. Earth Syst. Sci. 2018, 127, 11. [Google Scholar] [CrossRef]
- Yan, Y.; Zhang, Y.; Hu, W.; Guo, X.; Ma, C.; Wang, Z.; Zhang, Q. A multiobjective evolutionary optimization method based critical rainfall thresholds for debris flows initiation. J. Mt. Sci. 2020, 17, 1860–1873. [Google Scholar] [CrossRef]
- Melillo, M.; Brunetti, M.T.; Peruccacci, S.; Gariano, S.L.; Guzzetti, F. An algorithm for the objective reconstruction of rainfall events responsible for landslides. Landslides 2015, 12, 311–320. [Google Scholar] [CrossRef]
- Melillo, M.; Brunetti, M.T.; Peruccacci, S.; Gariano, S.L.; Guzzetti, F. Rainfall thresholds for the possible landslide occurrence in Sicily (Southern Italy) based on the automatic reconstruction of rainfall events. Landslides 2015, 13, 165–172. [Google Scholar] [CrossRef]
- Luino, F.; De Graff, J.; Roccati, A.; Biddoccu, M.; Cirio, C.G.; Faccini, F.; Turconi, L. Eighty Years of Data Collected for the Determination of Rainfall Threshold Triggering Shallow Landslides and Mud-Debris Flows in the Alps. Water 2020, 12, 133. [Google Scholar] [CrossRef]
- Wu, M.-H.; Wang, J.P.; Chen, I.-C. Optimization approach for determining rainfall duration-intensity thresholds for debris flow forecasting. Bull. Eng. Geol. Environ. 2018, 78, 2495–2501. [Google Scholar] [CrossRef]
- Baum, R.L.; Godt, J.W. Early warning of rainfall-induced shallow landslides and debris flows in the USA. Landslides 2010, 7, 259–272. [Google Scholar] [CrossRef]
- He, S.; Wang, J.; Liu, S. Rainfall Event–Duration Thresholds for Landslide Occurrences in China. Water 2020, 12, 494. [Google Scholar] [CrossRef]
- Roccati, A.; Paliaga, G.; Luino, F.; Faccini, F.; Turconi, L. Rainfall Threshold for Shallow Landslides Initiation and Analysis of Long-Term Rainfall Trends in a Mediterranean Area. Atmosphere 2020, 11, 1367. [Google Scholar] [CrossRef]
- Chen, H.-W.; Chen, C.-Y. Warning Models for Landslide and Channelized Debris Flow under Climate Change Conditions in Taiwan. Water 2022, 14, 695. [Google Scholar] [CrossRef]
- Campbell, R.H. Soil Slips, Debris Flows, and Rainstorms in the Santa Monica Mountains and Vicinity, Southern California; US Government Printing Office: Washington, DC, USA, 1975. [Google Scholar]
- Caine, N. The rainfall intensity-duration control of shallow landslides and debris flows. Geogr. Ann. 1980, 62, 23–27. [Google Scholar]
- Brunetti, M.T.; Peruccacci, S.; Rossi, M.; Luciani, S.; Valigi, D.; Guzzetti, F. Rainfall thresholds for the possible oc-currence of landslides in Italy. Nat. Hazards Earth Syst. Sci. 2010, 10, 447–458. [Google Scholar] [CrossRef]
- Piciullo, L.; Gariano, S.L.; Melillo, M.; Brunetti, M.T.; Preruccacci, S.; Guzzetti, F. Definition and performance of a threshold-based refional early warning model for rainfall-induced landslides. Landslides 2017, 14, 995–1008. [Google Scholar] [CrossRef]
- Melillo, M.; Brunetti, M.T.; Peruccacci, S.; Gariano, S.L.; Roccati, A.; Guzzetti, F. A tool for the automatic calculation of rainfall thresholds for landslide occurrence. Environ. Model. Softw. 2018, 105, 230–243. [Google Scholar] [CrossRef]
- Jordanova, G.; Gariano, S.L.; Melillo, M.; Peruccacci, S.; Brunetti, M.T.; Auflič, M.J. Determination of Empirical Rainfall Thresholds for Shallow Landslides in Slovenia Using an Automatic Tool. Water 2020, 12, 1449. [Google Scholar] [CrossRef]
- Distefano, P.; Peres, D.; Scandura, P.; Cancelliere, A. Brief communication: Rainfall thresholds based on Artificial neural networks can improve landslide early warning. Nat. Hazards Earth Syst. Sci. 2021, 22, 1–9. [Google Scholar]
- Cai, J.; Zhang, Y.; Li, Y.; Liang, X.S.; Jiang, T. Analyzing the Characteristics of Soil Moisture Using GLDAS Data: A Case Study in Eastern China. Appl. Sci. 2017, 7, 566. [Google Scholar] [CrossRef]
- Shuang, H.; Xia, L.; Jason, G.; Haitong, T.; Qin, Y.; Kaiyue, L.; Haozhou, D.; Chungqi, C.; Nizhuan, W. RSI-Net: Two-Stream Deep Neural Network for Remote Sensing Images-Based Semantic Segmentation. IEEE Access. 2022, 10, 34858–34871. [Google Scholar] [CrossRef]
- Youliang, C.; Xiangjun, Z.; Hamed, K.; Gang, X.; Jinsong, H. A novel framework for prediction of dam deformation based on extreme learning machine and Lévy flight bat algorithm. J. Hydroinform. 2021, 23, 935–949. [Google Scholar] [CrossRef]
- Tang, H.; McGuire, L.A.; Rengers, F.K.; Kean, J.W.; Staley, D.M.; Smith, J.B. Developing and testing physicallybased triggering thresholds forrunoff-generated debris flows. Geophys. Res. Lett. 2019, 46, 8830–8839. [Google Scholar] [CrossRef]
- Chiang, J.-L.; Kuo, C.-M.; Fazeldehkordi, L. Using Deep Learning to Formulate the Landslide Rainfall Threshold of the Potential Large-Scale Landslide. Water 2022, 14, 3320. [Google Scholar] [CrossRef]
- Abraham, M.T.; Satyam, N.; Kushal, S.; Rosi, A.; Pradhan, B.; Segoni, S. Rainfall Threshold Estimation and Landslide Forecasting for Kalimpong, India Using SIGMA Model. Water 2020, 12, 1195. [Google Scholar] [CrossRef]
- Nam, D.H.; Lee, S.H.; Kim, M.I.; Kim, B.S. Calculation of Rainfall Triggering Index (RTI) to Predict the Occurrence of Debris Flow. J. Eng. Geol. 2018, 28, 47–59. [Google Scholar]
- Lee, J.S.; Kang, H.S.; Suk, J.W.; Kim, Y.T. Development of Hazard Level-based Rainfall Threshold for Prediction of Rainfall-induced Landslide Occurrence in Korea. J. Korean Soc. Hazard Mitig. 2019, 19, 225–236. [Google Scholar] [CrossRef]
- Pruccacci, S.; Brunetti, M.T.; Luciani, S.; Vennari, C.; Guzzetti, F. Lithological and seasonal control on rainfall thresholds for the possible initiation of landslides in central Italy. Geomorphology 2012, 139–140, 79–90. [Google Scholar] [CrossRef]
- Choi, J.R.; An, S.W.; Choo, K.S.; Kim, D.H.; Lim, H.K.; Kim, B.S. Development of An Automatic Calculation Algorithm for Rainfall Thresholds of Debris Flow in Korea. J. Korean Soc. Hazard Mitig. 2022, 22, 113–123. [Google Scholar] [CrossRef]


Disclaimer/Publisher’s Note: The statements, opinions and data contained in all publications are solely those of the individual author(s) and contributor(s) and not of MDPI and/or the editor(s). MDPI and/or the editor(s) disclaim responsibility for any injury to people or property resulting from any ideas, methods, instructions or products referred to in the content. |
© 2024 by the authors. Licensee MDPI, Basel, Switzerland. This article is an open access article distributed under the terms and conditions of the Creative Commons Attribution (CC BY) license (https://creativecommons.org/licenses/by/4.0/).