Article

Towards an Understanding of Hydraulic Sensitivity: Graph Theory Contributions to Water Distribution Analysis

1
Center of Urban Systems (CUS), Mohammed VI Polytechnic University (UM6P), Ben Guerir 43150, Morocco
2
Urban and Regional Planning Community (CEAT), Ecole Polytechnique Fédérale de Lausanne (EPFL), 1015 Lausanne, Switzerland
*
Author to whom correspondence should be addressed.
Water 2024, 16(5), 646; https://doi.org/10.3390/w16050646
Submission received: 11 December 2023 / Revised: 13 January 2024 / Accepted: 16 January 2024 / Published: 22 February 2024
(This article belongs to the Special Issue Urban Water Management and Hydrological Process)

Abstract

:
Water distribution systems (WDSs) are complex networks with numerous interconnected junctions and pipes. The robustness and reliability of these systems are critically dependent on their network structure, necessitating detailed analysis for proactive leak detection to maintain integrity and functionality. This study addresses gaps in traditional WDS analysis by integrating hydraulic measures with graph theory to improve sensitivity analysis for leak detection. Through case studies of five distinct WDSs, we investigate the relationship between hydraulic measures and graph theory metrics. Our findings demonstrate the collective impact of these factors on leak detection and system efficiency. The research provides enhanced insights into WDS operational dynamics and highlights the significant potential of graph theory to bolster network resilience and reliability.

1. Introduction

Water distribution networks are vital infrastructural systems that ensure potable water delivery to households, industries, and other consumers in urban and rural settings [1]. These networks, often sprawling over vast areas, consist of interconnected pipes, reservoirs, pumps, valves, and other components. Ensuring these networks’ efficient and uninterrupted operation is paramount not only for public health and safety but also for economic and environmental reasons [2,3].
Leaks in water distribution networks represent one of the most persistent challenges faced by utilities worldwide [4,5]. They lead to significant water loss, which is especially concerning given the increasing water scarcity in many parts of the world [6]. According to the World Bank, an estimated 32 billion cubic meters of treated water are lost yearly due to leaks in urban systems, equivalent to nearly USD 40 billion in financial costs [7]. Beyond the economic implications, leaks can lead to reduced pressure in the system, making it susceptible to external contamination and thus posing health risks. Additionally, the energy and resources expended in treating and pumping the lost water contribute to unnecessary environmental impacts [8]. Such effects encompass wasting water resources and increased CO2 emissions due to the energy consumption related to the treatment of excess water volumes with excessive chemical components.
Uneven daily and yearly consumption patterns critically impact water distribution networks. During peak consumption periods, increased demand can lower system pressure and escalate flow rates, potentially exacerbating existing leaks or causing new ones due to the added stress on the infrastructure [9]. Conversely, during low-demand periods, reduced flow rates can make leaks less detectable. These variations must be taken into account in the design and operation of leak detection strategies, as they influence both the likelihood and detectability of leaks. As such, understanding and adapting to these consumption patterns is essential for effective leak management, reducing water loss, and ensuring the reliability of supply [10,11].
Given the complexity and vastness of water distribution networks, there’s a growing interest in leveraging advanced mathematical and computational techniques for enhanced leak detection and system analysis. The primary research problem this study addresses is the need for more sophisticated, accurate, and efficient methods for identifying zone leaks within these complex networks [4,12]. To tackle this issue, our study explores the application of graph theory, a crucial interdisciplinary tool that enhances our understanding and management of complex systems [13]. While graph theory has been successfully employed in various fields such as epidemiology to trace and control the spread of diseases [14,15] and urban planning to optimize transport networks and traffic management [16,17], its potential in water distribution management is particularly compelling. By translating the physical network of water distribution into a graph of nodes and edges, representing the infrastructure’s interconnectivity, we can implement algorithms to simulate fluid movement, reveal usage patterns, and, crucially, detect leakage.
The objectives of our research are to develop a comprehensive methodology that integrates graph theory into the analysis of water distribution networks to improve leak detection and network management. We aim to demonstrate how graph-theoretical approaches can provide deeper insights into network dynamics, identify critical areas prone to leaks, and enhance the overall efficiency and reliability of water distribution systems. Through this study, we aspire to contribute valuable tools and strategies to the field of water management, helping to mitigate the challenges posed by leaks and advancing the sustainability of water resources.
The rest of the article is structured as follows: Section 2, “Literature Review”, offers an overview of existing studies that intersect graph theory with WDS. Section 3, “Graph Theory Fundamentals and Hydraulic Metrics in WDS Analysis”, outlines the foundational aspects of graph theory alongside key hydraulic measures pertinent to WDS analysis. Section 4, “Methodology”, is the paper’s core, detailing our study’s methodology and applying it to a well-known WDS for illustrative purposes. Section 5, “Case Studies”, presents empirical findings from applying our methods to four distinct WDSs. Section 6, “Practical Implications of Findings”, presents some practical implications of the proposed method. The paper concludes with a discussion that synthesizes the results and provides a comprehensive summary of the insights gained.

2. Literature Review

In the literature, multiple methodologies have been proposed to analyze the resilience of water distribution systems in order to detect water leaks. One prevalent method is the performance-based approach, which employs hydraulic models to evaluate how the system responds under different hypothetical scenarios [18]. These models typically analyze the flow and pressure characteristics within the network’s pipes and junctions, simulating various operational conditions to predict system behavior during normal and adverse events [19,20]. For this purpose, we present related works that exemplify the integration of graph theory in WDS, followed by a discussion on its application and impact.

2.1. Graph Theory Integration in Water Distribution Systems

To further enrich this analysis, integrating hydraulic metrics with graph theory measures enhances the precision of leakage detection in WDSs, thereby addressing a notable gap in the existing research. Ulusoy et al. [21] sought to analyze pipe criticality’s impact on the overall resilience of a network by integrating graph theory methods with fundamental principles of pipe hydraulics. This paper overcomes the limitations of traditional hydraulic methods and most surrogate measures of redundancy by introducing a hydraulically informed graph-theoretic measure of pipe criticality known as Water Flow Edge Betweenness Centrality (WFEBC). Similarly, Dunn and Wilkinson [22] developed a method that merges flow parameters with betweenness centrality and degree centrality to predict changes in flow dynamics caused by node removal. This integrated metric serves as a tool for identifying essential elements in water distribution networks, aiding in the management and maintenance of these critical infrastructures.
Additionally, Agathokleous et al. [23] observed a significant correlation between hydraulic metrics and network centrality measures. Nadro et al. [24] introduced an analysis framework based on Eigenvector centrality to support water utilities in the decision-making process for efficient supply management. Moreover, the study by Giudicianni et al. [25] aims to assess the criticality of water distribution networks facing natural disasters, particularly in the frequent context of limited site-specific information. It introduces a novel algorithm to detect the fractal structure of WDS layouts and a new vulnerability index called Cut-Vulnerability Vcut, which accounts for topological self-similarity and global vulnerability in WDSs. These advances provide a significant contribution to our understanding of the structural and functional robustness of water distribution networks, further supporting the integrated approach of combining hydraulic and graph theory analyses. Another recent research study demonstrates the incorporation of complex network analysis using graph theory for identifying critical components in drainage networks [26].

2.2. Application and Impact in WDS

Generally, graph theory emerges as a potent analytical tool, transcending its mathematical origins to offer valuable insights. Its adaptability has been demonstrated across a multitude of disciplines, such as the criminal field [27,28], e-learning [29], and social media [30,31]. Each application demonstrates graph theory’s remarkable capacity to address structured data and solve complex problems in many environments.
Building on the foundational concepts discussed previously, the application of graph theory in WDS research has proven to be of considerable value [32,33]. It enables a structured analysis of the network’s topology, enhancing operational efficiency, and improving resilience. It provides a robust framework for optimizing system design, facilitating effective leak detection, ensuring water quality, and supporting strategic maintenance and expansion.
Among these advancements, Kibum et al. [34] introduced a novel methodology grounded in graph theory to pinpoint susceptible segments and accidental isolations in water distribution systems. This approach utilizes a node-based adjacency matrix for clear visualization of network connectivity, streamlined by a single row-first search method. In addition, Tzatchkov et al. [35] outlined graph theory algorithms for sectorizing water distribution systems. Their paper details how these algorithms help divide a large network into smaller, independent sectors, identify disconnected nodes, and analyze water source contributions. Implemented in an AutoCAD-based system, these methods have improved water distribution efficiency in Mexican cities by aiding in managing and reducing water losses.
Further investigations by Tzatchkov et al. [36] demonstrate that graph theory is instrumental in simplifying the management of a WDS by facilitating its division into sectors and improving the accuracy of leak detection. Complementarily, another study by Shekofteh et al. [37] presents a novel leak detection method for WDSs that leverages graph theory for network decomposition. By dividing the WDS into manageable sections, the method uses pressure logger data and artificial neural networks to pinpoint the location of leaks. This iterative process narrows down the leak to a specific area within the network. Applied to the Balerma WDS under various scenarios, the approach proved accurate, showcasing graph theory’s utility in enhancing the efficiency of leak detection in WDSs amidst water scarcity challenges.
Additionally, a recent study [38] proposes a procedure to accelerate the computation of shortest paths in WDSs, highlighting the method’s efficiency in reducing computational time and its crucial role in real-time contamination detection and leakage control. This innovative approach underscores the potential of graph theory in enhancing operational integrity and robustness of water distribution systems.
On the other hand, graph theory can be utilized to evaluate and assess the robustness and operational integrity of water distribution systems—this serves as the main objective of our paper. We delve into the application of graph theory in the context of urban resilience, specifically within the framework of water distribution. Yazdani et al. [13] propose a deterministic network analysis method to evaluate the robustness and vulnerability of water distribution systems. These systems are conceptualized as intricate graphs, enabling a comprehensive assessment of their resilience against disruptions. Complementing this, Christopher Dzuwa’s study [39] presents an algorithm that identifies potential leakage points by calculating the risk of pipe bursts at network nodes. The algorithm leverages a sensitivity analysis that compares pressure readings at various nodes under different leakage scenarios to a standard no-leak model. This process is instrumental in detecting irregularities that may indicate a leak. Through this multifaceted approach, the study aims not only to locate potential weak points but also to prioritize them for maintenance or further investigation, thereby enhancing the system’s reliability and service delivery.

3. Graph Theory Fundamentals and Hydraulic Metrics in WDS Analysis

This section delves into the foundational elements of our analysis, clarifies the problem statement, and defines the basic concepts used in this paper.

3.1. Graph Properties

Graph-theoretical concepts are integral to leak detection in water distribution systems by offering a framework to model the network, identify critical nodes, and analyze flow patterns. These concepts facilitate the detection of anomalies in water flow and pressure that may indicate leaks. In this subsection, we define the fundamental concepts used in our work [40], drawing upon the characterizations and methodologies discussed in the context of WDSs as complex networks [41].
Model formulation. In this work, we model a water distribution system as a simple directed graph G(N;E) composed by a set of nodes N = u 1 ; u 2 ; ; u n and a set of edges E N × N . The nodes (vertices) represent reservoirs, tanks, or junctions, and the edges (links) correspond to pipes that transport water from one node to another (see Figure 1). We denote as n   = |N| and m   = |E|, respectively, the number of nodes and the number of edges of graph G. We employ the terms node, vertex, and junction (resp., edge, link, and pipe) interchangeably, as well as the terms network and graph.
Problem definition. Take a WDS modeled by graph G(N; E), where N is a set nodes and E is a set of edges. We seek to divide G into a set, D, of disjoint zones (communities), ensuring that each junction u i N belongs to only one community. This segmentation is a crucial step toward conducting an efficient sensitivity analysis for leak detection in WDSs. Therefore, our goal is to perform a diagnosis and risk assessment of water engineering systems, focusing on junctions and pipes because they represent the critical points susceptible to leakage.
Definition 1 
(Network Flow). Network flow in the context of WDSs refers to the rate at which water moves through the network’s pipelines. It is a critical parameter that determines the ability of the system to meet consumer demand at various points.
Definition 2 
(Cycle (Loop)). A cycle is a path that starts and ends at the same node without traversing any edge more than once. In WDSs, cycles are essential for redundancy; they ensure that if one part of the network fails, there is an alternative path for water distribution.
Definition 3 
(Adjacency). This refers to the direct connection between two nodes. In WDSs, two junctions are adjacent if they are connected by a single pipe. The adjacency matrix is a common mathematical representation that indicates which nodes in the network are adjacent to each other.
Definition 4 
(Path). In graph theory, a path is a sequence of edges that connects a sequence of distinct nodes. In WDSs, a path would represent a possible route for water to travel from one point to another within the network.
Definition 5 
(Subgraph). In water distribution systems, a subgraph is a subset of the network, comprising specific junctions and pipes, usually representing an operational area or manageable district. These zones are determined by various criteria, such as hydraulic connectivity, geographical boundaries, or demand patterns, facilitating targeted analysis and management within a larger network.
Definition 6 
(Degree Centrality). Degree centrality ( C D ) is defined as the number of edges incident upon a node. In simpler terms, it measures the number of direct connections a node has to other nodes within the network. For a WDS, degree centrality would indicate how many pipes are connected to a junction, reservoir, or tank. A high degree of centrality at a junction might suggest it is a significant point for water distribution, potentially affecting many consumers if disrupted. For any undirected graph G, the degree of node v is:
C D ( v ) = u V a u v
where a u v are the elements of the adjacency matrix, indicating a connection between nodes u and v.
Definition 7 
(Closeness Centrality). Closeness centrality ( C C ) measures how close a node is to all other nodes in the network. It is calculated as the reciprocal of the sum of the shortest path distances from a given node to all other nodes in the graph. Nodes with higher closeness centrality can reach all other nodes more quickly than those with lower closeness centrality. In WDSs, this measure can help identify which nodes are best positioned to distribute water efficiently across the entire network. Mathematically, for a node v:
C C ( v ) = 1 u v d ( v , u )
where d ( v , u ) is the shortest path distance between nodes v and u.
Definition 8 
(Betweenness Centrality). Betweenness centrality ( C B ) quantifies the number of times a node acts as a bridge along the shortest path between two other nodes. It is an indicator of a node’s control over the network’s flow, reflecting its potential to facilitate or impede water movement through the network. In WDSs, a node with high betweenness centrality would be critical for water flow between different network parts. Such nodes, if compromised, could significantly impact the network’s performance and reliability. The betweenness centrality of a node v is calculated by the following formula:
C B ( v ) = s v t V σ s t ( v ) σ s t
where σ s t is the total number of shortest paths from node s to node t and σ s t ( v ) is the number of those paths passing through v.
Definition 9 
(Link Betweenness Centrality). Link Betweenness Centrality ( C L B ) is a measure used in graph theory to quantify the importance of an edge within a network. It is defined as the number of shortest paths between pairs of nodes that pass through a particular edge. In WDSs, a higher betweenness centrality indicates that a link has a greater influence on the efficiency of the network’s water distribution and is more critical to its connectivity. The Link Betweenness Centrality edge e is:
C L B ( e ) = s t V σ s t ( e ) σ s t
where σ s t is the total number of shortest paths from node s to node t and σ s t ( e ) is the number of those paths that pass along edge e.

3.2. Hydraulic Measures

Hydraulic measures refer to the various quantifiable characteristics that describe the behavior and performance of the fluid within the water distribution systems. Each junction in the WDS is characterized by:
1.
Elevation (m)—The node’s height, which influences the gravitational pressure in the system.
2.
Demand (m3/h)—The water requirement at that node is essential for ensuring adequate supply.
3.
Pressure (m)—The fluid force exerted at the node is critical for water delivery and system integrity.
The system’s edges represent the physical pipes and are defined by:
1.
Length (m)—The distance between two nodes, affecting headloss and velocity.
2.
Diameter (mm)—The width of the pipe, which dictates the flow rate and velocity.
3.
Flow (m3/h)—The volume of water moving through the pipe per unit of time.
4.
Velocity (m3/h)—The velocity of the water flow is crucial for preventing sedimentation and ensuring effective scouring.
5.
Headloss (m/s)—The loss of pressure due to friction within the length of the pipe.
6.
Volume (m3)—The pipe’s water capacity can be influenced by the pipe’s cross-sectional area.
It is important to note that while these are the primary measures used in our study, there are other parameters, such as pipe age and material; water quality indicators; and other factors, that could be considered in hydraulic analysis. However, our focus was on those metrics that were readily available and most pertinent to our experimental WDS.
Considering these hydraulic measures, graph theory can be applied to analyze and optimize the WDS. This analytical approach is essential for designing a network that delivers water reliably and maintains quality, manages pressure effectively across different elevations, and ensures the system’s overall resilience and sustainability.

4. Methodology

The flowchart presented in Figure 2 outlines a four-step process for conducting a sensitivity analysis of water distribution systems. A detailed description of each step is provided in the following sections.

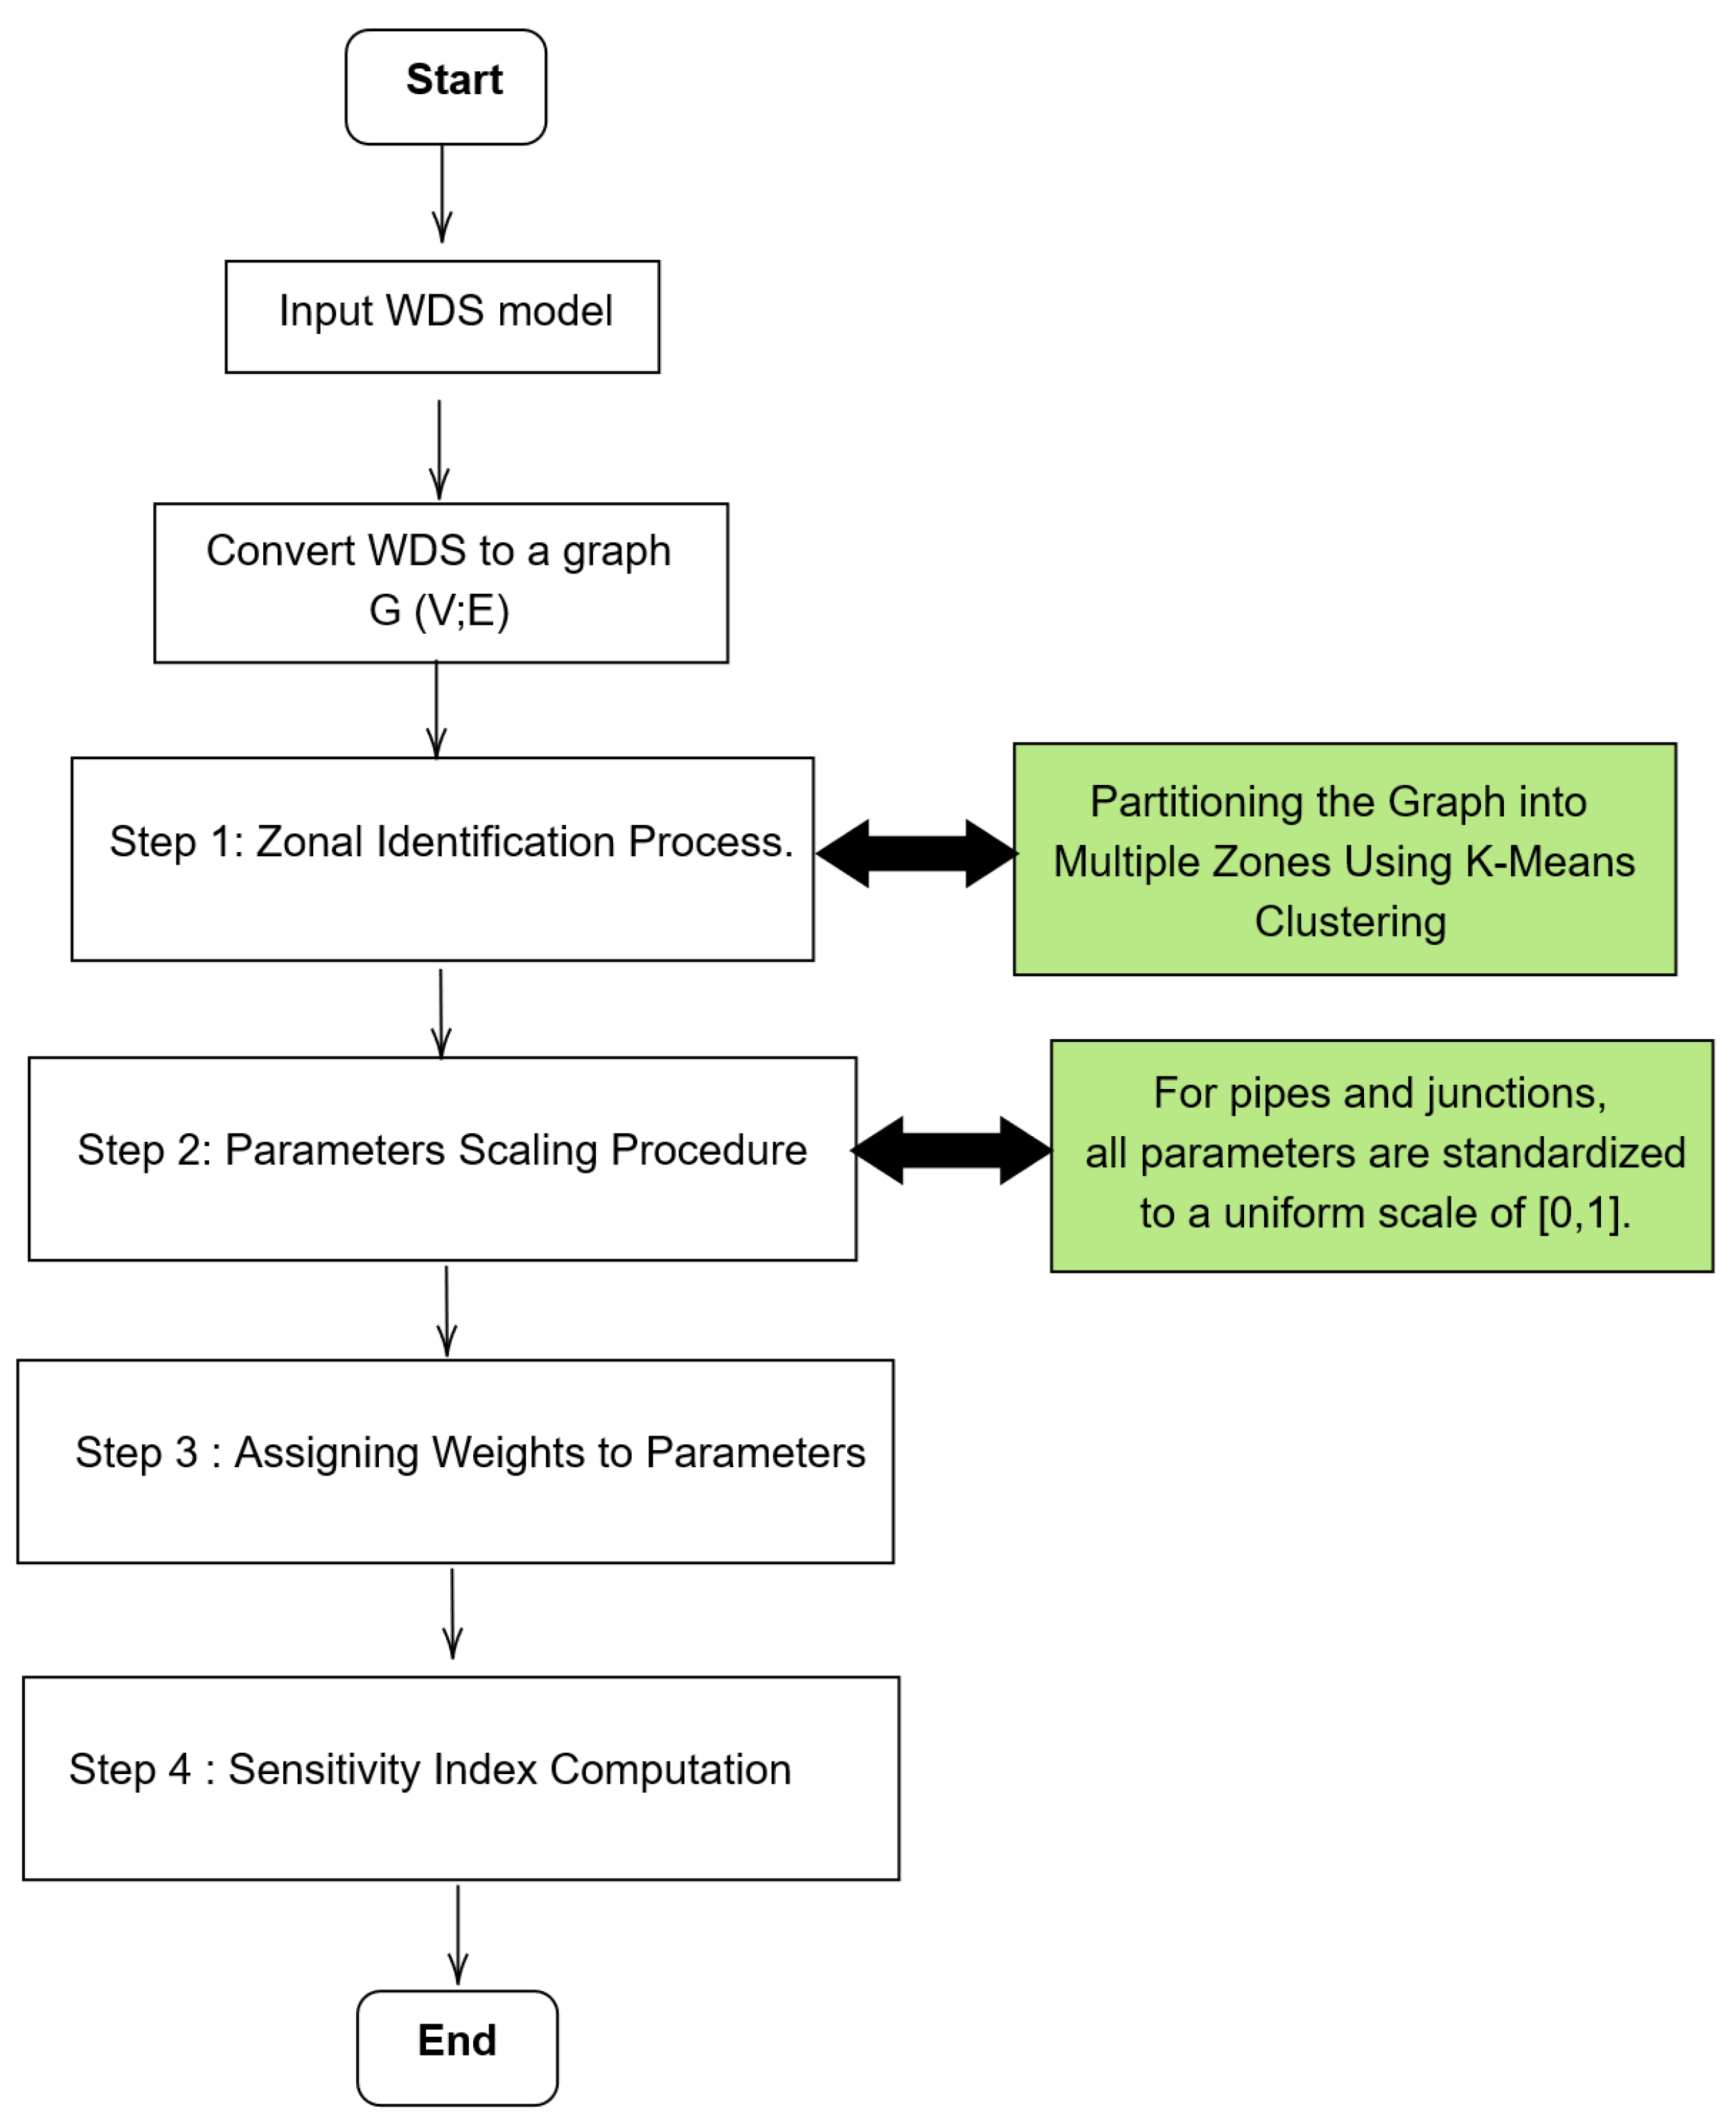
4.1. General Overview

The aim of this research is to perform an extensive assessment of WDSs to prevent leakages effectively. This study meticulously scrutinizes the pipes and junctions, pinpointing them as pivotal elements prone to leaks. It delves into the critical facets of the system to uncover weaknesses and suggests proactive strategies for reducing water loss. The proposed methodology integrates the hydraulic measurements of a WDS with graph theory analytics. It thoroughly investigates pipe characteristics, such as length, diameter, flow rate, velocity, head loss, and volume. By applying graph theory, this study calculates edge betweenness centrality (see Definition 9) for pipes, providing insights into their significance in the network and aiding in bolstering the system’s integrity and reliability.
Similarly, the research evaluates junction attributes, including elevation, demand, and pressure. It employs graph theory to derive three notable centrality measures: degree centrality (see Definition 6), closeness centrality (see Definition 7), and betweenness centrality (see Definition 8). These metrics are instrumental in gauging the importance of each junction within the network.
The methodological approach is systematically organized into four key stages for both pipes and junctions (see Figure 2), which are described in the two following subsections.

4.2. Zonal Identification Process

Our analytical process commences with the segmentation of the water distribution network into subgraphs or zones (see Definition 5). This segmentation is a strategic step to streamline both the examination and administration of water flow dynamics. We employ the k-means clustering algorithm for this segmentation, a widely used method for grouping data into clusters that minimize variance within each cluster and maximize variance between clusters [42]. Additionally, its scalability and adaptability make it suitable for water distribution networks of varying sizes and complexities [43].
K-means is an unsupervised clustering algorithm that is used to cluster our data into K number of clusters. Mathematically, it seeks to solve:
min S i = 1 k x S i | | x μ i | | 2
where, S represents the set of clusters S 1 , S 2 , . . . , S k . x is a data point belonging to cluster S i . μ i is the centroid of the points in S i .
To implement the k-means algorithm effectively, a pivotal preliminary step is to determine the ideal number of clusters. This decision is crucial as it influences the granularity and usefulness of the analysis. For this purpose, we apply the Elbow method. This method entails plotting the total within-cluster sum of squares (WSS) against the number of clusters. As we increment the number of clusters, the total WSS decreases. We look for a ‘knee’ in the graph, which is the point at which the rate of decrease sharply changes, indicating that additional clusters will not significantly improve the partitioning. This point is known as the ‘elbow’, and the corresponding number of clusters is deemed optimal for our analysis.
Once the optimal number of clusters is established, we can proceed with the k-means algorithm to create a zonal map of our network, facilitating targeted hydraulic analysis and efficient water distribution management.

4.3. Parameters Scaling Procedure

Following the zonal segmentation of the water distribution network, the second step in our methodology involves the normalization of parameters (hydraulic and centrality measures). This essential procedure equates disparate parameters, rendering them directly comparable by adjusting their values to a common scale [44]. Normalization is performed without altering the original data distribution or the relative standings of the values.
Normalization or standardization helps to make data more adaptable [45,46]. Highly normalized data reduce the likelihood of inconsistencies, thereby decreasing the ambiguity of parameters.
In this context, normalization adjusts the attributes of both pipes and junctions. For pipes, this may include parameters such as length, diameter, flow rate, velocity, head loss, volume, and edge betweenness centrality. For junctions, this could encompass elevation, demand, pressure, degree centrality, closeness centrality, and betweenness centrality. Specifically, normalization is applied to transform all parameter values to a uniform scale that ranges from 0 to 1.
The normalization process is achieved by taking each parameter’s value x i and subtracting the minimum value x m i n for that parameter across the network, then dividing by the range of the parameter values (the difference between the maximum x m a x and minimum x m i n values). This method, known as min–max scaling, allows for the different parameters to be evaluated on an equal footing. The normalization formula is articulated as follows:
x Norm = x i x min x max x min
Through this formula, min–max scaling translates each parameter to a relative scale, facilitating a coherent and equitable comparison across the network’s diversified parameters.

4.4. Assigning Weights to Parameters

In the third step of our approach, we enhance the analysis by assigning differential weights to each parameter, signifying their varying degrees of impact on the network’s susceptibility to leaks. To systematically quantify the importance of each parameter, we utilize the concept of entropy [47], which is a measure of uncertainty or disorder within a system.
In this context, the application of entropy serves two primary purposes. Initially, it enables a quantitative differentiation among various parameters, emphasizing the ones with a substantial influence on the system’s behavior [48]. Parameters characterized by higher entropy values suggest more considerable variability, thereby being recognized as more impactful on the system’s overall state. Subsequently, entropy supports a weighted analytical approach. By attributing weights corresponding to the calculated entropy for each parameter, the methodology effectively incorporates the relative significance and influence of the parameters. Consequently, this method ensures that the analysis is detailed and specifically adapted to the unique dynamics of the system being analyzed.
The application of entropy in the field of water distribution networks is pertinent, where the behavior of the system is influenced by a myriad of stochastic and dynamic parameters. The entropy-based weighting scheme allows for a more refined and targeted analysis, focusing on the parameters that truly drive system changes and thus enhancing the effectiveness of leak detection strategies [49,50].
The entropy H(X) of a parameter X is calculated by:
H ( X ) = i = 1 N P x i log P x i
In this formula, P ( x i ) represents the probability of occurrence of the i-th value of the parameter X. This entropy-driven approach to weighting is particularly adept at reflecting the level of uncertainty or the lack of predictability associated with each parameter. It enables an insightful determination of which variables exert the most substantial influence on the network’s operational efficacy and robustness.

4.5. Sensitivity Index Computation

The fourth and final step of our analysis involves computing the Sensitivity Index, denoted as S. This index is a weighted sum where each parameter value xi is multiplied by its corresponding weight W i . The Sensitivity Index is thus the sum of these individual products across all parameters, formally expressed by the equation:
S = x 1 × w 1 + x 2 × w 2 + + x n × w n
In this formula, x i represents the value of the ith parameter, and w i signifies the weight assigned to that parameter, reflecting its relative importance in the calculation. The index n corresponds to the total number of parameters considered.
The outcome, S, quantifies the overall sensitivity by aggregating the weighted contributions of each parameter, offering a singular measure that encapsulates the collective impact of all the parameters under investigation. The Sensitivity Index provides a comprehensive metric that can be used to prioritize maintenance and monitoring efforts, directing resources to the most critical areas of the network to mitigate the risk of leaks.

4.6. Theoretical Examination

The primary purpose of this subsection is to illustrate the distinct steps of our proposal on a WDS Hanoi [51] composed of 31 nodes and 34 edges (see Figure 3). Our methodology scrutinizes the network by assessing a range of parameters for pipes and junctions. As mentioned above, these parameters are crucial for evaluating the network’s performance and identifying key areas susceptible to leaks.
1.
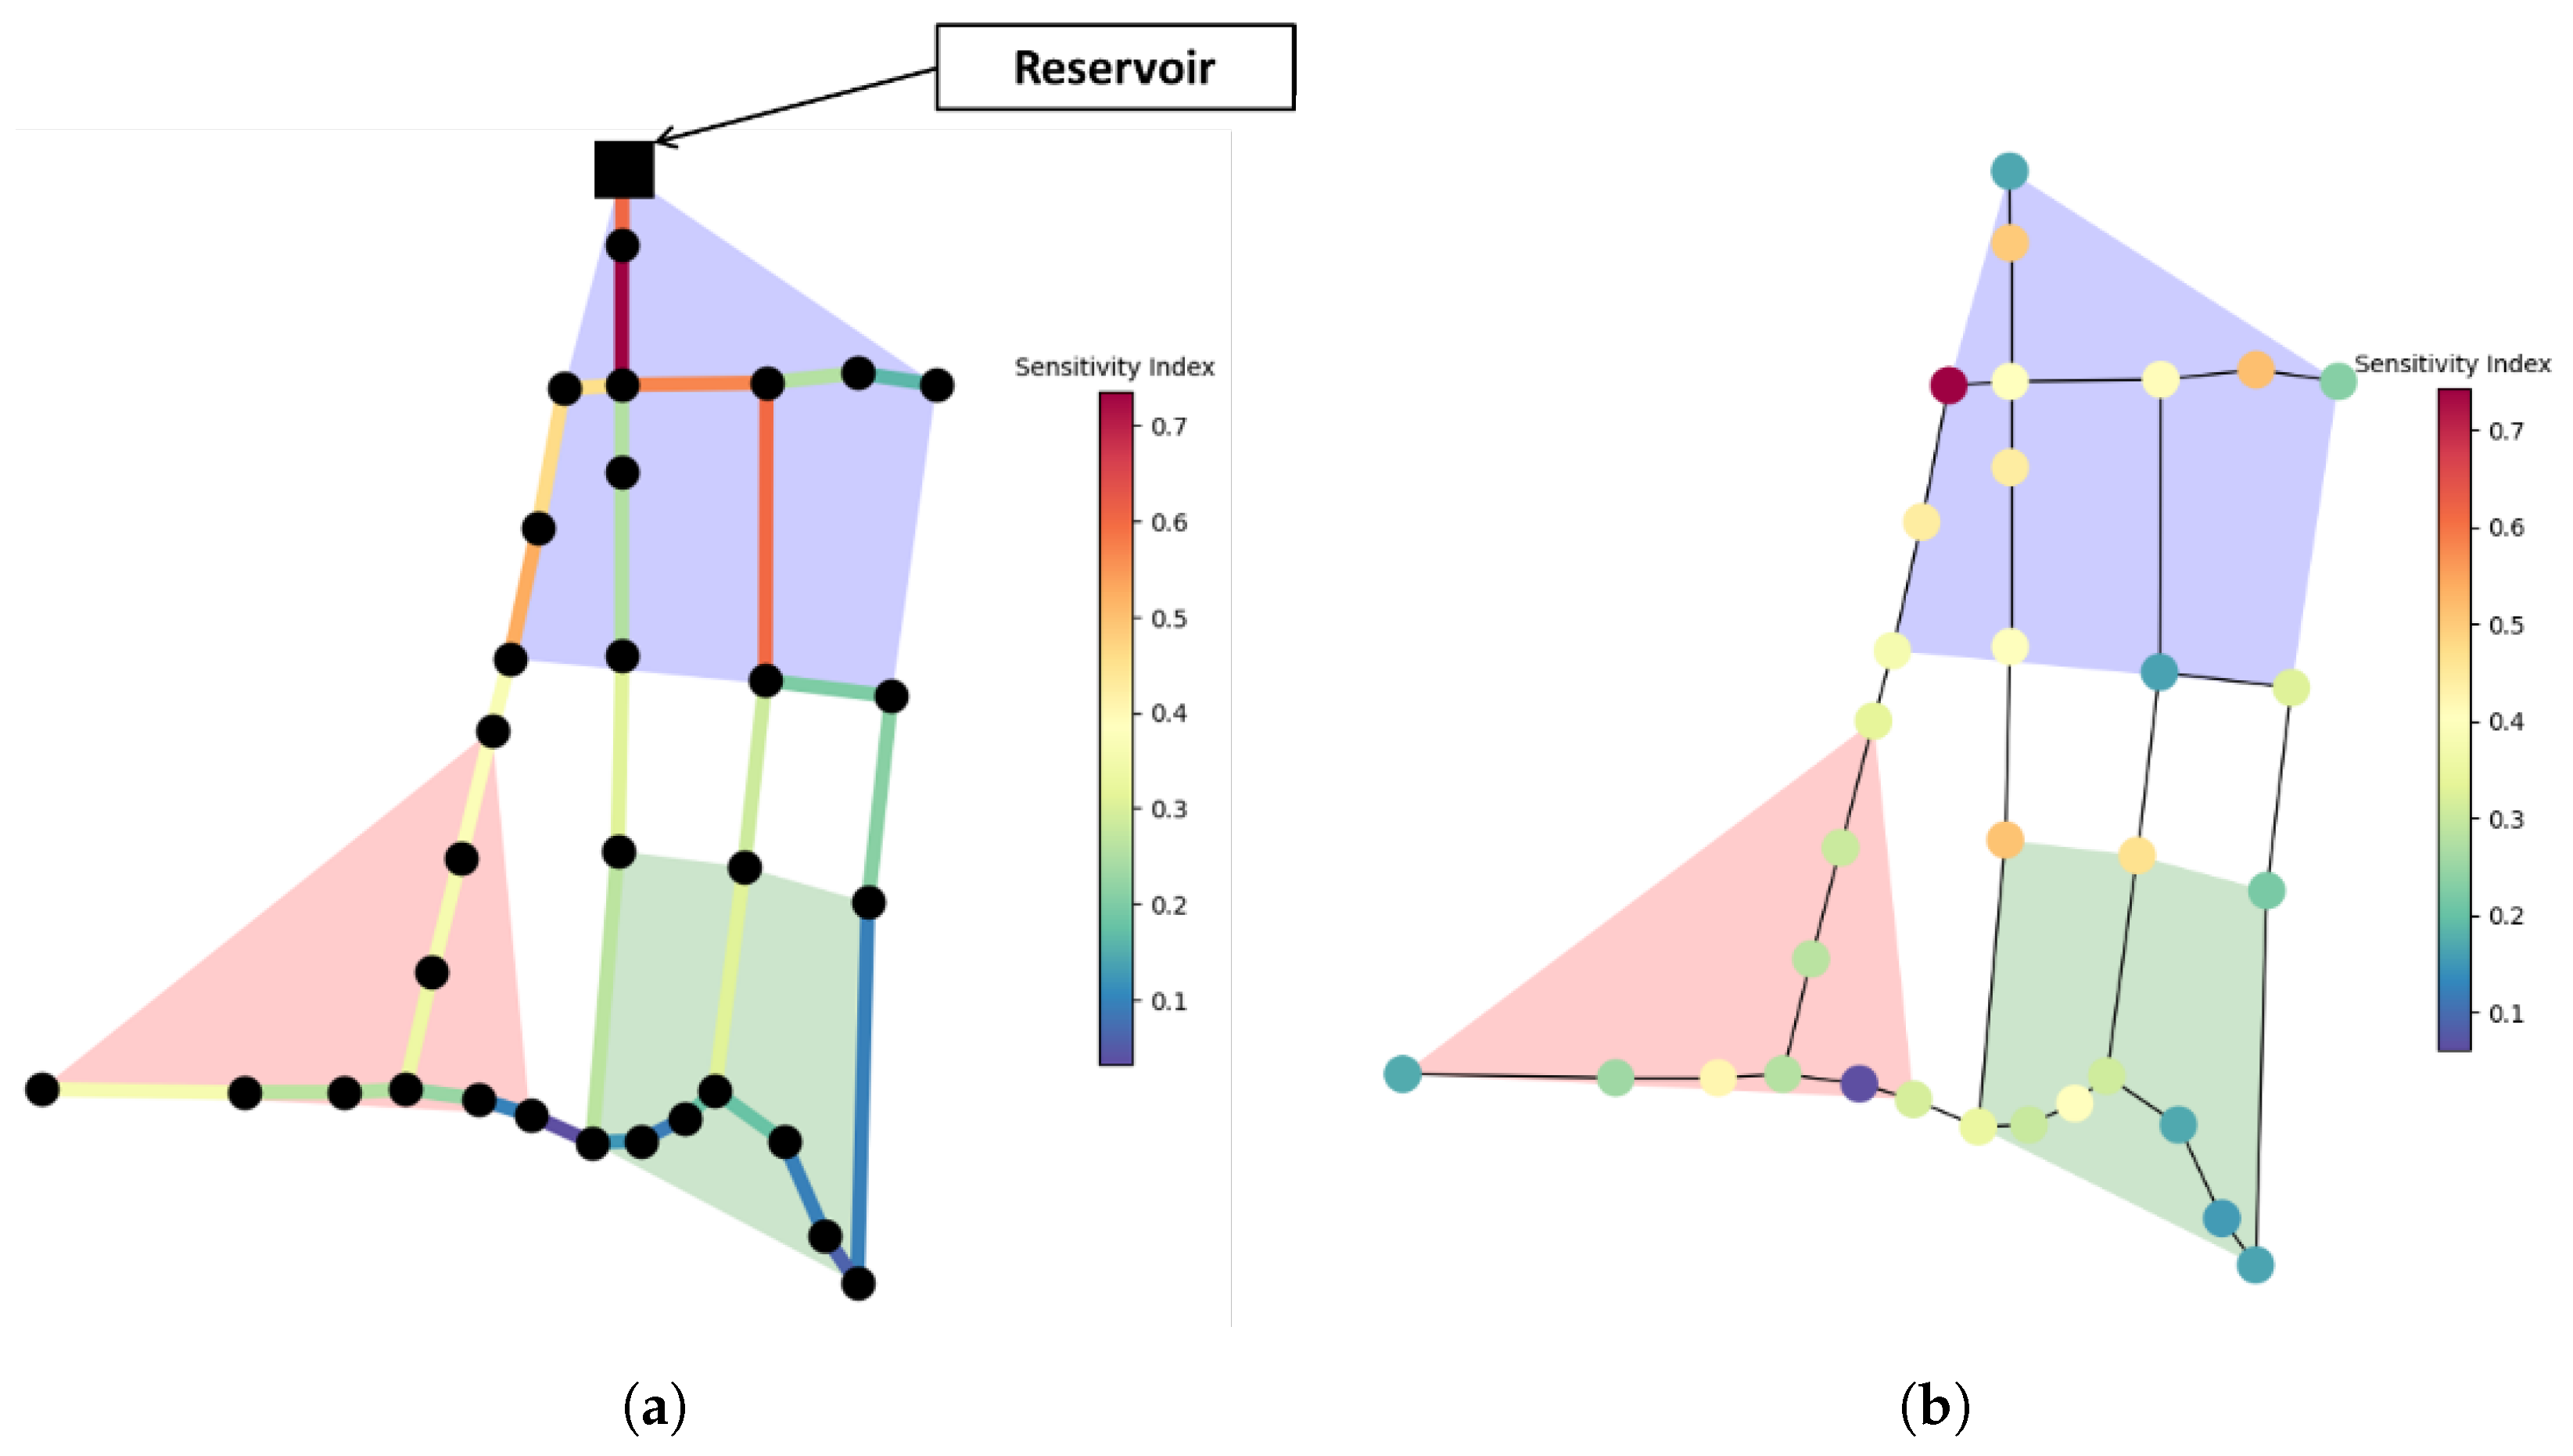
Zonal Identification Process: At the outset of our analysis, we initiated the process with the Elbow method—a strategic approach to identifying the most suitable number of clusters for our dataset. As shown in Figure 4a, the number 3 emerges as the optimal number of clusters, as indicated by the ’elbow’ in the figure. After determining this, we apply the k-means clustering algorithm, which enables us to effectively partition the dataset into three coherent and distinct zones (green zone, red zone, and blue zone) (see Figure 4b).
2.
Parameters Scaling Procedure: Upon identifying all of the distinct zones within the network, we advance to the pivotal normalization step. This process is essential as it uniformly scales all parameter values to a standard range between 0 and 1.
For this illustrative example, let us calculate the normalization value for the first pipe in the network. To achieve this, we will utilize min–max normalization for each parameter.
If we denote L, D, F, V, H, Vol, and EB as the actual values for the length, diameter, flow, velocity, headloss, volume, and edge betweenness of the first pipe, and Lmin Lmin, Lmax Lmax, and so on as the minimum and maximum values for these parameters, based on Equation (6), the normalized values for all parameters would be calculated as:
Normalized length = L Lmin Lmax Lmin = 100 100 3500 100 = 0 ;
Normalized diameter = D Dmin Dmax Dmin = 1016 304.8 1016 304.8 = 1 ;
Normalized flow = F Fmin Fmax Fmin = 5580.9 766.35 5588.9 766.35 = 1 ;
Normalized velocity = V V min V max V min = 6.831 0.0076 6.8319 0.0076 = 1 ;
Normalized headloss = H H min H max H min = 28.59 0 28.59 0 = 1 ;
Normalized volume = Vol Vol min Vol max Vol min = 81.073 10.944 2148.43 19.944 = 0.032 ;
Normalized edge betweenness = ED ED min ED max ED min = 0.0625 0.0584 0.2883 0.0584 = 0.015 .
This normalization allows us to compare and analyze these parameters on an equal footing, as they are all rescaled to a uniform range, facilitating further steps such as weighting or sensitivity analysis.
3.
Assigning Weights to Parameters: Upon establishing the seven critical parameters of the network—length, diameter, flow, velocity, headloss, volume, and edge betweenness—we embark on the task of allocating a distinctive weight to each. This allocation process utilizes the respective entropy values of these parameters as a foundation.
To compute the entropy, we first calculate the probability distribution of each unique value within a parameter. For example, for the length parameter, we tally the frequency of each unique length measurement and normalize these frequencies to form a probability distribution:
P ( x i ) = Total number of occurrences of x i Total number of samples
After that we calculate the entropy:
H ( X ) = i = 1 N P ( x i ) log ( P ( x i ) )
where H(X) is the Shannon entropy for the length values, P ( x i ) is the probability of each unique length, and N is the number of unique lengths.
So, the entropy of each parameter is:
Entropy length = 3.284;
Entropy diameter = 3.141;
Entropy flow = 3.232;
Entropy velocity = 3.033;
Entropy headloss = 3.295;
Entropy volume = 3.287;
Entropy edge betweenness = 3.022.
After calculating the entropies for each parameter, the next step is to convert these entropy values into weights that can be used in our analysis. Transforming entropies into weights involves normalizing the entropy values to account for the number of unique values each parameter can take. This is performed using the concept of reduced entropy.
The formula for reduced entropy ( H r e d u c e d ) is given by:
H r e d u c e d = E log ( N )
where E is the entropy of a particular parameter, and N is the count of unique values that the parameter can take.
Based on reduced entropy, we calculate the weight of each parameter using this formula:
w i = 1 H r e d u c e d ( x i ) m i = 1 n H r e d u c e d ( x i )
where m is the total number of parameters. The resulting weights are exemplified as:
Weight length = 0.101;
Weight diameter = 0.161;
Weight flow = 0.123;
Weight velocity = 0.206;
Weight headloss = 0.097;
Weight volume = 0.1;
Weight edge betweenness = 0.211.
4.
Sensitivity Index Computation: The Sensitivity Index Computation is the culmination of our methodological process where each parameter’s relative importance, as determined by the previously calculated weights, is utilized to quantify the network’s vulnerability to leaks. So, the Sensitivity Index for the first pipe is:
S 1 = ( 0 × 0.101 ) + ( 1 × 0.161 ) + ( 0.999 × 0.123 ) + ( 0.999 × 0.206 ) + ( 1 × 0.097 ) + ( 0.032 × 0.1 ) + ( 0.015 × 0.211 )
Upon performing this calculation, the resultant Sensitivity Index for the first pipe is determined to be 0.59. This quantifies the combined effect of all weighted parameters for that specific pipe, providing a singular, comprehensive metric of its sensitivity.
• Pipes’ Sensitivity Index interpretation: The Sensitivity Index calculated for each pipe in the network is visually represented on a graph, as shown in Figure 5a. This graph uses a color gradient to convey the relative sensitivity of each pipe segment within the network, with the progression from blue to red indicating an increase from low to high sensitivity.
Notably, pipes within the green zone are distinguished as sensitive, denoting their strategic location adjacent to the reservoir. This is significant as these links serve as crucial conduits from the water source to the rest of the network, amplifying their importance. The sensitivity escalates for pipes that intersect the periphery of the green zone, transitioning into other areas, which indicates their critical role in maintaining the network’s integrity. Furthermore, the links bridging the green zone with other regions are inherently at risk, emphasizing the impact and importance of these transitional segments within the network’s hierarchy.
• Junctions’ Sensitivity Index interpretation: Let us evaluate each junction within the network using the same methodology applied to the network’s pipes. We will maintain the existing zone divisions. The second phase involves normalization, where we apply the min–max normalization technique to the parameters of the junctions. This process adjusts elevation, demand, pressure, degree centrality, closeness centrality, and betweenness centrality values, scaling them to a range between 0 and 1. Subsequently, we will assign weights to each parameter to determine which factors most significantly impact the junctions and minimize water leakage in the network.
After computing the weights for each parameter, we advance to calculating the Sensitivity Index for each network junction. As illustrated in Figure 5b, node colors represent the degree or the sensibility index; that is, the colors range from blue to red, representing a scale from low to high sensitivity. Blue sections describe areas assessed as safe, with a lower Sensitivity Index, while red sections highlight areas of higher sensitivity, suggesting potential concerns.
Figure 5 illustrates the varying degrees of sensitivity across different junctions within the network. It is evident that junctions with multiple connecting nodes are identified as being more susceptible to water leakage. This observation is reasonable as these junctions are pivotal points within the network’s structure.

5. Case Studies

5.1. Dataset

Our experiments utilize four distinct WDSs: Balerma, ZJ, FossPoly 1, and L-Town. The characteristics of these WDSs are detailed in Table 1. Each WDS is represented by a directed graph. The directionality of the graph indicates the flow of water from sources to demand nodes under typical demand conditions. These conditions encompass average daily demands, peak demand periods, and minimum night-time flows to replicate a variety of operational scenarios. We conduct the simulations using the EPANET 2.2 software, accessed through the ’wntr’ Python package, which allows for the analysis of water flow and pressure in these directed networks.

5.2. Results: Sensitivity Index

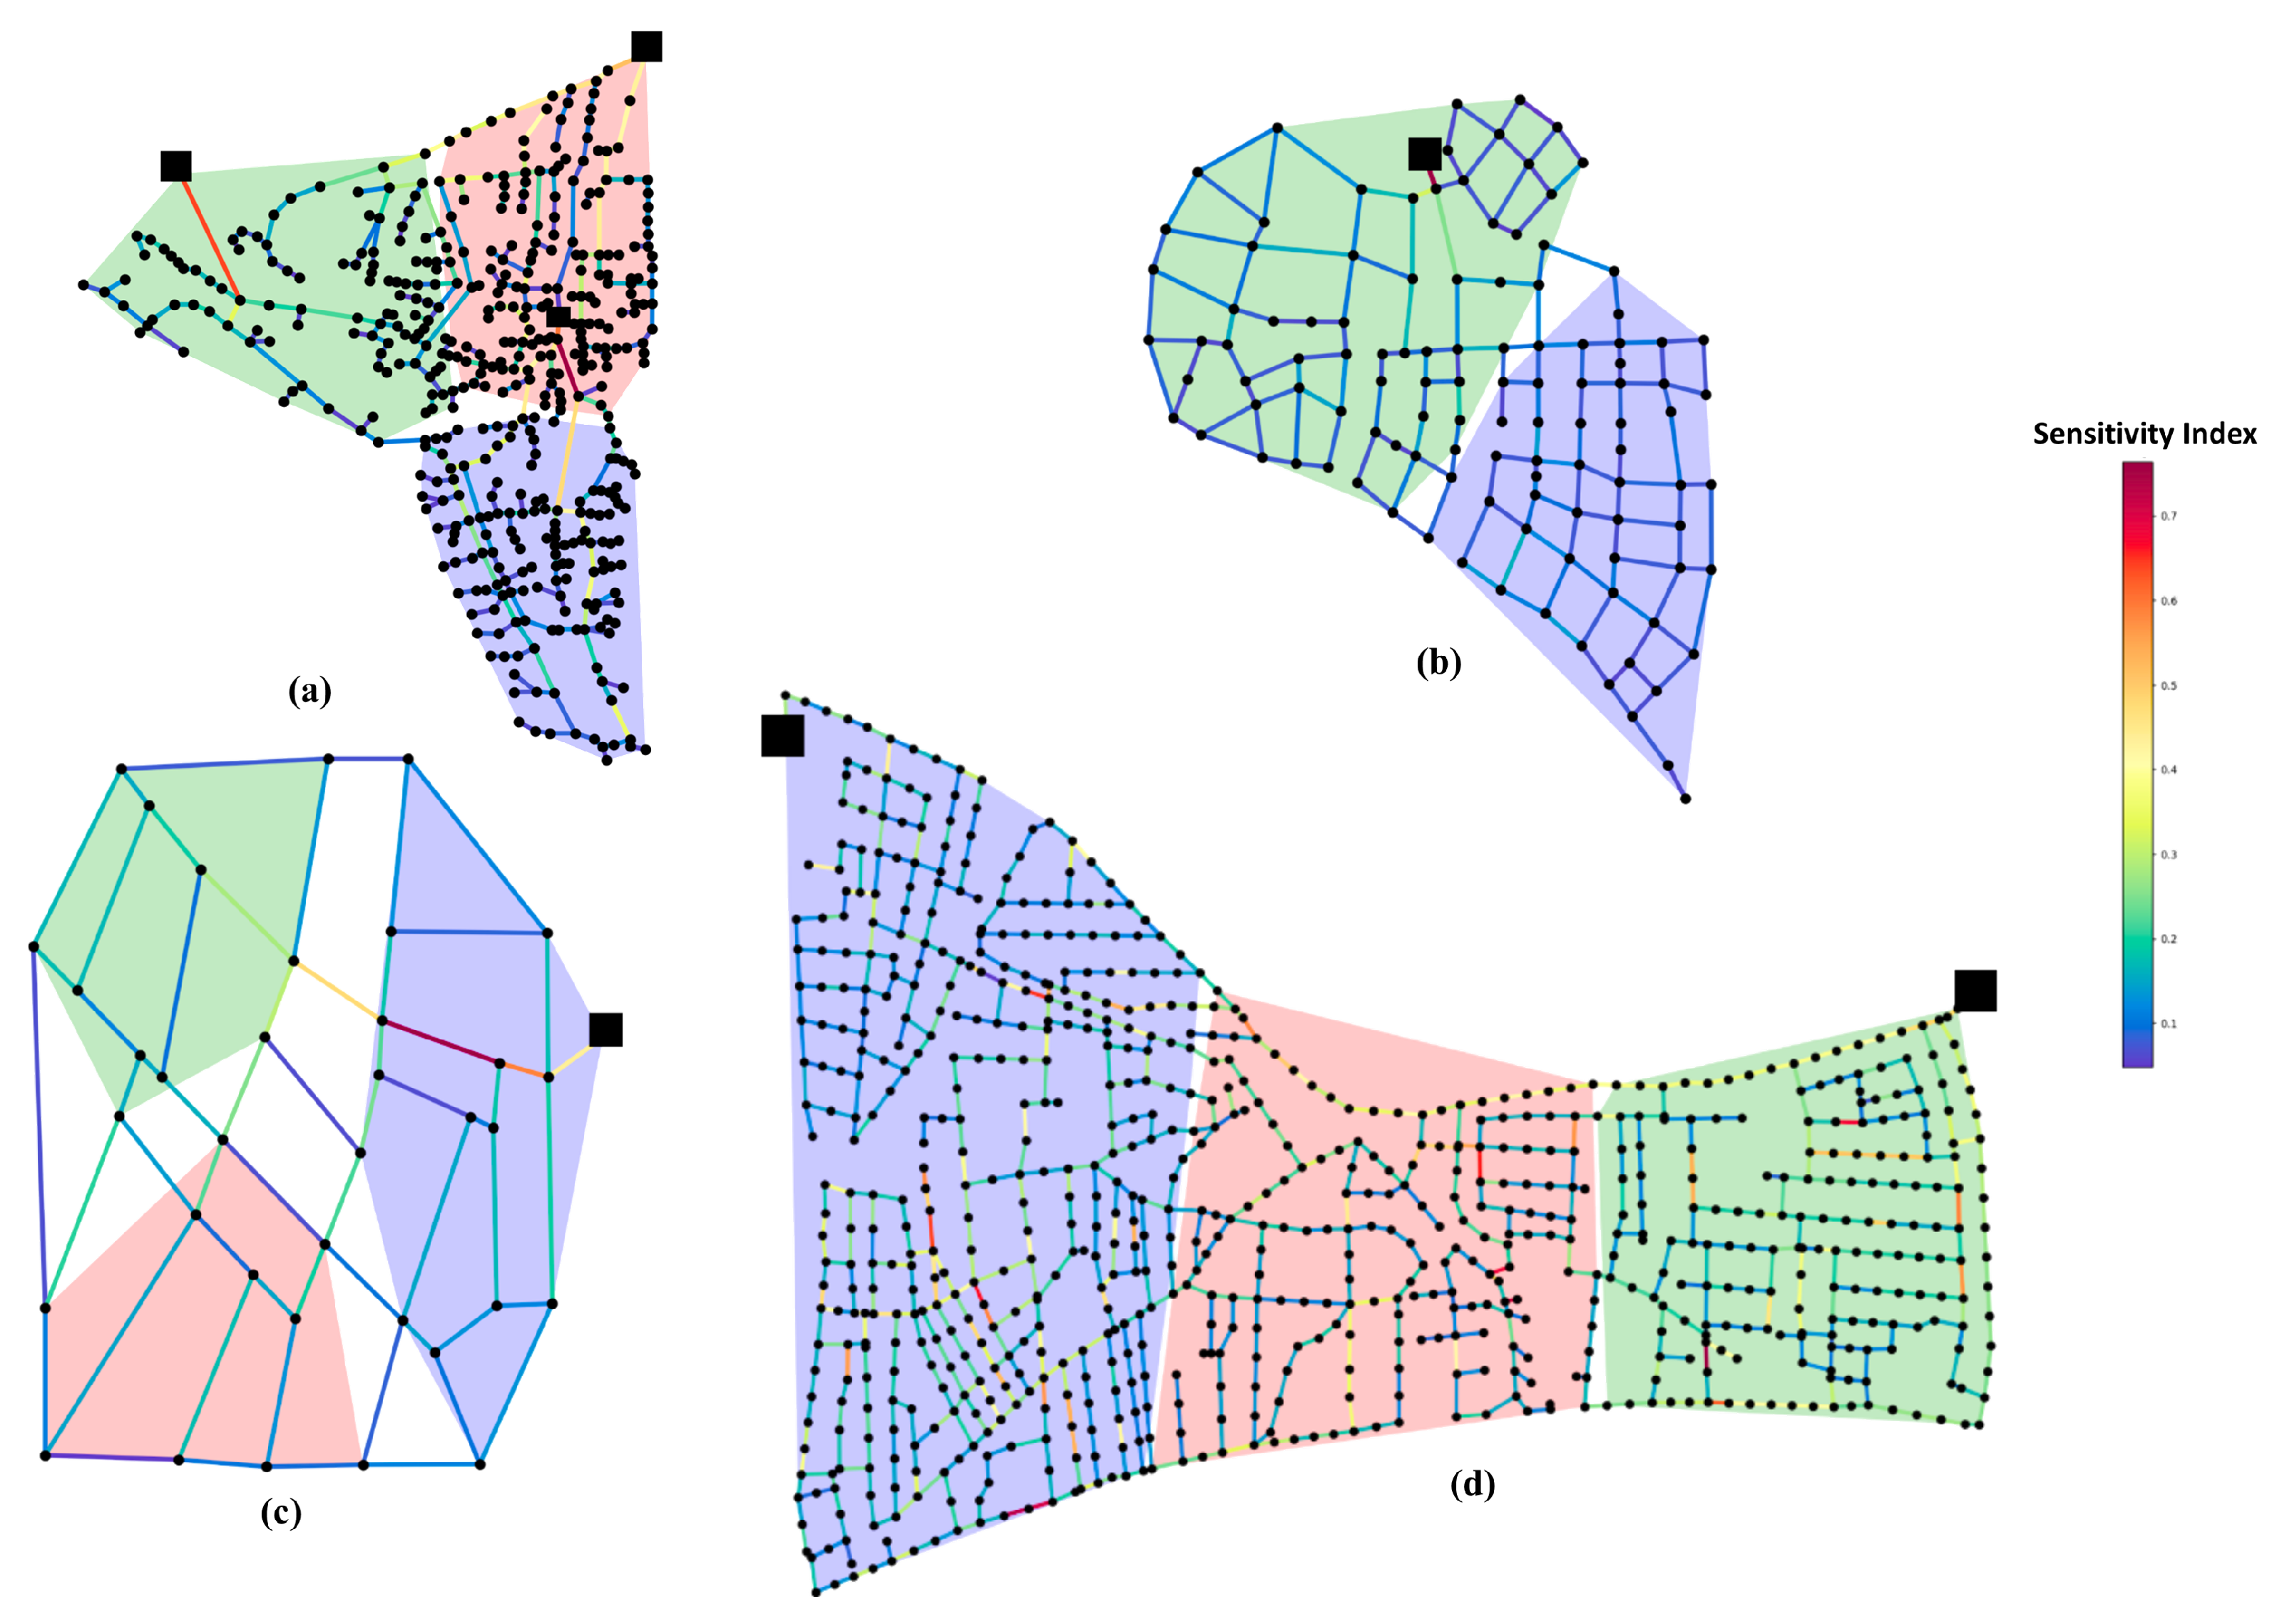
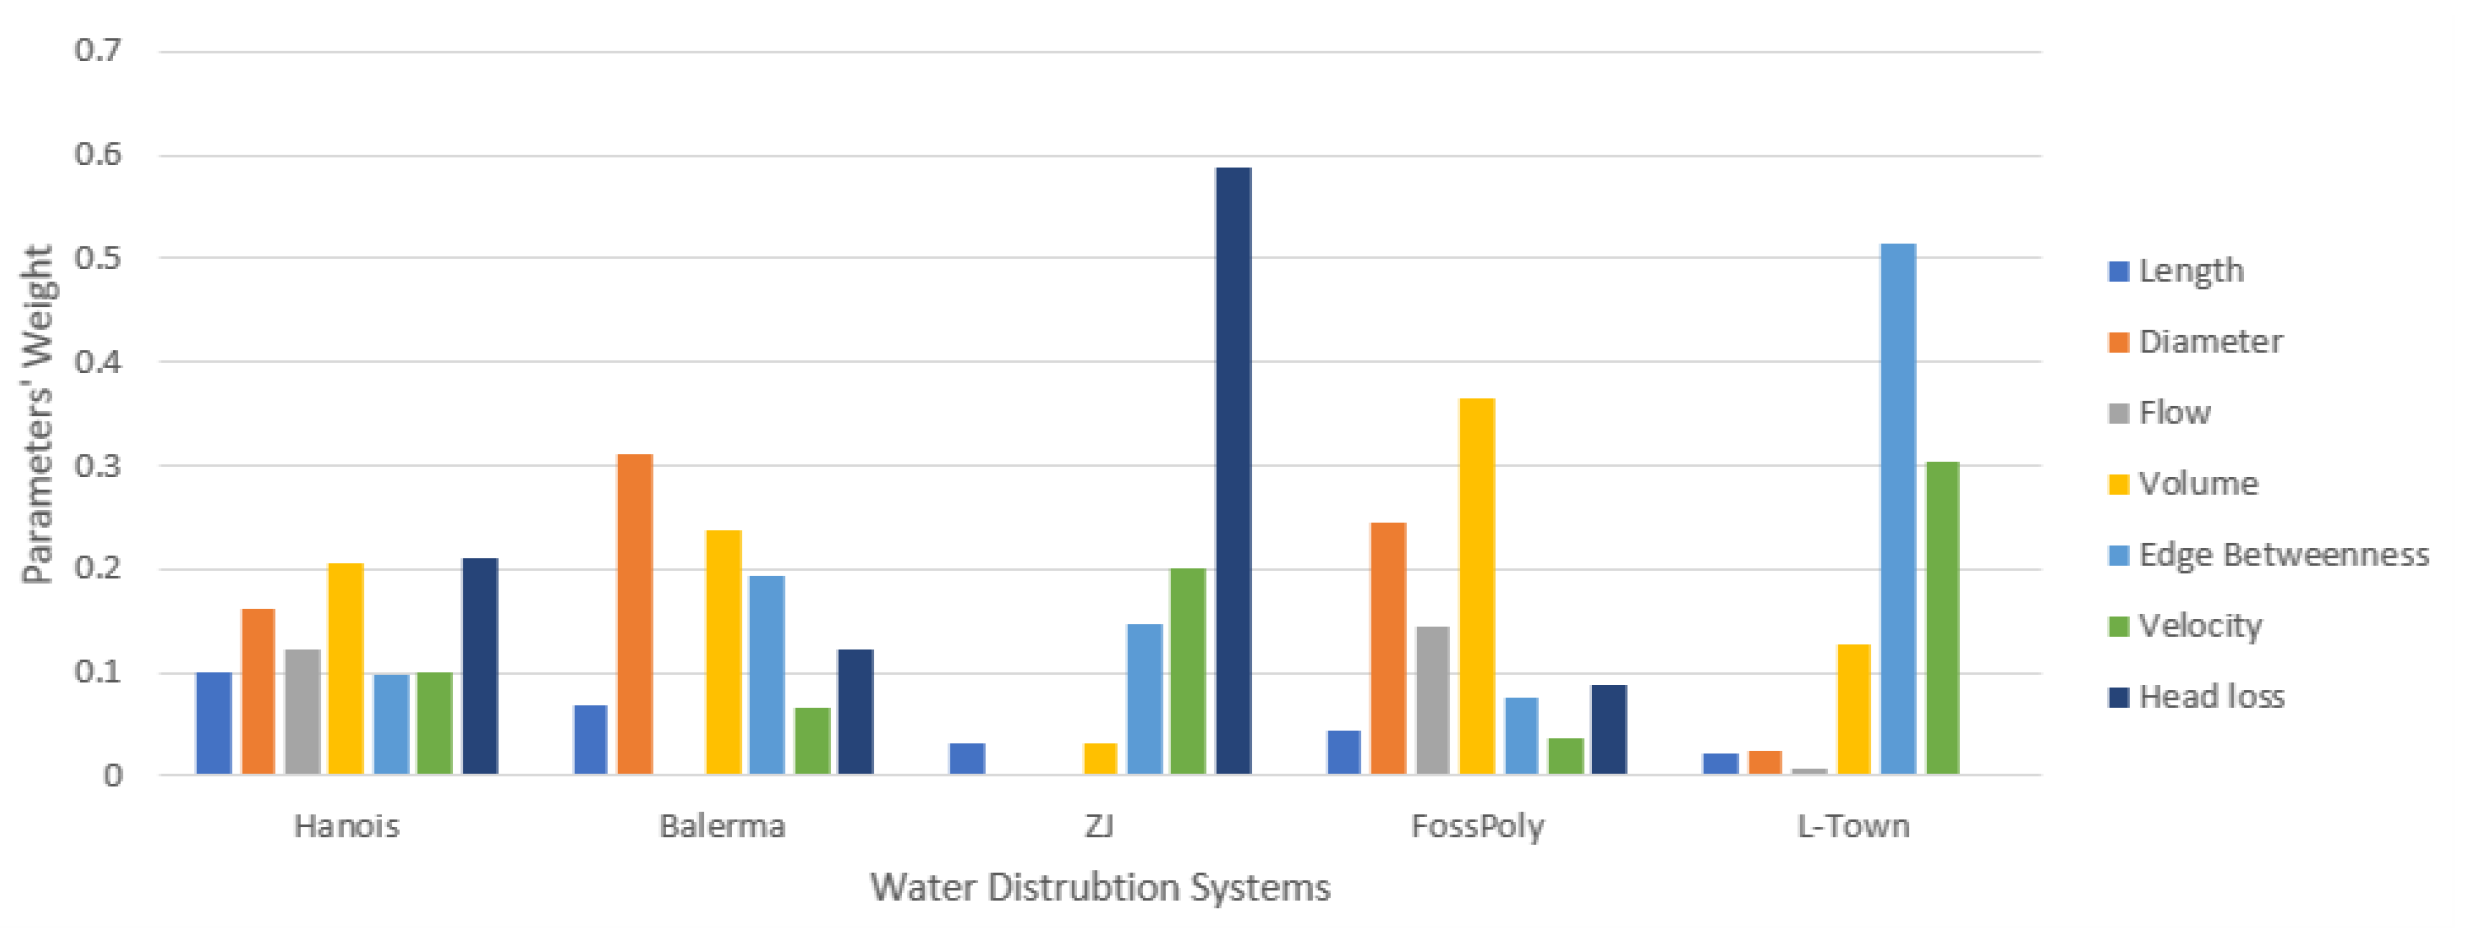
5.2.1. Pipes’ Sensitivity Index Results

In this subsection, we will discuss the results of the sensitivity analysis conducted on pipes. Figure 6 presents the outcomes derived from analyzing four WDSs. The color-coded links (pipes) in these figures are visual indicators of the Sensitivity Index assigned to each segment. The color spectrum ranges from soothing blue to attention-grabbing red, suggesting a continuum from low to high sensitivity. Within this color scheme, blue sections denote regions assessed as safe, characterized by a lower Sensitivity Index. Conversely, red sections highlight areas of heightened sensitivity, signaling potential concerns.
Figure 6a showcases the results of the sensitivity analysis conducted on the WDS of Balerma. The graph delineates three distinct zones identified through k-means clustering. Pipes adjacent to the reservoir are conspicuously marked in yellow, indicating their vulnerability to leaks. The connection between three specific zones is also highlighted as being at risk.
Figure 6b pertains to WDS ZJ, where two zones are discerned. The blue zone is labeled as safe, with all pipes represented in blue. In contrast, the green zone exhibits a mix of green and yellow links, particularly those near the reservoir, suggesting heightened sensitivity in those areas.
Moving on to Figure 6c, dedicated to the FossPoly 1 WDS, three zones are identified. The blue zone exhibits links between red and yellow, signifying its sensitivity, especially considering its proximity to the reservoir. Inter-zone risks are also evident, while the red and green zones are deemed safe due to the prevalence of links exclusively in green and blue.
Lastly, in Figure 6d, we observe the L-Town WDS segmented into three unique zones. Each zone is characterized by specific features and vulnerabilities. Similar to other networks, the links adjacent to the reservoir in this WDS are more susceptible to leaks. However, the distinctive aspect of this particular network is its elongated structure, which suggests that there may be numerous at-risk links scattered throughout.
This network’s extended configuration means that the betweenness measure becomes especially pertinent. It is likely that the links with higher betweenness scores are those that serve as critical pathways for water delivery. These links, often functioning as bridges on the shortest path between two nodes, are integral to the network’s efficiency and reliability. If these links were to fail or leak, the impact could be significant, potentially disrupting service to large segments of the network.
Therefore, regular monitoring of these high-betweenness links is essential for leak detection and prompt maintenance. By proactively identifying and addressing vulnerabilities in these critical areas, the network’s overall resilience can be enhanced, ensuring consistent water supply and minimizing the risk of large-scale service interruptions.
Figure 7 illustrates the significance of various parameters within five WDSs. The figure effectively highlights the importance of each parameter:
1.
Length: It holds moderate importance in most networks but is least important in L-Town, where the pipe lengths are very close.
2.
Diameter: This parameter is crucial in Balerma due to the variance of pipe diameter, whereas its importance varies in other networks.
3.
Flow: In FossPoly 1 and Hanoi, the flow’s importance is markedly high, suggesting that it is a crucial parameter for the networks’ operation.
4.
Volume: The high importance of volume in FossPoly 1 suggests an emphasis on storage capacity within the network.
5.
Edge Betweenness: The prominence of edge betweenness in L-Town could indicate a focus on network connectivity or the diversity of paths because L-Town is a larger graph.
6.
Velocity: In ZJ, velocity is notably essential, pointing to a prioritization of water delivery speed or system dynamics.
7.
Head Loss: The high importance of head loss in ZJ reflects the network’s susceptibility to pressure drops or its emphasis on energy efficiency.

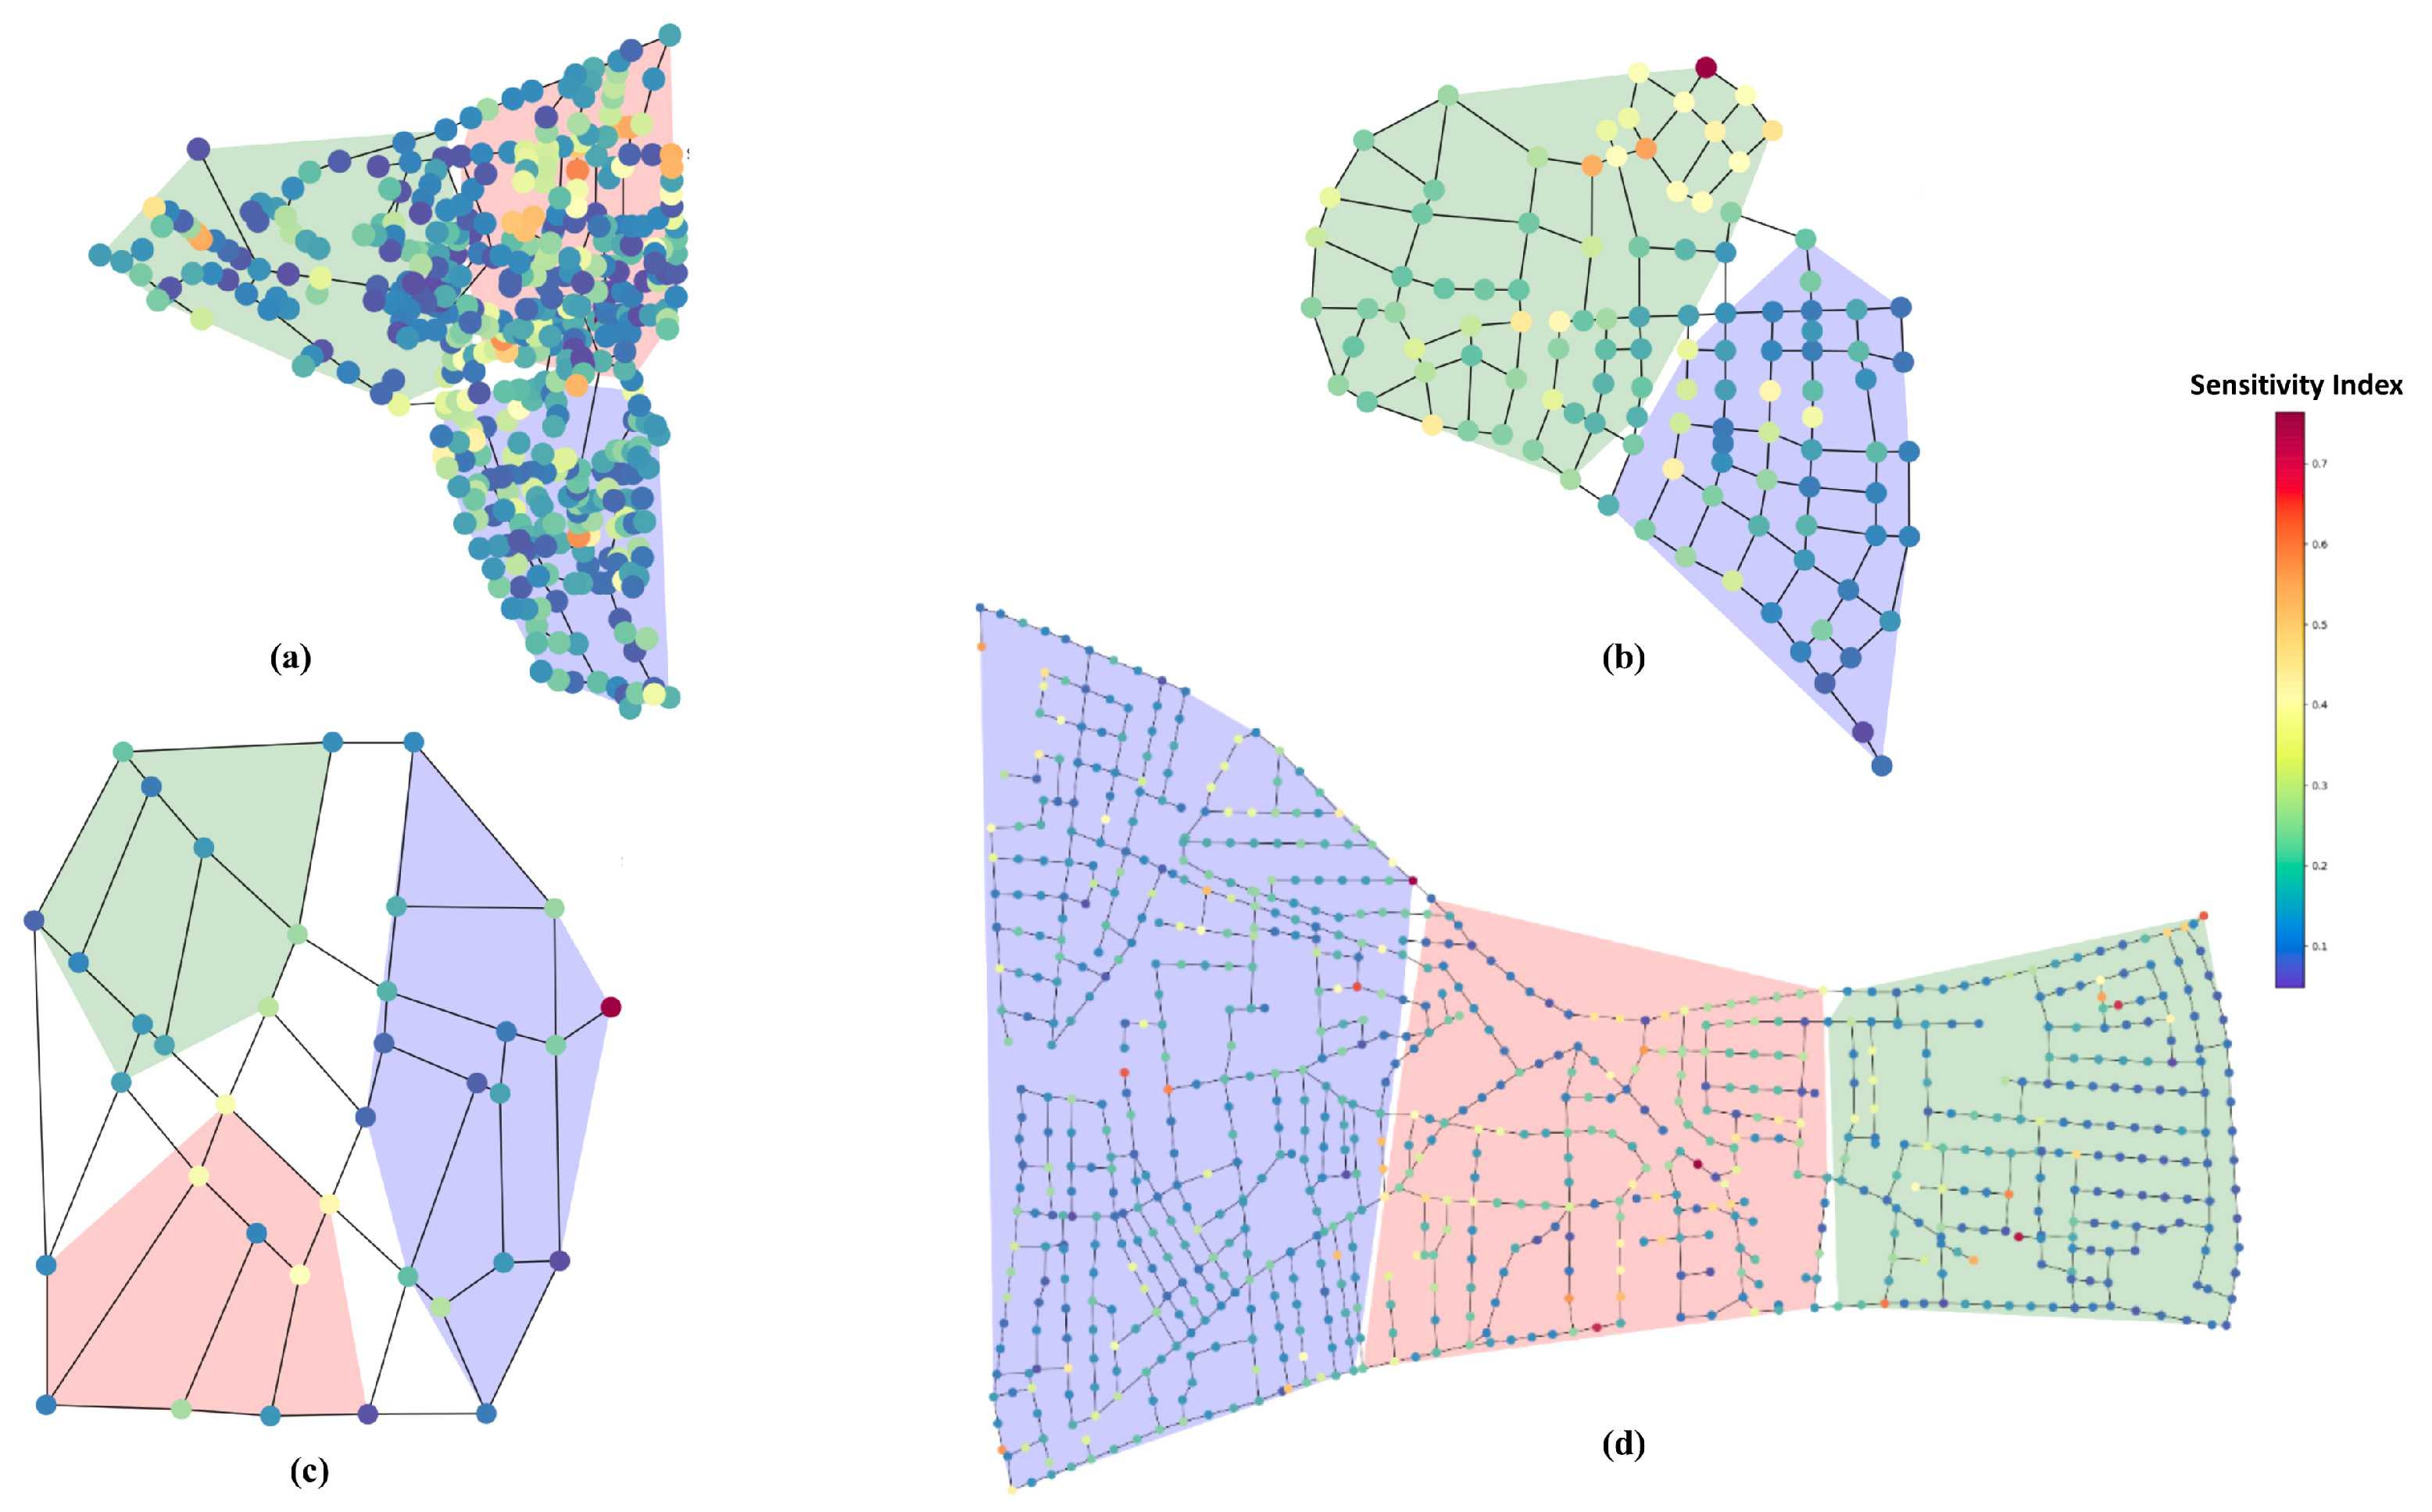
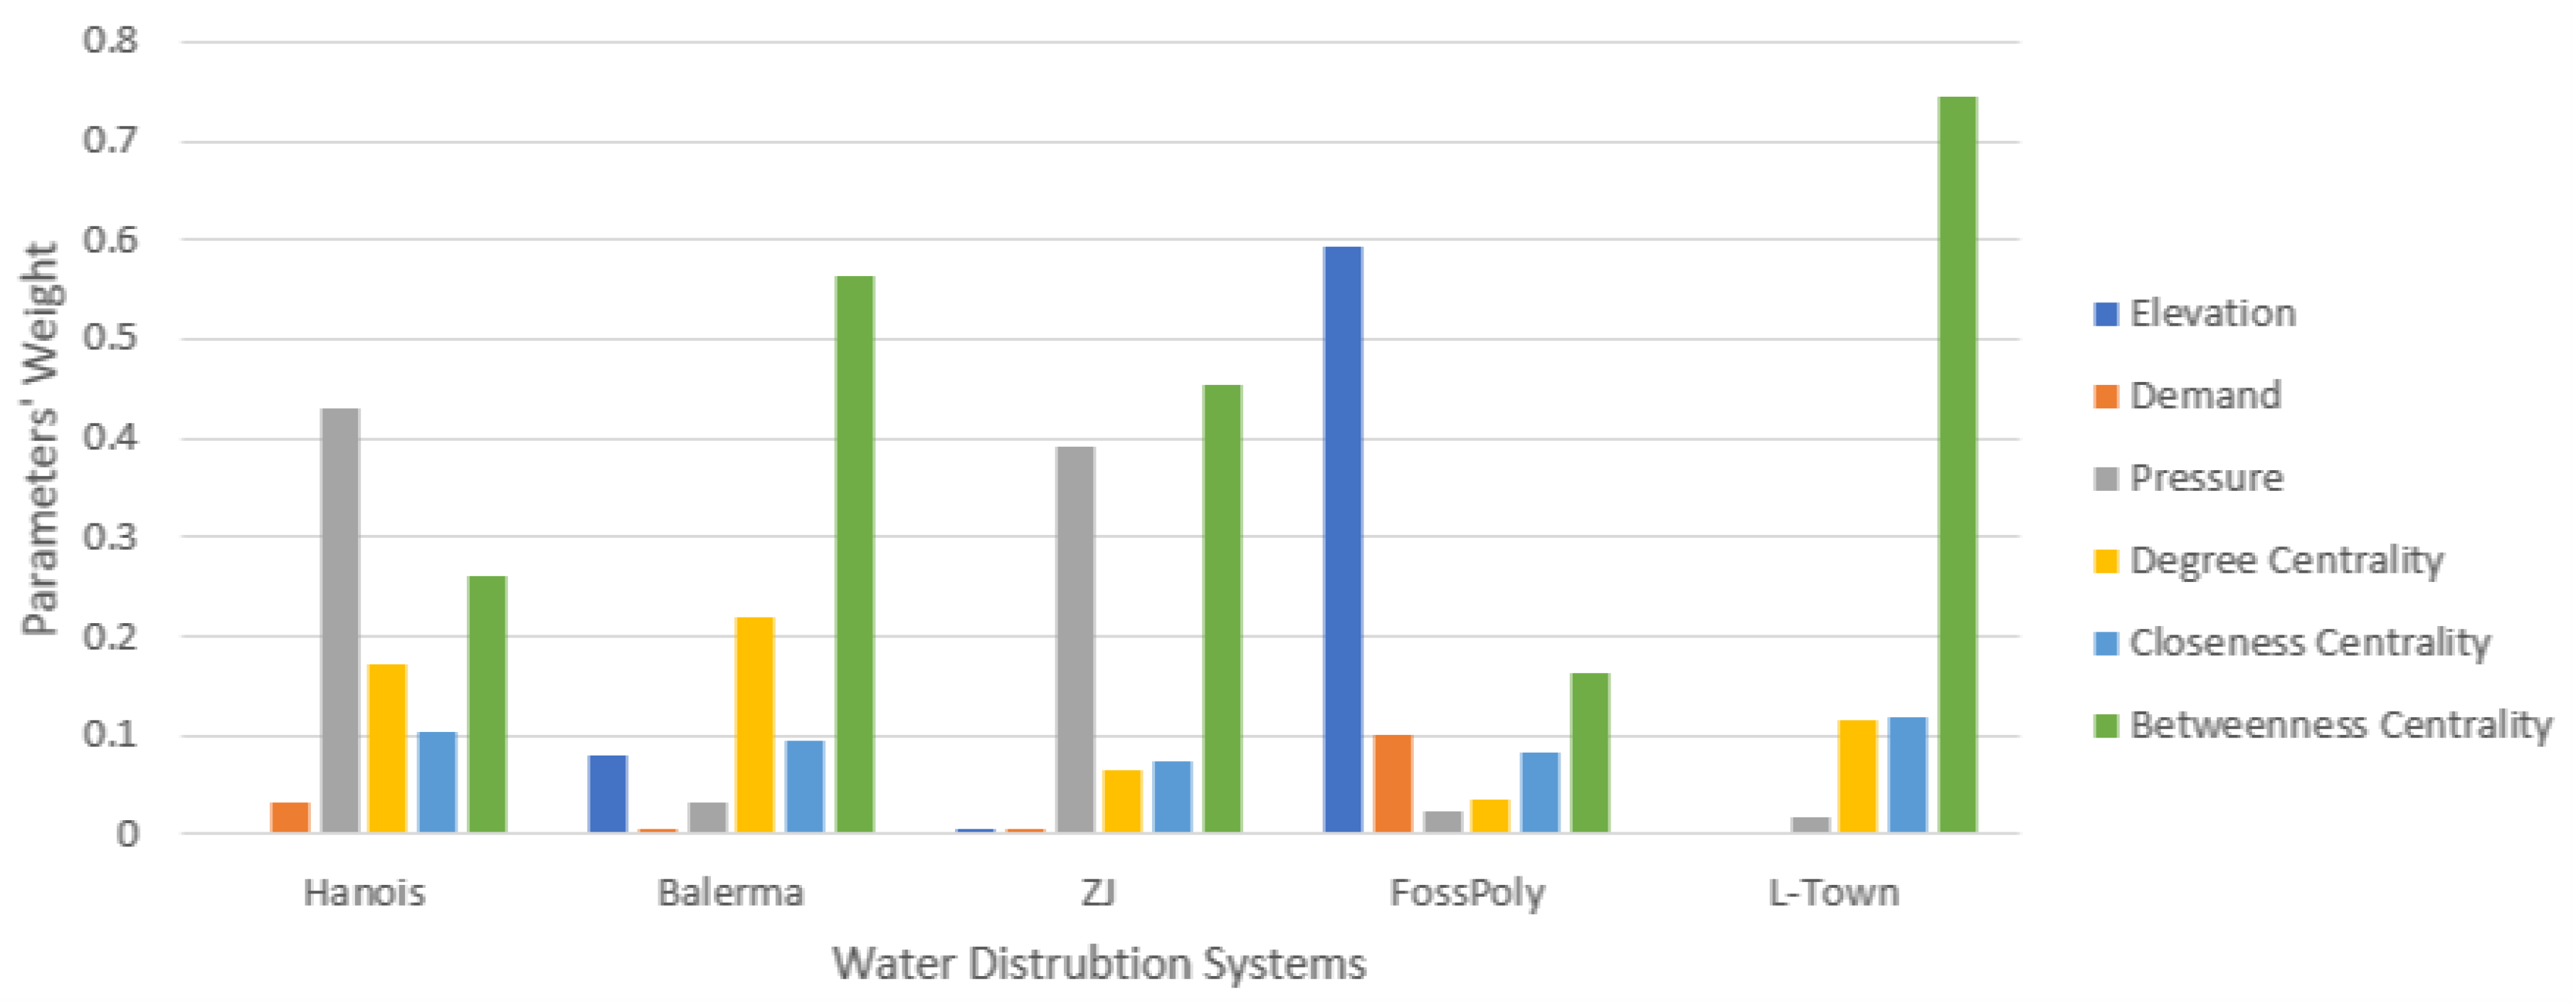
5.2.2. Junctions’ Sensitivity Index Results

In this subsection, we will discuss the sensitivity analysis results conducted on junctions. Figure 8 illustrates the results from analyzing four WDSs. In these figures, the nodes’ colors range from red to blue, representing each junction’s Sensitivity Index, with the colors’ intensities reflecting their susceptibility to leak detection.
Figure 8a shows the Sensitivity Index outcomes for the Balerma WDS. The red zone contains two water reservoirs, and it is observed that the majority of nodes fall within the orange, yellow, and green spectrum, logically indicating proximity to the water source, which is inherently more susceptible to leaks. Notably, nodes that serve as bridges with multiple connections to other nodes are also marked as high-risk. This highlights the significance of centrality measures in identifying areas within the network that are most vulnerable to leakage.
Figure 8b presents the Sensitivity Index results of ZJ WDS. Most nodes within the green zones range between green and yellow, while the red node represents the reservoir. This indicates that this area is at risk as it contains the water source for the entire network.
Figure 8c focuses on the FossPoly 1 WDS. Similar to previous observations, the red node represents a reservoir with a higher risk of leakage. Additionally, the four yellow nodes, characterized by their numerous connections to other nodes, are also identified as potential high-risk points for leakage.
Lastly, we examine the L-Town WDS in Figure 8d. As with other networks, nodes representing reservoirs are sensitive to leakage. Unlike other WDSs, we also observe that the three zones contain nodes with varied colors, indicating a high degree of connectivity due to the network’s extensive length. This suggests that this system is particularly vulnerable to leaks.
These findings highlight the importance of centrality measures—degree, betweenness, and closeness—in identifying sensitive zones within WDS for leak detection. Junctions with high betweenness centrality are pivotal for water flow, as they serve as crucial conduits across the network. Those with a high degree of centrality will likely be distribution hubs, directly impacting the network’s redundancy and resilience. Additionally, junctions with high closeness centrality are strategically crucial for efficient water distribution, minimizing the distance that water must travel to reach all points in the system, which could be critical in the event of a leak.
Figure 9 illustrates the weights of various parameters across five different water distribution networks. The figure effectively highlights the importance of each parameter:
1.
Elevation: This parameter seems moderately to highly important in Balerma and FossPoly 1 but less significant in Hanoi, ZJ, and L-Town due to the same values of elevation of the junctions within networks.
2.
Demand: Demand holds varying weights across the networks, being most significant in FossPoly 1 and least in L-Town.
3.
Pressure: Pressure is essential in ZJ and Hanoi, indicating that the networks’ performance is sensitive to pressure variations.
4.
Degree Centrality: Degree centrality has a substantial weight in Balerma, suggesting that the number of immediate connections to a node is a significant factor in this network.
5.
Closeness Centrality: FossPoly 1 WDS presents a higher weight for closeness centrality, implying that the efficiency of water distribution to any given node is a priority for this network.
6.
Betweenness Centrality: Betweenness centrality has an essential weight in all networks, indicating that controlling the flow through nodes that act as bridges within networks is a critical aspect of its design and functionality.

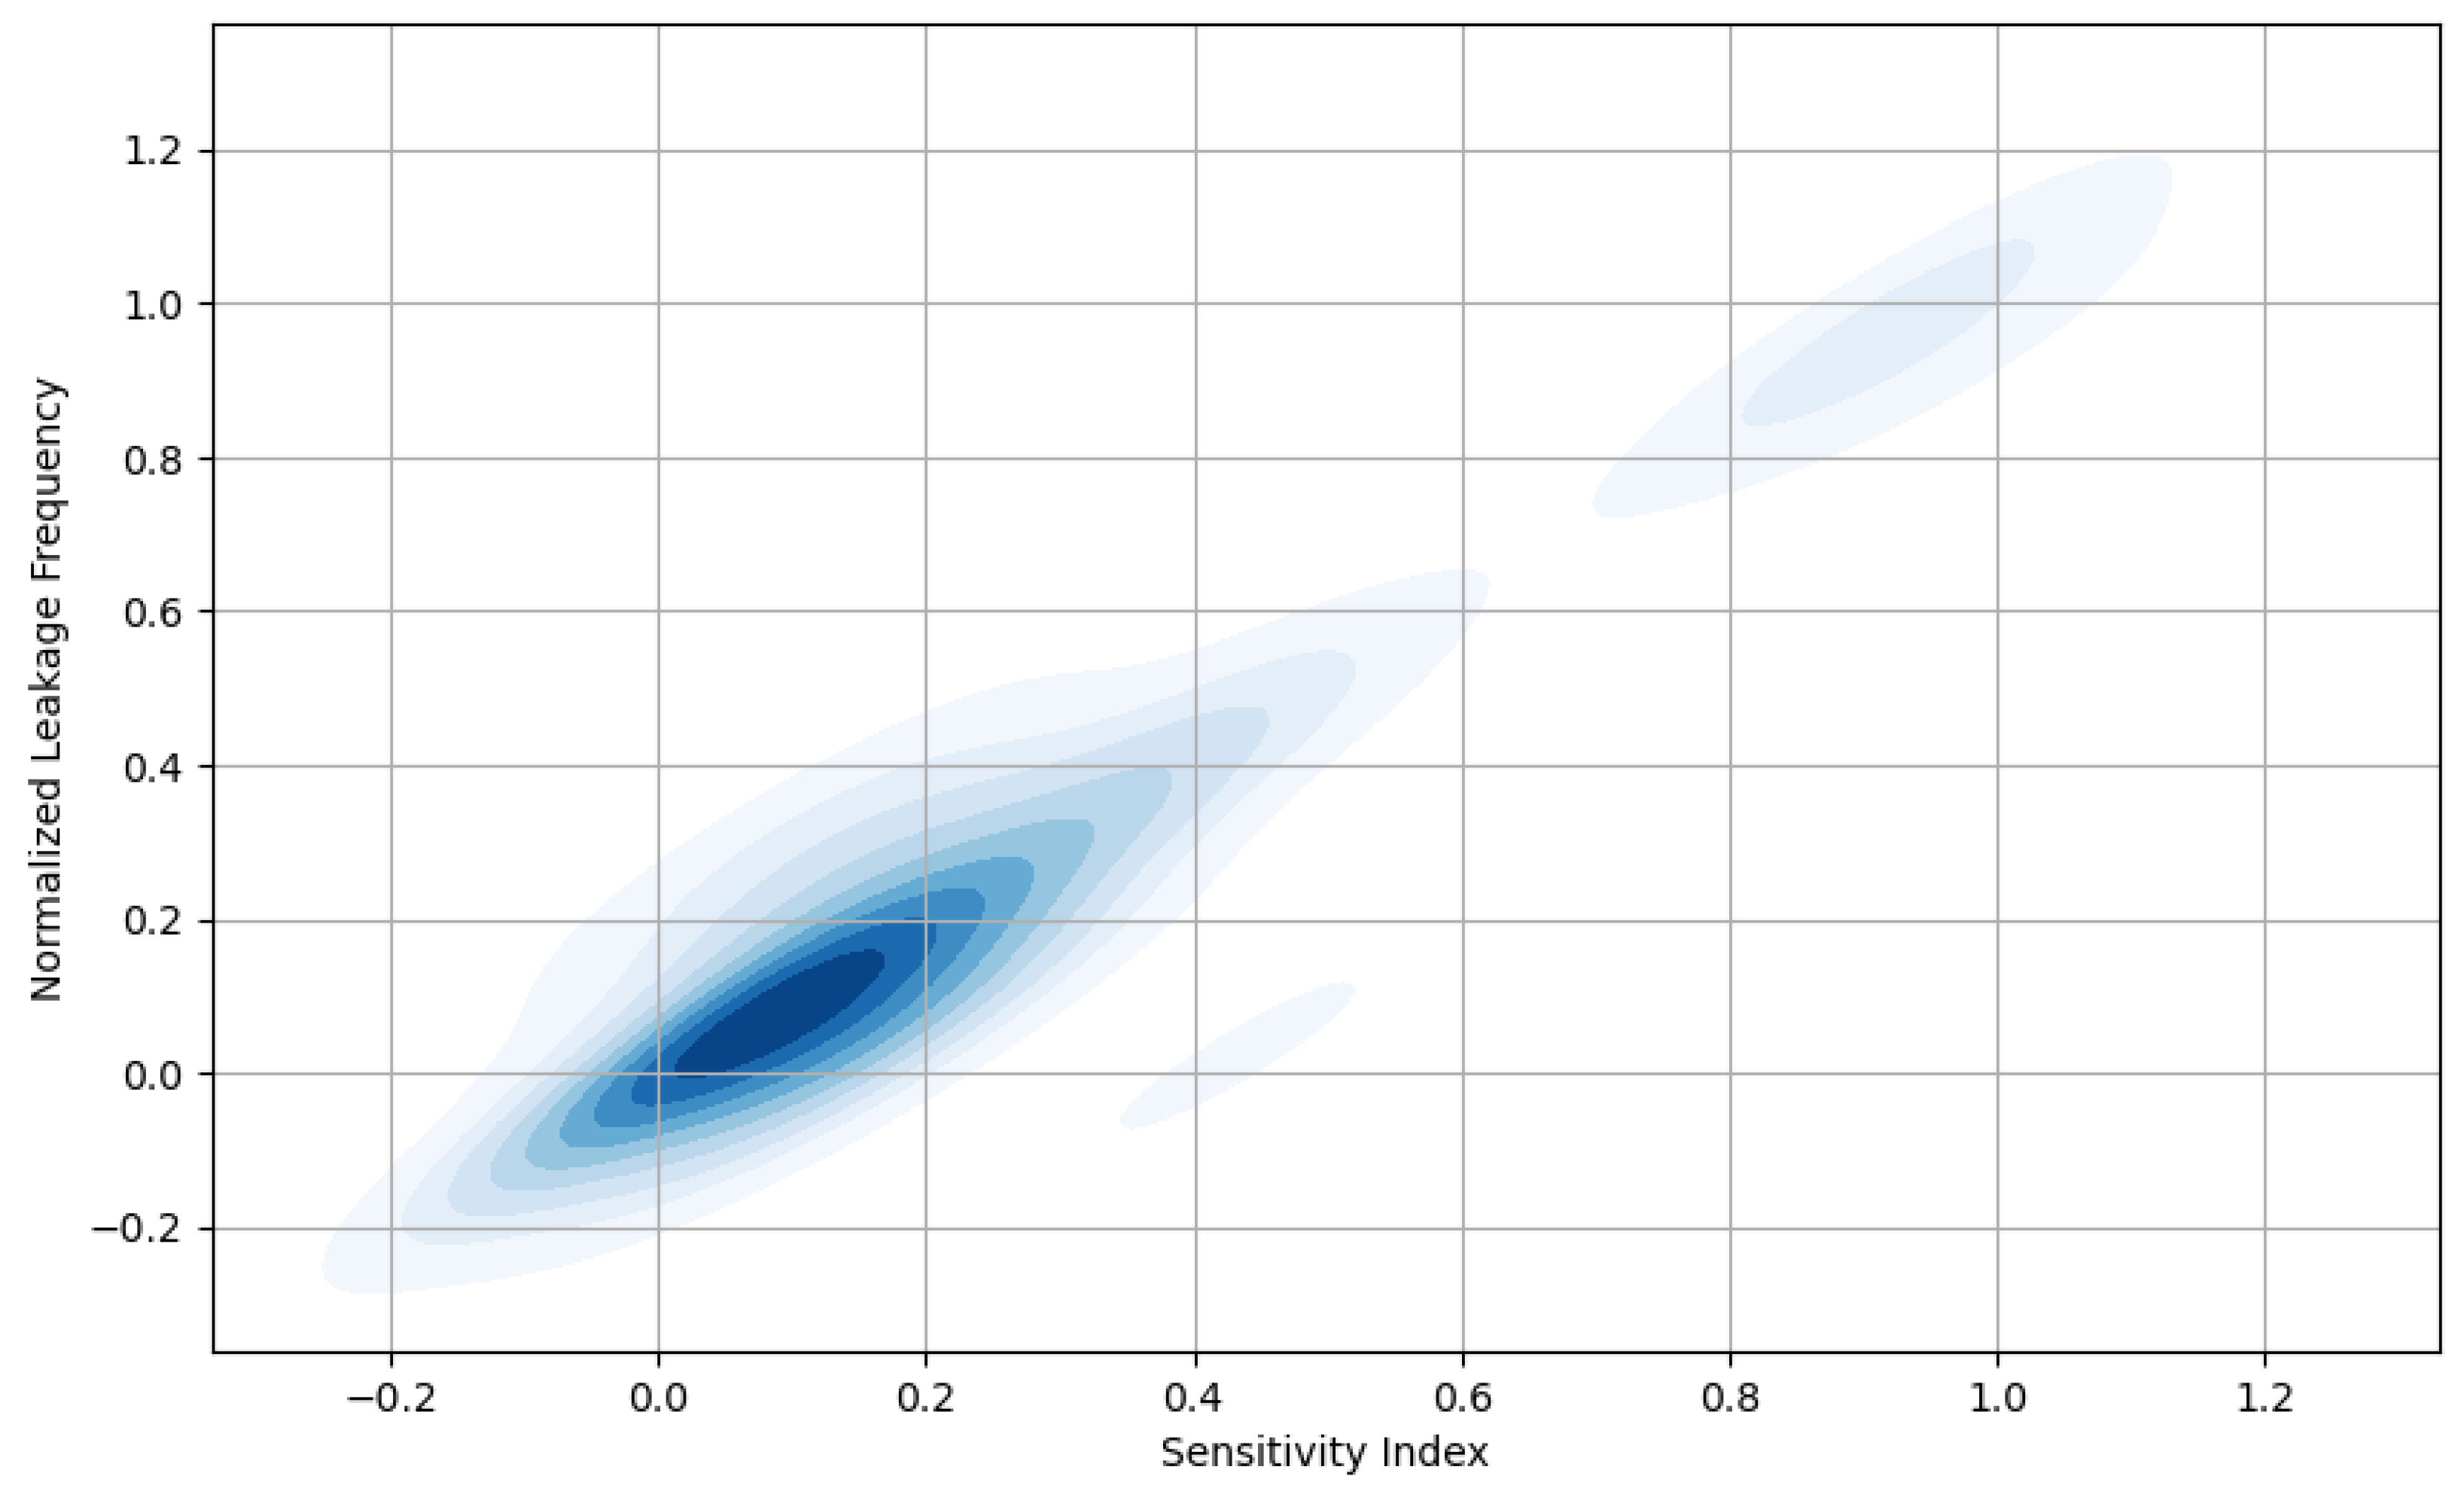
5.3. Validation of Sensitivity Index Using Historical Data from L-Town WDS

The validation of the obtained results of the Sensitivity Index was conducted using the L-Town WDS as a case study, given the availability of detailed historical leakage records. The objective was to establish a correlation between the Sensitivity Index values assigned to different nodes within the network and the actual occurrence of leakages over a period of two years. By establishing this, we aimed to determine the index’s ability to identify nodes that are more vulnerable to leakages and thus validate its practical utility.
Historical data have been analyzed to calculate leakage frequencies at each node, providing a quantitative basis for assessing network sensitivity. These frequencies have been normalized to a range from 0 to 1 to align with the Sensitivity Index values, allowing direct comparison. The normalized leakage frequency represents the proportion of time each node has experienced leakage, providing a consistent measure for comparison across the network.
We employed Spearman’s rank correlation coefficient (SCC) to evaluate the association between the nodes’ Sensitivity Index and their normalized leakage frequency. SCC is a non-parametric measure used to assess the strength and direction of a monotonic relationship between two variables. It determines the extent to which a monotonic function can represent the association between variables [56].
S C C = 1 6 i = 1 n d i 2 n ( n 2 1 )
where d i is the difference between the ranks of the corresponding values X i and Y i .
As a result, the analysis revealed a Spearman’s rank correlation coefficient of 0.6358, which signifies a strong and statistically significant positive relationship. This robust correlation coefficient not only underscores the validity of the Sensitivity Index but also indicates its substantial predictive capability. Moreover, the results confirm that nodes with a higher Sensitivity Index are indeed more likely to experience leakages. As depicted in Figure 10, the kernel density plot visually represents this correlation between the nodes’ Sensitivity Index and the normalized leakage frequency. This pattern solidifies the reliability of the Sensitivity Index as an effective indicator for pinpointing likely sites of leakage within the WDS. Consequently, this index emerges as an instrumental asset in guiding maintenance and remedial actions, enabling the strategic allocation of resources to areas demonstrably more prone to leakage incidents.
The evidence provided by the historical data of L-Town WDS affirms that the Sensitivity Index can effectively stratify network components based on their vulnerability to leakages. This stratification facilitates a more informed approach to resource allocation, enabling water utilities to optimize their operational and maintenance strategies for enhanced resilience of the WDS.

6. Practical Implications of Findings

The sensitivity analysis conducted on pipes and junctions within various water distribution systems has yielded insights with significant implications for water management and infrastructure enhancement. In the following section, some practical implications of the proposed method are presented:
  • Targeted Maintenance and Repair: Sensitivity analysis identifies the most vulnerable points in the network where leaks are likely to appear. This enables maintenance and repairs to be targeted, giving priority to zones requiring more immediate attention, thus reducing downtime and maintenance costs [57,58].
  • Optimal Sensor Placement: Sensitivity analysis identifies the most critical points in the water distribution network. By understanding where the network is most vulnerable, utilities can strategically place sensors (pressure, acoustic, …) where they are most needed to effectively detect leaks [59].
  • Water Conservation: Sensitivity analysis can help achieve significant water savings by enabling early detection and repair of leaks. This is crucial in regions facing water shortages and can contribute to broader water conservation and sustainable development objectives [60,61].
  • Energy and Cost Savings: Detecting and repairing leaks quickly saves both energy and money. Less water loss means less water to treat and distribute, which reduces the water distribution system’s energy footprint and operating costs [62].
  • Environmental Benefits: Reducing leakage and improving the efficiency of water systems can reduce their impact on the environment. This includes reducing water wastage, energy consumption, and greenhouse gas emissions associated with water treatment and distribution [63].

7. Summary and Conclusions

Water distribution systems are inherently complex and diverse. The literature on WDS often overlooks the critical role of pipe network topology and its influence on performance concerning both hydraulic functionality and water quality [64,65]. we have addressed a significant gap in the literature and highlighted key areas for improving system resilience and efficiency.
Our analysis revealed several key findings:
  • Pipe Characteristics and System Performance:
    Analysis of pipe networks reveals the nuanced impact of hydraulic parameters on system performance. Pipe length is typically of moderate importance, with uniformity in some systems negating its influence. Larger diameters are pivotal for accommodating high flow volumes at lower velocities, Ismaeel and Zayed, in their paper [65], indicate that the main indicator contributing to the performance of pipes is the diameter of pipe, underscoring his critical role in the overall effectiveness and reliability of the pipe network. In this study, we note that larger diameters often correlate with higher edge betweenness centrality, reflecting their crucial role in network flow. Similarly, pipes characterized by high flow are integral to the network, indicated by their high edge betweenness, and are thus focal points for leak detection efforts to preserve network integrity. Additionally, pipes with substantial volume capacities are essential during peak demand, while excessive velocities may signal critical throughput but risk infrastructure damage and inefficiency. Furthermore, the pronounced head loss could highlight pipes that are long or of a smaller diameter, potentially reducing their edge betweenness if more efficient alternatives are available.
  • Node Analysis for Leak Detection:
    In the context of leak detection, node analysis reveals potential correlations between hydraulic measures and graph theory metrics. A junction’s elevation can affect the hydraulic pressure due to gravitational forces. High-demand nodes are often characterized by greater centrality, requiring connections to multiple pipes for sufficient water supply. Such nodes may also exhibit elevated betweenness centrality, indicating their importance in the distribution network. Conversely, closeness centrality might decrease if a node is strategically positioned near others to meet its high demand efficiently. Nodes experiencing higher pressure are likely to be pivotal in directing flow, reflecting increased degree and betweenness centrality while also demonstrating higher closeness centrality due to their strategic location for effective distribution. These interdependencies between a node’s physical characteristics and network centrality underscore the complex dynamics that shape a water distribution system’s topology. To utilize these insights for leak detection, precise network modeling and comprehensive analysis are essential to determine the exact relationships within a specific system.
In summarizing these key findings, our study provides substantial evidence of the significant potential for enhancing the operational efficiency and resilience of WDSs. By mapping network topology to a graph, these metrics can pinpoint critical nodes and links, assess the impact of component failures, and identify areas with high leak probability, thus providing a strategic approach to monitoring and maintenance for enhanced system resilience. However, this study has certain limitations. The Sensitivity Index developed is based on a static snapshot of the system and does not account for temporal variations in demand and supply, which can alter flow dynamics and the importance of certain pipes and junctions. In future research, we will aim to integrate real-time data for dynamic analysis, apply the findings across various WDS configurations for broader validation, and develop algorithms that adapt to changes within the network to refine leak prediction and system resilience. Further exploring how these metrics can aid other WDS management aspects could also yield significant benefits.

Author Contributions

Conceptualization, M.A., S.A.E.A., J.C., E.B.D., R.A. and J.C.; methodology, M.A.; software, M.A.; validation, M.A., E.B.D., J.C., R.A. and S.A.E.A.; formal analysis, M.A. and E.B.D.; data curation, M.A.; writing—original draft preparation, M.A.; writing—review and editing, S.A.E.A., E.B.D. and R.A.; supervision, J.C.; project administration, J.C. All authors have read and agreed to the published version of the manuscript.

Funding

This research received no external funding.

Data Availability Statement

Data used in this study are cited in Section 5.1.

Conflicts of Interest

The authors declare no conflict of interest.

References

  1. Cook, C.; Bakker, K. Water security: Debating an emerging paradigm. Glob. Environ. Chang. 2012, 22, 94–102. [Google Scholar] [CrossRef]
  2. Irfeey, A.M.M.; Alotaibi, B.A.; Najim, M.M.M.; Shah, A.A. Water Valuation in Urban Settings for Sustainable Water Management. Water 2023, 15, 3105. [Google Scholar] [CrossRef]
  3. Rehman, R.; Aslam, M.S.; Jasińska, E.; Javed, M.F.; Goňo, M. Guidelines for the Technical Sustainability Evaluation of the Urban Drinking Water Systems Based on Analytic Hierarchy Process. Resources 2023, 12, 8. [Google Scholar] [CrossRef]
  4. Al Qahtani, T.; Yaakob, M.S.; Yidris, N.; Sulaiman, S.; Ahmad, K.A. A review on water leakage detection method in the water distribution network. J. Adv. Res. Fluid Mech. Therm. Sci. 2020, 68, 152–163. [Google Scholar] [CrossRef]
  5. Gupta, A.; Kulat, K. A selective literature review on leak management techniques for water distribution system. Water Resour. Manag. 2018, 32, 3247–3269. [Google Scholar] [CrossRef]
  6. Liemberger, R.; Wyatt, A. Quantifying the global non-revenue water problem. Water Supply 2019, 19, 831–837. [Google Scholar] [CrossRef]
  7. Kingdom, B.; Liemberger, R.M.P. The Challenge of Reducing Non-Revenue Water (NRW) in Developing Countries-How the Private Sector Can Help: A Look at Performance-Based Service Contracting; World Bank Group: Washington, DC, USA, 2006; Volume 14. [Google Scholar]
  8. D’Ercole, M.; Righetti, M.; Ugarelli, R.M.; Berardi, L.; Bertola, P. An Integrated Modeling Approach to Optimize the Management of a Water Distribution System: Improving the Sustainability while Dealing with Water Loss, Energy Consumption and Environmental Impacts. Procedia Eng. 2016, 162, 433–440. [Google Scholar] [CrossRef]
  9. Kofinas, D.; Ulanczyk, R.; Laspidou, C.S. Simulation of a Water Distribution Network with Key Performance Indicators for Spatio-Temporal Analysis and Operation of Highly Stressed Water Infrastructure. Water 2020, 12, 1149. [Google Scholar] [CrossRef]
  10. Gautam, J.; Chakrabarti, A.; Agarwal, S.; Singh, A.; Gupta, S.; Singh, J. Monitoring and forecasting water consumption and detecting leakage using an IoT system. Water Supply 2020, 20, 1103–1113. [Google Scholar] [CrossRef]
  11. Torrent, S.G.; Pérez, R. Modelling daily water consumption through potential curves. Disaggregating apparent and real losses. Urban Water J. 2020, 17, 292–302. [Google Scholar] [CrossRef]
  12. Romero-Ben, L.; Alves, D.; Blesa, J.; Cembrano, G.; Puig, V.; Duviella, E. Leak detection and localization in water distribution networks: Review and perspective. Annu. Rev. Control 2023, 55, 392–419. [Google Scholar] [CrossRef]
  13. Yazdani, A.; Jeffrey, P. Applying Network Theory to Quantify the Redundancy and Structural Robustness of Water Distribution Systems. J. Water Resour. Plan. Manag. 2012, 138, 153–161. [Google Scholar] [CrossRef]
  14. Venkatraman, Y.; Narayanaa Y, K.; Balas, V.E.; Rad, D. Graph Theory Applications to Comprehend Epidemics Spread of a Disease. Broad Res. Artif. Intell. Neurosci. 2021, 12, 161–177. [Google Scholar] [CrossRef]
  15. Khan, A.; Uddin, S.; Srinivasan, U. Chronic disease prediction using administrative data and graph theory: The case of type 2 diabetes. Expert Syst. Appl. 2019, 136, 230–241. [Google Scholar] [CrossRef]
  16. Guze, S. Graph theory approach to the vulnerability of transportation networks. Algorithms 2019, 12, 270. [Google Scholar] [CrossRef]
  17. Zhou, F.; Yang, Q.; Zhong, T.; Chen, D.; Zhang, N. Variational Graph Neural Networks for Road Traffic Prediction in Intelligent Transportation Systems. IEEE Trans. Ind. Inform. 2021, 17, 2802–2812. [Google Scholar] [CrossRef]
  18. Vicente, S.; Fuertes-Miquel, O.E.; Coronado-Hernández, D.M.M.; Iglesias-Rey, P.L. Hydraulic modeling during filling and emptying processes in pressurized pipelines: A literature review. Urban Water J. 2019, 16, 299–311. [Google Scholar] [CrossRef]
  19. Sun, C.; Parellada, B.; Puig, V.; Cembrano, G. Leak Localization in Water Distribution Networks Using Pressure and Data-Driven Classifier Approach. Water 2020, 12, 54. [Google Scholar] [CrossRef]
  20. Ostapkowicz, P.; Bratek, A. Detection of Multiple Leaks in Liquid Transmission Pipelines Using Static Flow Model. In Intelligent and Safe Computer Systems in Control and Diagnostics; Kowalczuk, Z., Ed.; Springer: Cham, Switzerland, 2023; pp. 242–253. [Google Scholar] [CrossRef]
  21. Ulusoy, A.J.; Stoianov, I.; Chazerain, A. Hydraulically informed graph theoretic measure of link criticality for the resilience analysis of water distribution networks. Appl. Netw. Sci. 2018, 3, 31. [Google Scholar] [CrossRef]
  22. Dunn, S.; Wilkinson, S.M. Identifying Critical Components in Infrastructure Networks Using Network Topology. J. Infrastruct. Syst. 2013, 19, 157–165. [Google Scholar] [CrossRef]
  23. Agathokleous, A.; Christodoulou, C.; Christodoulou, S.E. Topological robustness and vulnerability assessment of water distribution networks. Water Resour. Manag. 2017, 31, 4007–4021. [Google Scholar] [CrossRef]
  24. Di Nardo, A.; Giudicianni, C.; Greco, R.; Herrera, M.; Santonastaso, G.F. Applications of Graph Spectral Techniques to Water Distribution Network Management. Water 2018, 10, 45. [Google Scholar] [CrossRef]
  25. Giudicianni, C.; Di Nardo, A.; Greco, R.; Scala, A. A community-structure-based method for estimating the fractal dimension, and its application to water networks for the assessment of vulnerability to disasters. Water Resour. Manag. 2021, 35, 1197–1210. [Google Scholar] [CrossRef]
  26. Dastgir, A.; Hesarkazzazi, S.; Oberascher, M.; Hajibabaei, M.; Sitzenfrei, R. Graph method for critical pipe analysis of branched and looped drainage networks. Water Sci. Technol. 2023, 87, 157–173. [Google Scholar] [CrossRef] [PubMed]
  27. Cavallaro, L.; Bagdasar, O.; De Meo, P.; Fiumara, G.; Liotta, A. Graph and Network Theory for the Analysis of Criminal Networks. In Data Science and Internet of Things: Research and Applications at the Intersection of DS and IoT; Fortino, G., Liotta, A., Gravina, R., Longheu, A., Eds.; Springer International Publishing: Cham, Switzerland, 2021; pp. 139–156. [Google Scholar] [CrossRef]
  28. Ficara, A.; Curreri, F.; Cavallaro, L.; De Meo, P.; Fiumara, G.; Bagdasar, O.; Liotta, A. Social network analysis: The use of graph distances to compare artificial and criminal networks. J. Smart Environ. Green Comput. 2021, 1, 14. [Google Scholar] [CrossRef]
  29. Adraoui, M.; Retbi, A.; Idrissi, M.K.; Bennani, S. Maximal cliques based method for detecting and evaluating learning communities in social networks. Future Gener. Comput. Syst. 2022, 126, 1–14. [Google Scholar] [CrossRef]
  30. Akachar, E.; Ouhbi, B.; Frikh, B. ACSIMCD: A 2-phase framework for detecting meaningful communities in dynamic social networks. Future Gener. Comput. Syst. 2021, 125, 399–420. [Google Scholar] [CrossRef]
  31. Ruiz-Frau, A.; Ospina-Alvarez, A.; Villasante, S.; Pita, P.; Maya-Jariego, I.; de Juan, S. Using graph theory and social media data to assess cultural ecosystem services in coastal areas: Method development and application. Ecosyst. Serv. 2020, 45, 101176. [Google Scholar] [CrossRef]
  32. Şahin, E.; Yüce, H. Prediction of Water Leakage in Pipeline Networks Using Graph Convolutional Network Method. Appl. Sci. 2023, 13, 7427. [Google Scholar] [CrossRef]
  33. Barros, D.; Almeida, I.; Zanfei, A.; Meirelles, G.; Luvizotto, E.; Brentan, B. An Investigation on the Effect of Leakages on the Water Quality Parameters in Distribution Networks. Water 2023, 15, 324. [Google Scholar] [CrossRef]
  34. Kim, K.; Koo, J.; Iseley, D.T.; Park, H.; Kim, T.; Hyung, J. Novel Method for Segment Identification in Water Distribution Network through Node-Based Adjacency Matrix. J. Pipeline Syst. Eng. Pract. 2023, 14, 04023030. [Google Scholar] [CrossRef]
  35. Tzatchkov, V.G.; Alcocer-Yamanaka, V.H.; Ortíz, V.B. Graph Theory Based Algorithms for Water Distribution Network Sectorization Projects. In Proceedings of the Water Distribution Systems Analysis Symposium, Cincinnati, OH, USA, 27–30 August 2006; pp. 1–15. [Google Scholar] [CrossRef]
  36. Tzatchkov, V.G.; Alcocer-Yamanaka, V.H. Graph theory based single and multiple source water distribution network partitioning. Tecnol. y Cienc. Agua 2019, 10, 197–221. [Google Scholar] [CrossRef]
  37. Shekofteh, M.; Jalili Ghazizadeh, M.; Yazdi, J. A methodology for leak detection in water distribution networks using graph theory and artificial neural network. Urban Water J. 2020, 17, 525–533. [Google Scholar] [CrossRef]
  38. Giudicianni, C.; Herrera, M.; Di Nardo, A.; Oliva, G.; Scala, A. The faster the better: On the shortest paths role for near real-time decision making of water utilities. Reliab. Eng. Syst. Saf. 2021, 212, 107589. [Google Scholar] [CrossRef]
  39. Dzuwa, C.; Nkhonjera, G.; Musonda, I.; Onososen, A. Identifying Risky Zones in Water Distribution Networks Using Node Burst Indices. In Proceedings of the International Conference on Computing in Civil and Building Engineering, Cape Town, South Africa, 26–28 October 2022; Springer: Berlin/Heidelberg, Germany, 2022; pp. 273–285. [Google Scholar] [CrossRef]
  40. Boccaletti, S.; Latora, V.; Moreno, Y.; Chavez, M.; Hwang, D.U. Complex networks: Structure and dynamics. Phys. Rep. 2006, 424, 175–308. [Google Scholar] [CrossRef]
  41. Giudicianni, C.; Di Nardo, A.; Di Natale, M.; Greco, R.; Santonastaso, G.F.; Scala, A. Topological Taxonomy of Water Distribution Networks. Water 2018, 10, 444. [Google Scholar] [CrossRef]
  42. Hartigan, J.A.; Wong, M.A. Algorithm AS 136: A K-Means Clustering Algorithm. J. R. Stat. Soc. Ser. C (Appl. Stat.) 1979, 28, 100–108. [Google Scholar] [CrossRef]
  43. Chen, J.; Feng, X.; Xiao, S. An iterative method for leakage zone identification in water distribution networks based on machine learning. Struct. Health Monit. 2021, 20, 1938–1956. [Google Scholar] [CrossRef]
  44. Eesa, A.S.; Arabo, W.K. A Normalization Methods for Backpropagation: A Comparative Study. Sci. J. Univ. Zakho 2017, 5, 319–323. [Google Scholar] [CrossRef]
  45. Raju, V.N.G.; Lakshmi, K.P.; Jain, V.M.; Kalidindi, A.; Padma, V. Study the Influence of Normalization/Transformation process on the Accuracy of Supervised Classification. In Proceedings of the 2020 Third International Conference on Smart Systems and Inventive Technology (ICSSIT), Tirunelveli, India, 20–22 August 2020; pp. 729–735. [Google Scholar] [CrossRef]
  46. Jayalakshmi, T.; Santhakumaran, A. Statistical normalization and back propagation for classification. Int. J. Comput. Theory Eng. 2011, 3, 1793–8201. [Google Scholar] [CrossRef]
  47. Shannon, C.E. A mathematical theory of communication. Bell Syst. Tech. J. 1948, 27, 379–423. [Google Scholar] [CrossRef]
  48. Yurong, Q.; Jeon, G. Weight assignment using entropy. Int. J. Multimed. Ubiquitous Eng. 2016, 11, 353–362. [Google Scholar] [CrossRef]
  49. Jin, Y.; Yumei, W.; Ping, L. Approximate entropy-based leak detection using artificial neural network in water distribution pipelines. In Proceedings of the 2010 11th International Conference on Control Automation Robotics & Vision, Singapore, 7–10 December 2010; pp. 1029–1034. [Google Scholar] [CrossRef]
  50. Cui, H.; Sivakumar, B.; Singh, V.P. Entropy Applications in Environmental and Water Engineering. Entropy 2018, 20, 598. [Google Scholar] [CrossRef]
  51. Fujiwara, O.; Khang, D.B. A two-phase decomposition method for optimal design of looped water distribution networks. Water Resour. Res. 1990, 26, 539–549. [Google Scholar] [CrossRef]
  52. Reca, J.; Martínez, J. Genetic algorithms for the design of looped irrigation water distribution networks. Water Resour. Res. 2006, 42, W05416. [Google Scholar] [CrossRef]
  53. Zheng, F.; Simpson, A.R.; Zecchin, A.C. A combined NLP-differential evolution algorithm approach for the optimization of looped water distribution systems. Water Resour. Res. 2011, 47, W08531. [Google Scholar] [CrossRef]
  54. Bragalli, C.; D’Ambrosio, C.; Lee, J.; Lodi, A.; Toth, P. On the optimal design of water distribution networks: A practical MINLP approach. Optim. Eng. 2012, 13, 219–246. [Google Scholar] [CrossRef]
  55. Vrachimis, S.; Eliades, D.; Taormina, R.; Ostfeld, A.; Kapelan, Z.; Liu, S.; Kyriakou, M.; Pavlou, P.; Qiu, M.; Polycarpou, M. Dataset of BattLeDIM: Battle of the leakage detection and isolation methods. In Proceedings of the 2nd Int CCWI/WDSA Joint Conference, Valencia, Spain, 18–22 July 2022; Queen’s Univ.: Kingston, ON, Canada, 2020. [Google Scholar] [CrossRef]
  56. Jung, D.; Yoo, D.G.; Kang, D.; Kim, J.H. Linear Model for Estimating Water Distribution System Reliability. J. Water Resour. Plan. Manag. 2016, 142, 04016022. [Google Scholar] [CrossRef]
  57. Righetti, M.; Bort, C.M.G.; Bottazzi, M.; Menapace, A.; Zanfei, A. Optimal Selection and Monitoring of Nodes Aimed at Supporting Leakages Identification in WDS. Water 2019, 11, 629. [Google Scholar] [CrossRef]
  58. Nault, J.; Papa, F. Lifecycle Assessment of a Water Distribution System Pump. J. Water Resour. Plan. Manag. 2015, 141, A4015004. [Google Scholar] [CrossRef]
  59. Naserizade, S.S.; Nikoo, M.R.; Montaseri, H. A risk-based multi-objective model for optimal placement of sensors in water distribution system. J. Hydrol. 2018, 557, 147–159. [Google Scholar] [CrossRef]
  60. Fu, G.; Kapelan, Z.; Reed, P. Reducing the Complexity of Multiobjective Water Distribution System Optimization through Global Sensitivity Analysis. J. Water Resour. Plan. Manag. 2012, 138, 196–207. [Google Scholar] [CrossRef]
  61. Racoviceanu, A.I.; Karney, B.W. Life-Cycle Perspective on Residential Water Conservation Strategies. J. Infrastruct. Syst. 2010, 16, 40–49. [Google Scholar] [CrossRef]
  62. Wang, M.; Barkdoll, B.D. A sensitivity analysis method for water distribution system tank siting for energy savings. Urban Water J. 2017, 14, 713–719. [Google Scholar] [CrossRef]
  63. Herstein, L.M.; Filion, Y.R.; Hall, K.R. Evaluating Environmental Impact in Water Distribution System Design. J. Infrastruct. Syst. 2009, 15, 241–250. [Google Scholar] [CrossRef]
  64. Hutton, C.J.; Kapelan, Z.; Vamvakeridou-Lyroudia, L.; Savić, D.A. Dealing with Uncertainty in Water Distribution System Models: A Framework for Real-Time Modeling and Data Assimilation. J. Water Resour. Plan. Manag. 2014, 140, 169–183. [Google Scholar] [CrossRef]
  65. Ismaeel, M.; Zayed, T. Integrated Performance Assessment Model for Water Networks. J. Infrastruct. Syst. 2018, 24, 04018005. [Google Scholar] [CrossRef]
Figure 1. Schematics of a water distribution system (red arrows represent network flow).
Water 16 00646 g001
Figure 2. Flowchart of the methodology.
Water 16 00646 g002
Figure 3. Hanoi water distribution network.
Water 16 00646 g003
Figure 4. Zonal identification process step in the Hanoi water distribution network—(a): Elbow method analysis; (b): K-means clustering results.
Water 16 00646 g004
Figure 5. Graph visualizations of pipe and junction Sensitivity Indices in the Hanoi water distribution system—(a): pipes’ sensitivity analysis; (b): junctions’ sensitivity analysis.
Water 16 00646 g005
Figure 6. Graph visualization of pipes’ Sensitivity Index: (a) Balerma; (b) ZJ; (c) FossPoly 1 1; (d) L-Town (square is a reservoir).
Water 16 00646 g006
Figure 7. The impact of pipes’ parameters on water distribution systems’ performance.
Water 16 00646 g007
Figure 8. Graph visualization of junctions’ Sensitivity Index: (a) Balerma; (b) ZJ; (c) FossPoly 1; (d) L-Town.
Water 16 00646 g008
Figure 9. The impact of junctions’ parameters on water distribution systems’ performance.
Water 16 00646 g009
Figure 10. Kernel density estimate plot showing the correlation between the nodes’ Sensitivity Index and normalized leakage frequency.
Water 16 00646 g010
Table 1. The statistics of WDSs used in our experiments.
Balerma [52]ZJ [53]FossPoly 1 [54]L-Town [55]
Number of Junctions44311336782
Number of Pipes45416458905
Number of Reservoirs4112
Number of Loops85122125
Length100.26 km126.43 km8.40 km43.21 km
Disclaimer/Publisher’s Note: The statements, opinions and data contained in all publications are solely those of the individual author(s) and contributor(s) and not of MDPI and/or the editor(s). MDPI and/or the editor(s) disclaim responsibility for any injury to people or property resulting from any ideas, methods, instructions or products referred to in the content.

