Abstract
Addressing the inadequacy of theoretical frameworks and evaluation indicators for assessing the health of seasonal rivers in arid and semi-arid regions, this study aims to enrich the theoretical foundation for the management and ecological restoration of seasonal river systems. By selecting seven indicators from three aspects: hydrology, habitat, and social services, a seasonal river health assessment indicator system was constructed for the Tabu River basin. The weights of the indicators were determined using the analytic hierarchy process and entropy weight method, and a classification standard for seasonal river health was established. The health status of the Tabu River in 2021 was evaluated accordingly. The results revealed that the upstream, midstream, and downstream reaches of the Tabu River were categorized as healthy, sub-healthy, and diseased, respectively, with poor hydrological conditions being the primary concern. The satisfaction level of ecological flow within the basin was low, accompanied by deep groundwater levels and water scarcity issues, aligning with the actual situation. This indicator system effectively reflects the true state of seasonal river ecosystems. Based on the evaluation results, measures such as establishing ecological water storage projects and adjusting agricultural planting structures were proposed to alleviate the impacts caused by water scarcity. Additionally, implementing river and lake management systems, water resource protection measures, and water-saving technologies can directly regulate the pressures imposed on rivers by human socio-economic activities, thus alleviating regional water resource shortages and promoting the health of rivers and regional water resources. These findings provide scientific decision-making support for the management of seasonal river basins and the maintenance of river health.
1. Introduction
Rivers are the primary channels for material cycling and energy transfer on Earth, and their health has significant impacts on human health and socio-economic development [1,2,3]. River health refers to a state where the ecological function and biodiversity of the river are not impaired, and it can meet the needs of human society and sustainable development expectations. The structure and function of river systems are constantly changing due to natural and human activities. If these changes exceed the negative feedback regulation capability of the river system, the health of the river will be damaged [4,5]. In recent years, influenced by climate change and human activities, the meteorological and hydrological elements of many watersheds have changed over time and space, causing problems such as fragile river ecosystems, low ecosystem quality, and reduced biodiversity [6,7,8]. Seasonal rivers are particularly affected, and with the acceleration of urbanization and industrial development, the over-extraction of groundwater has increased, causing different levels of damage to many rivers and posing critical constraints on water resources and sustainable development [9,10]. The increasingly fragile river ecological environment has seriously constrained the sustainable development of water resources and water environment, becoming a key issue that constrains human survival and social development. In this context, river health issues have begun to receive attention [11,12,13]. Therefore, how to scientifically manage rivers with the goal of maintaining river health is a key issue that urgently needs to be solved. To better understand the health status of rivers and take corresponding measures to control and protect their health, many scholars have proposed various river health assessment methods based on professional theories such as ecology, hydrology, and remote sensing [14,15,16]. These methods are generally divided into biological indicator evaluation methods and multi-indicator comprehensive evaluation methods. Biological indicators mainly include aquatic organisms such as phytoplankton, zooplankton, benthic invertebrates, and fish, which can better reflect physical, chemical, and biological effects on water health [17]. However, due to the complexity of the socio-economic natural composite ecosystem, which has diverse variable functions in space and time, it is necessary to use a multi-indicator comprehensive evaluation method to provide a more comprehensive evaluation of river ecosystems. The multi-index comprehensive evaluation index system usually includes physical form, water quality, hydrology, aquatic organisms, and riparian zone indicators. The original data of the selected indicators can be obtained through historical data analysis, field research and monitoring, remote sensing, GIS, and other means, and then evaluated through various mathematical methods such as the analytic hierarchy process, fuzzy comprehensive evaluation, data envelopment analysis, gray relational analysis, and artificial neural networks [18,19,20]. In long-term practice and as a summarization of experience, the river health assessment index system in China tends to cover five aspects: hydrology and water resources, physical form, water quality, aquatic organisms, and social service functions. The integration of social service function indicators is a unique feature and embodiment of the characteristics of Chinese rivers, which also applies to seasonal rivers. Seasonal rivers play a crucial role in providing social services, and their flood control function during the flood season is an important indicator in assessing their health. Additionally, due to the susceptibility to flood disasters during the high-water period, the flood control compliance rate of seasonal rivers serves as a significant indicator for health evaluation [21,22,23].
Currently, research on river health assessment is mostly concentrated in water-rich regions, while there is a relative lack of studies on rivers in water-deficient areas, particularly in arid and semi-arid regions. There is also a lack of universally adopted theoretical frameworks for evaluating seasonal rivers and establishing health standards. Rivers in arid and semi-arid regions tend to have smaller watershed scales, distinct seasonality, and limited water environmental capacity. They are more susceptible to the influence of precipitation [24]. Coupled with the context of water scarcity, these rivers face unique challenges such as low or even prolonged flow, heavy reliance on artificial supplementation, degradation or disappearance of aquatic ecosystems, and other issues that differ from rivers in other regions [25]. Therefore, focusing on seasonal rivers in arid and semi-arid regions, this study takes the Tabu River in the grassland area at the northern foot of the Yin Mountains as the research object. Based on practical considerations, innovative selection of evaluation indicators is conducted. Indicators including groundwater level, ecological flow satisfaction, vegetation coverage, longitudinal connectivity index, bank stability, flood control compliance rate, and water resource development and utilization rate are incorporated to construct an evaluation index system specifically for seasonal rivers in arid and semi-arid regions. The analytical hierarchy process and entropy method are utilized to determine the weights of these indicators. River health assessment is then carried out, followed by analysis and recommendations, aiming to provide scientific basis for river management and ecological restoration of seasonal rivers in arid and semi-arid regions.
2. Materials and Methods
2.1. Study Region
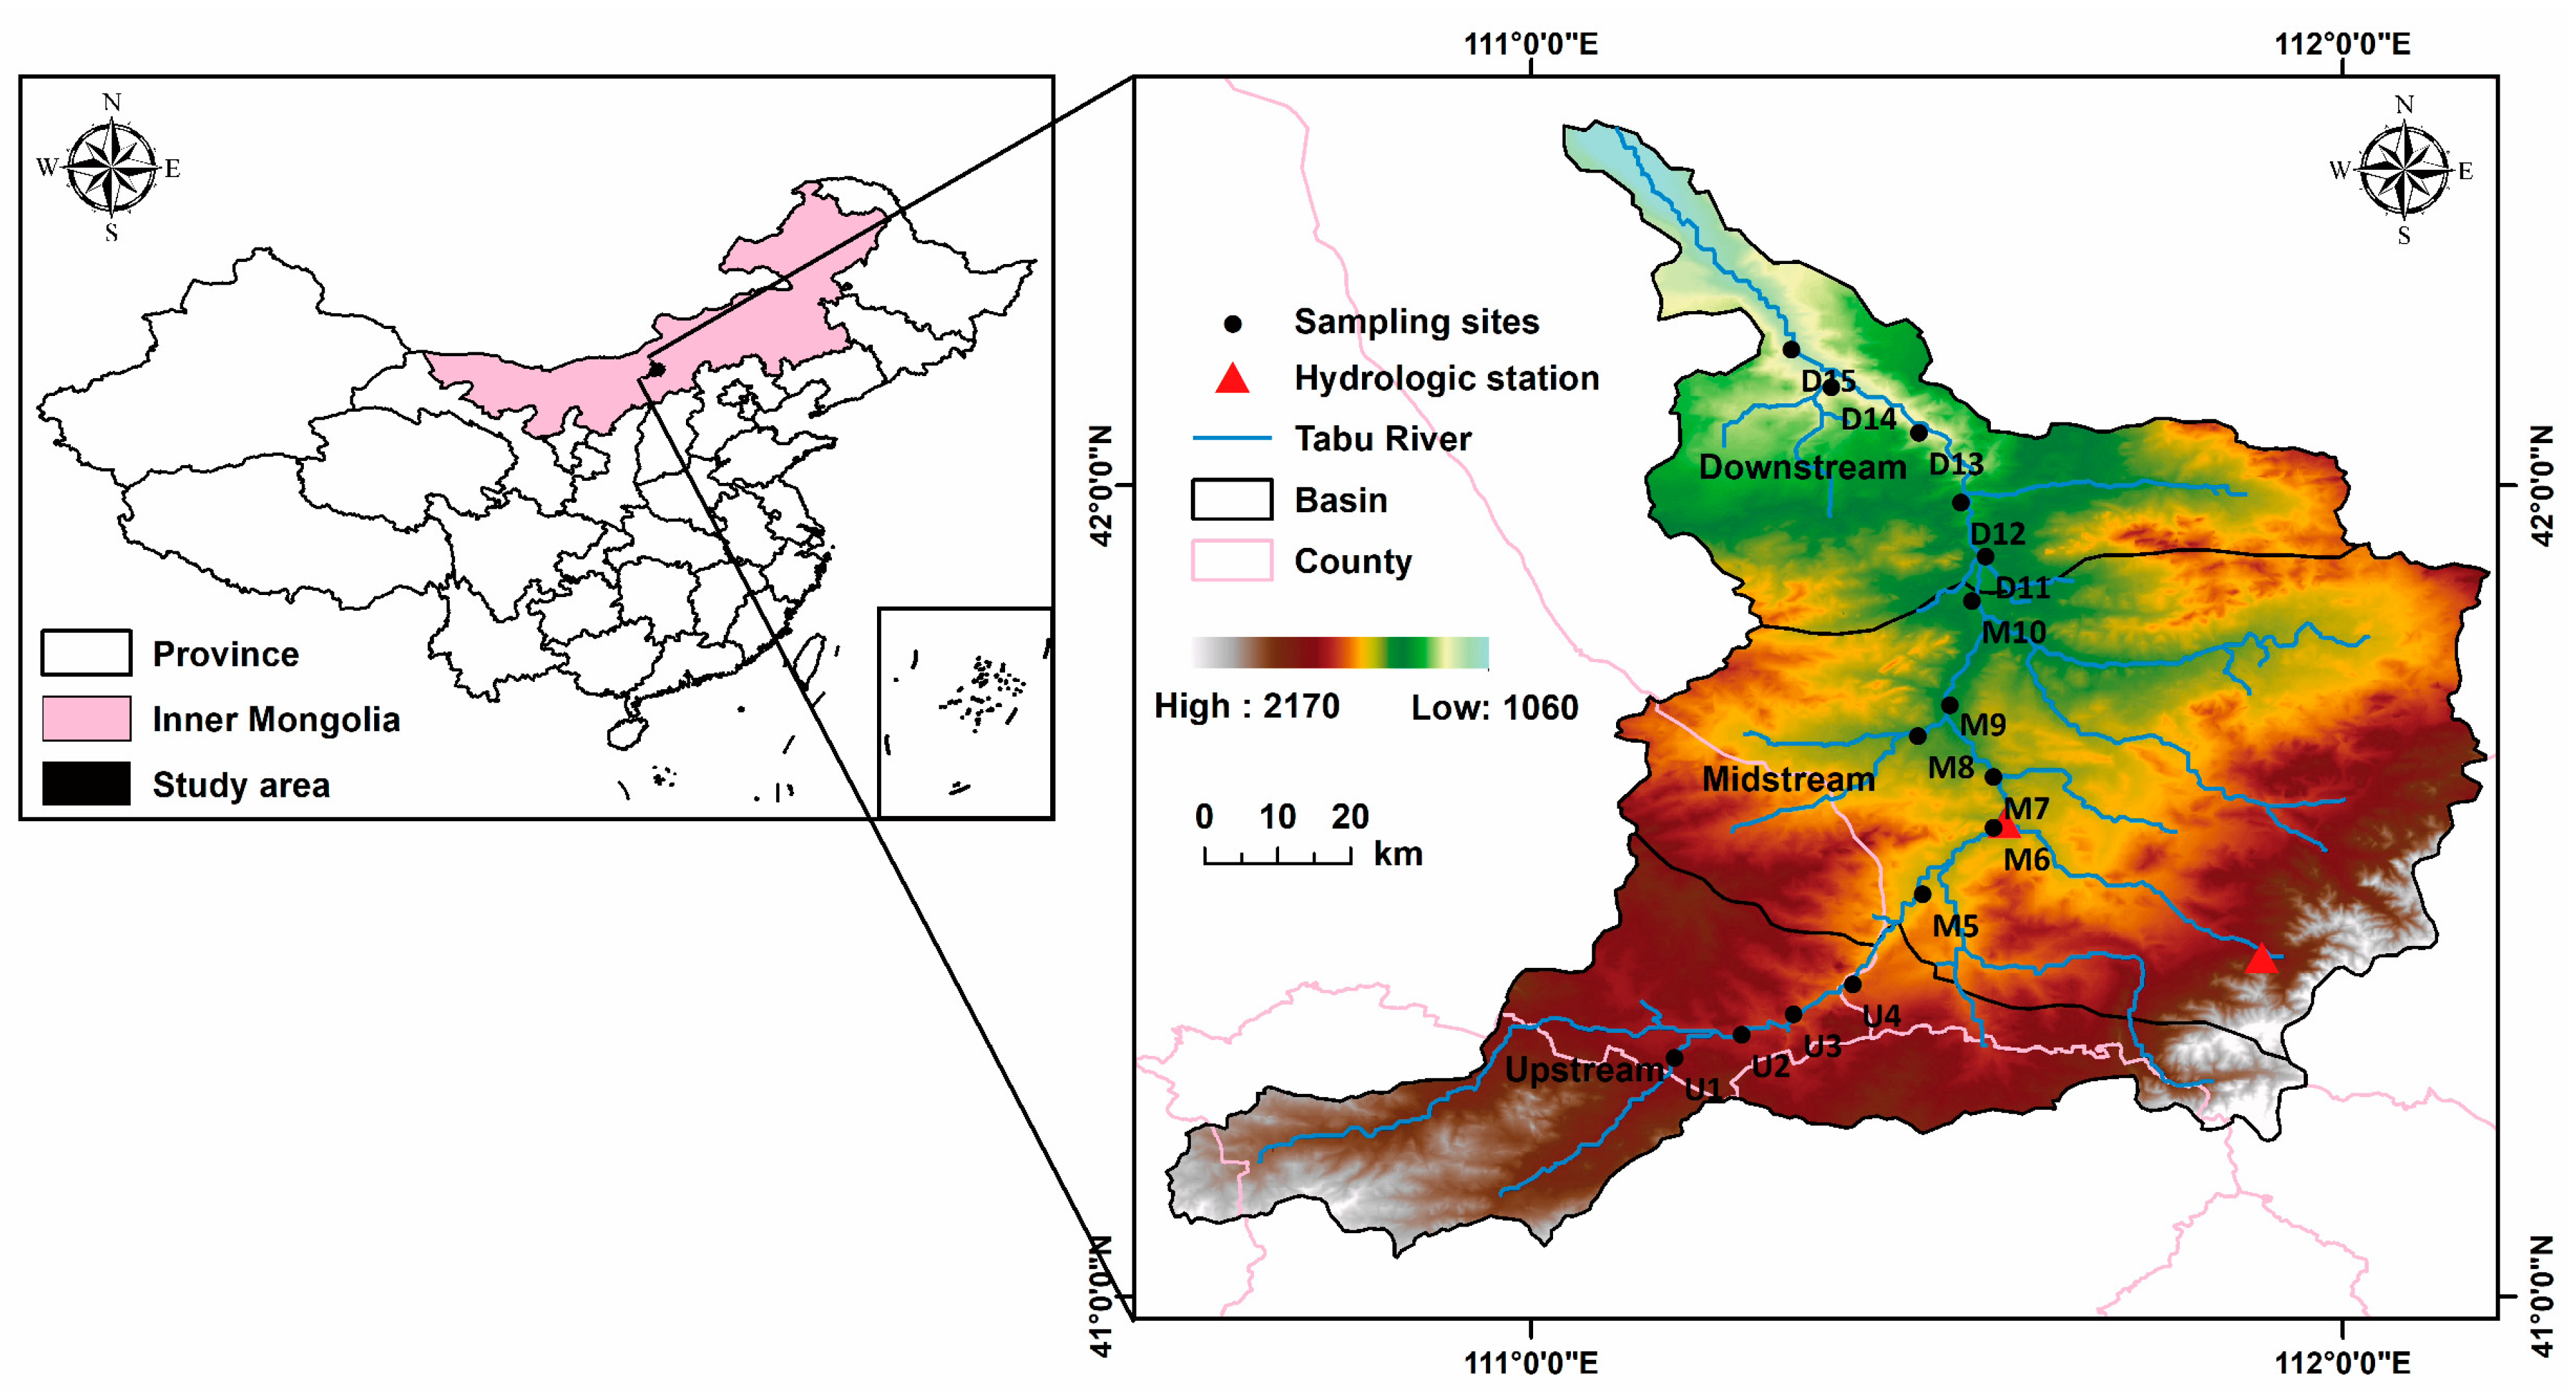
The Tabu River is located in the central part of Inner Mongolia Autonomous Region, with a length of approximately 323.2 km, a sinuosity coefficient of 1.64, an average slope of 1/331, and a total basin area of about 11,191 km2. The geographical coordinates of the Tabu River basin are between 110°34′ to 112°11′ east longitude and 41°02′ to 42°23′ north latitude, with elevations ranging from 1060 to 2170 m. It originates from the southwest peak of Dannan Gou in Damiao Township, Guyang County, Baotou City, slopes northeastward, flows through the northern part of Wuchuan County, the southern part of Darhan Mumingan Joint Banner, and then longitudinally through Siziwang Banner farming and pastoral area from south to north before flowing into the Honggeer Reservoir. Approximately 60 km upstream of the reservoir lies the Xichanghan Camp Hydrological Station, with a controlled area of 2975 km2. The Tabu River basin experiences scarce precipitation, leading to underdeveloped river networks and low river network density. With numerous tributaries, the Tabu River belongs to the category of precipitation-supplied rivers, with 70% of the total precipitation occurring between June and September, resulting in predominantly seasonal rivers within the basin. Situated at the northern foothills of the Daqing Mountains, the Tabu River basin features complex terrain, comprising predominantly high plains in the north and hilly terrain in the south. The predominant soil type in the Tabu River basin is chestnut calcareous soil. The soils on both sides of the river mainly consist of shallow yellow and grayish-white semi-cemented sand and gravel, overlain by sandy loam and clayey sand soil. Due to the vast distribution area of the Tabu River basin, it exhibits a diverse range of plant species, generally characterized by cold and drought resistance. Located in the transition zone between desert grasslands and typical grasslands, the zonal vegetation includes Stipa krylovii and Stipa breviflora, while other widespread species include Stipa klemenzii, Leymus chinensis, Artemisia frigid, Cleistogenes squarrosa, Agropyron cristatum, and Convolvulus ammannii. In order to accurately assess the health status of the Tabu River, it is divided into three segments: the upstream reaches from the source to Shuikou Bridge, the midstream reaches from Shuikou Bridge to Honggeer, and the downstream section below Honggeer. The specific location is illustrated in Figure 1. The determination of groundwater levels is conducted in two scenarios: for areas with actual data from groundwater-monitoring wells, the data are validated by cross-referencing with local water resource reports and on-site monitoring surveys to eliminate significantly abnormal values. The actual monitoring results are then utilized. In regions without direct measurement data, the Kriging spatial interpolation method is employed for determination.

Figure 1.
Study area.
2.2. Construction of Indicator System and Determination of Weights
2.2.1. Construction of Indicator System
The indicator system for river health assessment should adhere to the principles of systematicity, comprehensiveness, and operability. Based on the ecological environment and social characteristics of seasonal rivers in water-deficient areas, including terrain, climate, socio-economic factors, and human activities, we conducted indicator selection by referring to relevant documents, standards, and technical guidelines for river health assessment issued by the management department [26,27]. Through on-site inspections, expert interviews, and extensive collection of literature related to rivers, river health, aquatic ecosystem health, and river health assessment, appropriate adjustments were made to the constructed indicator system [28,29,30,31]. Finally, we structured the river health assessment into a hierarchical system consisting of the target layer, the criterion layer, and the indicator layer. The target layer is “river health”, with hydrology, habitat, and social services selected as the criterion layer, determining 7 indicators suitable for the assessment of seasonal river health. The evaluation indicator system is shown in Table 1.

Table 1.
Health evaluation index system for the Tabu River.
- (1)
- Hydrology
The Tabu River is a seasonal river primarily replenished by precipitation. Due to the uneven distribution of rainfall throughout the year, intermittent runoff is easily formed. Precipitation is mainly concentrated in July and August, with frequent heavy rainfalls during this period leading to rapid river rises and triggering floods. In contrast, spring is characterized by low rainfall, often experiencing drought conditions. Considering the instability of surface runoff in seasonal rivers and the frequent transformation between surface and sub-surface flows, indicators C11 (groundwater depth) and C12 (ecological flow satisfaction) were selected to characterize the hydrological health status of the Tabu River.
- (2)
- Habitat
In the Tabu River basin, the ecological base flow is difficult to maintain, and during the non-rainy season, it often dries up, leading to the absence of aquatic organisms. Therefore, traditional research methods focusing on fish, benthic animals, planktonic animals, and phytoplankton are evidently unsuitable. However, vegetation coverage in the basin tends to remain stable, making the use of indicator C21 (vegetation coverage) appropriate for assessing its health. Indicator C22 (river longitudinal connectivity) represents the fundamental and crucial characteristic of river ecosystems, reflecting the degree of impediment along the water flow direction. Artificial structures significantly reduce the longitudinal connectivity of rivers, not only obstructing fish migration pathways and fragmenting habitats but also altering the original hydrological patterns and ecological hydrological patterns. This, in turn, affects the flow of matter, energy, and information in rivers, further exerting a considerable impact on biota. Hence, the assessment of river longitudinal connectivity becomes particularly important. Indicator C23 (riverbank stability) encompasses two aspects: shoreline stability and shoreline ecology. Shoreline stability focuses on erosion and soil erosion along river and lake banks, while shoreline ecology examines the ecological conditions of river and lake shorelines. Field surveys and remote sensing image interpretation are conducted to comprehensively evaluate these aspects.
- (3)
- Social services
River social service functions encompass a wide range of aspects. As the Tabu River is a seasonal river prone to flooding during the rainy season, this study selects indicator C31 (flood control compliance rate) to characterize the status of the river’s social service functions. The flood control compliance rate (C31) represents the proportion of river segments that meet the flood control standards to the total length of river segments. A higher flood control compliance rate indicates a healthier river in terms of its social service functions. Indicator C32 (water resource development and utilization rate) serves as an indicator of the degree of water resource development and utilization. In rivers with abundant water resources within the basin, it is possible to increase the level of human development but within certain limits.
2.2.2. Determination of Indicator Weights
Weight is a quantitative measure of the relative importance of multiple factors, expressed by a numerical value. When evaluating multiple indicators, determining the weights of each indicator is both crucial and challenging. The analytic hierarchy process (AHP) is relatively simple to operate but has high subjectivity and randomness. The entropy weight method considers the impact of actual information on evaluation results and is more in line with objective reality. In order to reduce randomness and improve scientific rigor, this paper employs the AHP and entropy weight method to calculate weights and obtains comprehensive weight values through mean value method.
- (1)
- Using the analytic hierarchy process to calculate the subjective weight (Vi), the formula is as follows.
- (a)
- Construct a contrast matrix.
- (b)
- Calculate weight vectors and perform consistency checks.
- (c)
- Calculate the combination weight vector and perform a combination consistency test. Calculate the combination weight vector of the target at the lowest level and perform a combination consistency test.
- (2)
- Using the entropy method to calculate the objective weight (Wi), select i samples and j indicators, normalize the indicators to obtain xij, calculate the weight fji of the indicators, calculate the entropy value Hi of the i-th indicator, and finally calculate the weight Wi of each indicator. The calculation formula is as follows:
Finally, the final weight Ki is obtained by means of the following method:
2.3. The Criterion of Index Scoring
Currently, there is considerable subjectivity in the evaluation criteria for river health. To increase the comparability of different evaluation results, it is necessary to standardize the quantification and rating criteria for river health evaluation indicators as much as possible. Due to differences in terrain, climate, and socio-economic development conditions, different rivers, especially seasonal rivers, have significant differences in their health evaluation targets, making it difficult to unify evaluation indicators and rating criteria. The determination of standard values and the division of health grades proposed in this paper are mainly based on the following types of documents: (1) target values summarized in basin water resource, economic, and social plans and systems [32,33,34]; (2) corresponding indicator standards from relevant classic literature [35,36,37,38]; (3) expert opinions; and (4) national standards and relevant research results [39,40]. This paper divides the evaluation indicators for seasonal rivers in arid and semi-arid areas into five levels. Based on the characteristics of the basin’s ecological environment and evaluation indicators, the river’s original state is set as the ideal state using the key threshold method. Human interference and social demand factors are then introduced into the evaluation process. The undisturbed native state is assigned 100 points, and the minimum value of historical disturbance, acceptable minimum value, serious threat value, and complete destruction value are assigned 80, 60, 30, and 0 points, respectively. For some indicators where it is difficult to determine the undisturbed or natural state, existing standards and regulations are used as rating criteria, such as longitudinal connectivity index and natural condition of the shoreline. Finally, Table 2 shows the Tabu River’s health evaluation indicator rating criteria. The comprehensive health score of the river is evaluated based on the comprehensive health score calculated through 7 indicator elements in 3 criteria layers of the indicator evaluation system. The evaluation standard levels are shown in Table 3.
Table 2.
Scoring criteria for health evaluation indicators of the Tabu River.
Table 3.
Classification of River Health Assessment Levels.
3. Results
3.1. Weights of Health Evaluation Indicators for the Tabu River
According to the analytic hierarchy process (AHP) and entropy method, the weight values of each indicator for the two methods were calculated, followed by the calculation of the comprehensive weights. The results are shown in Table 4. The comprehensive weight values for hydrology, habitat, and social services in the criteria layer are 0.3884, 0.3992, and 0.2124, respectively. The range of values for indicators in the indicator layer is between 0.0825 and 0.2476. Among these, the indicators for groundwater depth (C11) and vegetation coverage (C21) have higher weights, while the indicators for riverbank stability (C23) and flood control compliance rate (C31) have lower weights.
Table 4.
Weights of Health Assessment Indicators for the Tabu River.
3.2. Analysis of River Health Assessment
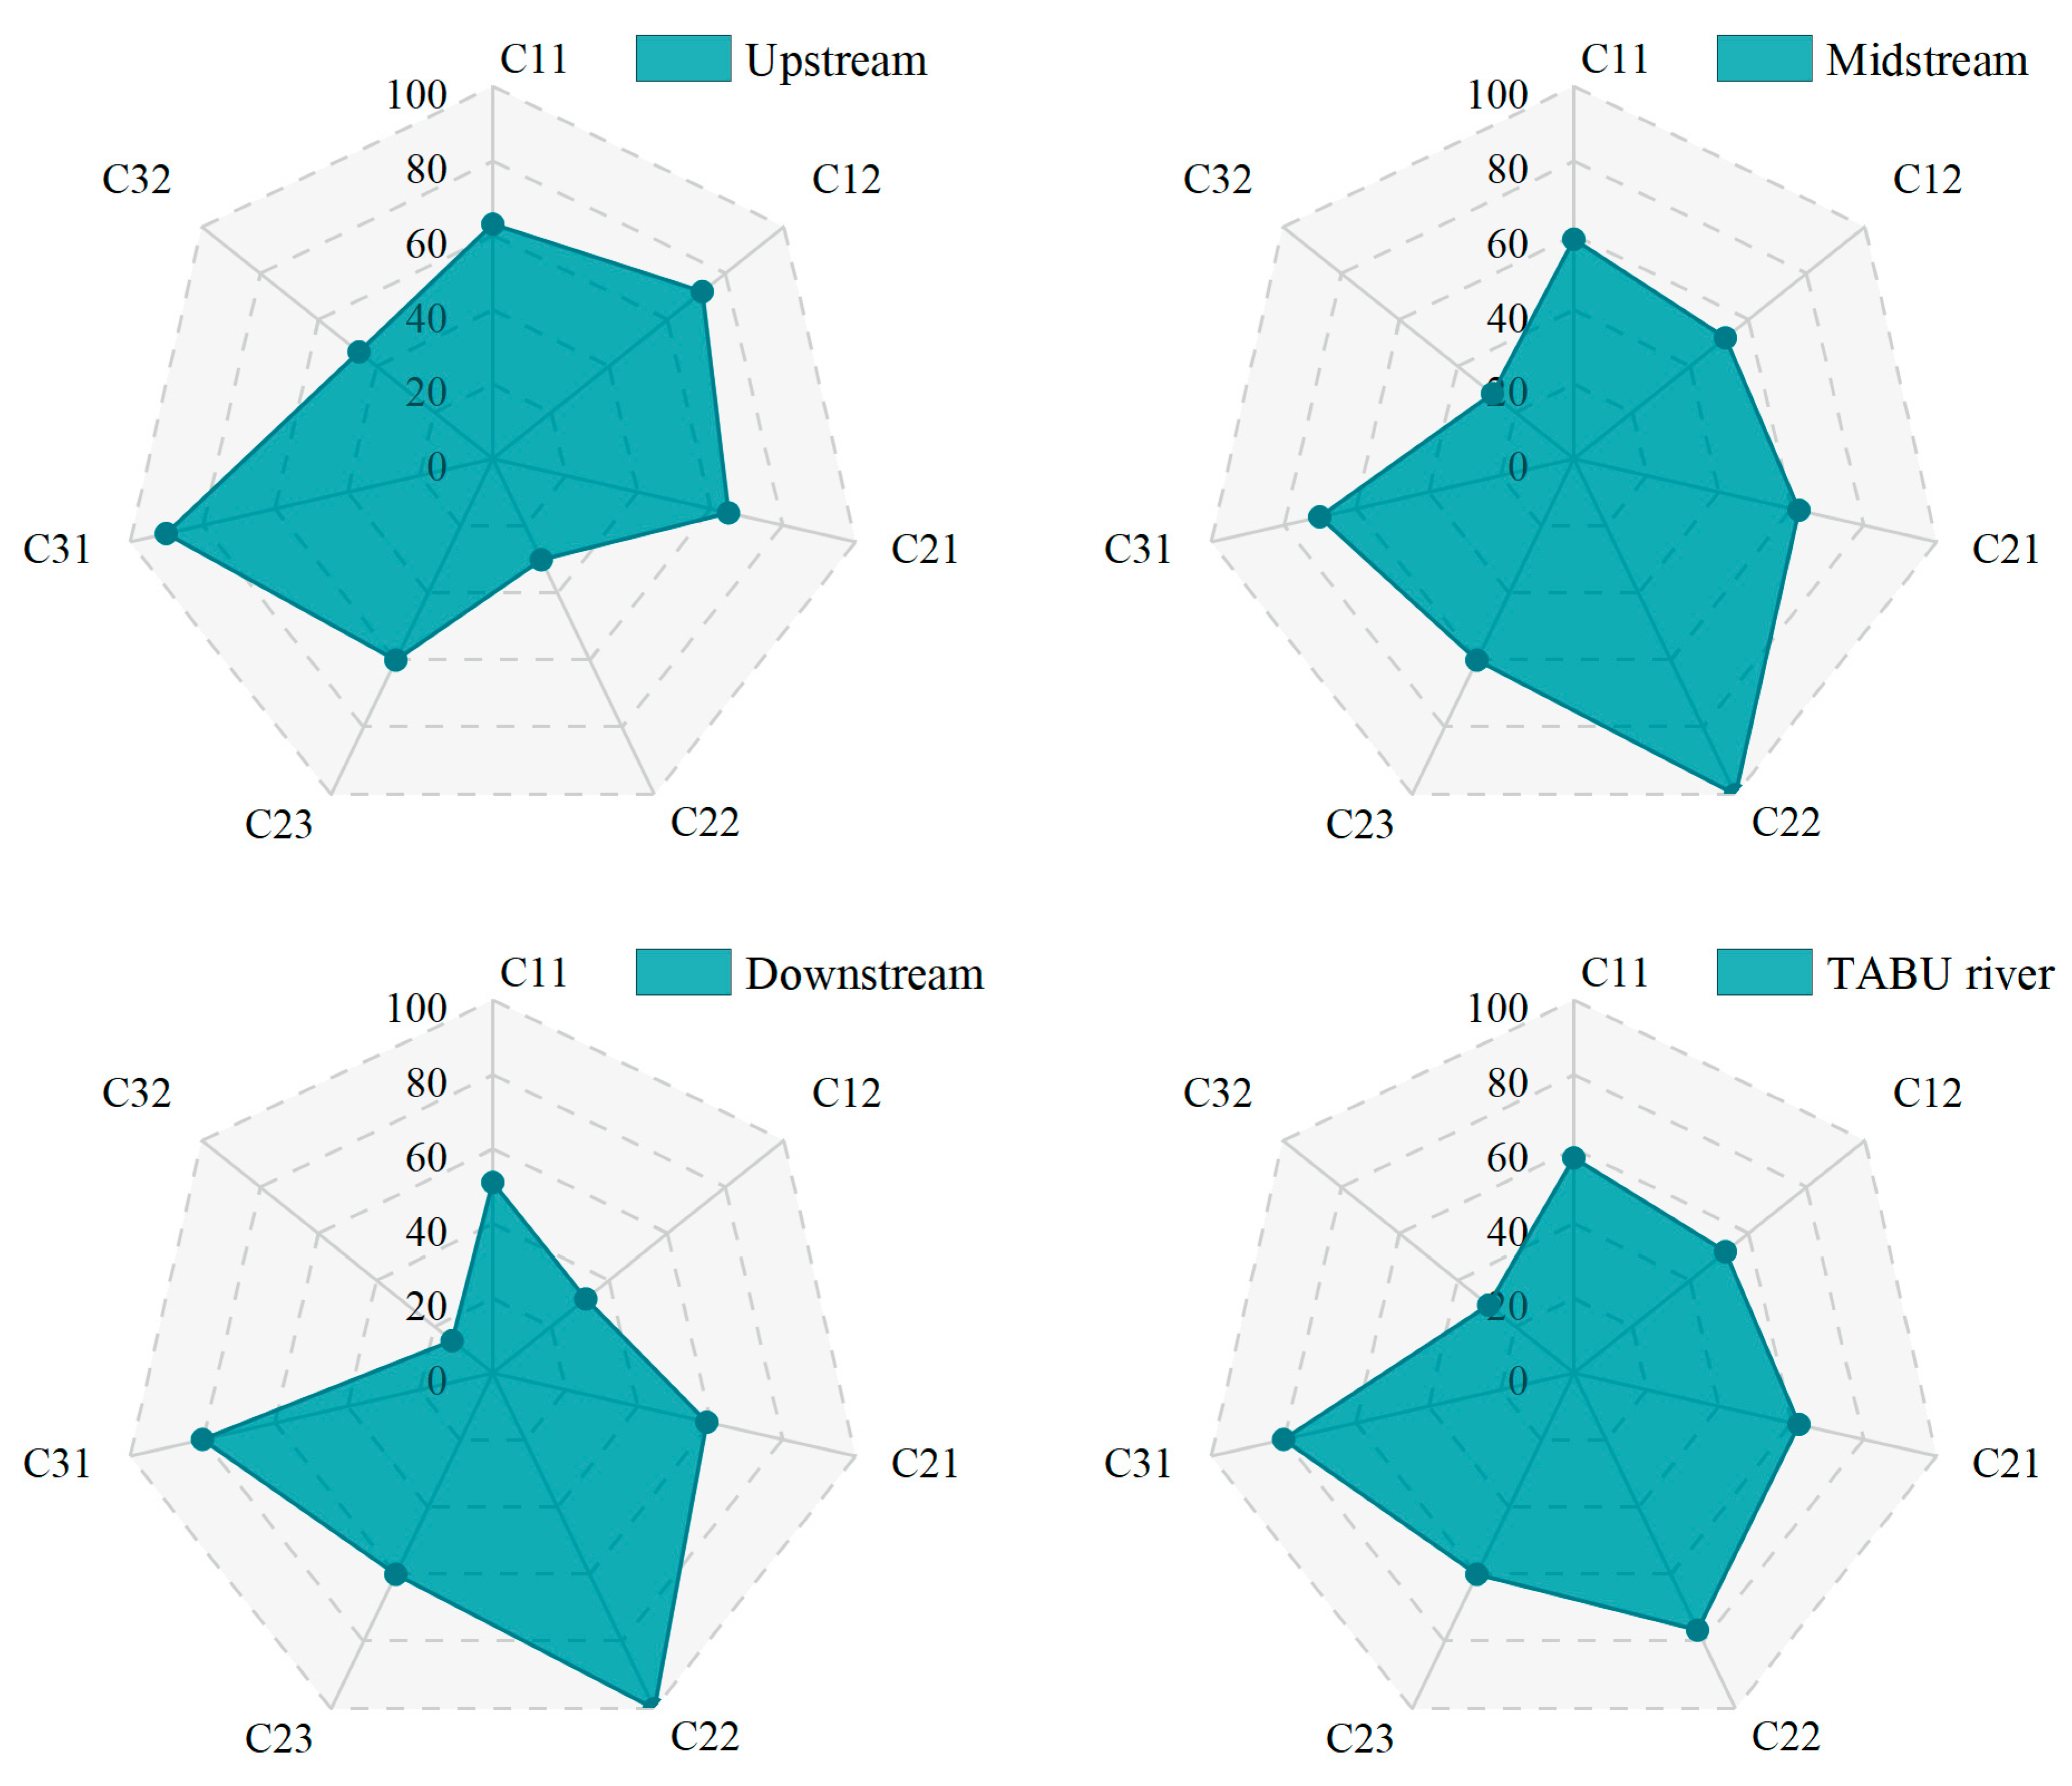
According to the basic data and comprehensive weights of various indicators in the Tabu River basin compiled through investigation, the values and assignments of various indicators in hydrology, habitat, and social services in different sections of the Tabu River are shown in Table 5 and Figure 2. Overall, the health status of the upper reaches of the river is significantly better than that of the middle and lower reaches. Except for C22 and C32, all other indicators in the upper reaches are assigned values above 60 points, and only C22 has a lower score than those of the middle and lower reaches, while all other indicators have scores higher or equal to those of the middle and lower reaches. In the middle reaches, C11, C12, and C32 did not reach 60 points, while the other indicators were assigned values greater than or equal to 60 points. The C32 score was relatively low, at 28.14 points. Except for C22 and C31, all downstream indicators are assigned values below 60 points. Overall, the C32 scores of the three river sections are relatively low, all below 60 points. The C22 scores in the middle and lower reaches are all 100 points, while in the upper reaches they are only 30 points.
Table 5.
The result of health assessment for Tabu River.
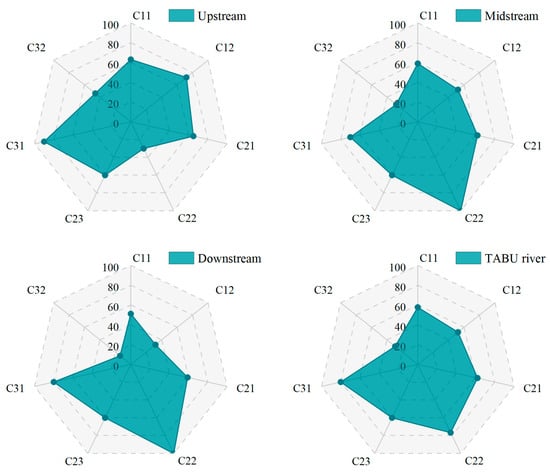
Figure 2.
Score of various indicators in the upper, middle, and lower reaches of the Tabu River and overall.
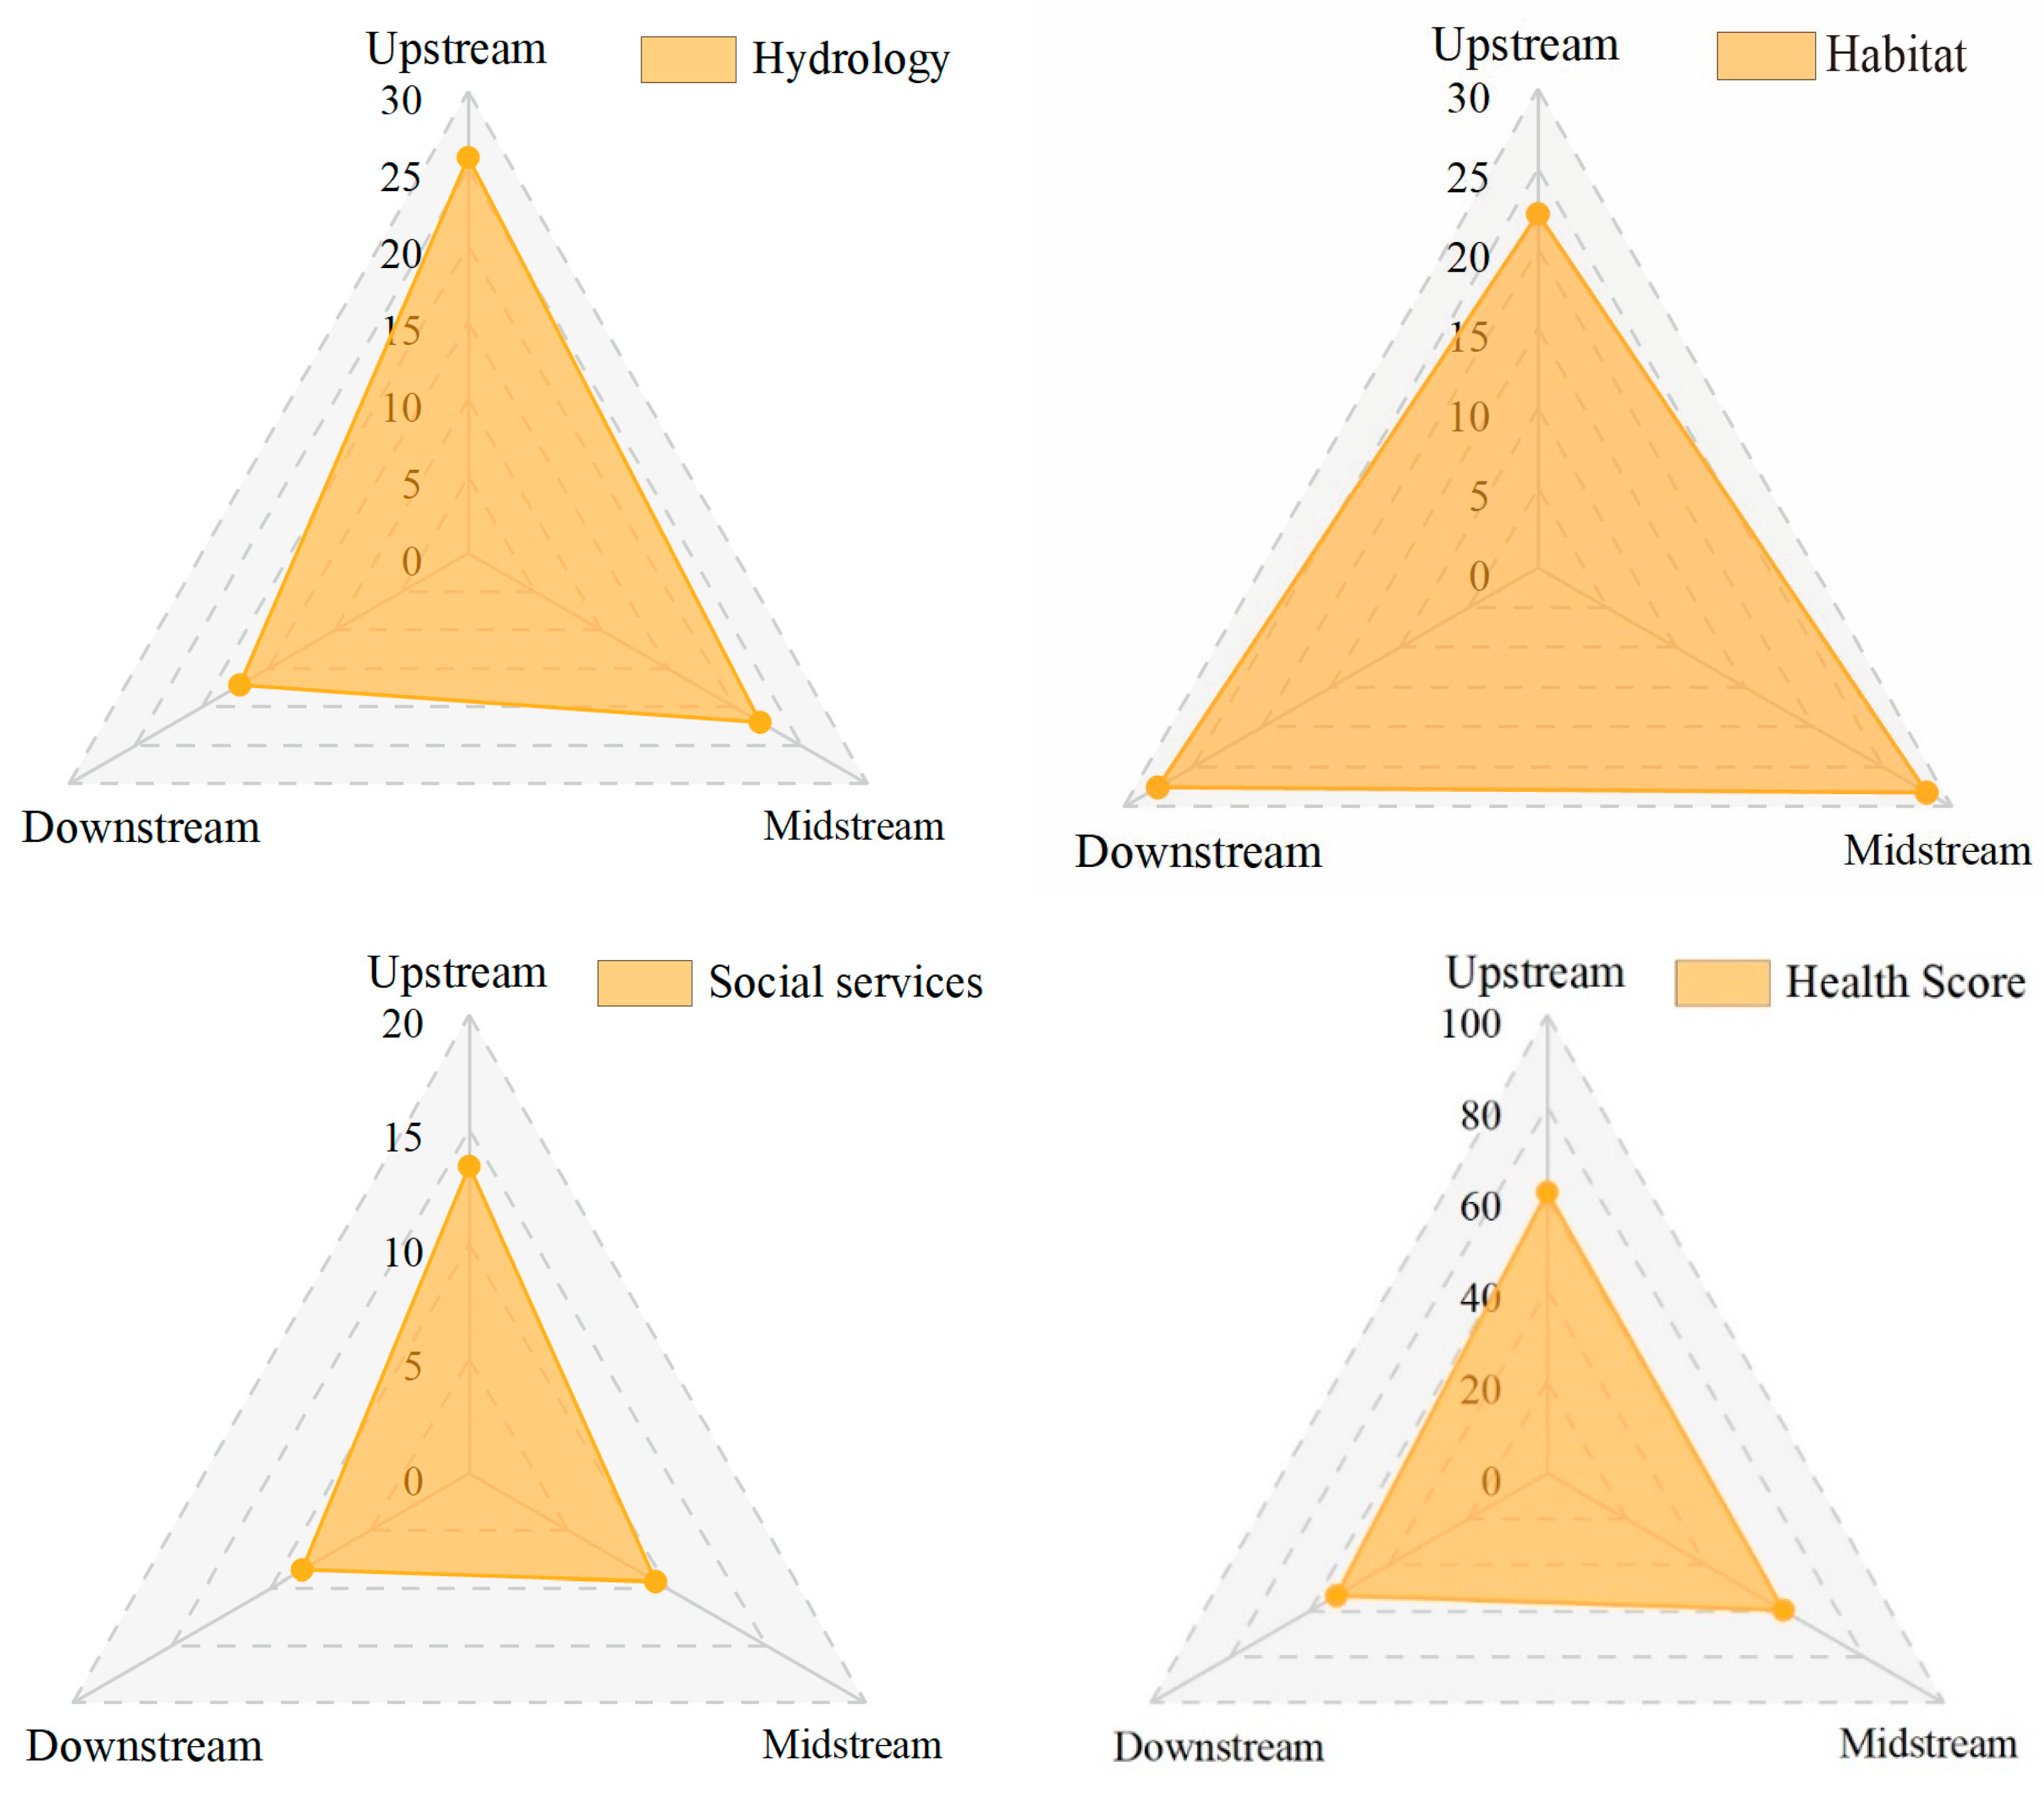
The scores of each criterion layer are shown in Figure 3. In terms of hydrological indicators, the groundwater depth index C11 shows relatively small variations between the upstream, midstream, and downstream areas, with respective values of 8.8 m, 10.2 m, and 15.5 m and scores of 63.12, 59.04, and 51.21. The ecological flow satisfaction index C12 exhibits higher values in the upstream (15.4%) with a score of 71.89, lower values in the midstream (8.7%) with a score of 52.01, and the lowest values in the downstream (5.3%) with a score of 31.88.

Figure 3.
Scores of each criterion layer.
From the habitat indicator perspective, the vegetation coverage index C21 demonstrates relatively similar values across the upstream, midstream, and downstream areas, with the highest values in the upstream (75.2%), followed by the midstream (71.1%) and downstream (68.9%), and corresponding scores of 65.1, 61.98, and 59.03. In the upstream, there is one water engineering structure affecting fish, resulting in a longitudinal connectivity index C22 score of 30, while no such structures are present in the midstream and downstream, yielding scores of 100. The stability index of riverbanks (C23) is 60 across all regions, indicating signs of erosion but no deformation or damage.
Regarding social service function indicators, the upstream area performs well, followed by the midstream, and the downstream area fares the worst. The flood control compliance rate index C31 demonstrates similar values across the upstream (97.5%), midstream (92.5%), and downstream (95%), resulting in scores of 90, 70, and 80, respectively. In the Tabu River basin, human activities are frequent, leading to significant groundwater extraction and high utilization rates, reflected in the low values of the water resource utilization rate index C32, with respective scores of 46.04, 28.14, and 14.11 for the upstream, midstream, and downstream areas.
4. Discussion
China, with its vast territory, exhibits diverse natural and socio-economic backgrounds across different river basins, making it crucial to develop a tailored river health assessment system [41]. As the Tabu River is a seasonal river in arid to semi-arid regions, it is unreasonable to adopt the evaluation indicators and standards designed for perennial rivers. In contrast to previous studies, this paper incorporates regional characteristics in the selection of indicators [42,43,44]. Due to the limited availability of comprehensive hydrological, water quality, and ecological monitoring data in the Tabu River, it is challenging to obtain relevant indicators through conventional monitoring methods, which restricts the choice of indicators. Therefore, simplified hydrological indicators, including ecological flow satisfaction and groundwater levels, were selected to characterize the hydrological conditions. For habitat indicators, plant-related indicators suitable for the Tabu River were chosen. Given the concentrated precipitation and overall water scarcity in the Tabu River basin, the river channel is not easily maintained, resulting in a dry state during non-rainy seasons and fewer aquatic organisms. Consequently, traditional indicators based on benthic invertebrates and fish are not applicable in this study. Instead, vegetation coverage was used as an indicator to reflect habitat conditions. Overall, this paper presents innovative choices in indicator selection, making the assessment system more suitable for evaluating seasonal rivers in arid to semi-arid regions.
From the evaluation results, it can be observed that the hydrological condition of the Tabu River basin is poor, with only the upper reaches scoring above 60, while the middle and lower reaches have scores below 60. This phenomenon can be attributed to the fact that the Tabu River is located in a typical arid to semi-arid region and is influenced by climate change and human activities [45]. As a seasonal river, the unstable water supply is the primary factor contributing to the poor hydrological conditions. Relying mainly on precipitation, the Tabu River experiences uneven distribution of rainfall, with the majority occurring in July and August, while the rest of the year experiences scarce precipitation, leading to flow interruptions in the middle and lower reaches. This is a common characteristic of seasonal rivers in arid to semi-arid regions, as supported by similar findings in other studies [46,47,48]. The assessment of the Tabu River’s health reveals an overall better condition in the upstream compared to the downstream. Zhang’s research indicates that from 1986 to 2022, the average temperature in the Tabu River basin rose, while the annual precipitation shows a decreasing trend. Due to the distribution of precipitation, the ecological quality of the Tabu River basin follows the same pattern, with the upstream being superior to the downstream, although no significant degradation trend is observed. This study covers the period of 2020–2021, and currently, the health condition of the Tabu River basin remains poor, which aligns with the aforementioned research results [49]. Furthermore, regarding habitat indicators, vegetation coverage decreases from the upstream to the downstream. Liao’s research demonstrates that from 2000 to 2020, the contribution rate of precipitation to the changes in water production in the Tabu River basin is 82%. Precipitation plays a dominant role, and changes in water production have a significant impact on grassland area. Thus, the current poor vegetation coverage in the Tabu River basin is closely related to decreased precipitation [50].
Therefore, improving the hydrological conditions is crucial for enhancing the health status of the Tabu River. The river remains dry during the non-rainy season due to intense evaporation and long-term groundwater scarcity, resulting in rapid shrinkage, or even complete drying up of the river channel. This situation offers insights into improving the hydrological conditions of seasonal rivers. By implementing appropriate water retention measures, the river channel can retain a portion of rainfall to sustain its own ecosystem. Establishing an “underground ecological water bank” can store water underground during periods of abundant rainfall, guaranteeing meeting ecological water demands during dry periods, providing a stable water source for vegetation growth, and enhancing habitat quality. Maintaining and restoring groundwater levels is a key approach to protect and restore riparian vegetation in arid regions. Additionally, adjusting agricultural planting patterns to reduce water utilization can alleviate the negative impacts resulting from water scarcity in the Tabu River. For instance, in areas with excessive agricultural irrigation, it is advisable to consider the seasonal availability of water and scientifically plan crop production based on different crop water requirements, balancing land use scale and the exploitable groundwater volume. It may be necessary to reduce the cultivation of crops that require significant groundwater extraction and explore alternatives with lower water requirements to mitigate groundwater exploitation.
In addition to specific engineering measures, the implementation of river basin management, water resource protection, water-saving technology applications, and adjustments in water usage structure are crucial technical and policy measures that can directly alleviate the pressure on rivers and mitigate regional water resource stress, thereby promoting the health of rivers and regional water resources.
5. Conclusions
This study focuses on the health assessment of seasonal rivers in arid and semi-arid regions, addressing the limitation of existing assessment indicators that are not applicable to seasonal rivers. To tackle these challenges, a river health assessment indicator system is proposed based on the health status of seasonal rivers in arid and semi-arid regions, aiming to provide valuable references for such assessments through theoretical and practical case studies.
Taking the Tabu River as the research subject, an evaluation of its health status was conducted by constructing a seasonal river health assessment indicator system, revealing the health condition of the Tabu River in 2021. The results indicate that the upper, middle, and lower reaches of the Tabu River are in healthy, sub-healthy, and diseased states, with poor hydrological conditions being the primary issue in the current Tabu River basin. The low ecological flow satisfaction and deep groundwater levels reflect the water scarcity issue within the basin. Therefore, ecological restoration in the Tabu River basin should prioritize water resource protection and efficient utilization. It is recommended to implement appropriate water retention measures to store water during high-flow periods, ensuring ecological water storage during low-flow periods to meet the ecological water demands within the basin. Additionally, adjusting agricultural production and planting structures can improve water resource efficiency and alleviate the pressure caused by water scarcity.
Given the numerous factors influencing river health, this study had a limited number of indicators and covered a large research area, indicating the need for further validation of the research findings. It is suggested that future work should focus on increasing data collection on species communities, soil salinization, desertification, and other basic parameters to reveal the impact mechanisms of various factors on river ecological health. This will provide a theoretical basis for the health assessment and ecological management of seasonal rivers in arid and semi-arid regions.
Author Contributions
Conceptualization, Q.Q. and Z.Z.; data interpretation and methodology, H.Y.; validation, Z.W. and Z.Z.; software, F.W.; original draft preparation, Z.W.; funding acquisition, Q.Q. and H.Y. All authors have read and agreed to the published version of the manuscript.
Funding
This research was supported by the Yinshanbeilu Grassland Eco-hydrology National Observation and Research Station, China Institute of Water Resources and Hydropower Research (grant numbers YS2022020, YSS202118, YSS202101, and YSS202112).
Data Availability Statement
Data is contained within the article.
Conflicts of Interest
The authors declare no conflicts of interest.
References
- Wei, H.; Han, Q.; Yang, Y.; Li, L.; Liu, M. Spatial Heterogeneity of Watershed Ecosystem Health and Identification of Its Influencing Factors in a Mountain–Hill–Plain Region, Henan Province, China. Remote Sens. 2023, 15, 3751. [Google Scholar] [CrossRef]
- Hu, X.; Zuo, D.; Xu, Z.; Huang, Z.; Liu, B.; Han, Y.; Bi, Y. Response of macroinvertebrate community to water quality factors and aquatic ecosystem health assessment in a typical river in Beijing, China. Environ. Res. 2022, 212, 113474. [Google Scholar] [CrossRef] [PubMed]
- Cao, J.; Liang, H.; Zhang, Y.; Du, S.; Zhang, J.; Tao, Y. Development and Evaluation of the Plankton Biological Integrity Index (P-IBI) in Dry and Wet Seasons for Dianchi Lake. Ecologies 2024, 5, 68–82. [Google Scholar] [CrossRef]
- Cui, Z.; Fan, W.; Chen, C.; Mo, K.; Chen, Q.; Zhang, Q.; He, R. Ecosystem health evaluation of urban rivers based on multitrophic aquatic organisms. J. Environ. Manag. 2024, 349, 119476. [Google Scholar] [CrossRef] [PubMed]
- Wan, X.; Yang, T.; Zhang, Q.; Yan, X.; Hu, C.; Sun, L.; Zheng, Y. A novel comprehensive model of set pair analysis with extenics for river health evaluation and prediction of semi-arid basin—A case study of Wei River Basin, China. Sci. Total Environ. 2021, 775, 145845. [Google Scholar] [CrossRef] [PubMed]
- Han, H.; Li, X.; Gu, X.; Li, G. Urban rivers health assessment based on the concept of resilience using improved FCM-EWM-MABAC model. Ecol. Indic. 2023, 154, 110833. [Google Scholar] [CrossRef]
- Zhang, Z.; Li, Y.; Wang, X.; Li, H.; Zheng, F.; Liao, Y.; Tang, N.; Chen, G.; Yang, C. Assessment of river health based on a novel multidimensional similarity cloud model in the Lhasa River, Qinghai-Tibet Plateau. J. Hydrol. 2021, 603, 127100. [Google Scholar] [CrossRef]
- Ma, D.; Luo, W.; Yang, G.; Lu, J.; Fan, Y. A study on a river health assessment method based on ecological flow. Ecol. Model. 2019, 401, 144–154. [Google Scholar] [CrossRef]
- Gkenas, C.; Vardakas, L.; Koutsikos, N. Non-Indigenous Freshwater Fishes as Indicators of Ecological Quality in Running Waters. Diversity 2024, 16, 9. [Google Scholar] [CrossRef]
- Yang, W.; Zhong, J.; Xia, Y.; Hu, Q.; Fang, C.; Cong, M.; Yao, B.; You, Q. A Comprehensive Multi-Metric Index for Health Assessment of the Poyang Lake Wetland. Remote Sens. 2023, 15, 4061. [Google Scholar] [CrossRef]
- Zhao, Y.W.; Zhou, L.Q.; Dong, B.Q.; Dai, C. Health assessment for urban rivers based on the pressure, state and response framework—A case study of the Shiwuli River. Ecol. Indic. 2019, 99, 324–331. [Google Scholar] [CrossRef]
- Das, S.; Pradhan, B.; Shit, P.K.; Alamri, A.M. Assessment of Wetland Ecosystem Health Using the Pressure–State–Response (PSR) Model: A Case Study of Mursidabad District of West Bengal (India). Sustainability 2020, 12, 5932. [Google Scholar] [CrossRef]
- Lin, L.; Wang, F.; Chen, H.; Fang, H.; Zhang, T.; Cao, W. Ecological health assessments of rivers with multiple dams based on the biological integrity of phytoplankton: A case study of North Creek of Jiulong River. Ecol. Indic. 2021, 121, 106998. [Google Scholar] [CrossRef]
- Singh, R.; Kayastha, S.P.; Pandey, V.P. Climate change and river health of the Marshyangdi Watershed, Nepal: An assessment using integrated approach. Environ. Res. 2022, 215, 114104. [Google Scholar] [CrossRef]
- Zhou, Y.; Yue, D.; Li, S.; Liang, G.; Chao, Z.; Zhao, Y.; Meng, X. Ecosystem health assessment in debris flow-prone areas: A case study of Bailong River Basin in China. J. Clean. Prod. 2022, 357, 131887. [Google Scholar] [CrossRef]
- Guimarães, L.F.; Teixeira, F.C.; Pereira, J.N.; Becker, B.R.; Oliveira, A.K.B.; Lima, A.F.; Veról, A.P.; Miguez, M.G. The challenges of urban river restoration and the proposition of a framework towards river restoration goals. J. Clean. Prod. 2021, 316, 128330. [Google Scholar] [CrossRef]
- Liu, R.; Dong, X.; Zhang, P.; Zhang, Y.; Wang, X.; Gao, Y. Study on the Sustainable Development of an Arid Basin Based on the Coupling Process of Ecosystem Health and Human Wellbeing Under Land Use Change—A Case Study in the Manas River Basin, Xinjiang, China. Sustainability 2020, 12, 1201. [Google Scholar] [CrossRef]
- Cui, L.; Wang, X.; Li, J.; Gao, X.; Zhang, J.; Liu, Z. Ecological and health risk assessments and water quality criteria of heavy metals in the Haihe River. Environ. Pollut. 2021, 290, 117971. [Google Scholar] [CrossRef] [PubMed]
- Zhang, X.; Meng, Y.; Xia, J.; Wu, B.; She, D. A combined model for river health evaluation based upon the physical, chemical, and biological elements. Ecol. Indic. 2018, 84, 416–424. [Google Scholar] [CrossRef]
- Pinto, U.; Maheshwari, B.L. River health assessment in peri-urban landscapes: An application of multivariate analysis to identify the key variables. Water Res. 2011, 45, 3915–3924. [Google Scholar] [CrossRef] [PubMed]
- Shan, C.; Dong, Z.; Lu, D.; Xu, C.; Wang, H.; Ling, Z.; Liu, Q. Study on river health assessment based on a fuzzy matter-element extension model. Ecol. Indic. 2021, 127, 107742. [Google Scholar] [CrossRef]
- An, K.-G.; Park, S.S.; Shin, J.-Y. An evaluation of a river health using the index of biological integrity along with relations to chemical and habitat conditions. Environ. Int. 2002, 28, 411–420. [Google Scholar] [CrossRef] [PubMed]
- Liu, M.; Zhang, Z.; Lin, L.; Zhao, L.; Dong, L.; Jin, H.; Zou, J.; Li, R.; He, Y. The Content Level, Spatial and Temporal Distribution Characteristics, and Health-Risk Assessment of Trace Elements in Upper Lancang River (Changdu Section). Water 2022, 14, 1115. [Google Scholar] [CrossRef]
- Jargal, N.; Kim, J.-E.; An, K.-G. New interactive functional indicator approach for river health assessment in an Asian temperate river: Comprehensive analysis of water chemistry, physical habitat, land use, and the biological disturbance of invasive alien species. Ecol. Indic. 2023, 157, 111212. [Google Scholar] [CrossRef]
- Chen, Y.; Xia, J.; Cai, W.; Sun, Z.; Dou, C. Three-Phase-Based Approach to Develop a River Health Prediction and Early Warning System to Guide River Management. Appl. Sci. 2019, 9, 4163. [Google Scholar] [CrossRef]
- Ko, N.T.; Suter, P.; Conallin, J.; Rutten, M.; Bogaard, T. The Urgent Need for River Health Biomonitoring Tools for Large Tropical Rivers in Developing Countries: Preliminary Development of a River Health Monitoring Tool for Myanmar Rivers. Water 2020, 12, 1408. [Google Scholar] [CrossRef]
- Li, J.; Chen, X.; Zhang, X.; Huang, Z.; Xiao, L.; Huang, L.; Kano, Y.; Sato, T.; Shimatani, Y.; Zhang, C. Fish Biodiversity Conservation and Restoration, Yangtze River Basin, China, Urgently Needs ‘Scientific’ and ‘Ecological’ Action. Water 2020, 12, 3043. [Google Scholar] [CrossRef]
- Anwar Sadat, M.; Guan, Y.; Zhang, D.; Shao, G.; Cheng, X.; Yang, Y. The associations between river health and water resources management lead to the assessment of river state. Ecol. Indic. 2020, 109, 105814. [Google Scholar] [CrossRef]
- Zhang, Y.; Zhou, K.; Yang, Z.; Zhang, L.; Ren, X. The definition and index system of hydro-ecological carrying capacity (HECC). J. Northwest Univ. 2019, 49, 42–53. (In Chinese) [Google Scholar]
- Geng, L.; Liu, H.; Zhong, H.; Liu, C. Indicators and criteria for evaluation of healthy rivers. J. Hydraul. Eng. 2006, 37, 253–258. (In Chinese) [Google Scholar]
- SL/Z 738-2016; Evalution Guide of Water Ecological Civilization Construction. Ministry of Water Resources of the People’s Republic of China, China Water Power Press: Beijing, China, 2016. (In Chinese)
- Rowntree, K.M.; Wadeson, R.A. A Hierarchical Geomorphological Model for the Classification of Selected South African Rivers; Water Research Commission Report, No. 497/1/99; Water Research Commission: Pretoria, South Africa, 1994. [Google Scholar]
- Water Function Division of Hebei Province. Available online: http://slt.hebei.gov.cn/a/2018/10/31/2018103137436.html (accessed on 25 July 2023).
- Measures for the Administration of Water Functional Zones. Available online: http://www.mwr.gov.cn/zwgk/gknr/201707/t20170726_1442596.html (accessed on 25 July 2023).
- Jungwirth, M.; Muhar, S.; Schmutz, S. Re-establishing and assessing ecological integrity in riverine landscapes. Freshw. Biol. 2002, 47, 867–887. [Google Scholar] [CrossRef]
- Jaiswal, D.; Pandey, J. Anthropogenically enhanced sediment oxygen demand creates mosaic of oxygen deficient zones in the Ganga River: Implications for river health. Ecotoxicol. Environ. Saf. 2019, 171, 709–720. [Google Scholar] [CrossRef]
- Llansó, R.J.; Dauer, D.M.; Vølstad, J.H. Assessing ecological integrity for impaired waters decisions in Chesapeake Bay, USA. Mar. Pollut. Bull. 2009, 59, 48–53. [Google Scholar] [CrossRef]
- Fu, B.; Liu, S.; Ma, M. Content and methods of ecosystem comprehensive assessment. Acta Ecol. Sin. 2001, 11, 1885–1892. [Google Scholar]
- Ministry of Water Resources of the People’ s Republic of China. National River Health Assessment Indicators, Standards and Methods; General Office of the Ministry of Water Resources: Beijing, China, 2010. (In Chinese)
- Vörösmarty, C.J.; McIntyre, P.B.; Gessner, M.O.; Dudgeon, D.; Prusevich, A.; Green, P.; Glidden, S.; Bunn, S.E.; Sullivan, C.A.; Liermann, C.R.; et al. Global threats to human water security and river biodiversity. Nature 2010, 467, 555–561. [Google Scholar] [CrossRef] [PubMed]
- Pan, Z.; He, J.; Liu, D.; Wang, J.; Guo, X. Ecosystem health assessment based on ecological integrity and ecosystem services demand in the Middle Reaches of the Yangtze River Economic Belt, China. Sci. Total Environ. 2021, 774, 144837. [Google Scholar] [CrossRef]
- Arman, N.Z.; Salmiati, S.; Said, M.I.M.; Aris, A. Development of macroinvertebrate-based multimetric index and establishment of biocriteria for river health assessment in Malaysia. Ecol. Indic. 2019, 104, 449–458. [Google Scholar] [CrossRef]
- Pandey, V.; Venkatnarayanan, S.; Kumar, P.S.; Ratnam, K.; Jha, D.K.; Rajaguru, S.; Dharani, G. Assessment of ecological health of Swarnamukhi river estuary, southeast coast of India, through AMBI indices and multivariate tools. Mar. Pollut. Bull. 2021, 164, 112031. [Google Scholar] [CrossRef] [PubMed]
- Kim, J.Y.; An, K.-G. Integrated Ecological River Health Assessments, Based on Water Chemistry, Physical Habitat Quality and Biological Integrity. Water 2015, 7, 6378–6403. [Google Scholar] [CrossRef]
- Zhao, X.; Huang, G. Urban watershed ecosystem health assessment and ecological management zoning based on landscape pattern and SWMM simulation: A case study of Yangmei River Basin. Environ. Impact Assess. Rev. 2022, 95, 106794. [Google Scholar] [CrossRef]
- Lu, C.; Wu, C.; Sun, Q.; Wu, X.; Yan, L.; Qin, T. Seasonal river–lake-groundwater coupling simulation and groundwater overexploitation and ecological environment assessment in the Aiding Lake Basin, NW China. J. Hydrol. 2024, 632, 130896. [Google Scholar] [CrossRef]
- Du, Y.; Bao, A.; Zhang, T.; Ding, W. Quantifying the impacts of climate change and human activities on seasonal runoff in the Yongding River basin. Ecol. Indic. 2023, 154, 110839. [Google Scholar] [CrossRef]
- Petry, I.; Fan, F.M.; Siqueira, V.A.; Collishonn, W.; de Paiva, R.C.D.; Quedi, E.; de Araújo Gama, C.H.; Silveira, R.; Freitas, C.; Paranhos, C.S.A. Seasonal streamflow forecasting in South America’s largest rivers. J. Hydrol. Reg. Stud. 2023, 49, 101487. [Google Scholar] [CrossRef]
- Zhang, H.B.; Wang, W.; Song, Y.J.; Miao, L.G. Ecological index evaluation of arid inflow area based on the modified remote sensing ecological index: A case study of Tabu River Basin at the northern foot of the Yin Mountains. Acta Ecologica Sinica. 2024, 44, 1–21. (In Chinese) [Google Scholar]
- Zhang, X.J.; Long, Y.H.; Liao, Z.L. Temporal and spatial variation of water yield in the Tabu River Basin of the Northern Yinshan Mountain. Water Sav. Irrig. 2023, 10, 98–107. (In Chinese) [Google Scholar]
Disclaimer/Publisher’s Note: The statements, opinions and data contained in all publications are solely those of the individual author(s) and contributor(s) and not of MDPI and/or the editor(s). MDPI and/or the editor(s) disclaim responsibility for any injury to people or property resulting from any ideas, methods, instructions or products referred to in the content. |
© 2024 by the authors. Licensee MDPI, Basel, Switzerland. This article is an open access article distributed under the terms and conditions of the Creative Commons Attribution (CC BY) license (https://creativecommons.org/licenses/by/4.0/).