Article

Soil Salt and Water Regulation in Saline Agriculture Based on Physical Measures with Model Analysis

1
School of Hydraulic Engineering, Ludong University, Yantai 264025, China
2
School of Resources and Environmental Engineering, Ludong University, Yantai 264025, China
*
Authors to whom correspondence should be addressed.
Water 2024, 16(5), 719; https://doi.org/10.3390/w16050719
Submission received: 1 January 2024 / Revised: 23 February 2024 / Accepted: 26 February 2024 / Published: 28 February 2024
(This article belongs to the Topic Hydrology and Water Resources Management)

Abstract

:
Enhancing crop production in the saline regions of the Yellow River Delta (YRD), where shallow saline groundwater is prevalent, hinges on optimizing water and salt conditions in the root zone. This study explored the effects of various physical methods on soil water and salt dynamics during the cotton growing season in these saline areas. Three approaches were tested: plastic film mulching (FM), plastic film mulching with an added compacted soil layer (FM+CL), and ridge-furrow planting (RF). The HYDRUS-2D model (Version 3.02) was used to analyze changes in soil water and salt content in the root zone over time. The results showed that subsoil compaction significantly lowered salt build-up in the root zone, especially in the top 20 cm. Film mulching was crucial for reducing water loss in the Yellow River Delta. Crop transpiration increased by 7.0% under FM and 10.5% under FM+CL compared to RF planting. Additionally, FM+CL reduced soil salinity in the top 10 cm by 11.5% at cotton harvest time compared to FM alone. The study concludes that combining film mulching with a soil compaction layer is a promising strategy for local farmers, addressing soil water retention, salt management, and boosting cotton yields.

1. Introduction

The sustainability of ensuring food supply faces challenges from many adverse factors, such as the intensification of climate change, the degradation of existing arable land, and the increasing unpredictability of international situations [1,2,3]. In China, approximately 9% of the world’s arable land and 6% of freshwater resources sustain nearly one-fifth of the world’s population [4]. Maximizing the cultivation potential of existing water and soil resources and developing and utilizing various reserve arable land resources and unconventional water sources is paramount for ensuring food security and achieving China’s 2030 agricultural sustainable development targets [5,6,7]. The Yellow River Delta (YRD), located at the lowest reaches of the Yellow River, is one of the world’s youngest deltas and nascent landmasses, with a saline soil area of about 4.4 × 10⁵ hm2, accounting for more than half of the region’s area [8,9]. As significant reserve land resources, saline soil reclamation and saline agroecosystems are important study objects in the YRD [10]. The groundwater in this region is influenced by dynamic interactions of the Bohai Sea, land, climate, and the Yellow River, exhibiting characteristics of shallow depth and high mineralization [11]. The accumulation of salts in the root zone due to groundwater evaporation and capillary action is a significant factor in soil salinization and crop yield reduction in the YRD. Furthermore, to promote the ecological conservation and high-quality development of the Yellow River Basin, the total water supply and the percentage of agricultural water use are decreasing, further restricting saline land reclamation and increasing crop yields in the Yellow River Delta [12].
Soil water use efficiency and salt management are two important parts of the saline land reclamation in the YRD. The mechanisms of physical improvement measures for saline soil are reduction in surface evaporation, moderation of the rise of groundwater, the creation of a relatively favorable water–salt environment in the root zone, and reduction in the water–salt stress suffered by crops during their growth periods to achieve the goals of increasing crop yields and efficient use of water resources. Through long-term research and practical exploration, film mulching, salt barrier layers, and ridge-furrow planting reduce root-zone salt accumulation and increase crop yields [13,14,15]. The mechanism of the film mulch system is its breaking the exchange of water and heat between soil and the atmosphere, working like a water vapor barrier in the soil surface [10]. Film mulching is a widely used and effective physical improvement measure in the process of cotton cultivation in the YRD. It has many advantages and benefits, such as preserving soil water, increasing soil temperature, suppressing soil surface evaporation, and promoting early germination [15,16]. However, in coastal saline soil, the single physical measure of film mulching cannot effectively inhibit the salt in shallow saline groundwater rising with soil capillary action, resulting in crop yield reduction due to salt accumulation in the root zone [14].
A salt barrier layer is another effective way to moderate salt accumulation; it inhibits the movement of salts from the deep soil and/or shallow groundwater to the topsoil and effectively blocks the movement of salt ions, especially sodium [17]. However, adding a buried layer requires removing the entire topsoil and installing the barrier material at a deep depth within the soil. Subsequently, the topsoil is backfilled, and the land is leveled. Given the substantial work involved in this process, the buried layer method has not been extensively adopted in the YRD. To improve the water sustainability of saline agriculture in the Yellow River Delta, our goal is to investigate a novel, cost-effective, and durable method for physical soil enhancement. This method involves breaking the soil’s capillary channels to hinder the upward movement of moisture and salinity from shallow groundwater, effectively creating a salt barrier layer. Yi et al. [18] selected three typical maize (Zea mays L.) fields with different cultivation histories, with major differences in soil textures and GWLs. The research found that the longer the cultivation history, the higher the bulk density of the root zone, and that a soil compaction layer reduced the moisture exchange between the root zone and groundwater. The study hypothesized that soil compaction could similarly inhibit the movement of salts and be an alternative to buried layers, especially to coastal saline soils. However, soil compaction would result in soil water stress in the root zone. By artificially constructed differences in the ground surface height, ridging affects the spatial distribution of water and salt on the soil surface. The shallow soil layer of salt accumulates towards the ridge top, while the moisture increases with the decrease in elevation. The low-salt and high-moisture environment in the furrow creates relatively suitable water and salt conditions for crop growth [19].
Mulched drip irrigation and ridge tillage have been widely used in arid and semi-arid saline irrigation districts in China [20]. However, the research on soil compaction layer and ridge-furrow planting in the YRD is sparse and in the primary stage, especially in the field. As a salt-tolerant and drought-resistant plant, cotton is among the most crucial crops within the saline agroecosystems of the YRD. In this region, cotton cultivation relies on rain-fed agriculture. The cotton is primarily cultivated in moderately to heavily saline–alkali lands with a salt content of 2–6 g kg−1, and salinity stress is a major factor causing a reduction in cotton yield. Previous research indicates that a single measure of plastic film mulching does not always effectively enhance productivity. Due to the lack of irrigation, during prolonged droughts in the growth stages of cotton, the salt in the shallow groundwater will move upward with the water, accumulating in the root zone, leading to crop yield reduction. To mitigate the potential threat of shallow high-salinity groundwater to crop growth, it is necessary to further explore new strategies for water–salt control in saline agriculture based on physical improvement measures.
A field experiment is the most reliable method to explore the dynamics of soil moisture and salinity in the vadose zone. However, field experiments are challenged by the issues of inadequate spatiotemporal resolution in the data acquired, time-consuming and laborious scenario configurations, and the inability to quantify the contribution of shallow groundwater to the field water balance. Numerical simulation is another effective way to investigate the coupled movements of soil moisture and salinity and then evaluate improvement effects of different physical measures, such as film mulching, soil compaction, and ridge-furrow planting. Previous studies indicate that relevant assessment of soil water and salt could be performed mathematically using HYDRUS-2D. Water–salt coupling models (such as HYDRUS) have been proved to be efficient tools for simulating soil water and solute transport in many cases [21,22]. Field experiments combined with numerical simulation are effective ways to investigate the law of spatial distribution and movement of soil water and salt; physical and mathematical models that integrate soil water movement, solute transport, and plant water uptake provide information that otherwise cannot be obtained from field experiments [23]. Zhang et al. [24] utilized the HYDRUS (2D/3D) model to evaluate the effects of alternate use of fresh and brackish waters during different crop growth stages and optimizing drip irrigation strategies by analyzing salt stress. Hu et al. [25] also used the HYDRUS (2D/3D) model to compare the effect of saline land reclamation by constructing the “Raised Field–Shallow Trench” pattern in agroecosystems in the Yellow River Delta. Furthermore, Zhu et al. [10] investigated the effects of plastic film mulch and a buried wood fiber layer compound control on soil water–salt control and yield improvement. They used HYDRUS-2D to analyze their spatial and temporal change. However, in the YRD, few studies have compared the effect of film mulching, soil compaction, and ridge-furrow planting on the spatial distribution of soil water–salt in the cotton root zone.
Hence, through field experiments, this study collected data on soil water and salt in the cotton root zone during the growth period under three physical improvement measures: film mulching, soil compaction, and ridge-furrow planting. Moreover, we calibrated the HYDRUS-2D model for simulating the coupling movement of soil water–salt under three physical improvement measures. The main objectives of this study were: (1) to calibrate and validate a water–salt coupling model (i.e., HYDRUS-2D) using measured soil water contents and soil salinities in a cotton field, (2) to identify the optimal root-zone condition of soil water contents (SWCs) and soil salinity (EC) under different measures, and (3) to suggest a promising improvement strategy to reduce water–salt stress.

2. Materials and Methods

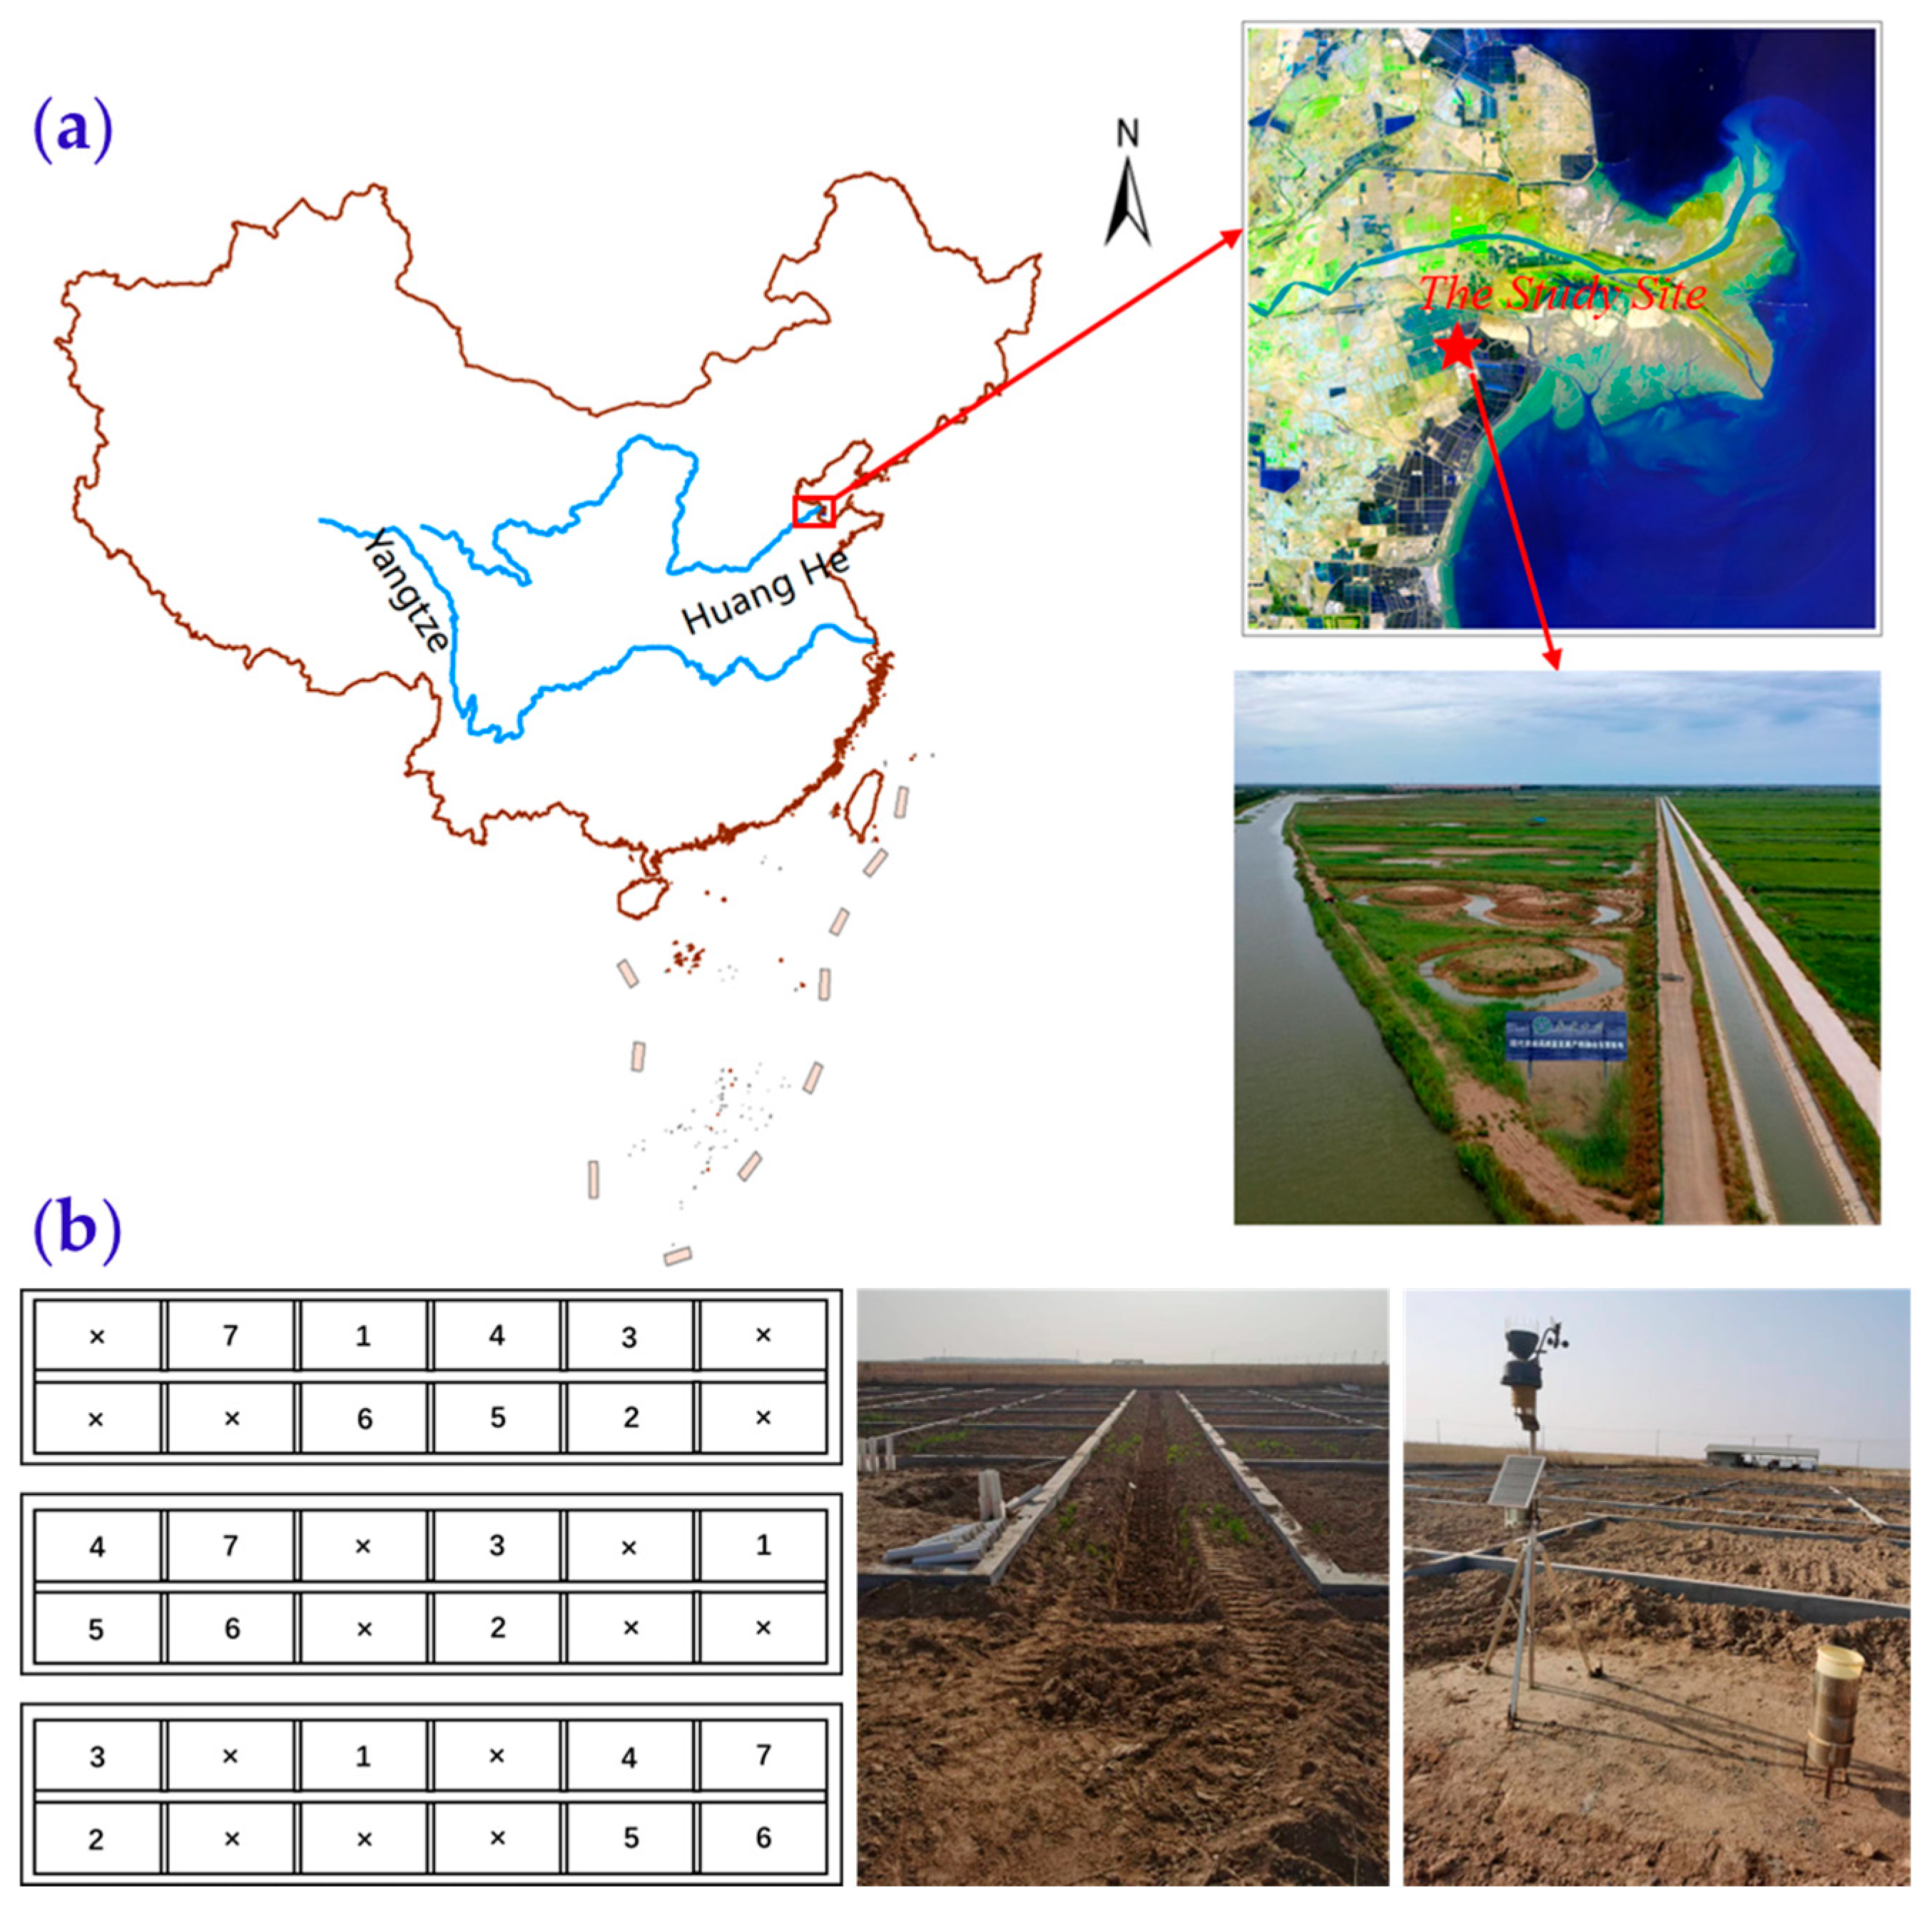
2.1. Study Area and Site Characterization

The field plot experiment for this study was conducted at the Dongying Base for Industry–Education Integration for Quality Development of Modern Agriculture of Ludong University (37°66′ N, 118°92′ E), located in the Yellow River Delta (Figure 1). The area has a warm–temperate and continental monsoon climate. The average annual precipitation and temperature are 695 mm and 14.5 °C, respectively, and almost 74% of precipitation is concentrated from June to September [26]. The annual average evaporation from the water surface is 1962 mm, and the ratio of evaporation to precipitation is approximately 3.6 [27]. The soil type gradually varies from fluvo-aquic to saline soil, and the soil texture is mainly sandy clay loam [28]. Influenced by the tidal process and the runoff of the Yellow River, the groundwater in this area is characterized by a shallow depth and high mineralization.
The experimental area was previously uncultivated land due to the high soil salt content. However, in recent years, with the progress of salinized land improvement and reclamation research, salt-tolerant crops such as cotton have begun to be planted on a large scale. In the growing season, the salt content in the root-zone soil exhibits dynamic changes due to uneven rainfall distribution and the high mineralization of groundwater. During extended periods of drought or when crops are in high water demand, capillary action drives water and soluble salts in the shallow water table upwards to the root zone. This process results in the accumulation of salts within the root zone, posing potential threats to cotton health and productivity.

2.2. Field Experiment

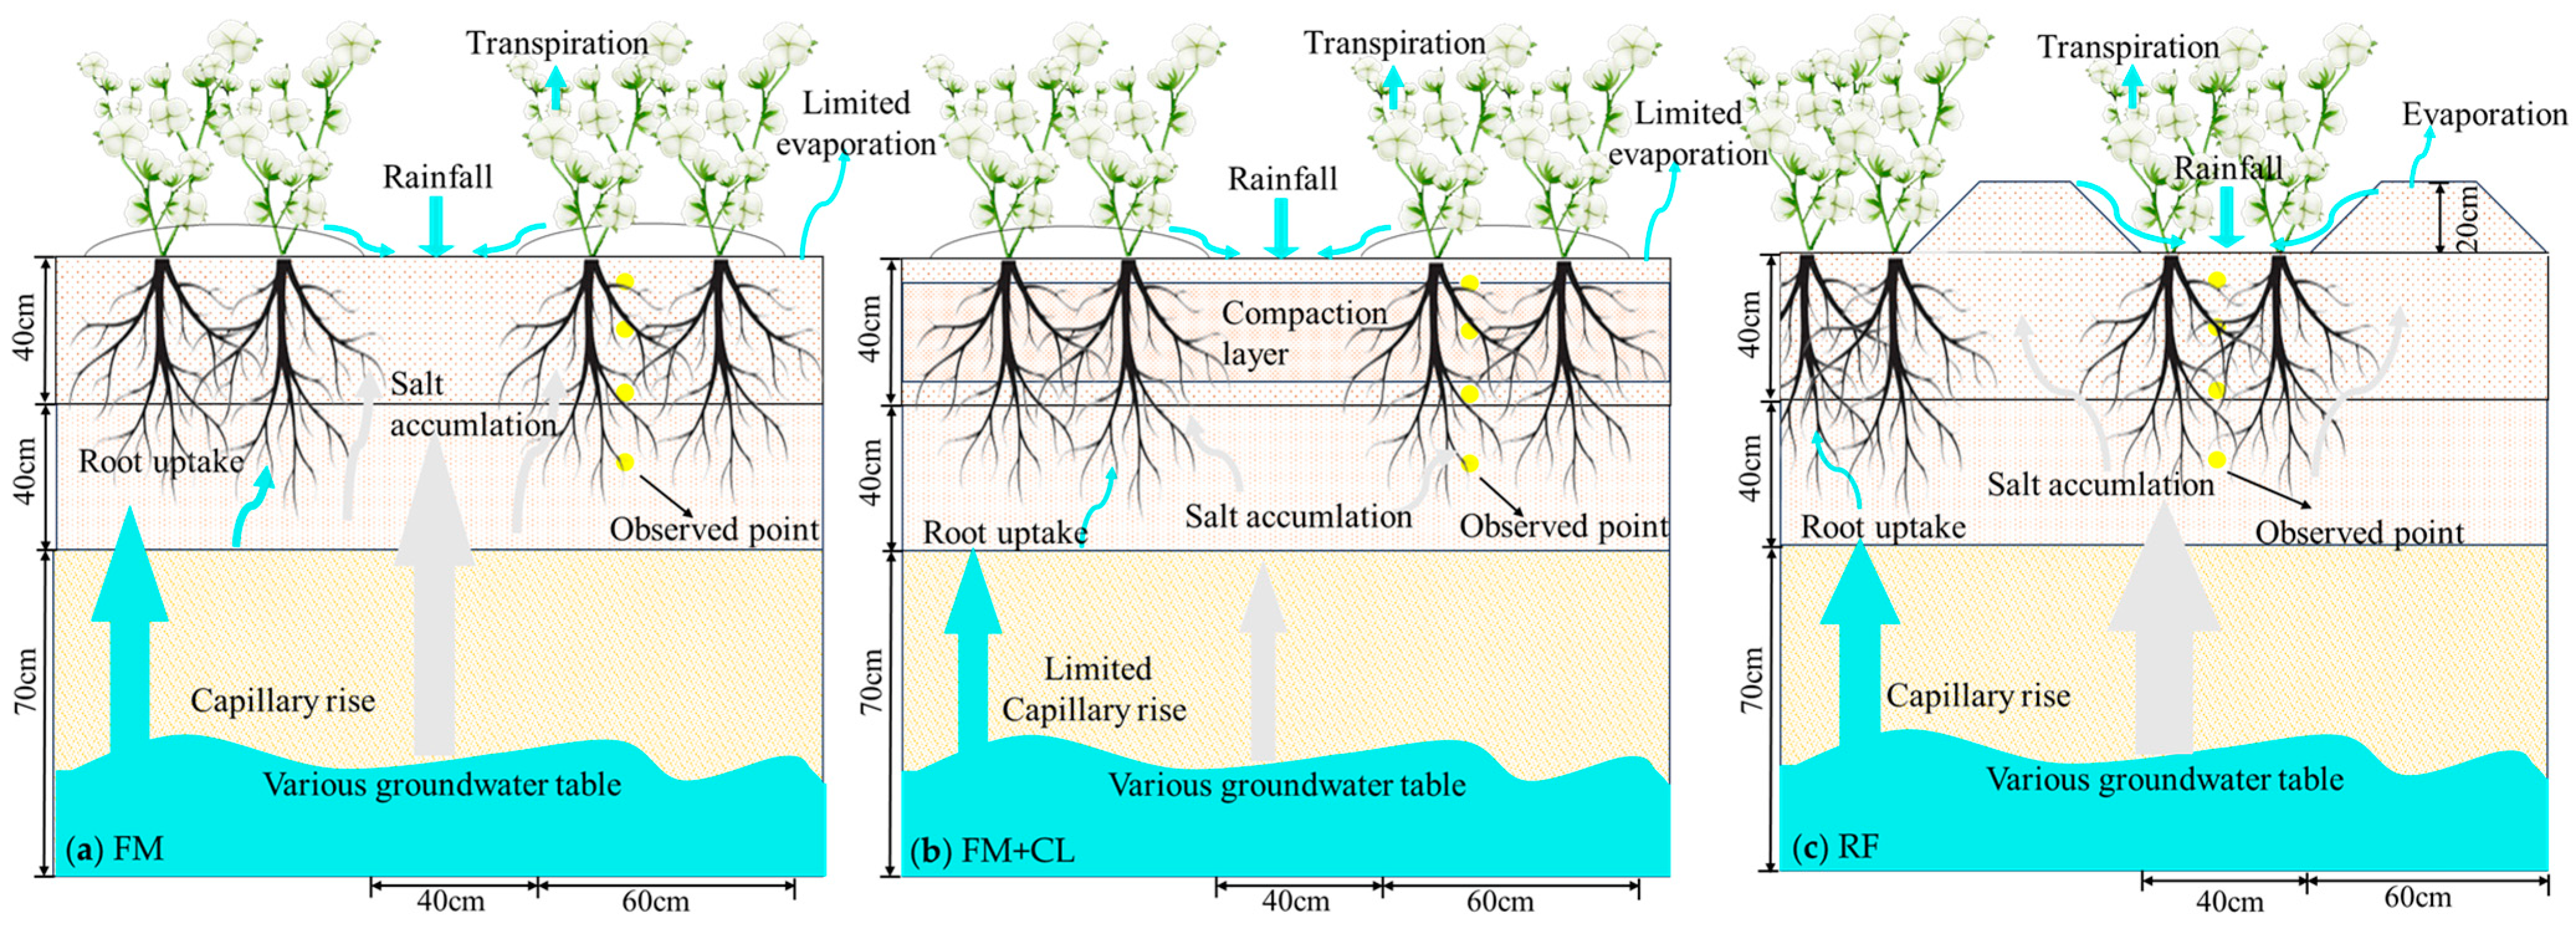
2.2.1. Experiment Design

The field plot experiment was conducted at the Dongying Base for Industry–Education Integration for Quality Development of Modern Agriculture of Ludong University from May to October 2023 (Figure 1a). This study is part of a long-term field experiment on saline–alkali land remediation and improvement technology at the base. The experimental site started cultivating cotton and summer soybean–winter wheat rotation systems in 2021 and 2023, respectively. Chemical products, such as biochar, organic fertilizer, and desulfurized gypsum, were applied to improve the salt content and physical and chemical properties of the soil to a certain extent.
Previous observations have indicated that cotton plants which have only been subjected to plastic film mulching treatment exhibit a range of issues, including low germination rates, high mortality in the early and middle stages, lower plant height, reduced leaf area index, and decreased cottonseed yield. In the later stages of the growing period, severe salt accumulation occurs in the root zone. Consequently, in the following year, large freshwater resources are still required for salt suppression, leading to poor agricultural sustainability and economic benefits. For the field treatment, concrete block levees divided the experimental plots (6 m × 3.5 m) and extended about 50 cm deep downward to minimize seepage across plots. The experimental plots were designed with six treatments plus one control group to improve saline soils using various physical and chemical means, with three replicates in each group for a total of 27 plots (Figure 1b). In the summer, each plot was divided into two halves, with one half planted with cotton and the other half with soybeans.
Due to the high soil salinity in the experimental area, the survival rate of soybeans was very low. Therefore, this study only collected cotton data from plots using physical improvement measures for saline soil: plastic film mulching (FM), plastic film mulching with an added soil compaction layer (FM+CL), and ridge-furrow planting (RF). During the cotton growing period, all plots were rain-fed. They were irrigated to a 10 cm depth twice before sowing. After four days of soaking, residual water was drained by digging small trenches and then operating different field treatments. Soil compaction was applied to the whole area of the FM+CL plots by an electric impact tamper; soil compaction was notably effective at a depth of 0–30 cm. After soil compaction, the topsoil was tilled to a depth of 8–10 cm using a rotary to ensure seed emergence. The mulch materials used consisted of plastic film and were arranged in rows, with each row exhibiting a width of 60 cm and an inter-row spacing of 40 cm. The plots under RF were arranged with alternated ridges (60 cm wide, 20 cm high) and furrows (40 cm width) and were not mulched by plastic films. Seeds were sown on 1 May 2023, when the temperature of the surface soil layer was higher than 14 °C. Two rows of cotton were planted with a spacing of 20 cm on 60 cm wide plastic films or 40 cm wide furrows. Dissolved urea was applied according to a ratio of 6:4 and a 120 kg N ha−1 rate during the sowing and late flowering boll stages. Pests and weed control were carried out according to farming practices in the experimental region. Further details of the field plot experiment and the major hydrological processes are shown in Figure 2.

2.2.2. Field and Laboratory Measurements

The meteorological data required for this study (daily precipitation, daily temperature, wind speed at 2 m, radiation, humidity, sunlight hours, etc.) were measured automatically by the small meteorological station set up at the Dongying Base. At the beginning of the experiment, profiled soil samples in three treatments were collected to determine soil texture (Melvin MS3000, Malvern Panalytical, Worcester, UK) and bulk density (ρb) (via the oven drying method). Table 1 shown the soil properties of the different layers. Soil samples (at 0–10, 10–20, 20–40, and 40–60 cm depths) were collected at approximately 4–6-day intervals from 15 July to 14 August with a soil corer (diameter: 5 cm). The soil samples were divided into two groups, one for measuring soil water contents (SWCs) and another for measuring electrical conductivities of the extracts with a 1:5 soil–water ratio (EC1:5). SWCs were measured by the oven drying method, and EC1:5 values were measured with a conductivity meter (dS m−1). The data for each treatment were obtained from the mean values of three replicates. It is worth noting that EC1:5 values first had to be converted into the EC of the saturation extract before being inputted to HYDRUS-2D [29]:
E C = 5.88 × E C 1 : 5 + 1.33
Furthermore, Dong et al. [30] developed the relationship between EC1:5 and salt concentration (St, g kg−1) (R2 = 0.9964):
S t = 3.4058 × E C 1 : 5 + 0.1427
Five cotton plants from each plot were selected to measure the plant height once every 7–14 days, and the leaf area index (LAI) was calculated using the FAO method [31]. The level of the groundwater table and its electrical conductivity were measured through an observation well in the field. The average depth was 1.463 m and the average electrical conductivity was 20.878 dS m−1 in the study area during the growing season.

2.3. Simulation of the Coupled Water Flow and Solute Transport

The HYDRUS-2D model allows numerical simulation of the two-dimensional transport of soil water, solutes, heat, and colloids in variably saturated and unsaturated media [21]. In this study, HYDRUS-2D was applied to calculate the coupled water flow and solute transport. Root water uptake and distribution of evapotranspiration were also considered in the calculation of the model, as they could affect soil water and salt movement. These processes are shown in Figure 2. Below, we give an overview of the main procedures that the HYDRUS-2D model (Version 3.02) conducted in this study.

2.3.1. Water Flow

Considering the two-dimensional isothermal Darcy flow of water in variably saturated–unsaturated media, neglecting the effect of the gas phase on the liquid flow process, the water flow control equation under these conditions is given by the modified version of the Richards equation [32]:
θ t = x K h h x + z K h h z + 1 S
where θ is the volumetric water content (cm3 cm−3); h is the pressure head (cm); K(h) is the unsaturated hydraulic conductivity (cm day−1); t is the time (day); x and z are the horizontal and vertical coordinates, respectively (cm); and S is a distributed sink function representing water uptake by the roots (day−1). The unsaturated soil hydraulic properties are described using the van Genuchten–Mualem functional relationships [33]:
θ h = θ r + θ s θ r 1 + a h n m ,   h <   0 θ s ,   h     0
K h =   K s Φ e l 1 1 Φ e 1 / m m 2
with
Φ e = θ θ r θ s θ r   and   m = 1 1 n
where θs and θr are the saturated water content and the residual water content (cm3 cm−3); Ks is the saturated hydraulic conductivity (cm day−1); α (cm−1) and n (−) denote shape parameters; Φe is the effective saturation (−); and l (−) is pore connectivity parameter, commonly set at 0.5. The above-mentioned hydraulic parameters were predicted from the lab-measured soil particle size distribution and bulk density using the Rosetta program [34], an integral part of HYDRUS-2D. These soil samples were collected from various depths ranging from 0 to 100 cm before the initiation of the experiment. Then, the predicted hydraulic parameters were calibrated using the actual measured data, and the results are presented in Table 2. The study did not consider the temperature dependence of soil hydraulic parameters and the hysteresis effect.

2.3.2. Root Water Uptake

Actual cotton root uptake, the sink term (S) in Equation (3), was estimated using the general model introduced by Feddes et al. [35]; it was coupled in the HYDRUS-2D package. In this approach, the potential transpiration rate, Tp (cm day−1), is distributed over the root zone using the normalized root density distribution function, b(x, z) (cm−1), and multiplied by the dimensionless stress response function, α(h,h,x,z) [36].
S h , h , x , z = α h , h , x , z S p x , z = α h , h , x , z b x , z S L t T p
where Sp (x,z) and S(h,h,x,z) are the potential and actual volumes of water removed from a unit volume of soil per unit of time, respectively, and Lt is the soil surface area associated with transpiration.
In HYDRUS-2D, the root distribution function b(x,z) was calculated by the following formula [37]:
b x , z = 1 z Z m 1 x X m e p z Z m z * z + p x X m x * x
where Xm is the maximum horizontal distance of the root distribution, which was set to 40 cm; Zm is the maximum depth of the root distribution, which was set to 70 cm, according to field observations; x is the horizontal coordinates of the maximum root density, which was set to 20 cm; and z is the vertical coordinates of the maximum root density, which was set to 10 cm. This was in reference to the related research conducted by Che et al. [13]. Px and Pz are the empirical parameters of root asymmetry, which are typically set to 1.0.
The multiplicative model was used to simulate the combined effect of water and salinity stress, as α(h,h) = α1(h)α2(h) [38].
Root water uptake reduction due to water stress, α1(h), was described using the model developed by Feddes et al. [35]:
α 1 h = h h 4 h 3 h 4   h 3 > h > h 4 1   h 2 h h 3 h h 2 h 1 h 2   h 1 > h > h 2   0   h h 1   o r   h h 4
where h1, h2, h3, and h4 are the threshold parameters of root water uptake; the default parameters for cotton in the HYDRUS-2D internal database were h1 = −15 cm, h2 = −25 cm, h3H = −200 cm, h3L = −600 cm, and h4 = −14,000 cm [25].
Root water uptake reduction caused by salt stress, α2(h), was calculated by the salinity threshold and slope function [39]:
α 2 h = 1 ,   E C E C T 1 E C E C T 0.01 s   E C > E C T
where ECT is the salinity threshold (dS m−1) and s (−) is the slope determining root water uptake decline per unit in salinity above the threshold. The salinity threshold and slope for cotton were set to 7.7 (dS m−1) and 52%, respectively.

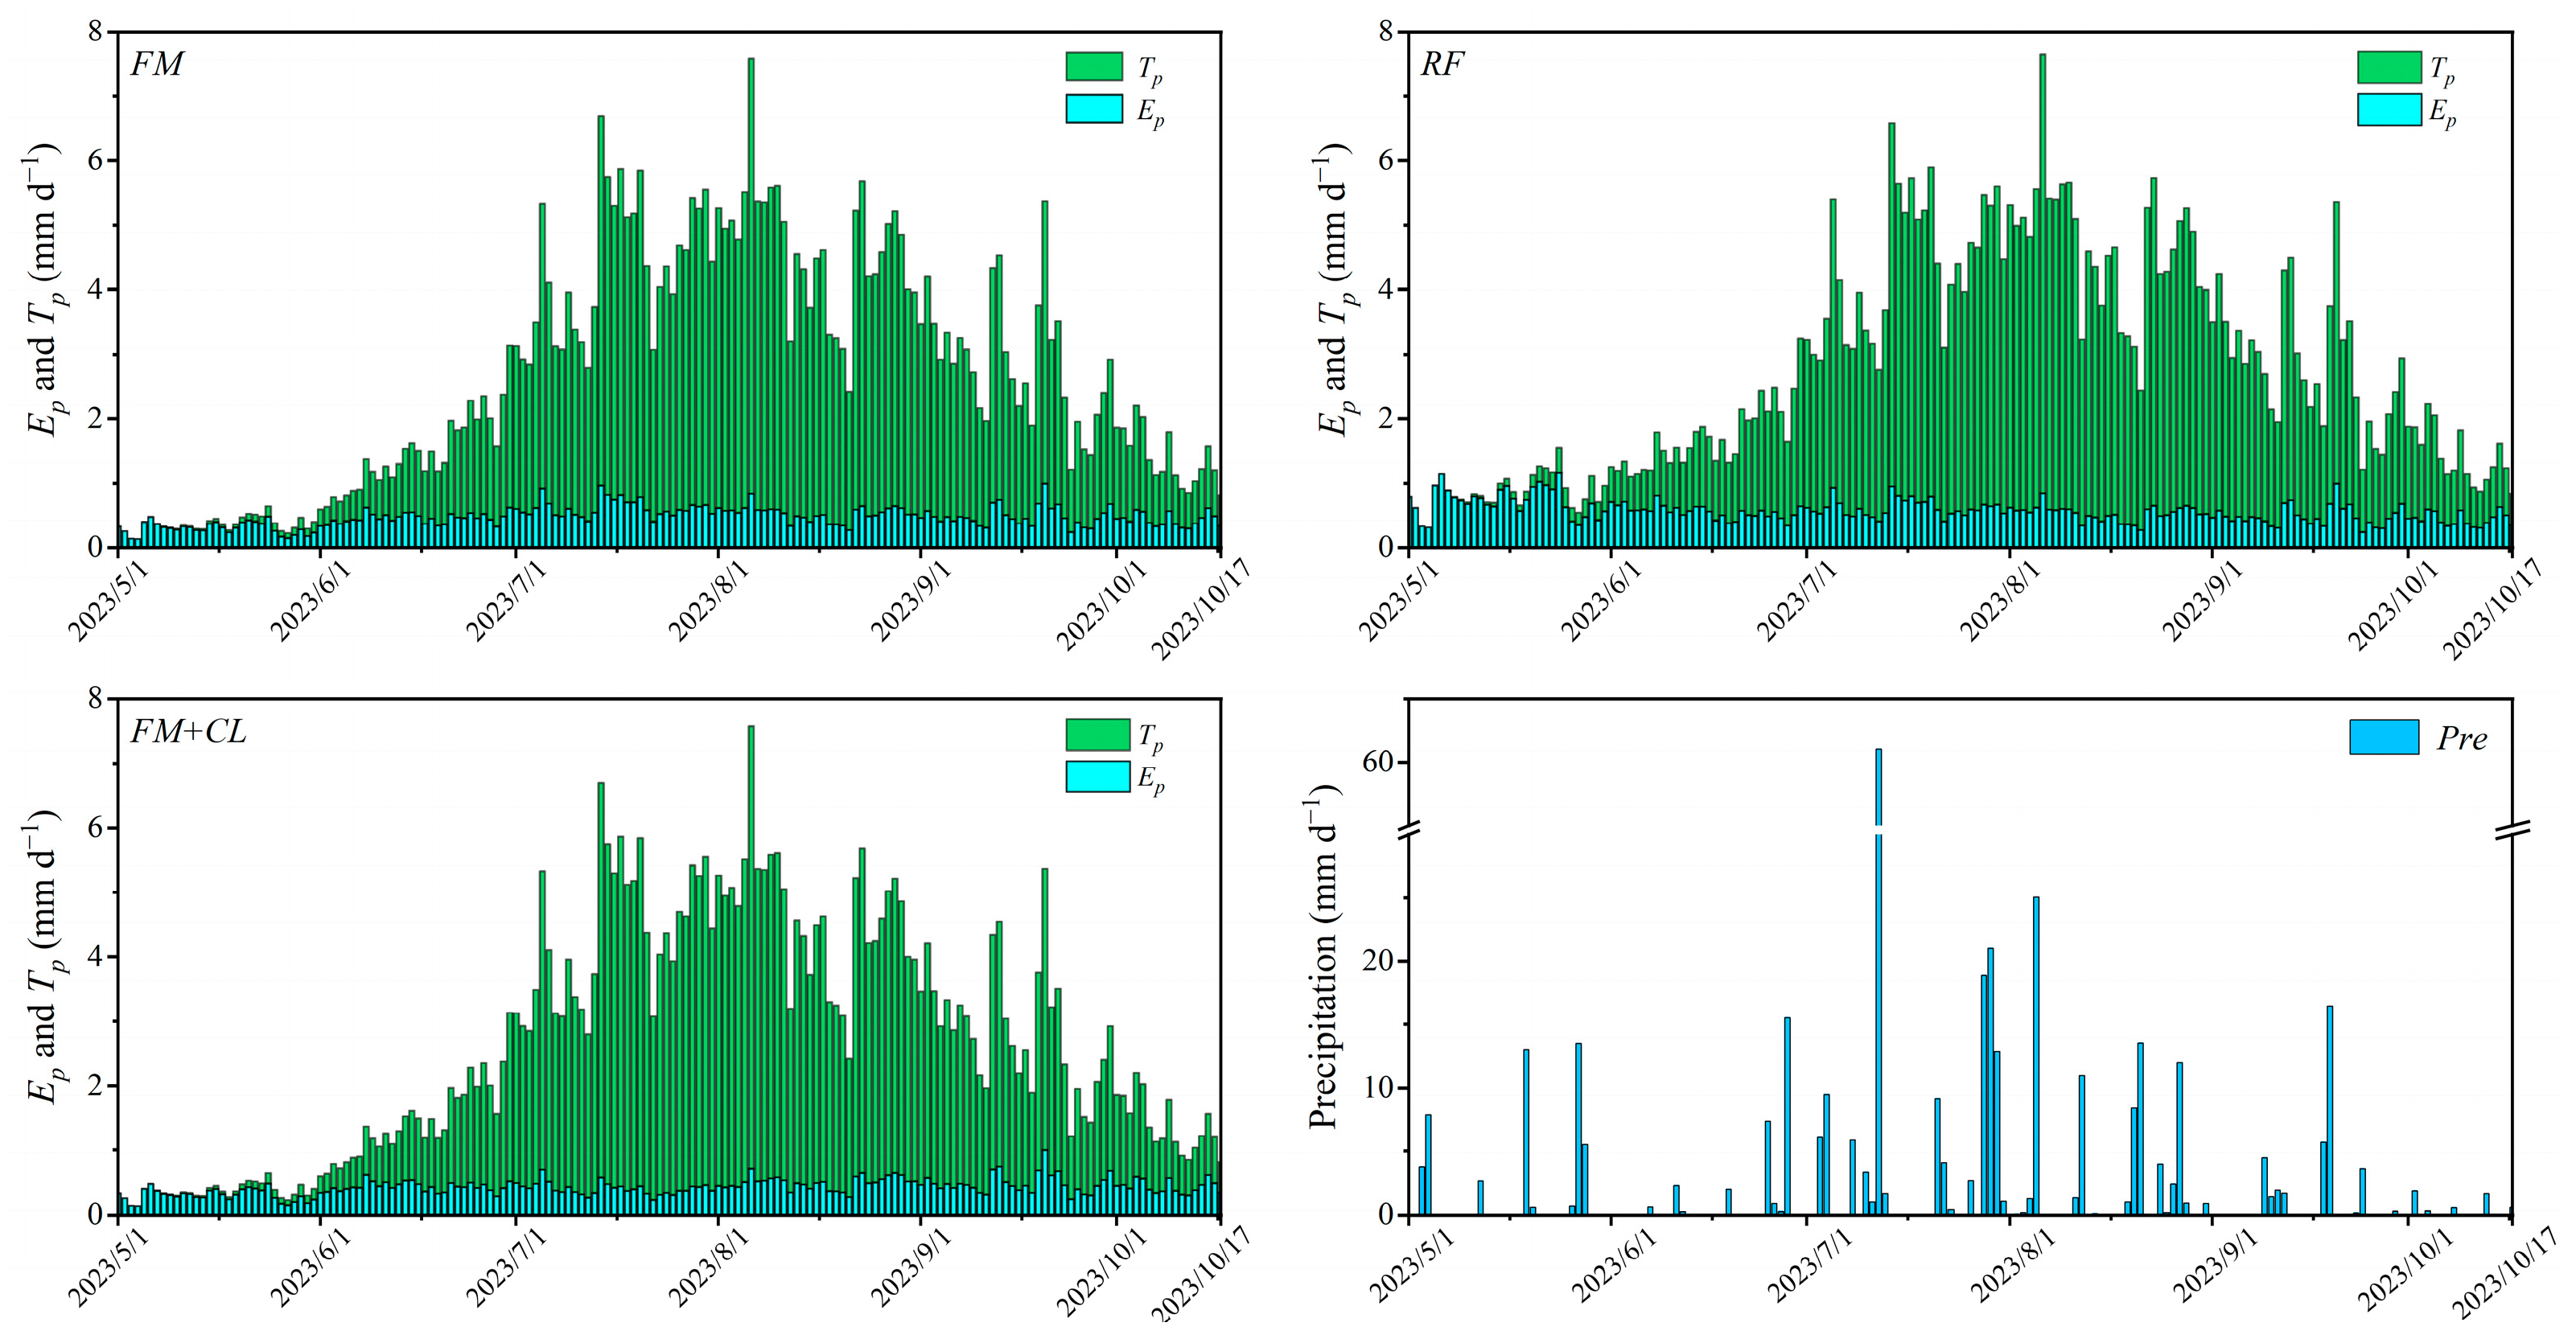
2.3.3. Estimation and Partition of Evapotranspiration

When atmospheric boundaries are used as the upper boundary conditions, the potential evapotranspiration (ETp) of the cotton field is obtained by multiplying the crop growth coefficient (Kc) by the reference crop evapotranspiration (ETo). ETo was calculated according to the FAO-56 Penman–Monteith equation [31]:
E T o = 0.408 R n G + γ 900 T + 273 u 2 e s e a + γ 1 + 0.34 u 2
where (RnG) is the net balance of energy available at the crop surface (MJ m2 d−1), T is the mean daily air temperature (°C), u2 is the wind speed at the height of 2 m (m s−1), es is the saturated vapor pressure (kPa), ea is the actual vapor pressure, ∆ is the slope of the saturated water vapor pressure curve, and γ is the psychrometric constant (kPa °C−1).
The potential soil evaporation rate (Ep) (mm d−1) and the potential crop transpiration rate (Tp) (mm d−1) in HYDRUS-2D were determined using the equations [40]:
E p = E T p T p = E T c × e x p β L A I E T p = K c × E T o
where LAI is the leaf area index observed in the experiments and β is the attenuation coefficient of canopy radiation, set as 0.58 for cotton [41]. Kc is the single crop coefficient, and Kc-mid and Kc-end were adjusted for the YRD climate, taking into consideration the crop height, wind speed, and minimum relative humidity averages for the growth period [31]:
K C a d j =   K C F A O + 0.04 u 2 2 0.04 R H m i n 45 h 3 0.3
where KCadj is the modified Kc value, u2 is the average wind speed at the height of 2 m (m s−1), RHmin is the average of the daily minimum relative humidity (%), and h is the average plant height for a growth stage (m). The modified Kc-ini, Kc-mid, and Kc-end values were 0.36, 1.14, and 0.65, respectively. We assumed that the plastic film with a 60% area distributed in the FM and FM+CL could reduce Kc-ini by 50%, as the plastic film was considered impermeable to evaporation [31,42]. The impact of soil compaction and ridges on Kc was not considered. Precipitation and the partition of evapotranspiration during the cotton growth period are shown in Figure 3.

2.3.4. Solute Transport

Two-dimensional convection–dispersion equations (CDEs) were used to estimate nonreactive solute transport in a variably saturated rigid porous medium [43], without considering root solute uptake, in this study:
θ c t = x θ D x c x + z θ D z c z x q x c z q z c
where c is the solute concentration in soil water; D is the effective dispersion coefficient (cm2 d−1), which in HYDRUS-2D is related to the longitudinal dispersion coefficient (DL), the transverse dispersion coefficient (DT), and the molecular diffusion coefficient in free water (Dw); and q is the water flux (cm d−1). The initial solute transport parameters were referred to the similar soil conditions in Guo et al. [44] and Hu et al. [25] and calibrated using the actual measured data. The calibrated solute transport parameters are presented in Table 2. The governing flow and transport equations were solved numerically using Galerkin-type linear finite elements.

2.3.5. Initial and Boundary Conditions

In this study, a domain geometry defined as 100 cm wide and 150 cm deep was developed for numerical simulation by considering the symmetry of the experimental arrangement; the soil profiles were classified as 3 layers according to soil characteristics and monitoring points. Based on field measurements, a compaction layer was added at an 11–28 cm soil depth in the FM+CL treatment. The modeled domain was discretized using the nonuniform triangular finite-element mesh generated by HYDRUS-2D, with fine grids (2 cm) at the top boundary which gradually increased to 5 cm grids to the bottom of the simulation domain. The data measured on May 1st were used as the initial conditions of the HYDRUS-2D model. The initial soil water content and soil salinity at different depths were linearly interpolated between the observed depths based on the actual measurement data, with some simplification.
The no-flux and atmospheric (to apply precipitation and potential evaporation (Ep)) boundary conditions (BCs) were assigned at the top boundaries, depending on whether plastic film mulching at the soil surface was used or not (Figure 2). The potential transpiration (Tp) flux was specified to account for root water uptake. A variable head BC was used at the bottom boundary to represent the position of the groundwater table. Left and right boundaries were assigned a no-flux BC. A third-type BC was also used to describe solute fluxes along the top and bottom boundaries.

2.3.6. Statistical Analysis

The HYDRUS-2D model was calibrated and validated by the observed SWC and EC data in 2023, from July 15th to August 14th. Based on the simulation results of HYDRUS-2D, two measures of goodness of fit were used to evaluate the model’s performance: the root mean square error (RMSE) and the coefficient of determination (R2) [42].
R M S E = 1 n i = 1 n S i O i 2
R 2 = i = 1 n S i S i ¯ ( O i O i ¯ ) i = 1 n S i S i ¯ 2 i = 1 n O i O i ¯ 2 2
where Oi represents the observed value, Si represents the simulated value, n represents the number of measurements, O i ¯ represents the average observed value, and S i ¯ represents the average simulated value. The minimum value of RMSE is 0, and the agreement of the observed value and simulated value is better when it is close to 0. R2 ranges from 0 to 1, with a value of 1 indicating perfect model performance.

2.4. The Groundwater Effect and Salt Accumulation

Within agricultural ecosystems, previous studies indicated that groundwater strongly supports crop water requirements and yield improvement [45,46,47]. The groundwater contribution to crop growth is challenging to measure directly, especially when the effects of salt must be taken into account [48]. At present, HYDRUS is the most widely used mechanism model for the water–salt coupling transport process in GSPAC systems, and HYDRUS-2D is a specific version of HYDRUS that is designed for two-dimensional simulations. Lowry and Loheide [49] defined the extra water transpired by the plant from shallow groundwater as a “groundwater subsidy”. In this study, to assess the contribution of shallow groundwater to actual crop transpiration (Ta) under various physical improvement measures, we re-executed HYDRUS-2D simulations with the bottom boundary set to a free drainage condition, eliminating the impact of groundwater. We posit that the discrepancy of actual crop transpiration under two distinct bottom boundary conditions is indicative of the extra water transpired by the plant from shallow groundwater.
ΔSS (%) refers to the EC discrepancy in the various growth stages during the growing season, which was used to analyze the spatial and temporal change in soil salinity in this study:
Δ SS = E C a E C b E C b × 100
where ECb and ECa are the ECs (dS m−1) before and after a certain growth stage at the different observed depths, respectively.

3. Results

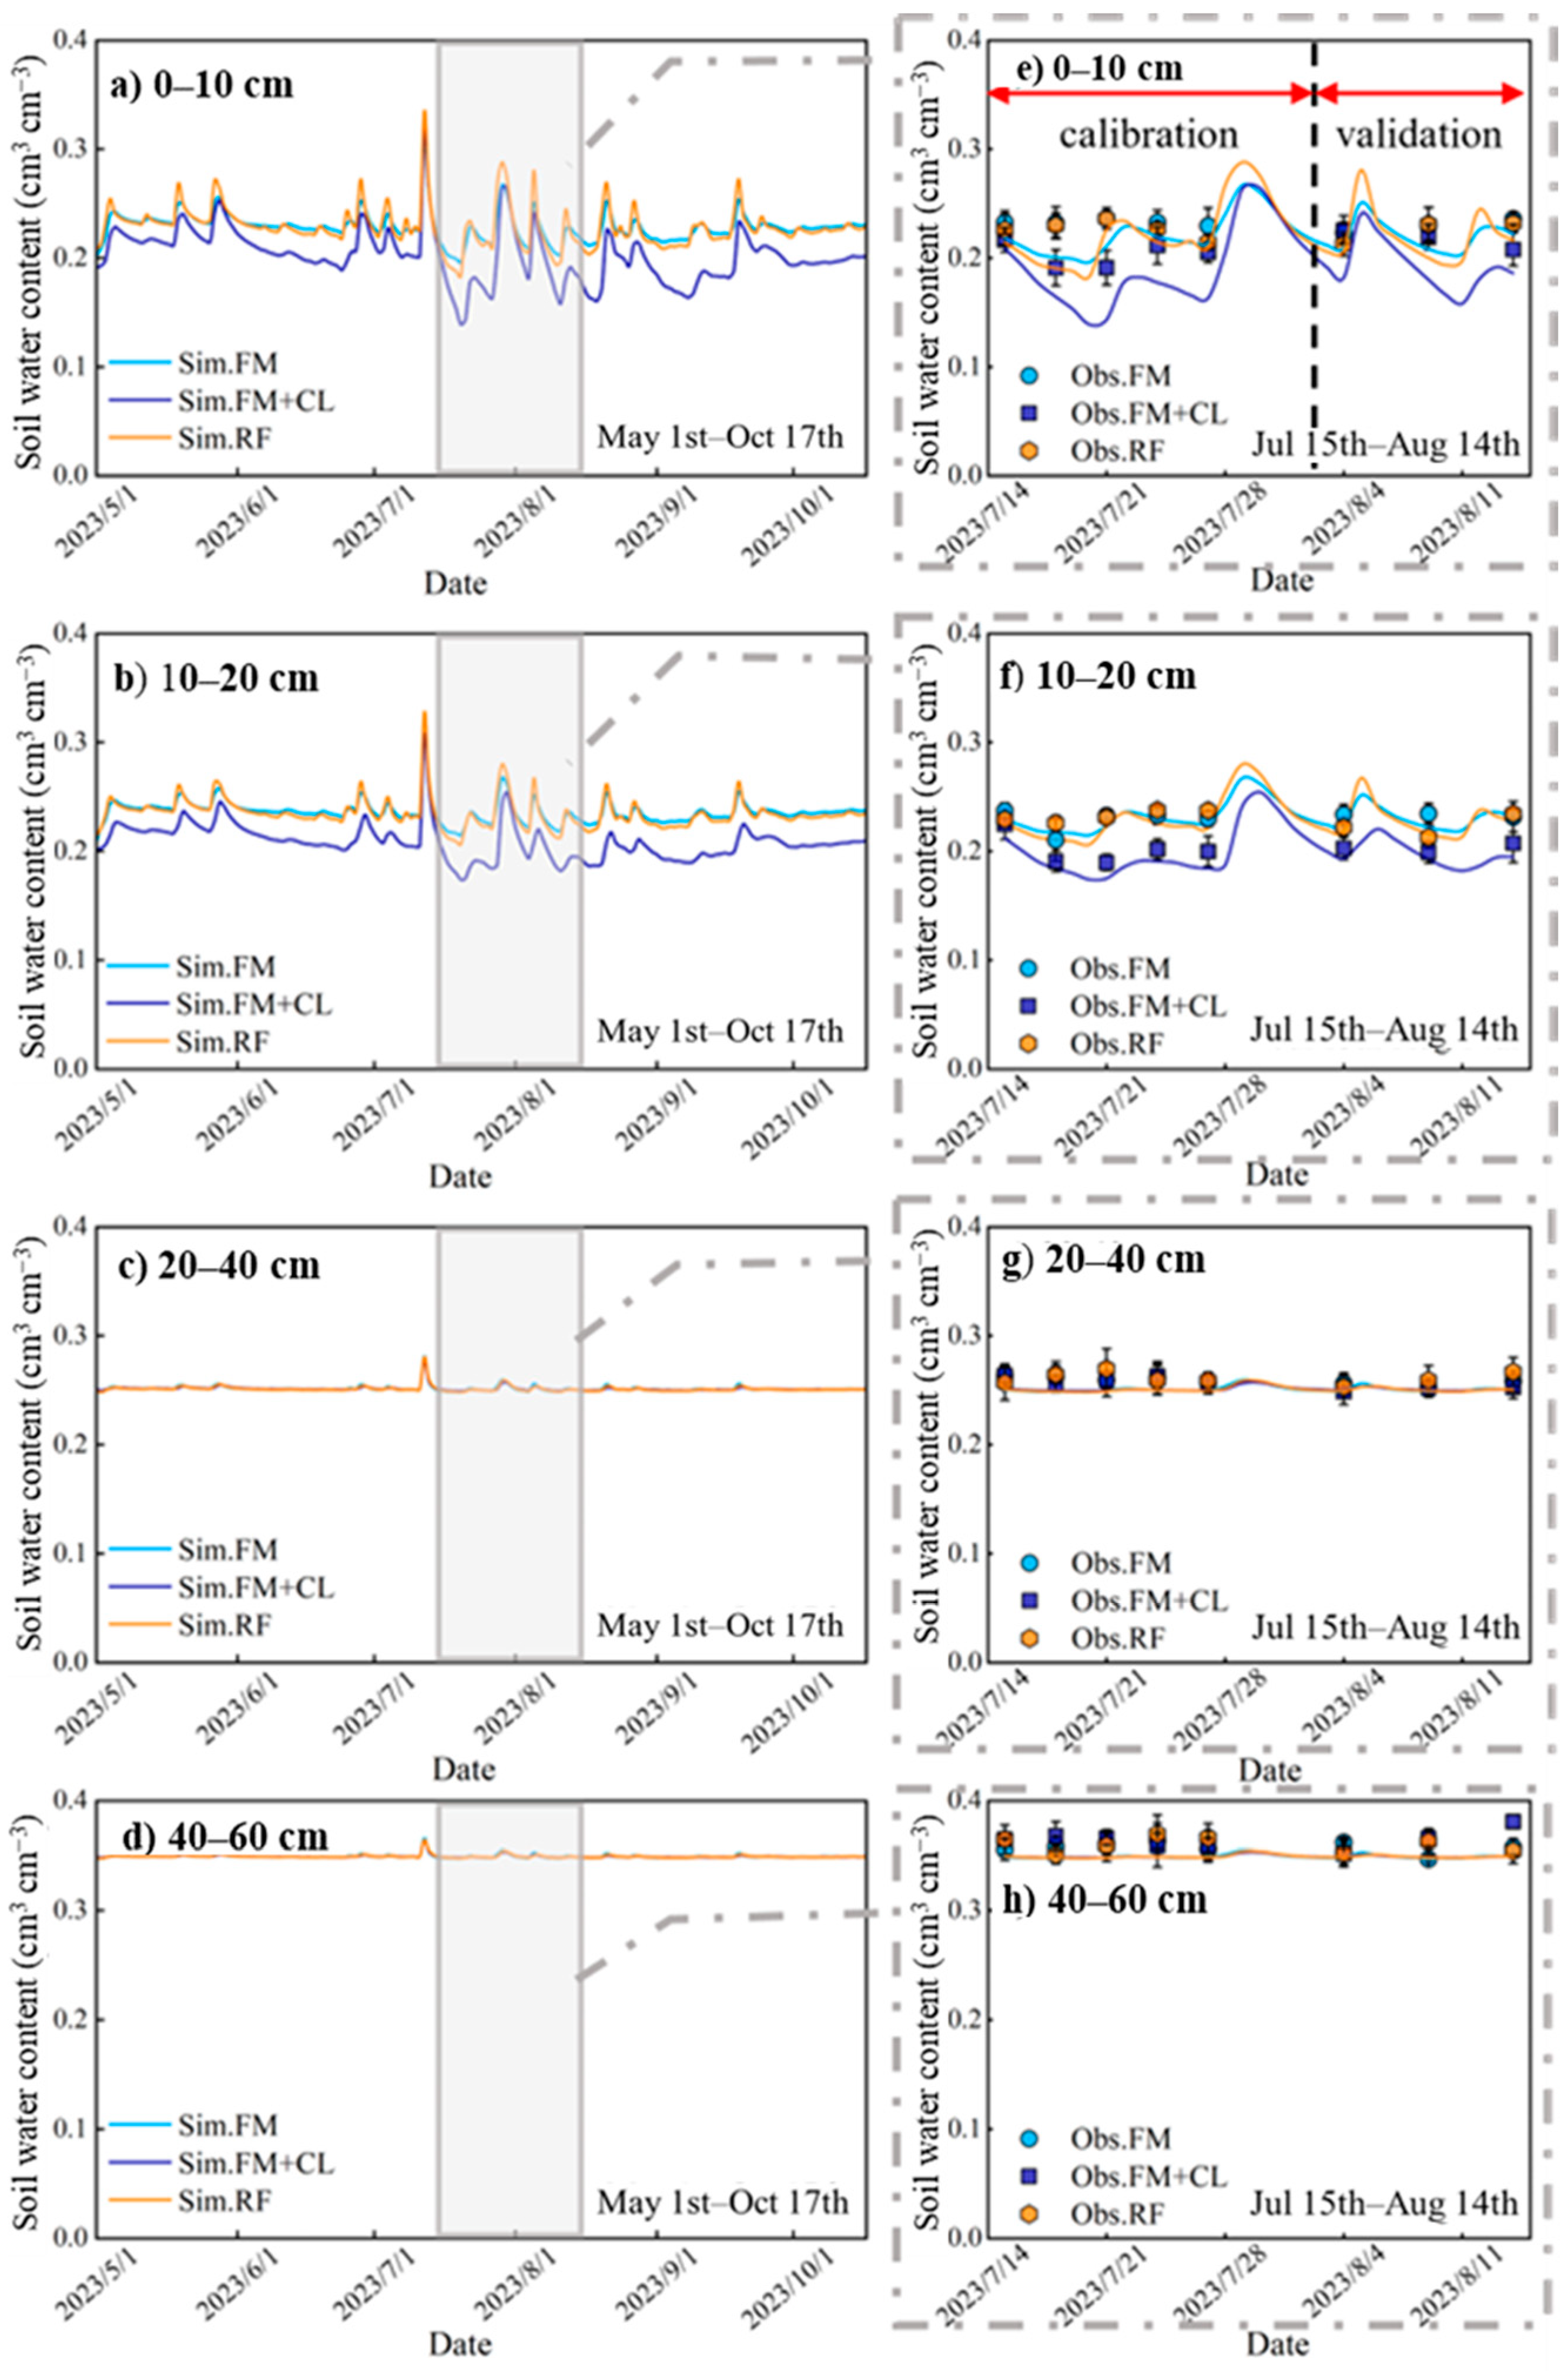
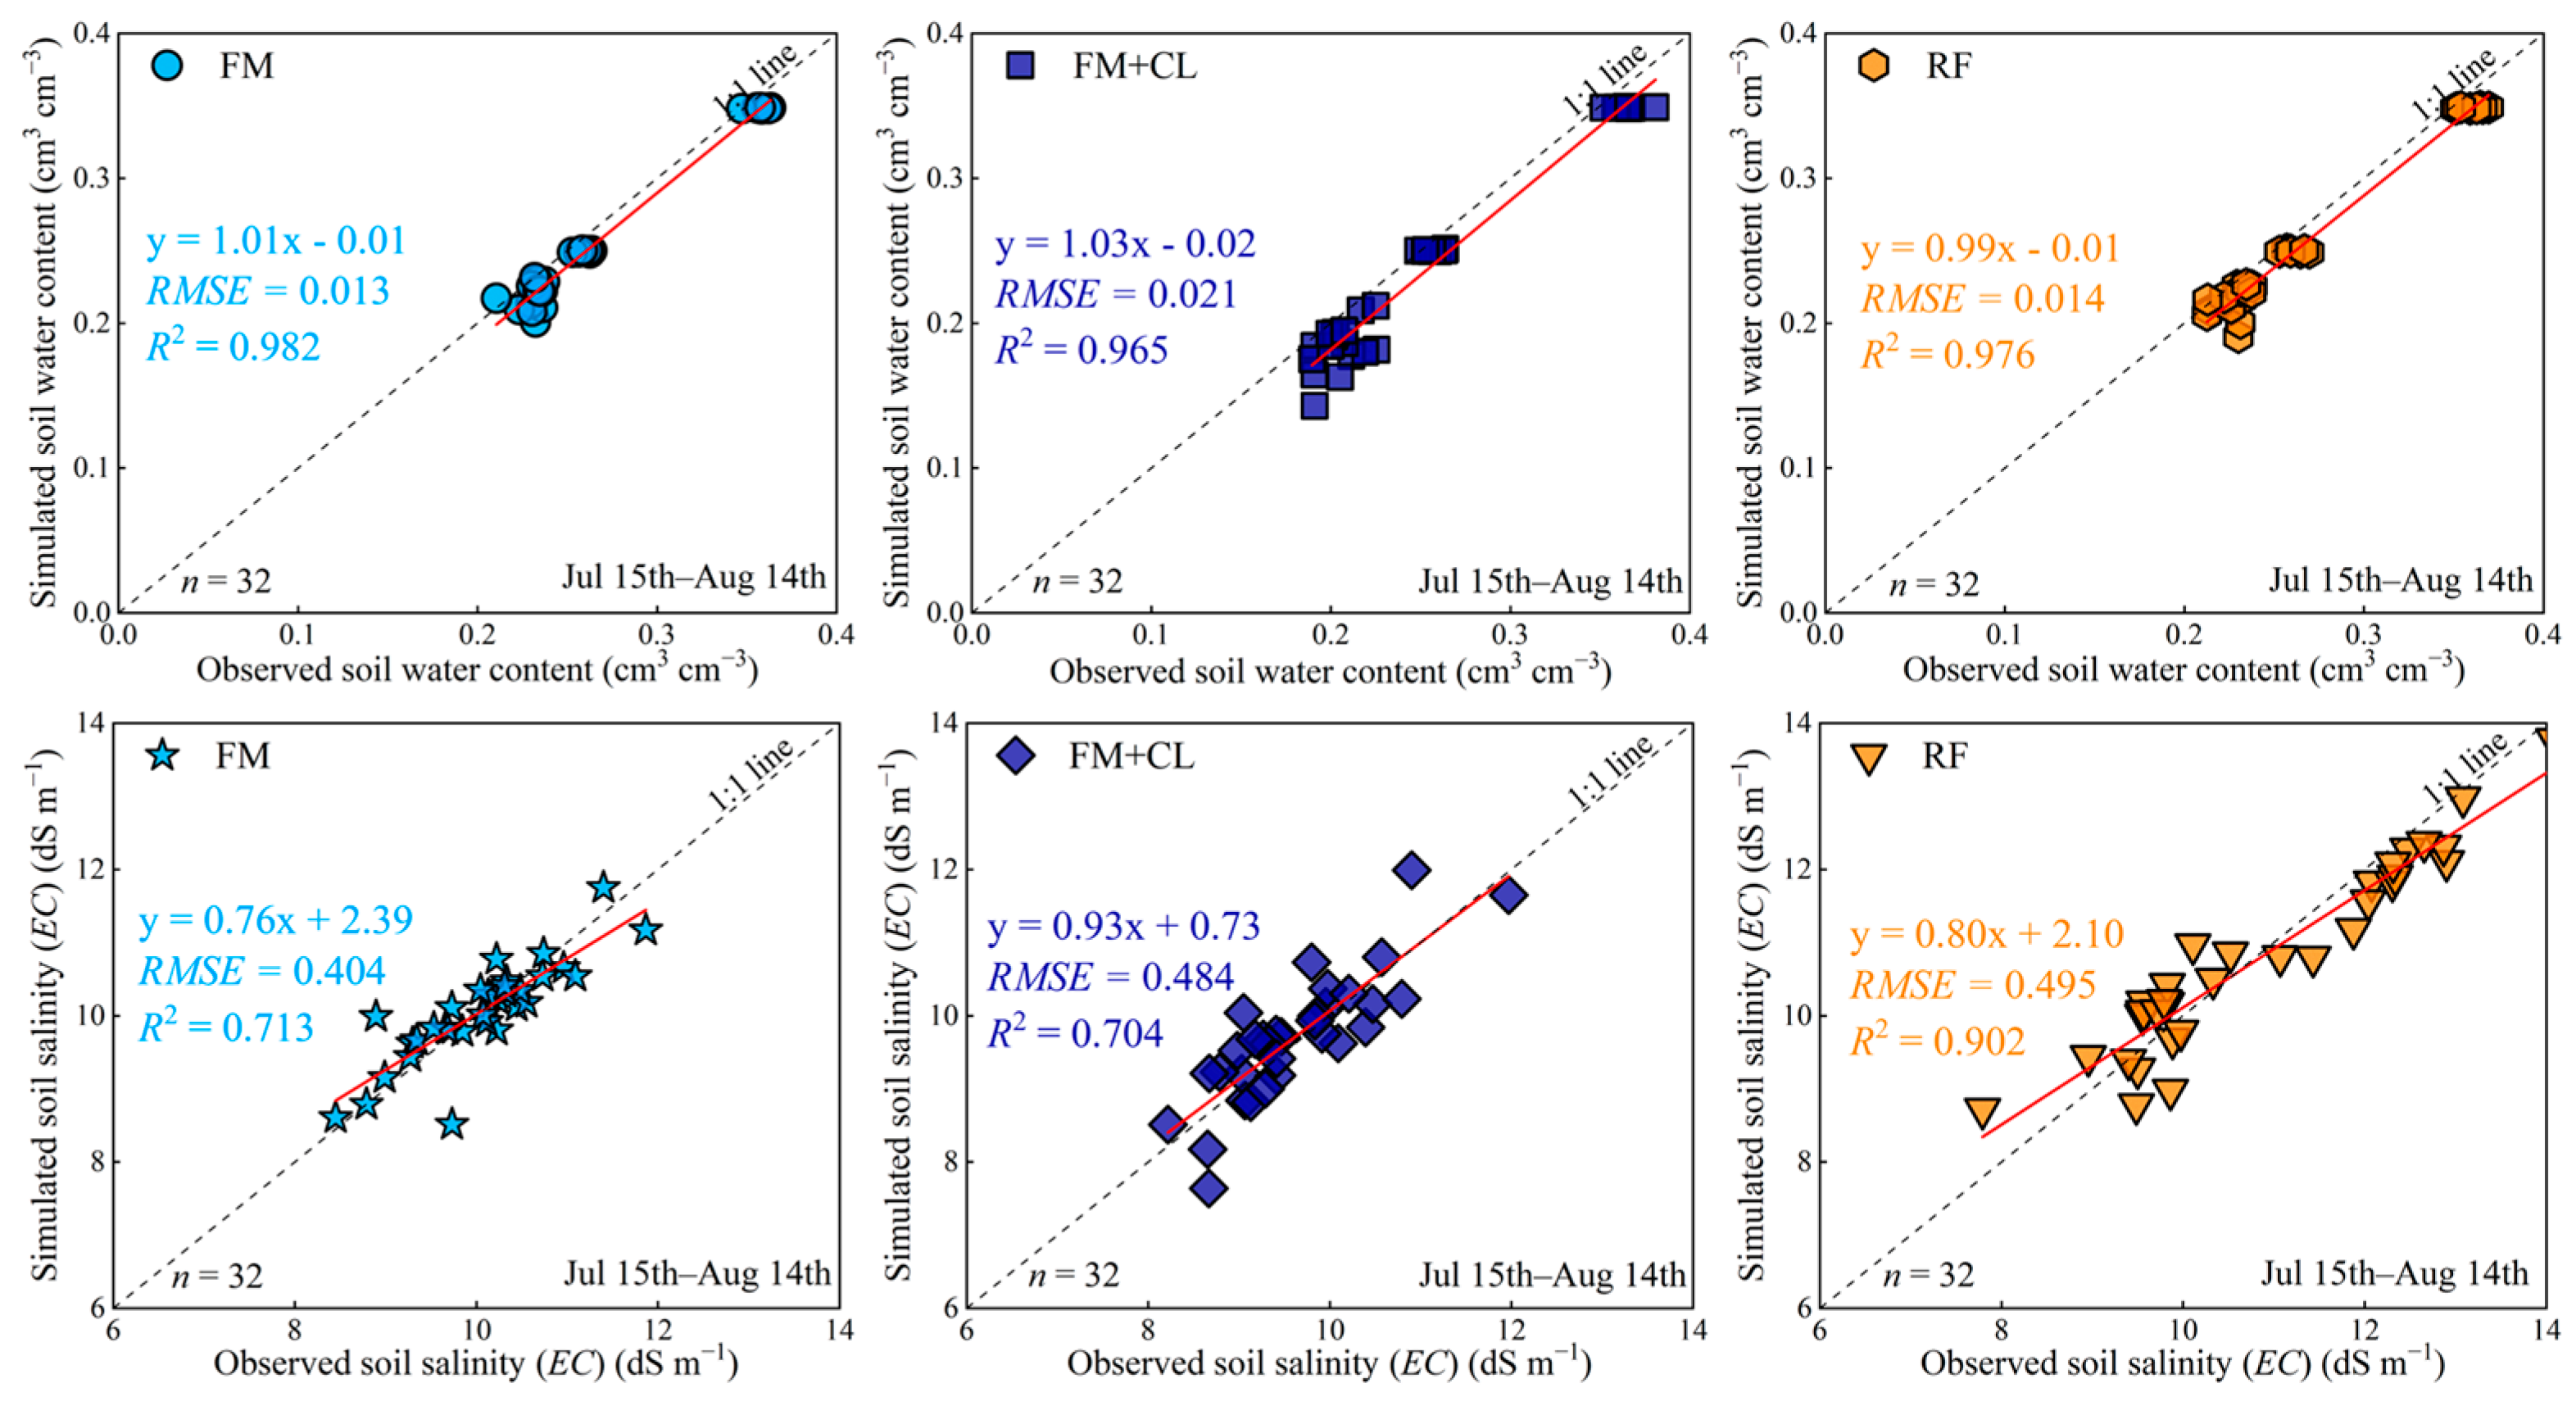
3.1. Model Performance

The field-measured data from July 14th to 27th were used for calibration (Table 2). The calibrated parameters and the measured data from August 4th to 14th were used to verify the validity of the model parameters (Figure 4e–h and Figure 5e–h). The statistical evaluation results for model performance in RMSE and R2 at different soil depths are summarized in Table 3. It can be found that the simulated values achieved good agreement with the observed values. Also, the simulation of SWC was better than that of EC. The RMSE values for SWC and EC were 0.009–0.024 and 0.322–0.561, and the R2 values for SWC and EC were 0.937–0.981 and 0.618–0.67, respectively. At 40–60 cm depths, the consistency between the simulated and observed values was better than that at 0–20 cm depths. A comparison between the observed and simulated SWC and EC values along the 1:1 line is depicted in Figure 6 (calibration and validation data of FM, FM+CL, and RF). The RMSE values for SWC and EC were 0.013–0.021 cm3 cm−3 and 0.404–0.495 dS m−1, respectively. Moreover, the R2 values were in the ranges of 0.965–0.982 and 0.704–0.902, respectively. There was reasonably perfect consistency between the simulated and observed values. These results showed that HYDRUS-2D performed reliably in the simulation of water flow and salt transport under the field experiments.

3.2. Soil Water Dynamic

We depict the variation patterns of 0–60 cm soil water contents during cotton growing seasons (1 May–17 October) under different treatments using the calibrated HYDRUS-2D model (Figure 4a–d). The shaded regions in the figure denote the measurement periods when observed data were used to calibrate and validate HYDRUS-2D, which are enlarged in the figures on the right-hand side (Figure 4e–h). The simulation accuracy increased with the increase in soil depth, and HYDRUS-2D significantly underestimated the soil water content at the 0–10 cm depth. During the cotton growing season, soil water content at the 0–60 cm soil layer depth experienced similar changes and fluctuated with precipitation, especially in the middle growth stage. Soil water content appears to show more variability at shallower depths (0–10 cm and 10–20 cm) than at deeper layers (20–40 cm and 40–60 cm) (Figure 4). This could be attributed to rainfall, surface evaporation, and root water uptake, which are more pronounced at shallower soil layers. Soil water contents at 20–60 cm soil layers and deeper depths were maintained with slight variation; they were 0.248–0.260, 0.249–0.257, and 0.248–0.259 cm3 cm−3 at 20, 30, and 40 cm depths, respectively, and they were 0.348–0.355, 0.348–0.353, and 0.348–0.354 cm3 cm−3 at 40, 50, and 60 cm depths, respectively.
However, at shallower depths (0–10 cm and 10–20 cm), the soil water content under FM+CL was lower than that under FM, especially after a prolonged drought. This phenomenon could be attributed to the disruption of the continuous capillary channels by the soil compaction layer, which impedes the replenishment of moisture from the groundwater to the surface soil layers. Soil water under RF was more responsive to precipitation than under film mulch; this could be due to the atmospheric factors acting on the entire top boundary of the RF. The regions of soil water content under FM, FM+CL, and RF were 0.196–0.269, 0.139–0.265, and 0.183–0.288 cm3 cm−3 at the 0–10 cm depth, respectively, and they were 0.215–0.267, 0.174–0.254, and 0.206–0.280 cm3 cm−3 at the 10–20 cm depth, respectively. Fluctuations continued for about 90 days, but soil moisture was kept at a certain level during the growing season, benefiting from groundwater.

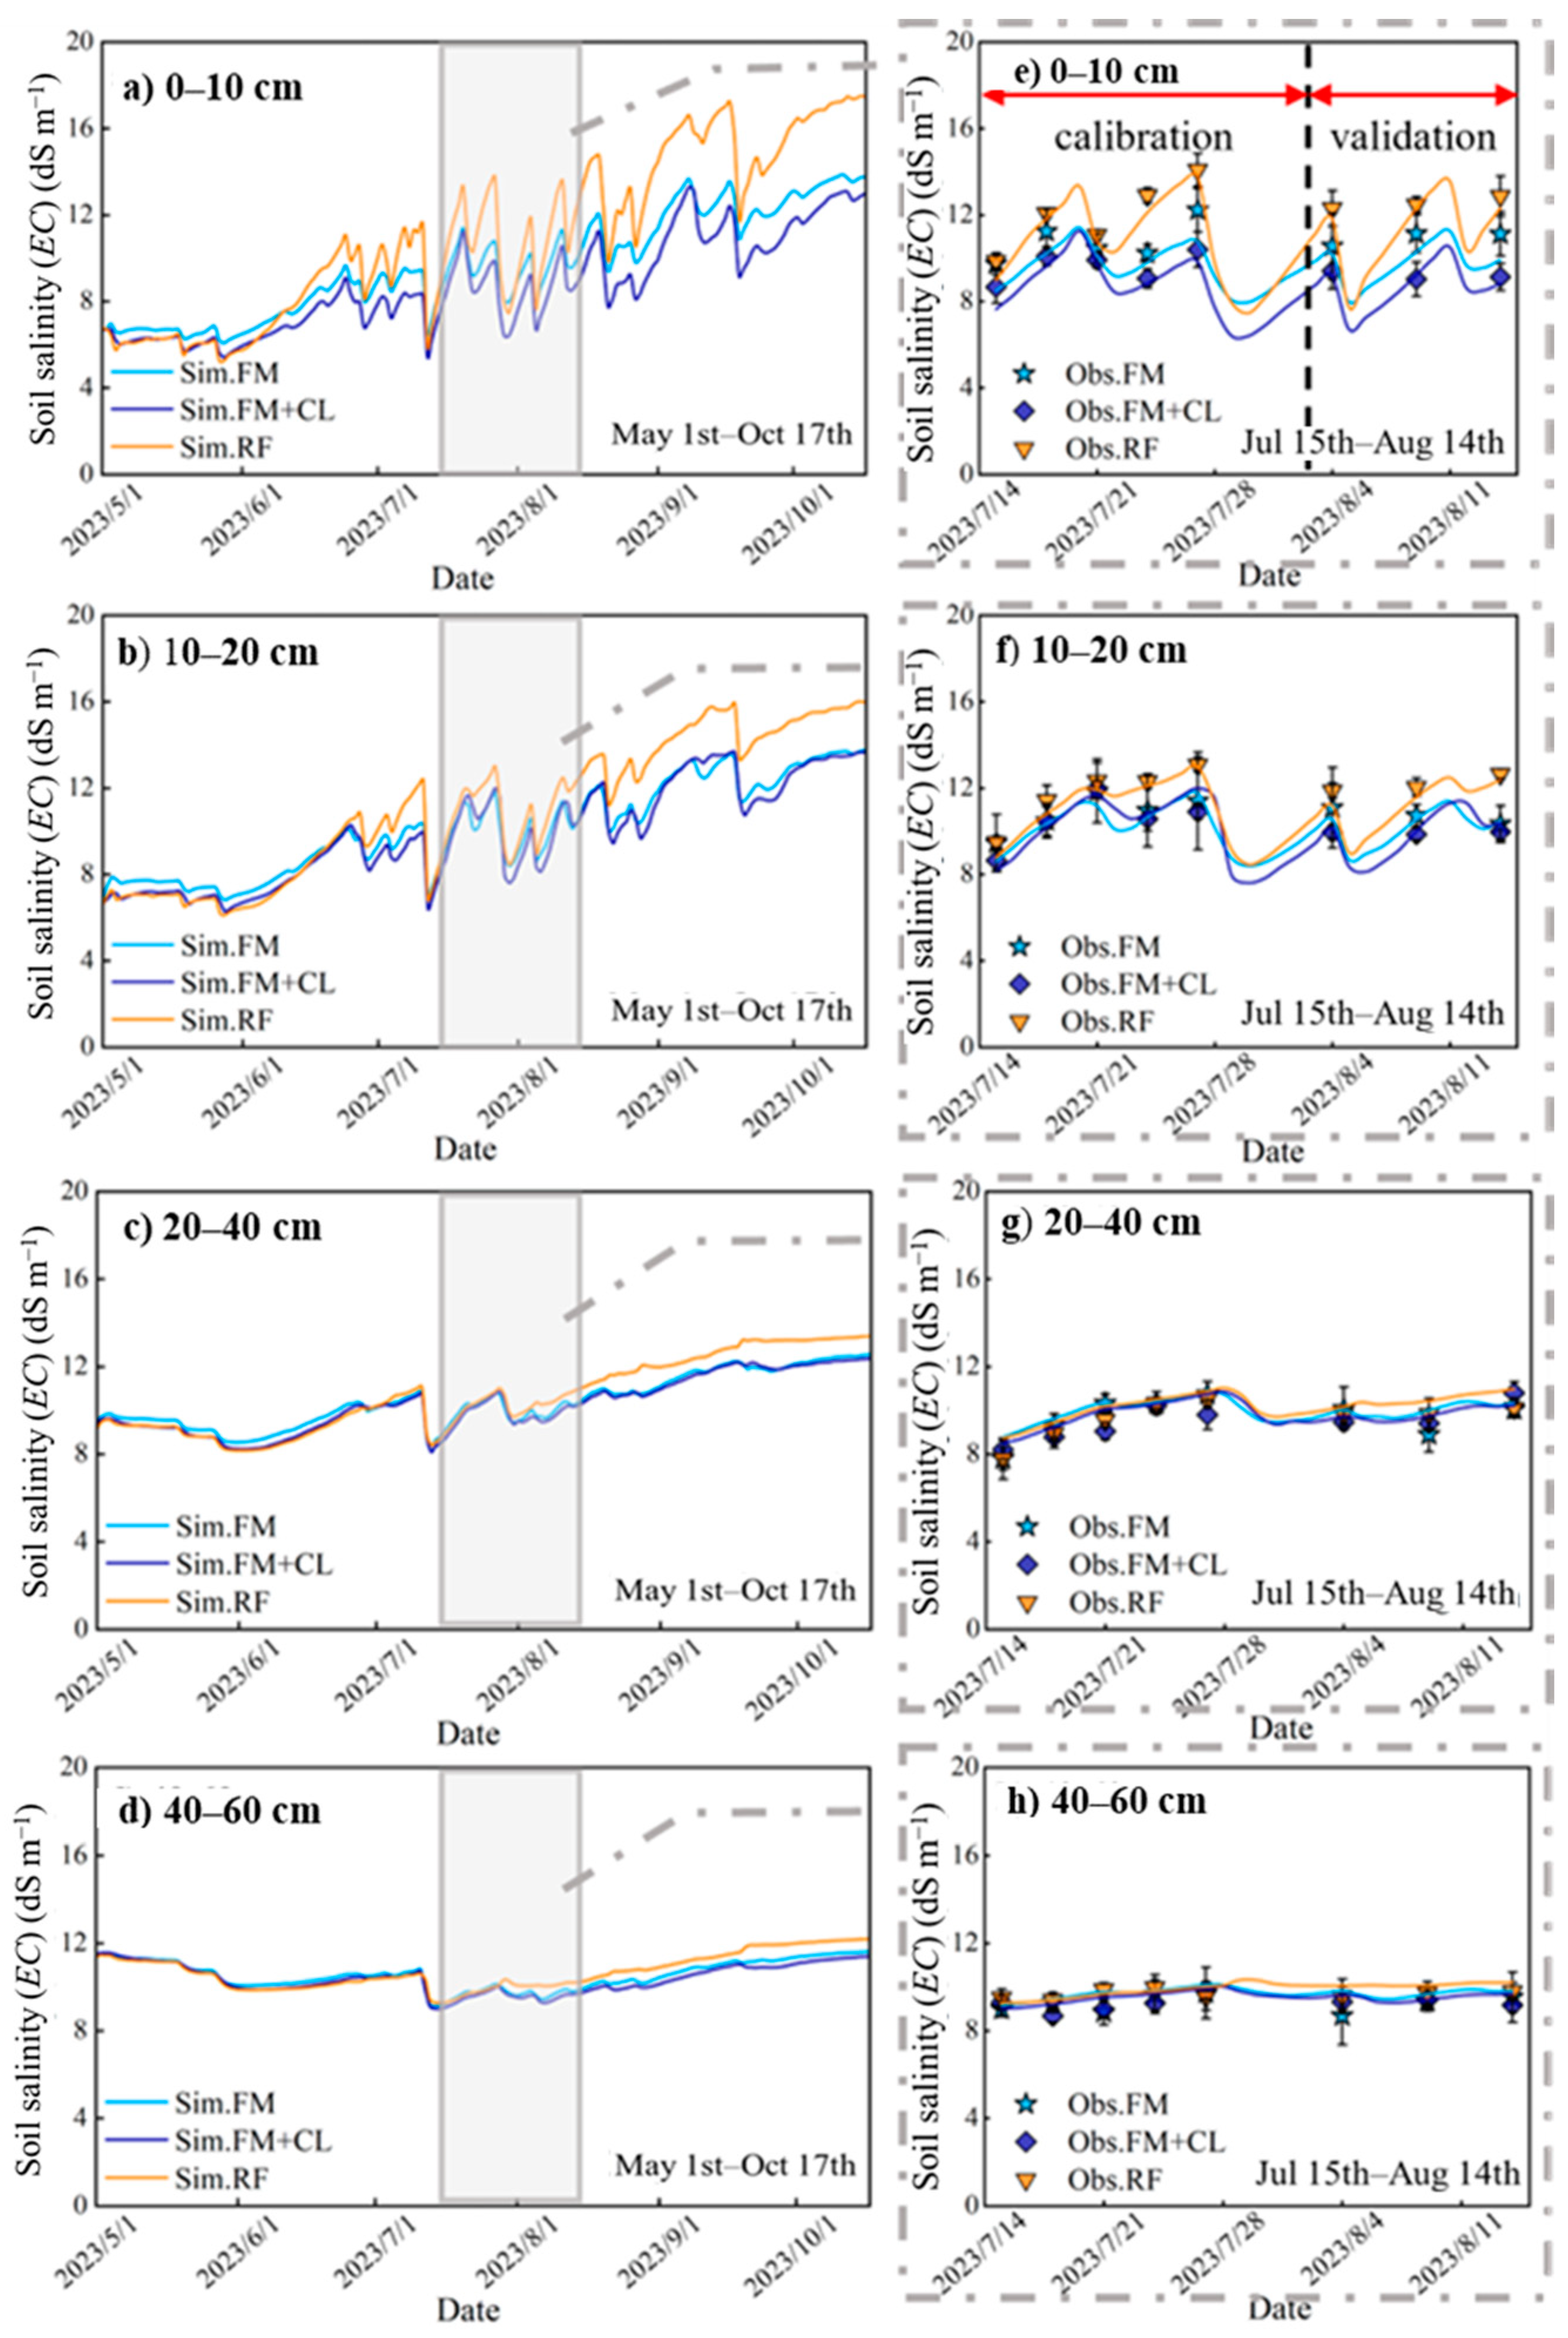
3.3. Changes in Soil Salinity

There were apparent EC differences in the 0–20 cm soil layer under different physical improvement measures, but only minor differences appeared in the 20–60 cm soil layer (Figure 5). In the early growth stage, soil evaporation and crop transpiration were relatively weak, and soil salinity at different depths remained remarkably stable. Due to the salt leaching before sowing, a lower EC appeared in the shallow soil layers. The deeper soil layers, being closer to the high-salinity groundwater and having accumulated a large amount of salt leached from the surface, exhibited a higher EC. After cotton entered the squaring stage, the rate of root water uptake was enhanced, leading to salt accumulation within the 0–40 cm soil layer. RF exhibited the fastest increase in EC in the shallow soil layers. Furthermore, due to the presence of the soil compaction layer, the soil salinity at the 0–10 cm depth in FM+CL was noticeably lower than that in FM and RF. During the flower boll stage, the area enters the rainy season, and frequent precipitation causes the soil salinity in the 0–20 cm depth to fluctuate sharply. Compared to RF, FM and FM+CL demonstrated a superior ability to curtail the accumulation of salts within the root zone. However, the leaching of soil salts due to precipitation was more pronounced under RF. Thus, the fluctuation in EC in the shallow soil layers in RF was larger than in FM and FM+CL during the measurement period, ranging from 5.898 to 14.673 dS m−1 and 6.838 to 13.414 dS m−1 at 0–10 cm and 10–20 cm depths, respectively (Figure 5e,f).
During the later growth stage, a significant increase in soil salinity was observed at the 0–20 cm depth, while soil salinity increased concurrently at the 20–60 cm depth. After cotton harvest, soil salinity in FM, FM+CL, and RF was 11.612–13.747, 11.391–12.977, and 12.188–17.446 dS m−1 at a 0–60 cm depth, respectively. In general, due to the absence of irrigation, soil salinity increased from sowing to harvest for all treatments, but the discrepancy was quite apparent among different treatments. As shown in Figure 7, ΔSS values were significantly lower under FM and FM+BL compared to RF; film mulching substantially slows down the accumulation rate of soil salinity in the root zone by reducing the area of soil evaporation. Soil compaction also positively affected the salt regulation during the cotton growth stage, particularly in the 0–10 cm soil layer. Compared to RF, the ΔSS in the 0–10, 10–20, 20–40, and 40–60 cm layers under FM+BL decreased by 80.5%, 53.0%, 23.8% and 14.6%, respectively. Thus, soil compaction is an effective physical improvement measurement in saline-affected fields, which can reduce salt accumulation in the root zone.

3.4. Actual Crop Transpiration and Water–Salt Stress

The simulation results for the total potential evapotranspiration (ETP), the total soil evapotranspiration (EP), the total potential transpiration (TP), and the actual total crop transpiration (TA) during the various cotton growth stages and the whole growing season simulated with the calibrated HYDRUS-2D model under different treatments are presented in Table 4. Affected by the different LAI values, cotton heights, and whether plastic film mulching at the soil surface was used or not, differences in Ep and Tp were identified. The lower EP in FM (15.1 mm) and FM+CL (14.3 mm) compared to RF (31.8 mm) in the seedling stage was mainly attributed to the plastic film mulching in both treatments, but the soil surface was bare in RF. In addition, the higher Tp identified in FM+CL (354.1 mm) compared to FM (349.7 mm) was associated with the larger LAI and taller height, which resulted in the larger ETP (447.3 mm) and higher partitioning of TP from ETP. Although the TP in RF was larger than in FM and FM+CL, the smallest TA was observed in RF. This could be mainly attributed to higher salt stress in the later growth stages, resulting in the lowest actual root water uptake in the boll opening stage under RF (99.2 mm).
In general, average relative transpiration rates (TA/TP) at different growth stages and under the different treatments were kept at a certain level; they were 0.88, 0.91, and 0.81 under FM, FM+CL, and RF, respectively. TA/TP was smallest at the boll opening stage under RF (0.73), and it was largely similar at the seedling stage under FM (0.99) and FM+CL (0.98). The water–salt stress in the three treatments mainly occurred in the boll opening stage. The highest TA/TP was observed in FM+CL (0.85), followed by FM (0.82) and RF (0.73), during the boll opening stage. Moreover, a smaller TA/TP was also observed during the seedling stage under RF (0.76), which could be attributed to the significantly higher soil evaporation (Ep) and water stress.

3.5. Influences of the Shallow Saline Groundwater on Crop Transpiration

This study analyzed the groundwater contribution to cotton transpiration by assigning the bottom boundary as a free drainage BC and assuming no groundwater influence (Table 5). When free drainage BC was used at the bottom boundary, the actual crop transpiration rates under FM, FM+CL, and RF were 302.3, 306.6, and 287.8 mm, these values being 2.2%, 4.0%, and 0.0% lower compared to shallow groundwater conditions. The negative values of ΔTA in Table 5 suggest that the shallow saline groundwater restricts crop transpiration rather than contributing to it. In the early and middle growth stages, salt stress is the main reason for the reduction in actual crop evapotranspiration. The soluble salt in groundwater will aggravate the root-zone salt accumulation and limit the root water uptake. However, in the later growth stage, water stress becomes the dominant factor, and shallow groundwater can alleviate the water stress in the root zone. In general, groundwater subsidies primarily occurred during the boll opening stage. These were 7.5, 11.9, and 3.9 mm under FM, FM+CL, and RF, respectively, and relatively minimal during the early and middle growth stages.
During the seedling stage, groundwater almost did not impact crop transpiration. During the squaring stage, groundwater even restricted the crop transpiration; the ΔTA values were −1.6, −0.8, and −1.1 mm under the three treatments, respectively. During the flower boll stage, ΔTA became positive due to the film mulching, and soil compaction effectively suppressed the soil salinity increase in the root zone. The values were 0.8 and 1.3 mm under FM and FM+CL, respectively. However, groundwater stress on crop transpiration became more severe under RF, with ΔTA being −1.9 mm. In the cotton growing season, the “groundwater subsidy” was most significant in FM+CL and was related to the ΔSS reduction in the root zone due to film mulching and soil compaction.

4. Discussion

4.1. Efficient Use of Water Resources

During the squaring and flower boll stage, precipitation and the crop transpiration rate significantly increase, and soil water content and salinity fluctuate with precipitation and evapotranspiration. However, due to the salt-tolerant and drought-resistant characteristics of cotton, TA remains very close to TP (Table 4). The average relative transpiration rate (TA/TP) serves as an indicator of the extent to which root water uptake is influenced by water–salt stress during various cotton growth stages; a lower TA/TP suggests that cotton yield may decrease due to water–salt stress. It is worth noting that due to the lack of film mulching, a much higher EP was observed in RF (Table 4), which led to an increase in nonproductive water, reducing the water use efficiency despite there being no irrigation during the experiment. Hence, film mulching is practical and necessary for saving water and suppressing salt in the YRD.
On a global scale, groundwater contributes about 23% to vegetation water consumption on average [47]. However, due to its high salinity, groundwater contributes little or even negatively to transpiration in irrigated agricultural or coastal areas with shallow water table depths [50]. Film mulching reduces evapotranspiration, and almost 70% of precipitation is concentrated from June to September, inhibiting the groundwater effect in the YRD. Furthermore, soil evaporation and changes in soil moisture are also influenced by shallow groundwater. In the soil water balance, groundwater plays a more significant role.
The conjunctive use of surface water and shallow saline groundwater shows great potential to guarantee agricultural production [25]. However, due to the discrepancy in the water and salt thresholds of various crops, the impacts of groundwater at the same depth and salinity on the root water uptake of different crops could be diametrically opposed. In the long term, shallow groundwater with high salinity will inevitably increase soil salinization in arid and semi-arid regions. Hence, to effectively utilize groundwater resources, it is necessary to continue exploring new strategies for improving saline soils in the YRD. Practices of cultivation and irrigation that lack rationality may precipitate a steep decline in the sustainability of saline–alkali agriculture. Moreover, shallow groundwater can induce excess evapotranspiration, negatively affecting the water use efficiency of farmland [48]. Regarding numerical modeling, the current water–salt transport mechanism model applies to unsaturated soil areas. Still, it is insufficient in saturated–unsaturated areas, and the influence of groundwater on plant function has not been clarified. Future research should include the fluctuation of the groundwater table and the varying salinity levels in heavily saline–alkali lands. Furthermore, parameterizing root water use functions and the numerical expression of the associated critical processes is highly challenging and necessary [51].

4.2. The Effects of Soil Compaction on Saline Agroecosystems

Soil compaction is defined as an increase in bulk density or a decrease in soil porosity due to externally or internally applied loads [52]. Soil compaction in agricultural fields is commonly caused by tillage equipment, livestock animal trampling, or the heavy weight of field equipment, such as tractors and harvesting equipment [53,54]. In modern agriculture, wheel traffic from heavy machinery can cause soil compaction, creating impermeable layers within the soil that restrict groundwater recharge and decrease hydraulic conductivity [55]. Therefore, soil compaction layers and salt barrier layers have a similar mechanism in suppressing the accumulation of salts from shallow saline groundwater to the root zone. Furthermore, the soil compaction layer continues to suppress the upward movement of salts from the groundwater during the nongrowing period. Prior to sowing in the subsequent year, a lower soil salinity implies the possibility of utilizing less freshwater for leaching purposes. This will further enhance the water use efficiency and sustainability of saline agriculture in the Yellow River Delta.
In most studies, subsoil compaction has been found to negatively affect soil physical conditions, substantially decreasing crop yields. Mainly, it is known that high soil penetration resistance and low oxygen concentrations in compacted soil can reduce crop yields due to decreased root elongation rates and thus limited accessibility of water and nutrients [56]. However, some studies have shown that moderate compaction should increase yield [57,58]. Moreover, Gürsoy and Türk [59] stated that moderate soil compaction in agriculture production was needed to increase crop yields and prevent soil moisture loss. In this study, the impact of soil compaction on root distribution and growth was not considered, which may have led to an underestimation of the discrepancy under different treatments. When we consider the impact of shallow saline groundwater on crop transpiration, whether soil compaction contributes to an increase in crop yield depends on whether the groundwater effect positively or negatively impacts crop growth.
Nevertheless, it is interesting to investigate the threshold of soil compaction for various climates, soil properties, frequencies of fertilization, and crop species. Additionally, it is worth noting that soil compaction is challenging to eliminate. Establishing soil compaction layers requires careful consideration of the threshold of the most “sensitive” crops in the rotation system or regional planting structures. Furthermore, soil compaction caused by heavy machinery exhibits a greater spatial heterogeneity than that caused by raindrops and tillage implements. Numerically expressing the associated critical processes and developing additional two-dimensional and three-dimensional mathematical models is an urgent and meaningful task [60].

4.3. Implications and Limitations of the Study

This study demonstrates that using film mulching and soil compaction techniques can effectively reduce salt accumulation in the root zone, thereby improving cotton yield and the sustainability of saline agriculture in the YRD. These methods, although requiring more labor and financial investment, are essential for reclaiming saline soils in this region. Given the scarcity of freshwater resources, converting saline lands into arable lands requires such effective measures to alleviate salt stress on crops and reduce the need for leaching water. The YRD’s geography is ideal for using modern agricultural machinery. Compacting soil with heavy machinery before sowing crops is a cost-effective and efficient way to create a compaction layer, reducing farmers’ workloads compared to traditional methods of creating salt barrier layers. The study recommends that the government should increase subsidies for agricultural machinery, develop specialized compaction machinery, provide technical manuals, and organize farmer training to encourage widespread adoption of these techniques in the YRD.
Plastic film is commonly used as mulch in the YRD, offering significant economic benefits for agriculture [61,62]. However, its recycling is costly and challenging, leading to soil contamination with plastic residues [63]. Excessive plastic residues negatively affect soil and agricultural productivity [64]. Alternatives like biodegradable film, crop straw, and sand or gravel are more environmentally friendly but less used due to traditional practices and cost factors. To enhance sustainable agriculture in the YRD, policy changes and subsidies are needed to encourage the use of these eco-friendly materials over plastic film. The effectiveness of film mulching varies with factors like the mulching area, crop type, climate, and irrigation methods, suggesting it has potential for better soil water and salt regulation.
This study utilized the HYDRUS-2D model, calibrated with observed data, to accurately represent soil water and salinity changes in the root zone during cotton growth. However, the study acknowledges certain limitations. Firstly, the experiments at the Dongying Base and the HYDRUS-2D simulations did not account for soil condition variability in the YRD. Secondly, the impact of physical measures on the spatiotemporal distribution of water and salt in the root zone and their potential positive or negative effects in other saline agricultural regions with differing conditions and management practices remains unclear. Thirdly, the model assumed a constant shallow groundwater depth and salinity and did not account for dynamic responses to rainfall or evaporation, deviating from real-world conditions. The use of hydrological models incorporating groundwater dynamics, digital soil maps [65], ArcGIS [66], and machine learning [67] to better evaluate these physical measures on a regional scale is suggested for future research.

5. Conclusions

Both field plot experiments and HYDRUS-2D were used to evaluate the effects of different physical improvement measures on water–salt control in saline agriculture. The results showed that film mulch significantly affected soil water conservation; soil evaporation, especially, was reduced considerably in the early growth stage. With salt leaching before sowing, the water uptake of cotton roots was almost unaffected by water–salt stress during the cotton growth stage under the FM+CL treatment. Soil compaction layers play a significant role in inhibiting salt accumulation. Compared to traditional physical improvement methods, covering soil with film and compacting the soil with heavy machinery prior to cotton sowing is an economical and efficient method for improving saline agriculture. It can effectively reduce water and salt stress on crop growth to increase cotton yields without additional freshwater resources in saline areas of the YRD. The accuracy and effectiveness of field data utilized in testing the model are crucial for the validity of the conclusion. The current study was constrained by the brief observation period of the field experiment and would have benefited from its being extended to cover another growing period. Additionally, we recognize the constraint regarding whether the assessment of these physical measures by the model is applicable across other saline agricultural regions with varying environmental conditions and management practices.

Author Contributions

Conceptualization, Y.Z.; methodology, H.W. and Y.Z.; validation, W.F.; formal analysis, W.F. and J.Y.; investigation, W.F. and J.Y.; resources, Y.Z.; data curation, W.F. and H.W.; writing—original draft preparation, W.F.; writing—review and editing, W.F., J.Y., H.W., Q.H. and Y.Z.; visualization, W.F.; supervision, H.W. and Y.Z.; project administration, Y.Z.; funding acquisition, Y.Z. All authors have read and agreed to the published version of the manuscript.

Funding

This research was funded by the Key Program of the National Natural Science Foundation of China (42320104006); the Taishan Scholars Youth Expert Program, China (201812096); and the National Natural Foundation of Shandong Province (ZR2021MD036).

Data Availability Statement

All data reported here are available from the authors upon request.

Acknowledgments

The authors would like to acknowledge the Laboratory of Coastal Ecohydrological Processes and Environment Security, Ludong University, for providing measurement instruments. The authors appreciate Xuxu Guo for field work at the Dongying Base for Industry–Education Integration for Quality Development of Modern Agriculture of Ludong University.

Conflicts of Interest

The authors declare no conflicts of interest.

References

  1. Ferguson, C.R.; Pan, M.; Oki, T. The Effect of Global Warming on Future Water Availability: CMIP5 Synthesis. Water Resour. Res. 2018, 54, 7791–7819. [Google Scholar] [CrossRef]
  2. Oki, T. Water Resources Management and Adaptation to Climate Change. In Water Security, Climate Change and Sustainable Development; Biswas, A.K., Tortajada, C., Eds.; Water Resources Development and Management; Springer: Singapore, 2016; pp. 27–40. [Google Scholar]
  3. Piao, S.; Ciais, P.; Huang, Y.; Shen, Z.; Peng, S.; Li, J.; Zhou, L.; Liu, H.; Ma, Y.; Ding, Y.; et al. The Impacts of Climate Change on Water Resources and Agriculture in China. Nature 2010, 467, 43–51. [Google Scholar] [CrossRef]
  4. Ghose, B. Food Security and Food Self-sufficiency in China: From Past to 2050. Food Energy Secur. 2014, 3, 86–95. [Google Scholar] [CrossRef]
  5. Qiao, L.; Wang, X.; Smith, P.; Fan, J.; Lu, Y.; Emmett, B.; Li, R.; Dorling, S.; Chen, H.; Liu, S.; et al. Soil Quality Both Increases Crop Production and Improves Resilience to Climate Change. Nat. Clim. Chang. 2022, 12, 574–580. [Google Scholar] [CrossRef]
  6. Xie, W.; Zhu, A.; Ali, T.; Zhang, Z.; Chen, X.; Wu, F.; Huang, J.; Davis, K.F. Crop Switching Can Enhance Environmental Sustainability and Farmer Incomes in China. Nature 2023, 616, 300–305. [Google Scholar] [CrossRef]
  7. Zhou, Y.; Li, X.; Liu, Y. Cultivated Land Protection and Rational Use in China. Land Use Policy 2021, 106, 105454. [Google Scholar] [CrossRef]
  8. Zhang, B.; Wang, R.; Deng, Y.; Ma, P.; Lin, H.; Wang, J. Mapping the Yellow River Delta Land Subsidence with Multitemporal SAR Interferometry by Exploiting Both Persistent and Distributed Scatterers. ISPRS J. Photogramm. Remote Sens. 2019, 148, 157–173. [Google Scholar] [CrossRef]
  9. Wei, Z.; Jian, Z.; Sun, Y.; Pan, F.; Han, H.; Liu, Q.; Mei, Y. Ecological Sustainability and High-Quality Development of the Yellow River Delta in China Based on the Improved Ecological Footprint Model. Sci. Rep. 2023, 13, 3821. [Google Scholar] [CrossRef]
  10. Zhu, W.; Yang, J.; Yao, R.; Xie, W.; Wang, X.; Liu, Y. Soil Water-Salt Control and Yield Improvement under the Effect of Compound Control in Saline Soil of the Yellow River Delta, China. Agric. Water Manag. 2022, 263, 107455. [Google Scholar] [CrossRef]
  11. Ye, Q.; Liu, G.; Tian, G.; Chen, S.; Huang, C.; Chen, S.; Liu, Q.; Chang, J.; Shi, Y. Geospatial-Temporal Analysis of Land-Use Changes in the Yellow River Delta during the Last 40 Years. Sci. China Ser. D-Earth Sci. 2004, 47, 1008–1024. [Google Scholar] [CrossRef]
  12. Zhang, Y.; Yang, P.; Liu, J.; Zhang, X.; Zhao, Y.; Zhang, Q.; Li, L. Sustainable Agricultural Water Management in the Yellow River Basin, China. Agric. Water Manag. 2023, 288, 108473. [Google Scholar] [CrossRef]
  13. Che, Z.; Wang, J.; Li, J. Modeling Strategies to Balance Salt Leaching and Nitrogen Loss for Drip Irrigation with Saline Water in Arid Regions. Agric. Water Manag. 2022, 274, 107943. [Google Scholar] [CrossRef]
  14. Zhu, W.; Yang, J.; Yao, R.; Wang, X.; Xie, W.; Li, P. Nitrate Leaching and NH3 Volatilization during Soil Reclamation in the Yellow River Delta, China. Environ. Pollut. 2021, 286, 117330. [Google Scholar] [CrossRef]
  15. Zhao, Y.; Li, Y.; Wang, J.; Pang, H.; Li, Y. Buried Straw Layer plus Plastic Mulching Reduces Soil Salinity and Increases Sunflower Yield in Saline Soils. Soil Tillage Res. 2016, 155, 363–370. [Google Scholar] [CrossRef]
  16. Dong, S.; Wang, G.; Kang, Y.; Ma, Q.; Wan, S. Soil Water and Salinity Dynamics under the Improved Drip-Irrigation Scheduling for Ecological Restoration in the Saline Area of Yellow River Basin. Agric. Water Manag. 2022, 264, 107255. [Google Scholar] [CrossRef]
  17. Bezborodov, G.A.; Shadmanov, D.K.; Mirhashimov, R.T.; Yuldashev, T.; Qureshi, A.S.; Noble, A.D.; Qadir, M. Mulching and Water Quality Effects on Soil Salinity and Sodicity Dynamics and Cotton Productivity in Central Asia. Agric. Ecosyst. Environ. 2010, 138, 95–102. [Google Scholar] [CrossRef]
  18. Yi, J.; Li, H.; Zhao, Y.; Shao, M.; Zhang, H.; Liu, M. Assessing Soil Water Balance to Optimize Irrigation Schedules of Flood-Irrigated Maize Fields with Different Cultivation Histories in the Arid Region. Agric. Water Manag. 2022, 265, 107543. [Google Scholar] [CrossRef]
  19. Li, H.; Zeng, S.; Luo, X.; Fang, L.; Liang, Z.; Yang, W. Effects of Small Ridge and Furrow Mulching Degradable Film on Dry Direct Seeded Rice. Sci. Rep. 2021, 11, 317. [Google Scholar] [CrossRef]
  20. Liao, Z.; Zhang, K.; Fan, J.; Li, Z.; Zhang, F.; Wang, X.; Wang, H.; Cheng, M.; Zou, Y. Ridge-Furrow Plastic Mulching and Dense Planting with Reduced Nitrogen Improve Soil Hydrothermal Conditions, Rainfed Soybean Yield and Economic Return in a Semi-Humid Drought-Prone Region of China. Soil Tillage Res. 2022, 217, 105291. [Google Scholar] [CrossRef]
  21. Simunek, J.J.; Šejna, M.; Van Genuchten, M. The HYDRUS-2D Software Package for Simulating Water Flow and Solute Transport in Two Dimensional Variably Saturated Media, Version 2.0; U.S. Department of Agriculture: Riverside, CA, USA, 1998.
  22. Qi, Z.; Feng, H.; Zhao, Y.; Zhang, T.; Yang, A.; Zhang, Z. Spatial Distribution and Simulation of Soil Moisture and Salinity under Mulched Drip Irrigation Combined with Tillage in an Arid Saline Irrigation District, Northwest China. Agric. Water Manag. 2018, 201, 219–231. [Google Scholar] [CrossRef]
  23. Singh, R.; Singh, J. Irrigation Planning in Cotton through Simulation Modeling. Irrig. Sci. 1996, 17, 31–36. [Google Scholar] [CrossRef]
  24. Zhang, Y.; Li, X.; Šimůnek, J.; Shi, H.; Chen, N.; Hu, Q. Optimizing Drip Irrigation with Alternate Use of Fresh and Brackish Waters by Analyzing Salt Stress: The Experimental and Simulation Approaches. Soil Tillage Res. 2022, 219, 105355. [Google Scholar] [CrossRef]
  25. Hu, Q.; Zhao, Y.; Hu, X.; Qi, J.; Suo, L.; Pan, Y.; Song, B.; Chen, X. Effect of Saline Land Reclamation by Constructing the “Raised Field -Shallow Trench” Pattern on Agroecosystems in Yellow River Delta. Agric. Water Manag. 2022, 261, 107345. [Google Scholar] [CrossRef]
  26. Han, G.; Chu, X.; Xing, Q.; Li, D.; Yu, J.; Luo, Y.; Wang, G.; Mao, P.; Rafique, R. Effects of Episodic Flooding on the Net Ecosystem CO 2 Exchange of a Supratidal Wetland in the Yellow River Delta. JGR Biogeosci. 2015, 120, 1506–1520. [Google Scholar] [CrossRef]
  27. Han, G.; Sun, B.; Chu, X.; Xing, Q.; Song, W.; Xia, J. Precipitation Events Reduce Soil Respiration in a Coastal Wetland Based on Four-Year Continuous Field Measurements. Agric. For. Meteorol. 2018, 256–257, 292–303. [Google Scholar] [CrossRef]
  28. Yu, J.; Li, Y.; Han, G.; Zhou, D.; Fu, Y.; Guan, B.; Wang, G.; Ning, K.; Wu, H.; Wang, J. The Spatial Distribution Characteristics of Soil Salinity in Coastal Zone of the Yellow River Delta. Environ. Earth Sci 2014, 72, 589–599. [Google Scholar] [CrossRef]
  29. Tong, W.J. Study on Salt Tolerance of Crop and Cropping System Optimization in Hetao Irrigation District; China Agricultural University: Beijing, China, 2014. [Google Scholar]
  30. Dong, H.; Xin, C.; Li, W.; Tan, W.; Zhang, D.; Luo, Z. Characteristics of Salinity and Fertility in Coastal Saline Cotton Fields in Shandong and Their Effects on Cotton Emergence. Cotton Sci. 2009, 21, 290–295. [Google Scholar]
  31. Allen, R.G.; Pereira, L.S.; Raes, D.; Smith, M. Crop Evapotranspiration—Guidelines for Computing Crop Water Requirement; FAO Irrigation and Drainage Paper 56; FAO: Rome, Italy, 1998; Volume 300, p. D05109. [Google Scholar]
  32. Hansson, K.; Šimůnek, J.; Mizoguchi, M.; Lundin, L.; Genuchten, M.T. van Water Flow and Heat Transport in Frozen Soil: Numerical Solution and Freeze–Thaw Applications. Vadose Zone J. 2004, 3, 693–704. [Google Scholar]
  33. Van Genuchten, M.T. A Closed-form Equation for Predicting the Hydraulic Conductivity of Unsaturated Soils. Soil Sci. Soc. Am. J. 1980, 44, 892–898. [Google Scholar] [CrossRef]
  34. Schaap, M.G.; Leij, F.J.; Van Genuchten, M.T. Rosetta: A Computer Program for Estimating Soil Hydraulic Parameters with Hierarchical Pedotransfer Functions. J. Hydrol. 2001, 251, 163–176. [Google Scholar] [CrossRef]
  35. Feddes, R.A.; Kowalik, P.J.; Zaradny, H. Simulation of Field Water Use and Crop Yield; Centre for Agricultural Publishing and Documentation: Wageningen, The Netherlands, 1978; pp. 194–209. [Google Scholar]
  36. Šimůnek, J.; Hopmans, J.W. Modeling Compensated Root Water and Nutrient Uptake. Ecol. Model. 2009, 220, 505–521. [Google Scholar] [CrossRef]
  37. Vrugt, J.A.; Hopmans, J.W.; Šimunek, J. Calibration of a Two-Dimensional Root Water Uptake Model. Soil Sci. Soc Am. J. 2001, 65, 1027–1037. [Google Scholar] [CrossRef]
  38. Van Genuchten, M.T.; U.S. Salinity Laboratory. A Numerical Model for Water and Solute Movement in and Below the Root Zone; United States Department of Agriculture Agricultural Research Service U.S. Salinity Laboratory: Riverside, CA, USA, 1987.
  39. Maas, E.V.; Hoffman, G.J. Crop Salt Tolerance—Current Assessment. J. Irrig. Drain. Div. 1977, 103, 115–134. [Google Scholar] [CrossRef]
  40. Ritchie, J.T. Model for Predicting Evaporation from a Row Crop with Incomplete Cover. Water Resour. Res. 1972, 8, 1204–1213. [Google Scholar] [CrossRef]
  41. Hu, Q.; Yang, Y.; Han, S.; Yang, Y.; Ai, Z.; Wang, J.; Ma, F. Identifying Changes in Irrigation Return Flow with Gradually Intensified Water-Saving Technology Using HYDRUS for Regional Water Resources Management. Agric. Water Manag. 2017, 194, 33–47. [Google Scholar] [CrossRef]
  42. Zhao, Y.; Zhai, X.; Wang, Z.; Li, H.; Jiang, R.; Lee Hill, R.; Si, B.; Hao, F. Simulation of Soil Water and Heat Flow in Ridge Cultivation with Plastic Film Mulching System on the Chinese Loess Plateau. Agric. Water Manag. 2018, 202, 99–112. [Google Scholar] [CrossRef]
  43. Šimůnek, J.; Van Genuchten, M.T.; Jacques, D.; Hopmans, J.W.; Inoue, M.; Flury, M. 6.6 Solute Transport during Variably Saturated Flow-Inverse Methods. In Methods of Soil Analysis: Part 4 Physical Methods; Dane, J.H., Clarke Topp, G., Eds.; SSSA Book Series; Soil Science Society of America: Madison, WI, USA, 2018; pp. 1435–1449. [Google Scholar]
  44. Guo, L.; Wang, Z.; Šimůnek, J.; He, Y.; Muhamma, R. Optimizing the Strategies of Mulched Brackish Drip Irrigation under a Shallow Water Table in Xinjiang, China, Using HYDRUS-3D. Agric. Water Manag. 2023, 283, 108303. [Google Scholar] [CrossRef]
  45. Du, J.; Wang, X.; Huo, Z.; Guan, H.; Xiong, Y.; Huang, G. Response of Shelterbelt Transpiration to Shallow Groundwater in Arid Areas. J. Hydrol. 2021, 592, 125611. [Google Scholar] [CrossRef]
  46. Rassam, D.W.; Pagendam, D.E.; Hunter, H.M. Conceptualisation and Application of Models for Groundwater–Surface Water Interactions and Nitrate Attenuation Potential in Riparian Zones. Environ. Model. Softw. 2008, 23, 859–875. [Google Scholar] [CrossRef]
  47. Zhao, Y.; Qi, J.; Hu, Q.; Wang, Y. The “Groundwater Benefit Zone”, Proposals, Contributions and New Scientific Issues. In Soil Science—Emerging Technologies, Global Perspectives and Applications; Aide, M., Braden, I., Eds.; IntechOpen: London, UK, 2022. [Google Scholar]
  48. Rong, Y.; Dai, X.; Wang, W.; Wu, P.; Huo, Z. Dependence of Evapotranspiration Validity on Shallow Groundwater in Arid Area-a Three Years Field Observation Experiment. Agric. Water Manag. 2023, 286, 108411. [Google Scholar] [CrossRef]
  49. Lowry, C.S.; Loheide, S.P. Groundwater-dependent Vegetation: Quantifying the Groundwater Subsidy. Water Resour. Res. 2010, 46, 2009WR008874. [Google Scholar] [CrossRef]
  50. Gao, X.; Huo, Z.; Qu, Z.; Xu, X.; Huang, G.; Steenhuis, T.S. Modeling Contribution of Shallow Groundwater to Evapotranspiration and Yield of Maize in an Arid Area. Sci. Rep. 2017, 7, 43122. [Google Scholar] [CrossRef]
  51. Soylu, M.E.; Loheide, S.P.; Kucharik, C.J. Effects of Root Distribution and Root Water Compensation on Simulated Water Use in Maize Influenced by Shallow Groundwater. Vadose Zone J. 2017, 16, 1–15. [Google Scholar] [CrossRef]
  52. Gürsoy, S. Soil Compaction Due to Increased Machinery Intensity in Agricultural Production: Its Main Causes, Effects and Management. In Technology in Agriculture; Ahmad, F., Sultan, M., Eds.; IntechOpen: London, UK, 2021. [Google Scholar]
  53. Batey, T. Soil Compaction and Soil Management—A Review. Soil Use Manag. 2009, 25, 335–345. [Google Scholar] [CrossRef]
  54. Hamza, M.A.; Anderson, W.K. Soil Compaction in Cropping Systems. Soil Tillage Res. 2005, 82, 121–145. [Google Scholar] [CrossRef]
  55. Shaheb, M.R.; Venkatesh, R.; Shearer, S.A. A Review on the Effect of Soil Compaction and Its Management for Sustainable Crop Production. J. Biosyst. Eng. 2021, 46, 417–439. [Google Scholar] [CrossRef]
  56. Colombi, T.; Keller, T. Developing Strategies to Recover Crop Productivity after Soil Compaction—A Plant Eco-Physiological Perspective. Soil Tillage Res. 2019, 191, 156–161. [Google Scholar] [CrossRef]
  57. Sivarajan, S.; Maharlooei, M.; Bajwa, S.G.; Nowatzki, J. Impact of Soil Compaction Due to Wheel Traffic on Corn and Soybean Growth, Development and Yield. Soil Tillage Res. 2018, 175, 234–243. [Google Scholar] [CrossRef]
  58. Moraes, M.T.D.; Debiasi, H.; Franchini, J.C.; Mastroberti, A.A.; Levien, R.; Leitner, D.; Schnepf, A. Soil Compaction Impacts Soybean Root Growth in an Oxisol from Subtropical Brazil. Soil Tillage Res. 2020, 200, 104611. [Google Scholar] [CrossRef]
  59. Gürsoy, S.; Türk, Z. Effects of Land Rolling on Soil Properties and Plant Growth in Chickpea Production. Soil Tillage Res. 2019, 195, 104425. [Google Scholar] [CrossRef]
  60. Mileusnić, Z.I.; Saljnikov, E.; Radojević, R.L.; Petrović, D.V. Soil Compaction Due to Agricultural Machinery Impact. J. Terramech. 2022, 100, 51–60. [Google Scholar] [CrossRef]
  61. Salama, K.; Geyer, M. Plastic Mulch Films in Agriculture: Their Use, Environmental Problems, Recycling and Alternatives. Environments 2023, 10, 179. [Google Scholar] [CrossRef]
  62. Yang, H.; Hu, Z.; Wu, F.; Guo, K.; Gu, F.; Cao, M. The Use and Recycling of Agricultural Plastic Mulch in China: A Review. Sustainability 2023, 15, 15096. [Google Scholar] [CrossRef]
  63. Chen, N.; Li, X.; Šimůnek, J.; Shi, H.; Ding, Z.; Zhang, Y. The Effects of Biodegradable and Plastic Film Mulching on Nitrogen Uptake, Distribution, and Leaching in a Drip-Irrigated Sandy Field. Agric. Ecosyst. Environ. 2020, 292, 106817. [Google Scholar] [CrossRef]
  64. Huang, Y.; Liu, Q.; Jia, W.; Yan, C.; Wang, J. Agricultural Plastic Mulching as a Source of Microplastics in the Terrestrial Environment. Environ. Pollut. 2020, 260, 114096. [Google Scholar] [CrossRef]
  65. Horta, A.; Oliveira, A.R.; Azevedo, L.; Ramos, T.B. Assessing the Use of Digital Soil Maps in Hydrological Modeling for Soil-Water Budget Simulations—Implications for Water Management Plans in Southern Portugal. Geoderma Reg. 2024, 36, e00741. [Google Scholar] [CrossRef]
  66. Anlauf, R.; Schaefer, J.; Kajitvichyanukul, P. Coupling HYDRUS-1D with ArcGIS to Estimate Pesticide Accumulation and Leaching Risk on a Regional Basis. J. Environ. Manag. 2018, 217, 980–990. [Google Scholar] [CrossRef]
  67. Nguyen, K.A.; Chen, W.; Lin, B.-S.; Seeboonruang, U. Comparison of Ensemble Machine Learning Methods for Soil Erosion Pin Measurements. Int. J. Geo-Inf. 2021, 10, 42. [Google Scholar] [CrossRef]
Figure 1. (a) Locations of the Yellow River Delta and the experiment site. (b) The experimental plot and small meteorological station layout status. (The different numbers represent each of six treatments and one control in this long-term field experiment, the “x” represents the plots used for other experiments not applicable to this study).
Water 16 00719 g001
Figure 2. Schematic diagram of the major hydrological processes under different physical measures. (a) plastic film mulching; (b) plastic film mulching with an added soil compaction layer; (c) ridge-furrow planting.
Water 16 00719 g002
Figure 3. Precipitation, potential soil evaporation rate (Ep), and potential transpiration rate (Tp) during the growing season under different treatments.
Water 16 00719 g003
Figure 4. Soil water content dynamic during the growing season (ad) and the measurement period (eh). The shaded areas represent measurement periods from 15 July to 14 August, which are enlarged in the figures on the right-hand side.
Water 16 00719 g004
Figure 5. Soil salinity dynamic during the growing season (ad) and the measurement period (eh). The shaded areas represent measurement periods from 15 July to 14 August, which are enlarged in the figures on the right-hand side.
Water 16 00719 g005
Figure 6. Comparison between observed and simulated soil water content and soil salinity under three treatments during the measurement period from 15 July to 14 August.
Water 16 00719 g006
Figure 7. The change process of ΔSS in different soil layers during the cotton growth stage under different treatments. (a) plastic film mulching; (b) plastic film mulching with an added soil compaction layer; (c) ridge-furrow planting.
Water 16 00719 g007
Table 1. Soil basic physical properties of the different layers.
DepthTexture (%)ρbSoil Texture
(cm)SandSiltClay(g cm−3)
0–4059.6734.815.521.36Sand loam
40–8019.3471.479.191.41Silt loam
80–15014.9168.3016.691.44Silt loam
11–28 (CL) *57.5135.477.021.48Sand loam
Note: * The CL (compaction layer) was added in the FM+CL treatment.
Table 2. The soil hydraulic parameters and solute transport parameters of different soil layers.
DepthθrθsαnKsDLDTDw
(cm)(cm3 cm−3)(cm3 cm−3)(cm−1)(-)(cm d−1)(cm)(cm)(cm2 d−1)
0–400.03450.3840.02341.4470.72484.22.02
40–800.04540.3860.00591.6649.82383.31.62
80–1500.07480.4830.00581.6223.58313.51.60
11–28
(CL)
0.03280.3600.02841.4331.72443.82.51
Table 3. Statistical parameters of model performance compared with observed values.
Depth (cm) Calibration (July 2023)Validation (August 2023)
SWC (cm3 cm−3)EC (dS m−1)SWC (cm3 cm−3)EC (dS m−1)
0–10RMSE0.0160.5420.0190.525
R20.9580.6560.9370.621
10–20RMSE0.0210.5580.0240.561
R20.9620.7210.9490.618
20–40RMSE0.0110.5240.0120.511
R20.9780.7780.9660.702
40–60RMSE0.0120.4930.0090.322
R20.9810.8190.9770.867
Table 4. The model values for total potential evapotranspiration (ETP), total potential transpiration (TP), total soil evaporation (EP), actual crop transpiration (TA), and average relative transpiration (TA/TP) during the various cotton growth stages and the whole growing season under the different treatments. P is precipitation.
TreatmentGrowth StageP (mm)EP (mm)TP (mm)ETP (mm)TA (mm)TA/TP
FMSeedling48.615.14.019.14.00.99
Squaring50.221.246.767.943.90.94
Flower boll176.427.1163.8190.9150.40.92
Boll opening84.530.5135.2165.8110.70.82
Total359.793.9349.7443.6308.90.88
FM+CLSeedling48.614.34.118.44.00.98
Squaring50.221.347.769.044.80.94
Flower boll176.427.1165.7192.8154.10.93
Boll opening84.530.5136.6167.1116.10.85
Total359.793.2354.1447.3319.00.91
RFSeedling48.631.86.838.65.10.76
Squaring50.222.849.171.941.70.85
Flower boll176.427.2164.4191.6142.60.87
Boll opening84.530.7135.8166.699.20.73
Total359.7112.5356.2468.7288.60.81
Table 5. The groundwater contribution to cotton transpiration during the growth stage under different treatments.
TreatmentGrowth StageTPVariable Head BCFree Drainage BCΔTA *
(mm)TA (mm)TA/TPTA (mm)TA/TP(mm)
FMSeedling4.04.00.994.00.990.0
Squaring46.743.90.9445.50.97−1.6
Flower boll163.8150.40.92149.60.910.8
Boll opening135.2110.70.82103.20.767.5
Total349.7308.90.88302.30.866.6
FM+CLSeedling4.14.00.984.00.990.0
Squaring47.744.80.9445.60.98−0.8
Flower boll165.7154.10.93152.80.931.3
Boll opening136.6116.10.85104.20.7711.9
Total354.1319.00.91306.60.8812.4
RFSeedling6.85.10.765.20.77−0.1
Squaring49.141.70.8542.80.87−1.1
Flower boll164.4142.60.87144.50.88−1.9
Boll opening135.899.20.7395.30.703.9
Total356.2288.60.81287.80.810.8
Note: * ΔTA, the difference in total actual crop transpiration under variable head BC and free drainage BC.
Disclaimer/Publisher’s Note: The statements, opinions and data contained in all publications are solely those of the individual author(s) and contributor(s) and not of MDPI and/or the editor(s). MDPI and/or the editor(s) disclaim responsibility for any injury to people or property resulting from any ideas, methods, instructions or products referred to in the content.

