Article

Assessing Riverbank Change Caused by Sand Mining and Waste Disposal Using Web-Based Volunteered Geographic Information

1
Department of Remote Sensing & GIS, Kharazmi University, Tehran 1571914911, Iran
2
Department of Environmental Engineering, University of Tehran, Tehran 1417853111, Iran
3
Faculty of Science and Technology, Athabasca University, Athabasca, AB T9S 3A3, Canada
4
Dubai Campus, Heriot-Watt University, Dubai P.O. Box 38103, United Arab Emirates
5
Department of Civil and Environmental Engineering, Utah Water Research Laboratory, Utah State University, Logan, UT 84321, USA
*
Author to whom correspondence should be addressed.
Water 2024, 16(5), 734; https://doi.org/10.3390/w16050734
Submission received: 11 January 2024 / Revised: 23 February 2024 / Accepted: 25 February 2024 / Published: 29 February 2024

Abstract

:
River water is one of the most important natural resources for economic development and environmental sustainability. However, river water systems are vulnerable in some of the densely populated regions across the globe. Intense sand mining and waste disposal can lead to river changes, loose foundations, and biodiversity loss. This study aims to develop a web-based geographic information system (GIS) platform to monitor river channel changes and their impacts on river environments due to sand mining and waste burial. The system integrates open-source software, Windows Server 2012, a web server, and PostgreSQL with PostGIS plugins for efficient mapping and storage of geospatial data and volunteered reporting of location events. Interferometric methods, including SNAP2STAMPS Automated Algorithm, persistent scatterer interferometry (PSI), small baseline subset (SBAS), and Snap software, were used to analyze spatial changes of subsidence from Sentinel-1 satellite data from 2021 to 2023 in the Gadar River in Oshnavieh, Iran. The results showed that the maximum subsidence at the riverbank was −10.1 cm due to sand mining, and the maximum uplift was 8.2 cm due to waste landfilling. The average subsidence was reported to be −5.1 cm. The results emphasize spatial analysis, showcasing material mining’s impact on subsidence trends and underscoring the significance of public participation in monitoring river health. Three parameters—completeness, correctness, and quality—were used to validate the system. Validation results showed completeness, correctness, and quality rates of 94.15%, 92.48%, and 86.63%, respectively.

1. Introduction

Rivers are the lifeblood of our planet, nurturing ecosystems, socioeconomic development, and civilizations [1]. These life arteries are waterbodies and freshwater resources [2,3]. They are also landscapes, ecosystems, and diverse habitats for many species [4,5]. They serve as a source of freshwater for drinking, agriculture, irrigation, and transportation [6,7,8,9,10]. Additionally, rivers play a pivotal role in shaping the land, eroding rocks, and sculpting valleys over time [11,12]. The intrinsic value of rivers cannot be overstated, since they provide water to communities and ecosystems, highlighting the interdependence of all life on Earth [13,14,15,16]. Therefore, protecting these vital resources is crucial for the well-being of our planet and future generations [17,18].
Sand mining from rivers provides significant building materials in construction and infrastructure development but causes considerable ecological and environmental impacts on river ecosystems [19,20]. Sand, a crucial natural resource, is extracted extensively for various purposes, such as manufacturing concrete, building materials, asphalt pavement, and land reclamation [21,22,23,24]. However, uncontrolled sand mining can disrupt river ecosystems, leading to riverbank erosion, habitat loss for aquatic life, and altering river courses [25,26]. For example, excessive sand mining adversely impacts water quality, altering sediment transport and causing riverbed instability [27,28]. It can exacerbate flooding, shaking nearby structures and threatening communities along riverbanks [29,30,31]. The removal of sand from rivers significantly impacts various environmental aspects [32]. Disturbing the natural sediment balance can detrimentally affect water quality, leading to increased turbidity and sedimentation [33] and reduced filter capacities for the availability of clean water for human consumption [34,35]. Given the rapid urban development, construction is swiftly advancing in urban environments. Some rivers that flow through cities suffer from riverbank damage used as both sand mining sites and waste disposal areas. For example, excessive sand mining disrupts the geomorphology of riverbeds, altering their natural flow patterns and causing increased erosion [36]. This can amplify the risk of floods as the altered riverbeds are less capable of holding and transporting water effectively [37].
Sand removal influences the natural habitats for various flora and fauna, disrupting the ecological balance and leading to biodiversity loss [38] and the depletion of riverbank vegetation [39]. Overall, sand mining from rivers poses a multidimensional threat to water quality, flood risk, geomorphological stability, and the preservation of critical vegetation [40,41,42]. Implementing regulated mining techniques, reclamation of mined areas, and exploring alternative materials can mitigate the adverse effects on river ecosystems and achieve sustainable resource management [43,44]. Therefore, sand resources must be managed appropriately to balance the needs of domestic, industrial, and irrigational water for sustainable development [45,46]. To achieve a balance of sand extraction and river system conservation, it is necessary to estimate the effects of sand mining and waste disposal on river systems for sustainable mining practices at the regional scale [47]. In situ monitoring is the traditional approach for estimating the impacts of sand mining on river systems. However, in situ monitoring is spatially not continuous and has a high cost at a large regional scale, particularly in developing countries. A holistic approach to considering the ecological and societal impacts is vital to ensure the conservation of river environments and develop sustainable practices while meeting the demands of development and construction [48,49,50]. Therefore, harnessing collective intelligence is crucial for tackling real-time environmental issues.
Volunteered geographic information (VGI) represents an evolving concept in the realm of geospatial data collection and sharing [51,52,53]. It utilizes various platforms and technologies to collect geographic information voluntarily provided by individuals or communities [54]. VGI harnesses the collective intelligence and contributions of volunteers and fosters the generation of diverse and dynamic geospatial datasets [55]. With technological advancements and the widespread use of social media and mapping tools, VGI has become a new information tools, producing data in the forms of crowd-sourced maps, citizen science projects, and user-generated content [56]. These data cover a wide array of topics, including mapping routes, tagging locations, and adding detailed local information [57]. VGI has shown immense potential in supplementing traditional authoritative data sources, offering updated, detailed, and context-rich information [58]. However, challenges persist regarding data quality, standardization, accuracy, and robust validation methods [59]. Despite these challenges, VGI has proven instrumental in various fields, including disaster management, urban planning, conservation, and public health, significantly democratizing geospatial information [60,61].
Nowadays, accessing the internet via smartphones is effortless and affordable. Local communities are more aware of their surroundings than experts and can contribute to environmental management via user-friendly VGI internet platforms. The public’s engagement in reporting incidents will allow real-time and prompt updates of stored information, which is not easy to collect through traditional geographic data collection protocols such as planned sampling and surveys. Therefore, a VGI system is important for assessing the dynamic spatial changes of rivers due to sand mining and landfilling. However, creating such a VGI site requires assembling people and software and designing a workflow, data schema, geodatabase, and map template. This study aims to develop a web-based VGI system that collects voluntary geographic information for sand mining sites and waste disposal along riverbanks with high reliability. The VGI system is applied to the Gadar River in Oshnavieh, Iran, (1) to serve as a platform to collect and share data on sanding mining and landfilling provided by volunteer participants and increase public awareness and engagement, (2) to evaluate spatial locations of sand mining and landfilling and their changes, (3) to analyze spatial heterogeneity and risks of sanding mining and landing, and (4) to foster a better understanding of sand mining and landfilling and provide insights for risk management, planning priorities, and economic development.

2. Materials and Methods

2.1. Data Source and Study Areas

This research focused on the Gadar River in Oshnavieh, Iran, as illustrated in Figure 1. The Gadar River is about 70 km long with a maximum width of 500 m. It originates from Kelashin Mountain and flows into Lake Urmia. The river has a significant reservoir for recharging aquifers [62]. The latest statistics show a population of 39,801 people in Oshnavieh City in the year 2016 (no census was conducted in the year 2021 due to the COVID-19 pandemic). According to [63], 22% of the urban population is employed in the industrial sector. They revealed that out of 28 industrial factories in the studied area, 12 are directly involved in sand extraction or construction activities related to sand extraction.
Along the riverbed of the Gadar River, there is an abundance of top-quality sand and gravel. Sand and gravel are commonly used for building materials and thus attract human exploitation over time. However, in addition to legal exploitation and extraction, thousands of tons of sand and gravel have illegally been extracted yearly [62]. Consequently, this unregulated activity has caused a displacement of the riverbed, resulting in multiple instances of flooding that have inflicted severe damage on regional infrastructures and bridges along the river’s course. Furthermore, the excessive removal of sand and gravel has led to a decline in the groundwater level, contributing to a reduction in the piezometric level of local wells. Additionally, the dumping of industrial, urban, and factory waste into the river has compounded the environmental issues in the riverbed area, significantly deteriorating the ecosystem’s quality [64].

2.2. VGI System Components

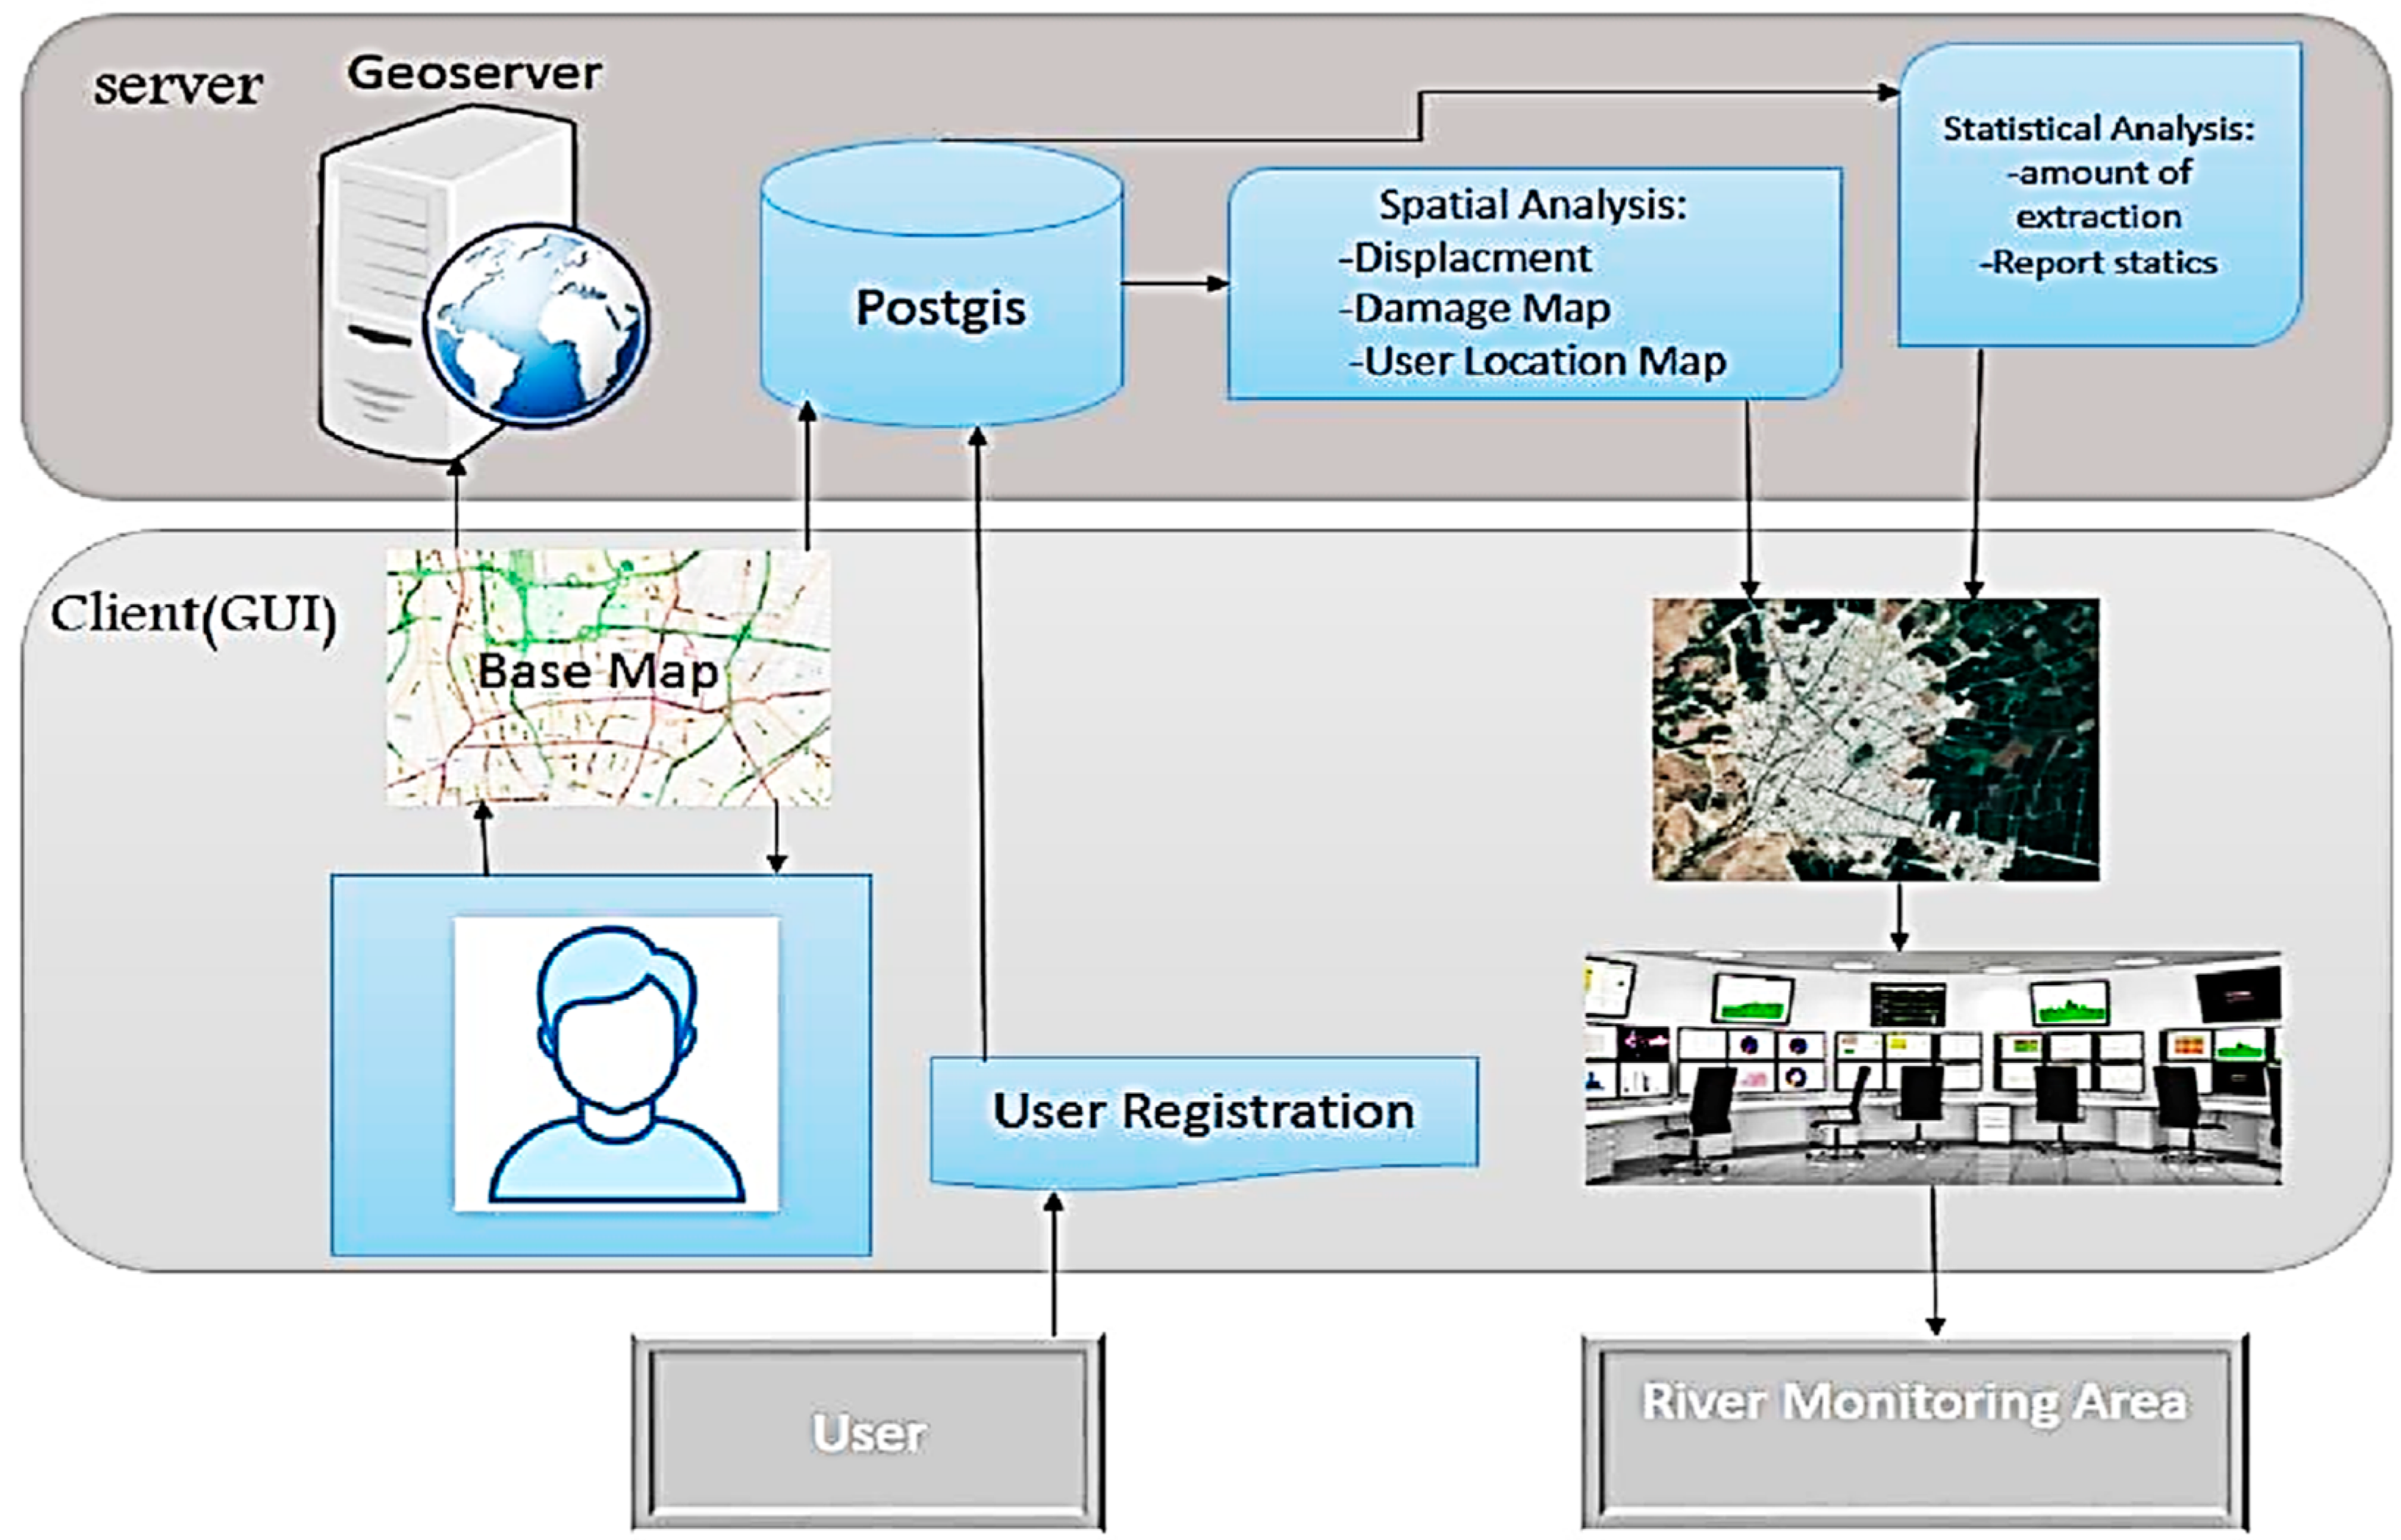
The VGI system was a combination of open-source software, including a map server, a database (PostGIS), a user interface, geospatial and non-geospatial analysis tools, and high-resolution QuickBird satellite background images (Figure 2). VGI was applied for geospatial data created by non-professionals through internet webs and user interfaces as an extension for participants to allow access to their geospatial databases.
GeoServer [65] served as the map server using a web map service (WMS) protocol and was configured to define geospatial layers, display standards, etc. GeoServe facilitates communication between the display and data levels for mapping stored data using the Open Geospatial Consortium (OGC). This user-friendly tool supports Web Feature Service (WFS) and Web Processing Service (WPS), allowing the specification of styles to layers and displaying information from databases and shapefiles [66]. PostGIS is an open-source software that supports geographic objects in the PostgreSQL database for storing, indexing, and querying geospatial data. PostgreSQL is an open-source database used for geospatial data storage along with PostGIS plugins. These plugins enable users to store geospatial data and perform various geospatial processes. Persistent scatterer interferometry (PSI) uses an original image for selecting stable and highly coherent scatterers in time series [67]. Small baseline subset (SBAS) interferometrically combines multiple computed mappings. It selects pairs characterized by small spatial separation between orbits (baselines) to avoid the correlation limit effect [68]. The user interface was crafted using JavaScript, CSS, and HTML, prioritizing simplicity and user-friendliness across all education levels to enhance location-finding capabilities. The XAMPP is an open-source web server package used for its operating system independence as the Apache server.
In this research, the VGI system was used to investigate the effects of landfilling and sand extraction on the spatial changes of the earth’s surface from 2021 to 2023 using the data from the Sentinel-1 satellite and SNAP software [69]. This VGI platform seamlessly incorporates three essential elements (management, geographic information systems (GIS), and public participation) within a robust web-based GIS platform.

2.3. System Implementation

The VGI platform handles geographic data inputted by nonprofessional volunteers such as participants. The transformative influence of web technology on data access has significantly enhanced geographic and descriptive data availability, reducing both cost and time constraints. Web GIS provides a range of services beneficial to both experts and users, including data collection, communication, analysis, map templates, and data flow. These multiple functionalities position the web GIS platform as an optimal platform for storing, analyzing, and presenting gathered data.
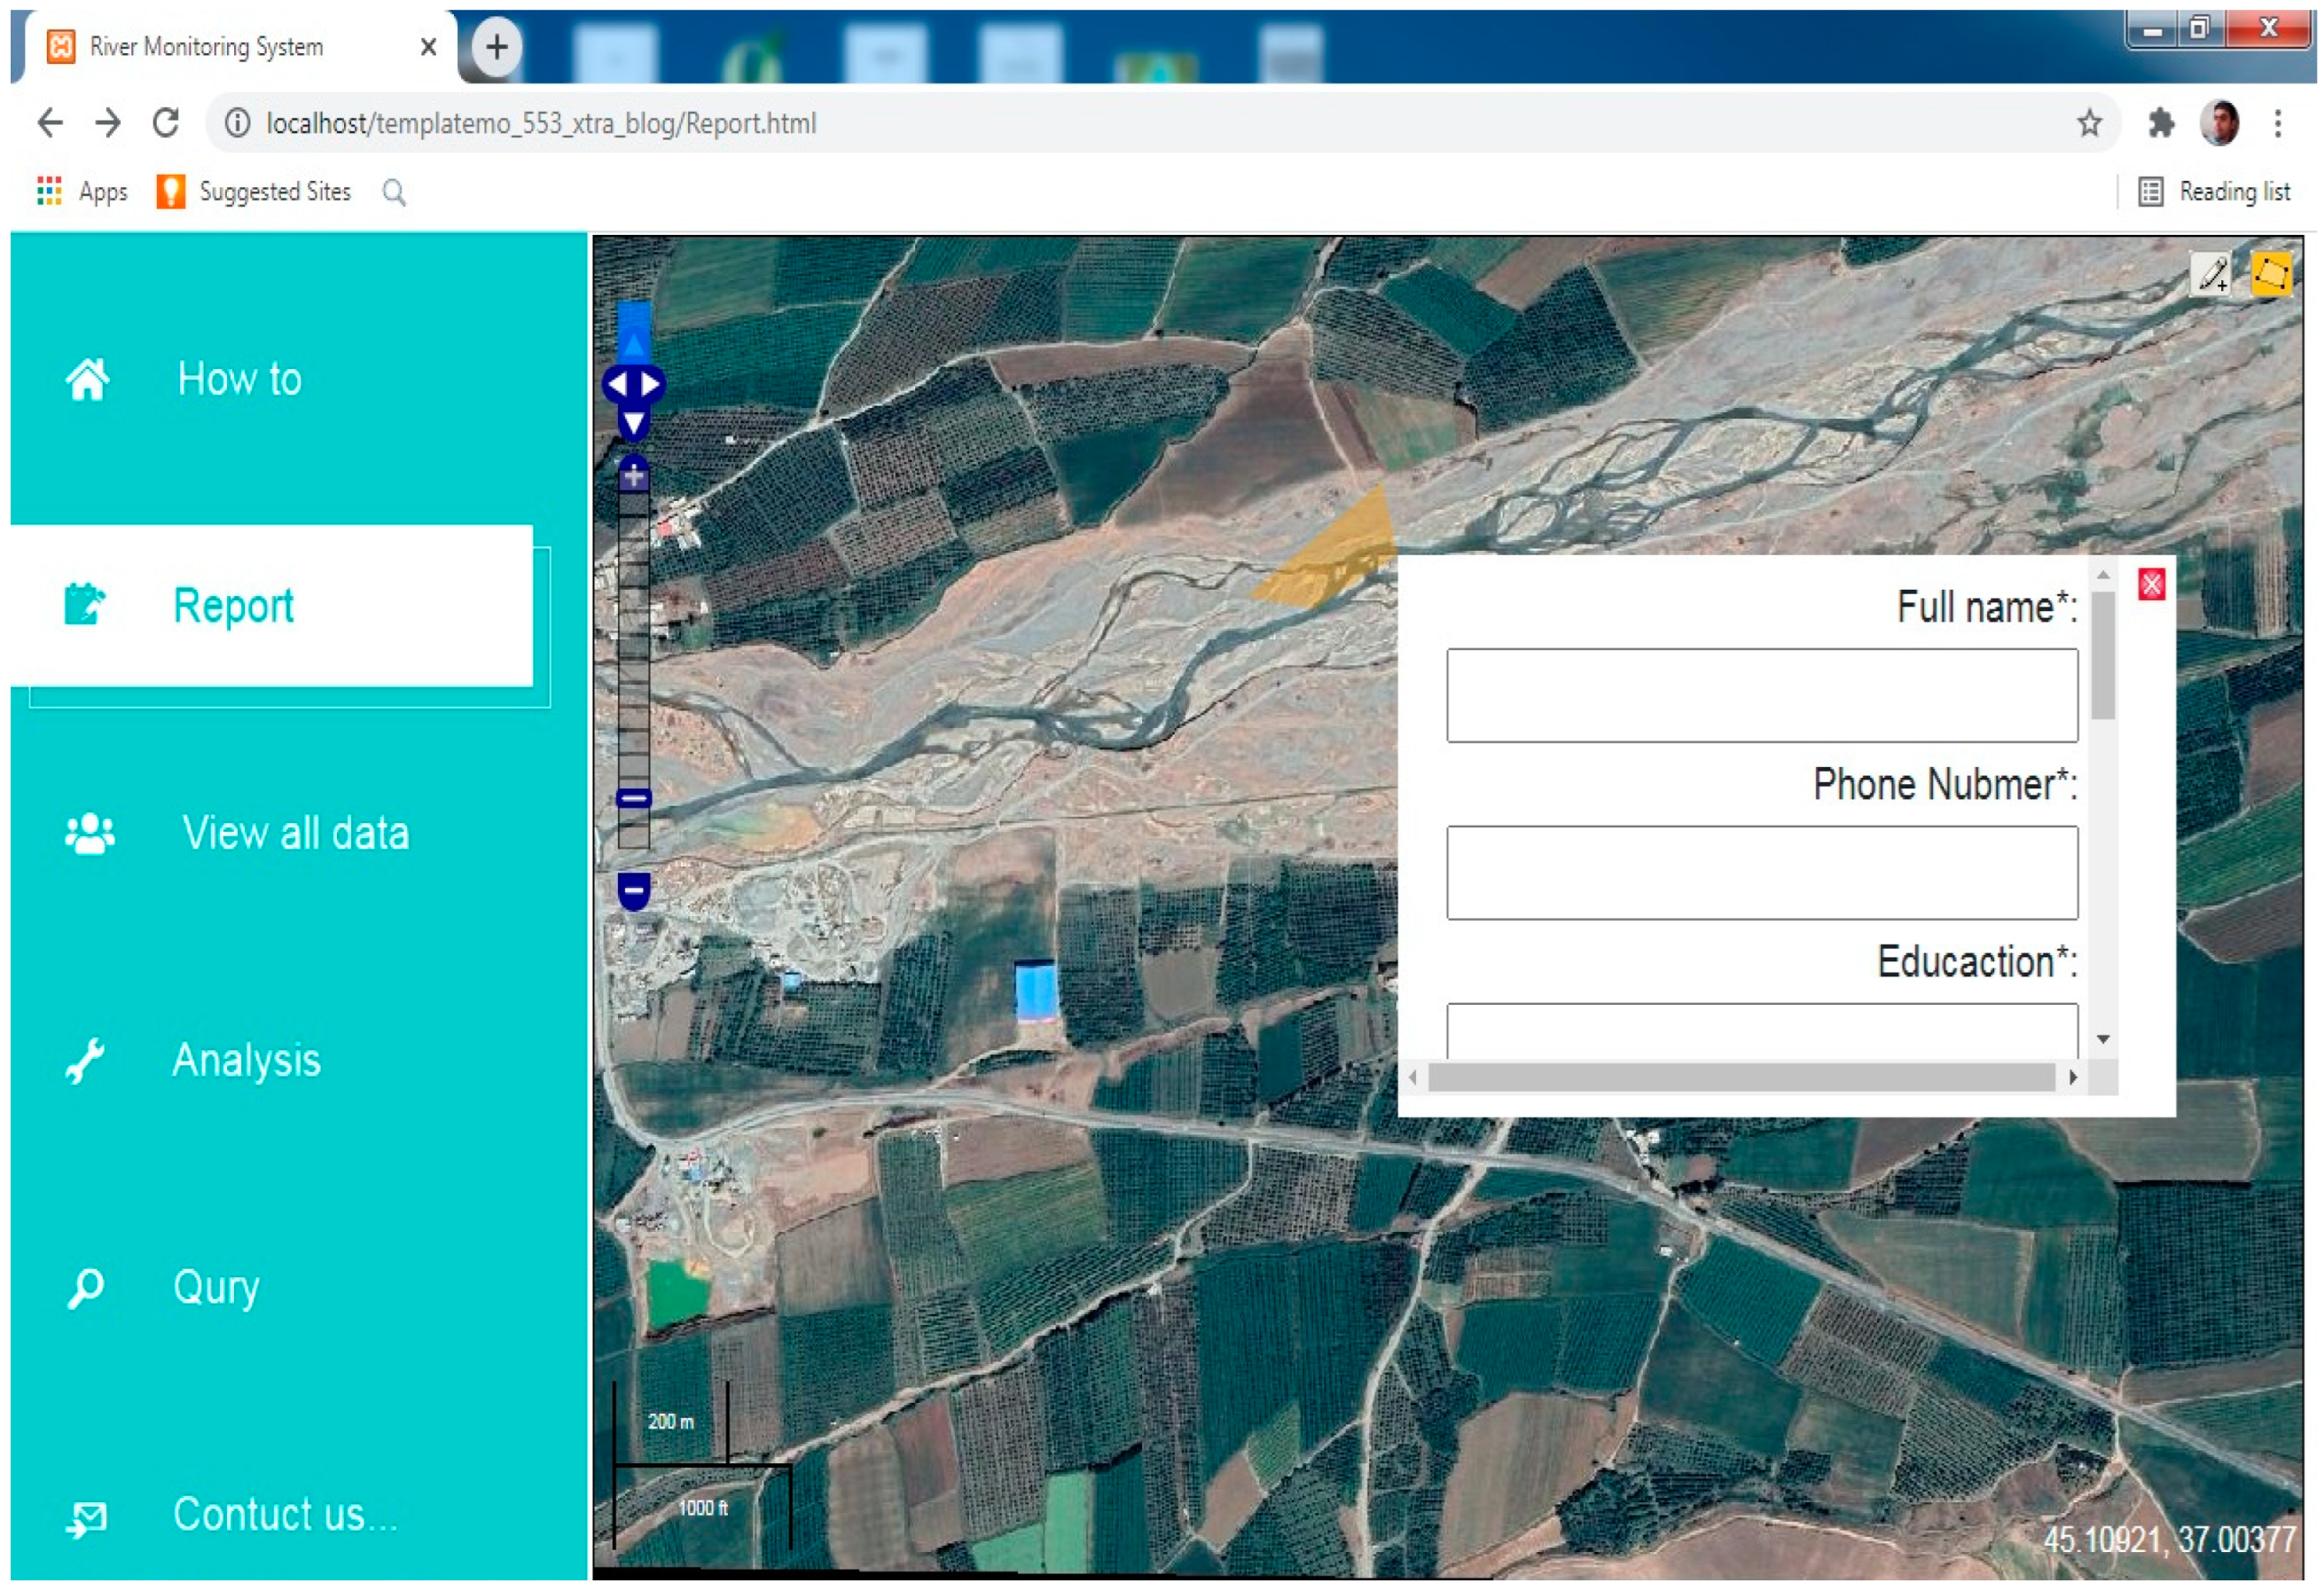
The user interface includes vital sections such as registration and problem reporting, the visualization of reported results, and the option to search reports using customized parameters. To report a violation, users are required to register a form that includes unnamed personal details such as age, education, address, and phone number. Once the registration process is completed, users are directed to an instruction page to provide details for reporting incidents. Registered users report violations by pinpointing the incident’s location on the QuickBird satellite image and submitting relevant descriptive information through a dynamic map-based interface. However, the system may not directly prevent illegal sand mining. It functions as a tool for relevant organizations to monitor violations reported by citizens, enabling the development of specific preventive and control measures.
Advanced geospatial analysis features are also incorporated into the interface, adding another potent tool to this platform. The engagement of public participation in reporting incidents allows real-time monitoring and prompt updates of the database as a key advantage. This enables to timely update geographic information and real-time identification of violations and events along river systems that are difficult to obtain through traditional geospatial data collection protocols, such as sampling and survey, but can easily be collected by volunteer participants reporting violations and damage. Thus, VGI provides alternatives and complementary data. The spatial analysis utilizes radar reference images to effectively illustrate the impact of sand material mining on subsidence trends. Thus, this collective data from public groups compensates for information gaps in river basin management, facilitating the faster generation of geographic data needed for river monitoring and control. The visualization of the spatial distribution of mining reports can evaluate the sand mining places and their effects on the subsidence phenomenon along the riverbank. Data-enabled, transformation-efficient exchange of geospatial data and better river data analytics can substantially improve decision-making in near-real-time data, reduce disaster impact, and improve resilience.

2.4. Land Subsidence

Land subsidence was quantified utilizing Sentinel-1 images processed within the SNAP software environment. Satellite Sentinel-1 image pairs have been used, as described in Table 1, to generate terrain elevation models. The collected elevation data are geoid-based. Employing the data preparation for StaMPS PSI processing with SNAP (SNAP2STAMPS) Automated Algorithm [69], persistent scatterer interferometry (PSI) analysis was conducted [70,71]. This technique enables the identification of stable ground points over time, allowing for the detection of subtle surface deformations indicative of land subsidence. Additionally, small baseline subset (SBAS) analysis was employed to mitigate atmospheric and temporal decorrelation effects, enhancing the accuracy of displacement measurements [72]. Initially, Sentinel-1 images of the study area during 2021–2023 were acquired and preprocessed to remove noise and atmospheric disturbances. Subsequently, interferograms were generated to detect phase differences between image pairs, from which deformation rates were derived. Finally, statistical analyses and spatial mapping techniques were applied to interpret the PSI and SBAS results, providing the extent and magnitude of land subsidence over the study period. The relative flatness of the digital model was generated using the images of the Sentinel-1 sensor and the SRTM digital elevation model. Its geoid flatness data are based on 84WGS, while the elevation data used in Sentinel-1 are based on the 96EGM ellipsoid. The geoid height (the separation of the geoid from the aforementioned ellipsoid) within the test area range was calculated to evaluate the elevation of the digital model generated by the Sentinel-1 sensor and the reference digital elevation model in a common elevation datum.

2.5. Data Validation

To verify the accuracy of the information, the study employed a method that included telephone contact with reporters and on-site visits to the reported areas. After users submit their information, their phone numbers are collected, and report addresses are used to access the report location. Initially, during a telephone call, user-provided information is assessed. Subsequently, the reported location is visited for final confirmation by interpretation of Google Earth images, and if the data are accurate, they are used in subsequent analysis processes. To validate the results of this research, three parameters were utilized: completeness, correctness, and quality [73,74].
  • True Positive (TP): The number of instances of the phenomenon (sand mining or waste burial) being present both in the reference data (field studies) and the results of the study (information received from users). In other words, it represents the number of instances of the phenomenon successfully identified correctly as the target phenomenon (sand mining or waste burial).
  • False Positive (FP): The number of instances of the phenomenon not existing in the reference data but being incorrectly identified as the target phenomenon in the study results.
  • False Negative (FN): The number of instances of the phenomenon existing in the reference data but not being identified in the study results.
These indicators (TP, FP, FN) are used in assessing completeness, correctness, and quality, following the methodology introduced by [73,74].

2.5.1. Completeness

This indicator reflects the percentage of instances of the phenomenon present in the reference data that have been correctly identified as the target phenomenon in the study results. In this metric, instances of the phenomenon that relate to other phenomena and are incorrectly identified do not impact the value of this indicator. Therefore, Completeness is defined by Formula (1):
Completeness = ( TP TP + FN ) × 100
where TP is the True Positive, representing instances correctly identified as the target phenomenon, and FN is the False Negative, representing instances of the target phenomenon not identified in the study results.

2.5.2. Correctness

This metric is used to assess the correctness and accuracy of the classification and categorization. It signifies the percentage of instances identified as the target phenomenon in the results that match instances of the target phenomenon in the reference data. The correctness is calculated using Formula (2):
Correctness = ( TP TP   +   FP ) × 100
where TP is the True Positive, representing instances correctly identified as the target phenomenon, and FP is the False Positive, representing instances incorrectly identified as the target phenomenon.

2.5.3. Quality

Quality is a metric that considers both correctness and completeness for result evaluation. It is calculated using Formula (3):
Quality = ( TP TP   +   FP +   FN )   ×   100  
where TP is the True Positive, FP is the False Positive, and FN is the False Negative, incorporating the elements of correctness and completeness in the assessment of result quality [73,74].

3. Results and Discussion

3.1. Explanation of System Details

The report registration component is described as the first part (Figure 3). In this component, users consider the type of their report and select one of the two tools from the editing tools first. This can be either point or polygonal mining events. Point reports were used for sand mining, and polygon reports were used for waste disposal (this was due to two reasons: (1) the border of each landfill area is clear, but the border of sand mining is not very clear; (2) the amount of sand mining in the region is very high, and there are more sand mines than landfills; therefore, creating polygons for sand mining areas could be tedious, and users would be discouraged). Then, users can proceed to fill out the corresponding events in the form. Each tool is designed in the editing component and connected to a separate database. This means that point reports are stored in point databases, making it easy to perform later spatial analyses.
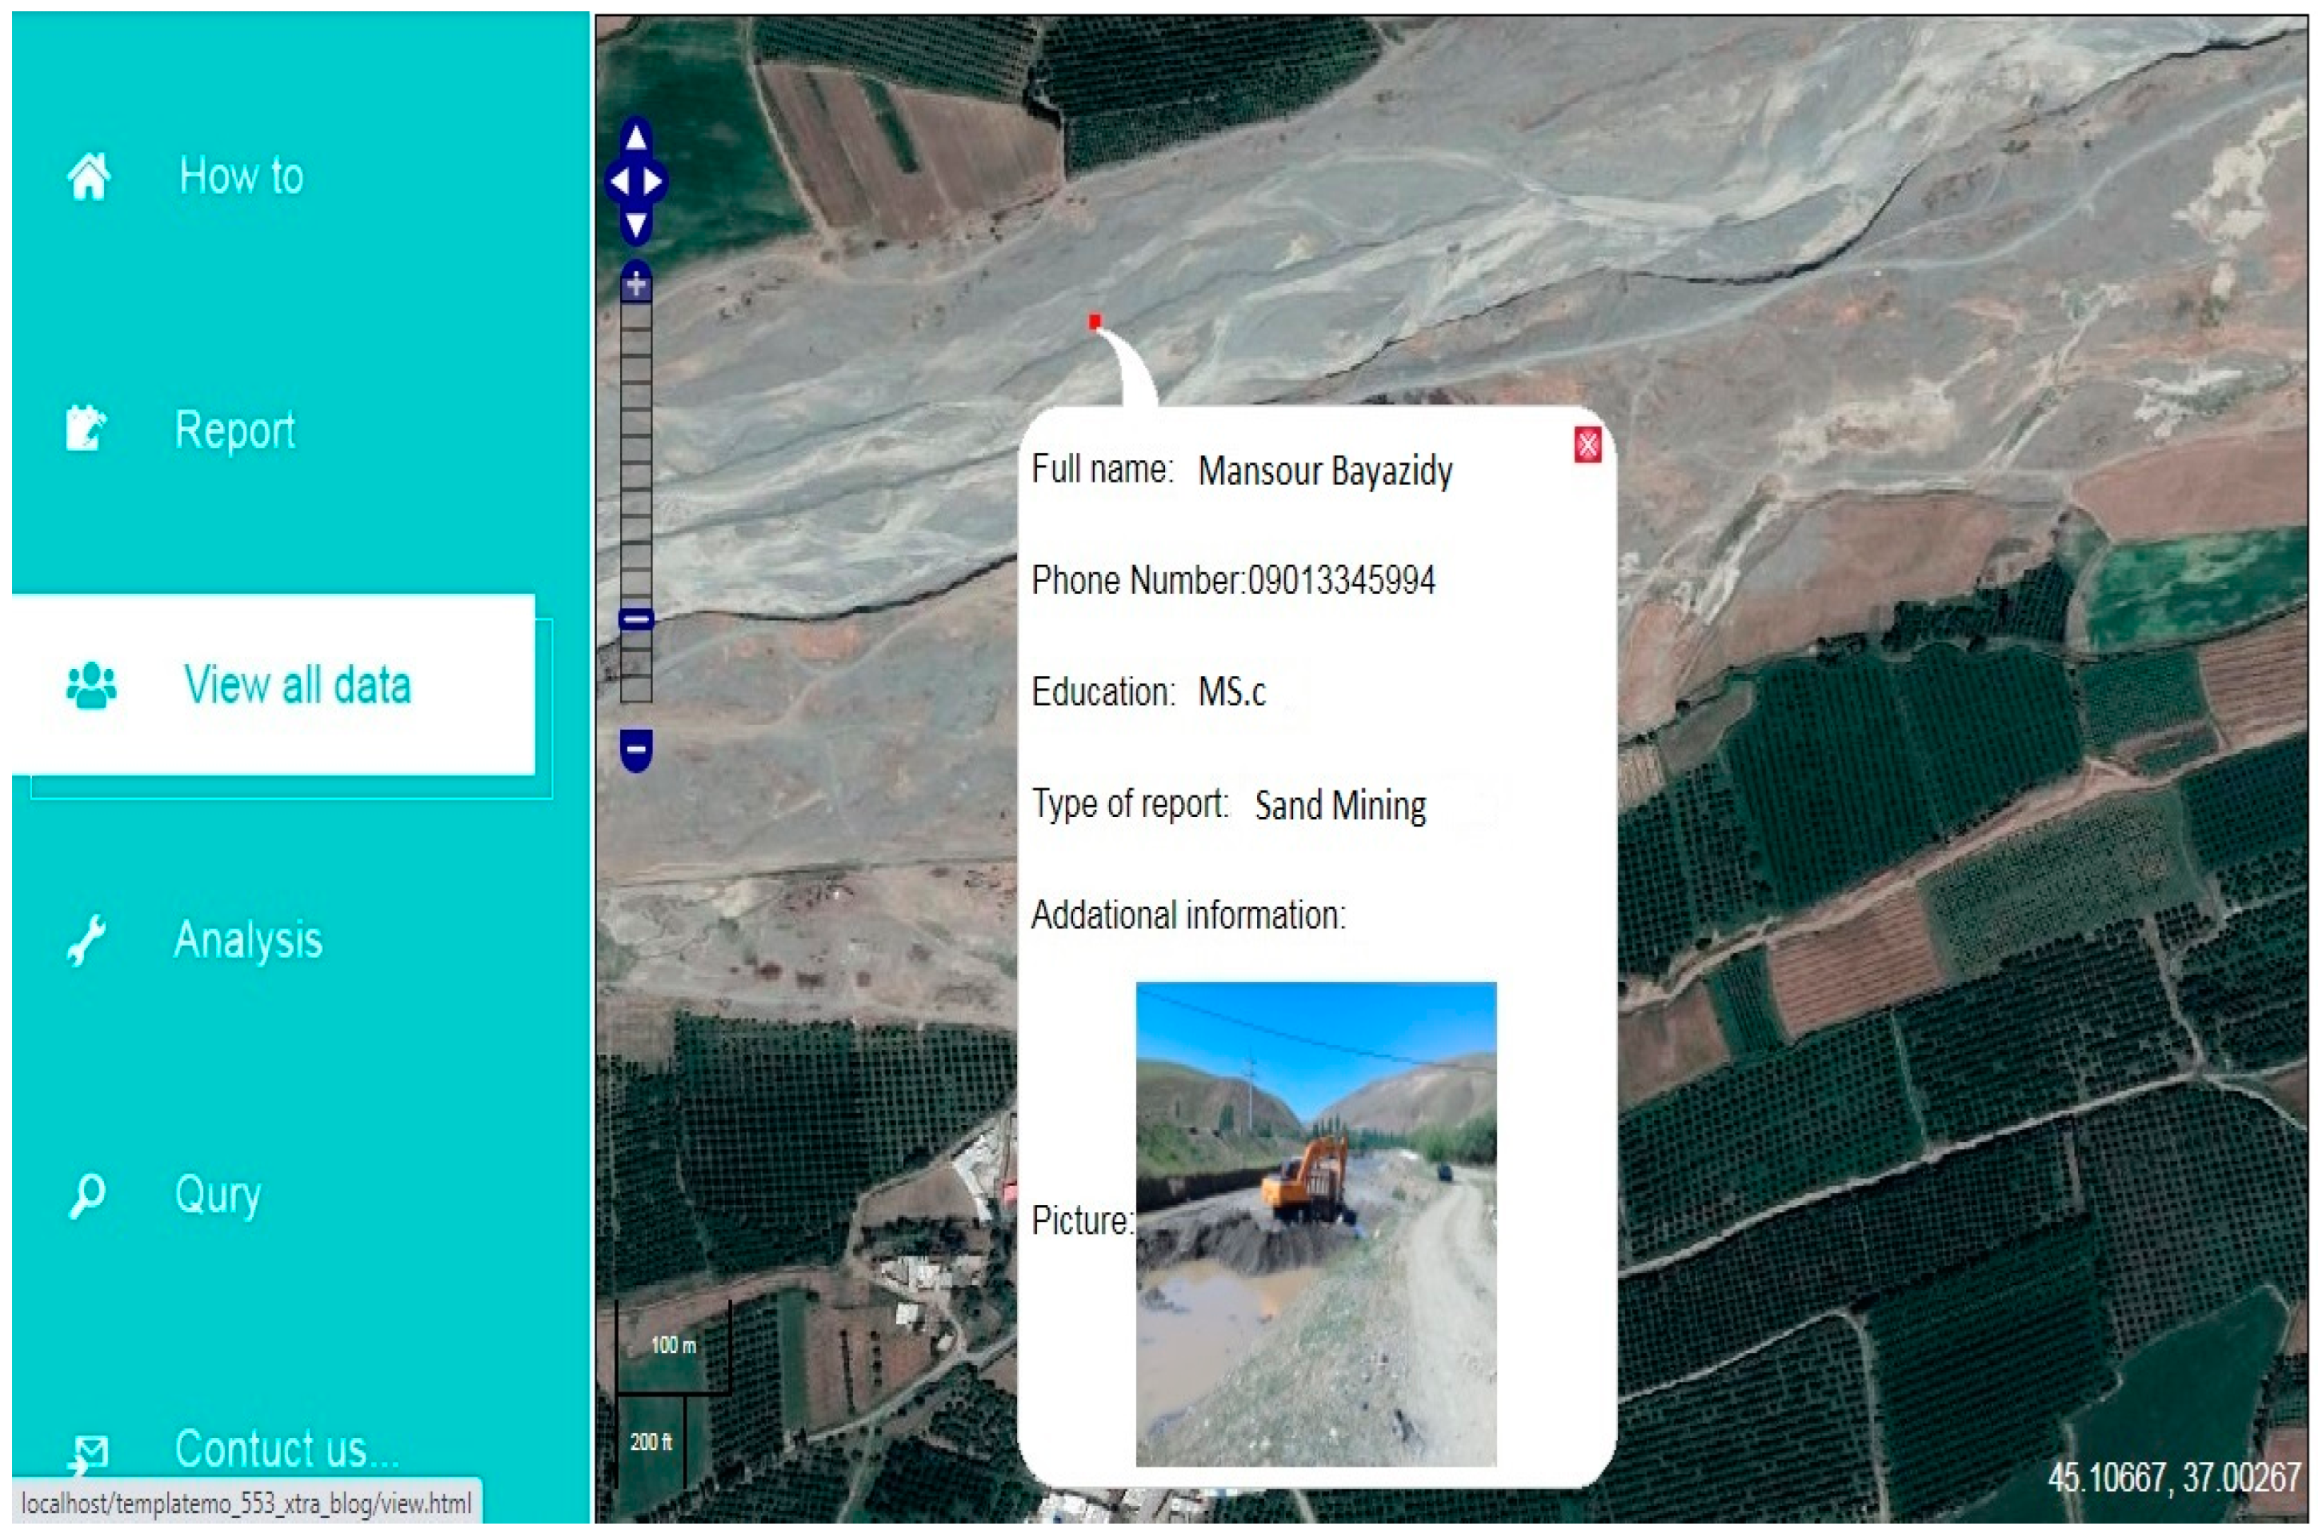
The next component is “View Reports”, where users can view all the reports recorded in the system along with essential information. User information can be displayed in this section so administrators can see the details of users’ reports and block them forever if they send the wrong reports several times. This enhances transparency to allow a better understanding of the current situation. Additionally, it aligns with the system’s primary goal to increase public awareness of the environment (Figure 4).
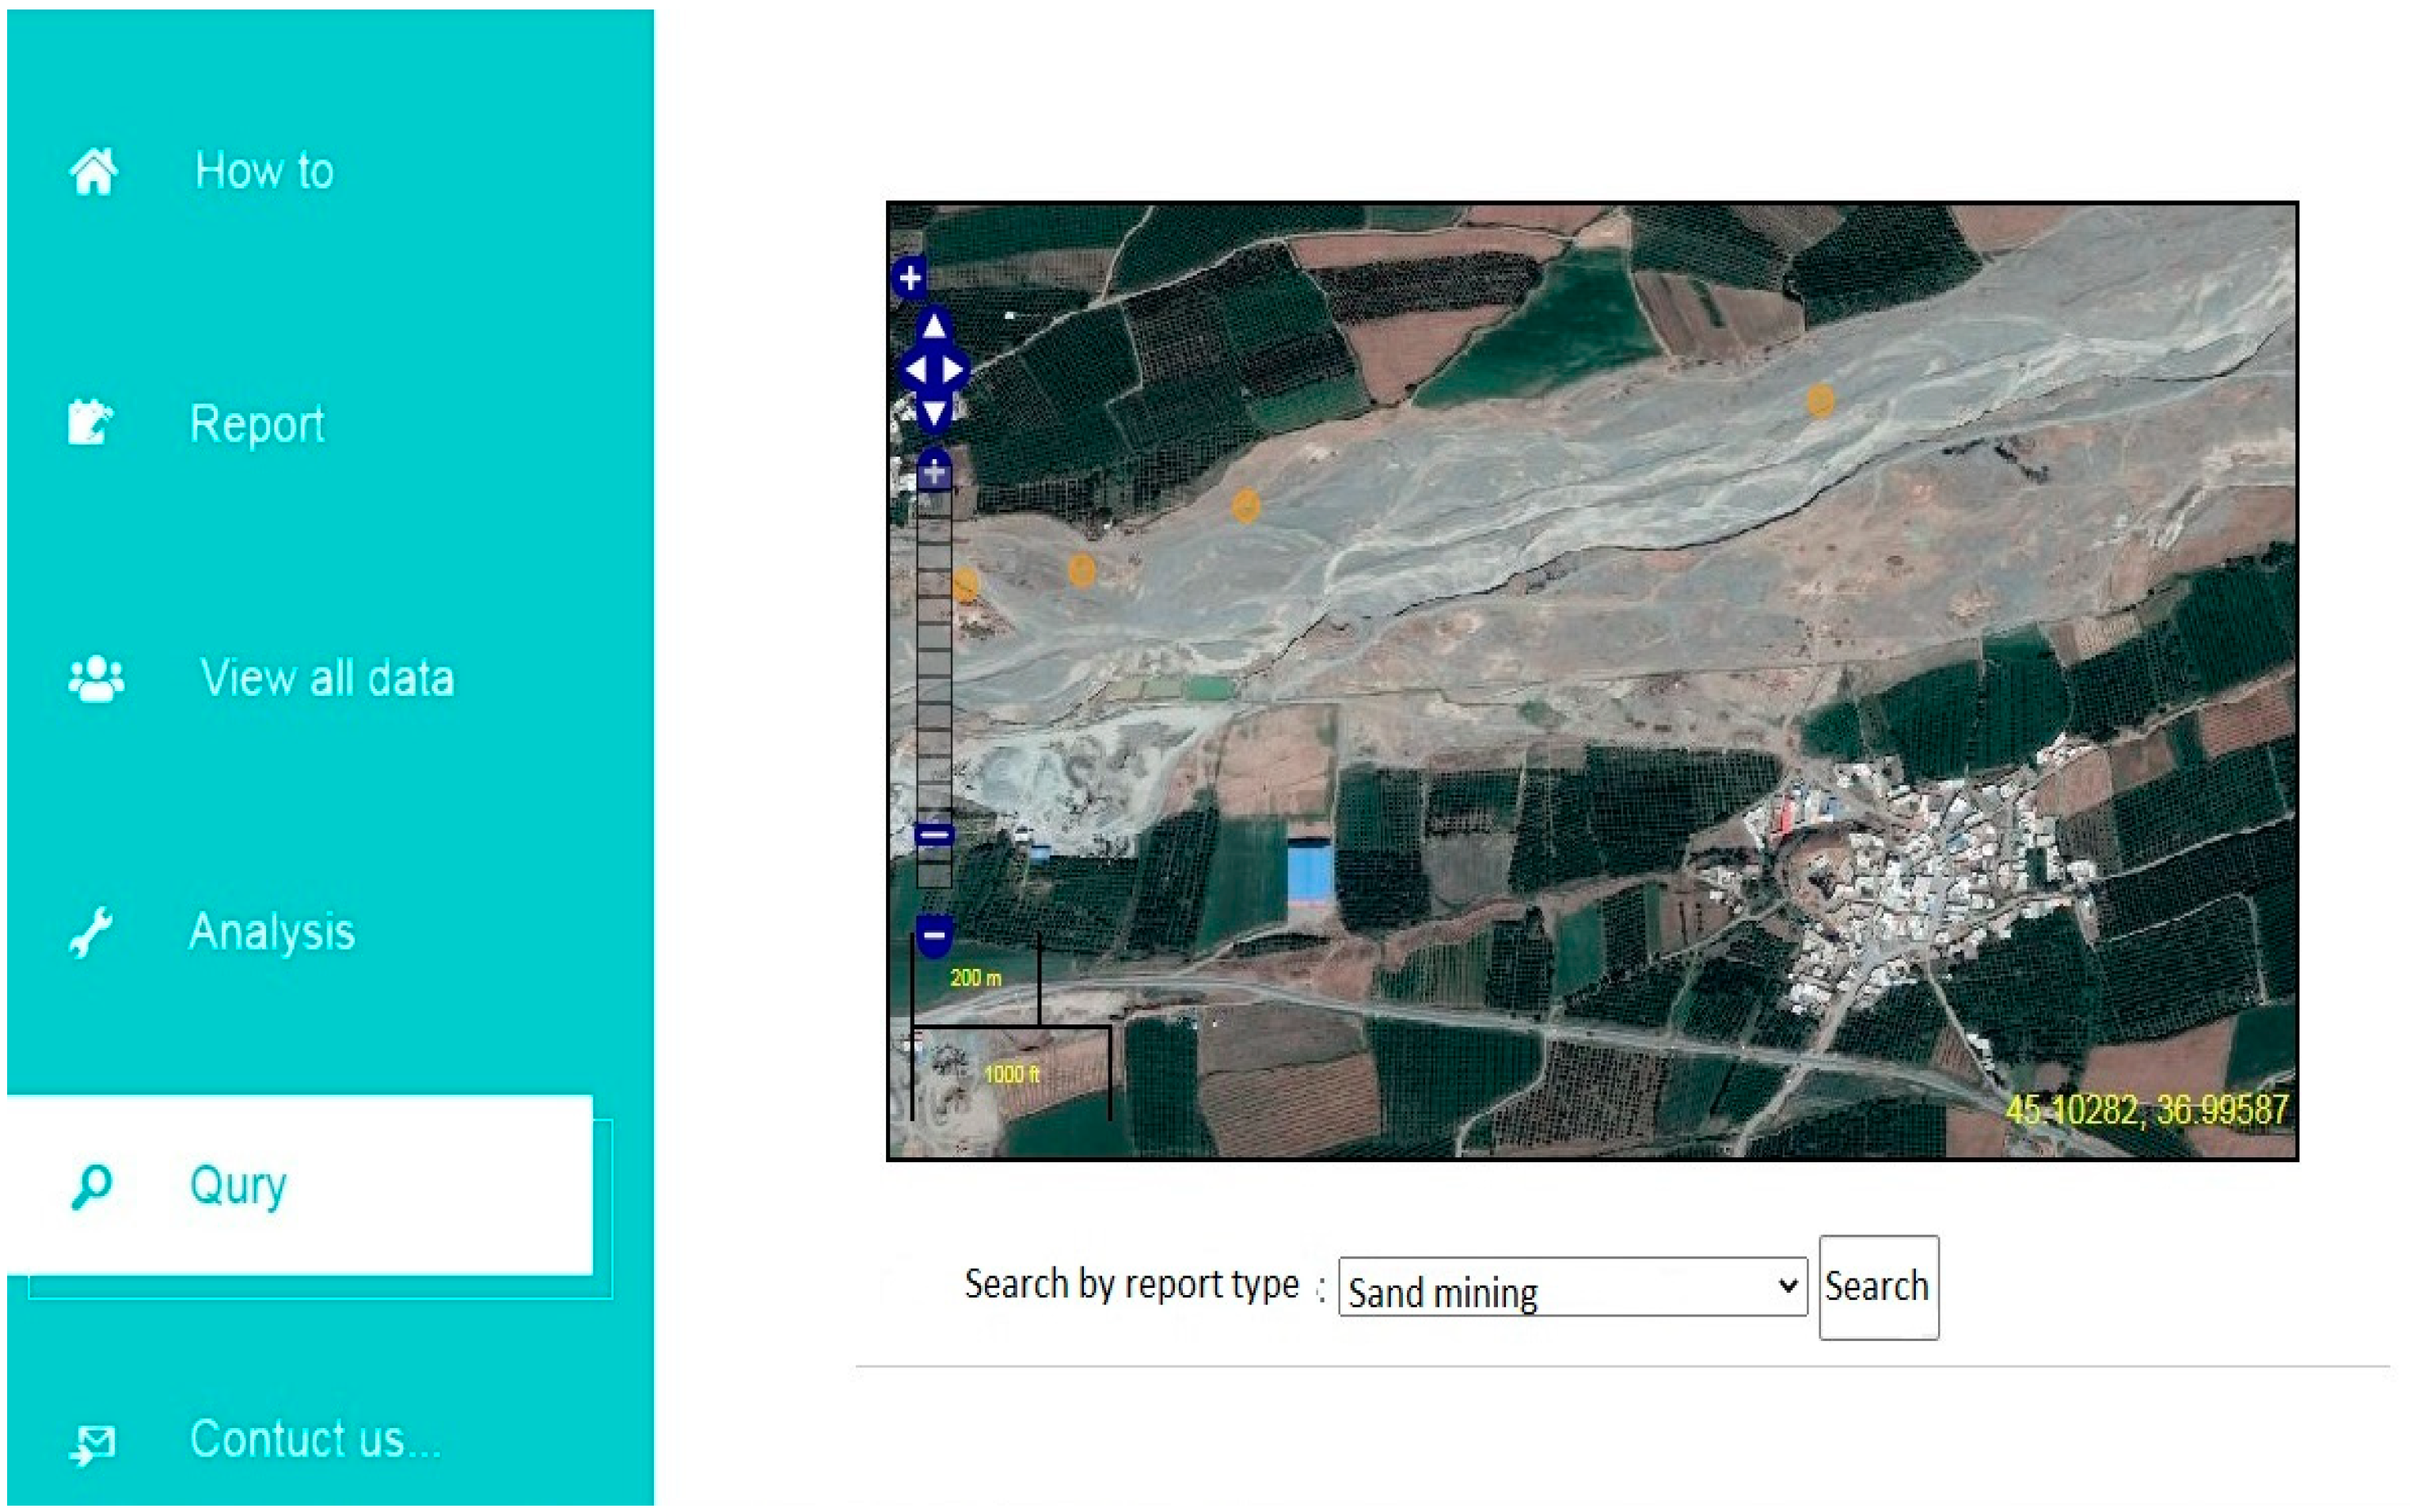
Figure 5 illustrates the operation of the query menu. In this figure, the “search by report type” option is used for event types. The administrator can generate reports based on sand mining, landfilling, or any type of query that specifies what type of information is in each of these categories. Based on the data collected using this system and their spatial distribution, the impact of river material mining on the subsidence trend can be clearly observed. Most reports of material mining are related to a region approximately 1.5 km long (Figure 5). It can be observed that this trend has a significant long-term effect on the subsidence of the surrounding areas of the river in an area of up to 10 km in width. Therefore, we can visualize the impact of this activity on subsidence. It can be seen that users’ information (e.g., username, user education, gender, etc.) is available in the database to allow checking of the events. The background image in Figure 5 shows that sand mining has been extensively carried out on the margins of the river, causing the river flow to deviate significantly. To some extent, it is difficult to accurately identify the location of the river flow (this area is near the city of Oshnavieh, where sand extraction for construction is underway or ongoing).

3.2. Public Participation and Reporting

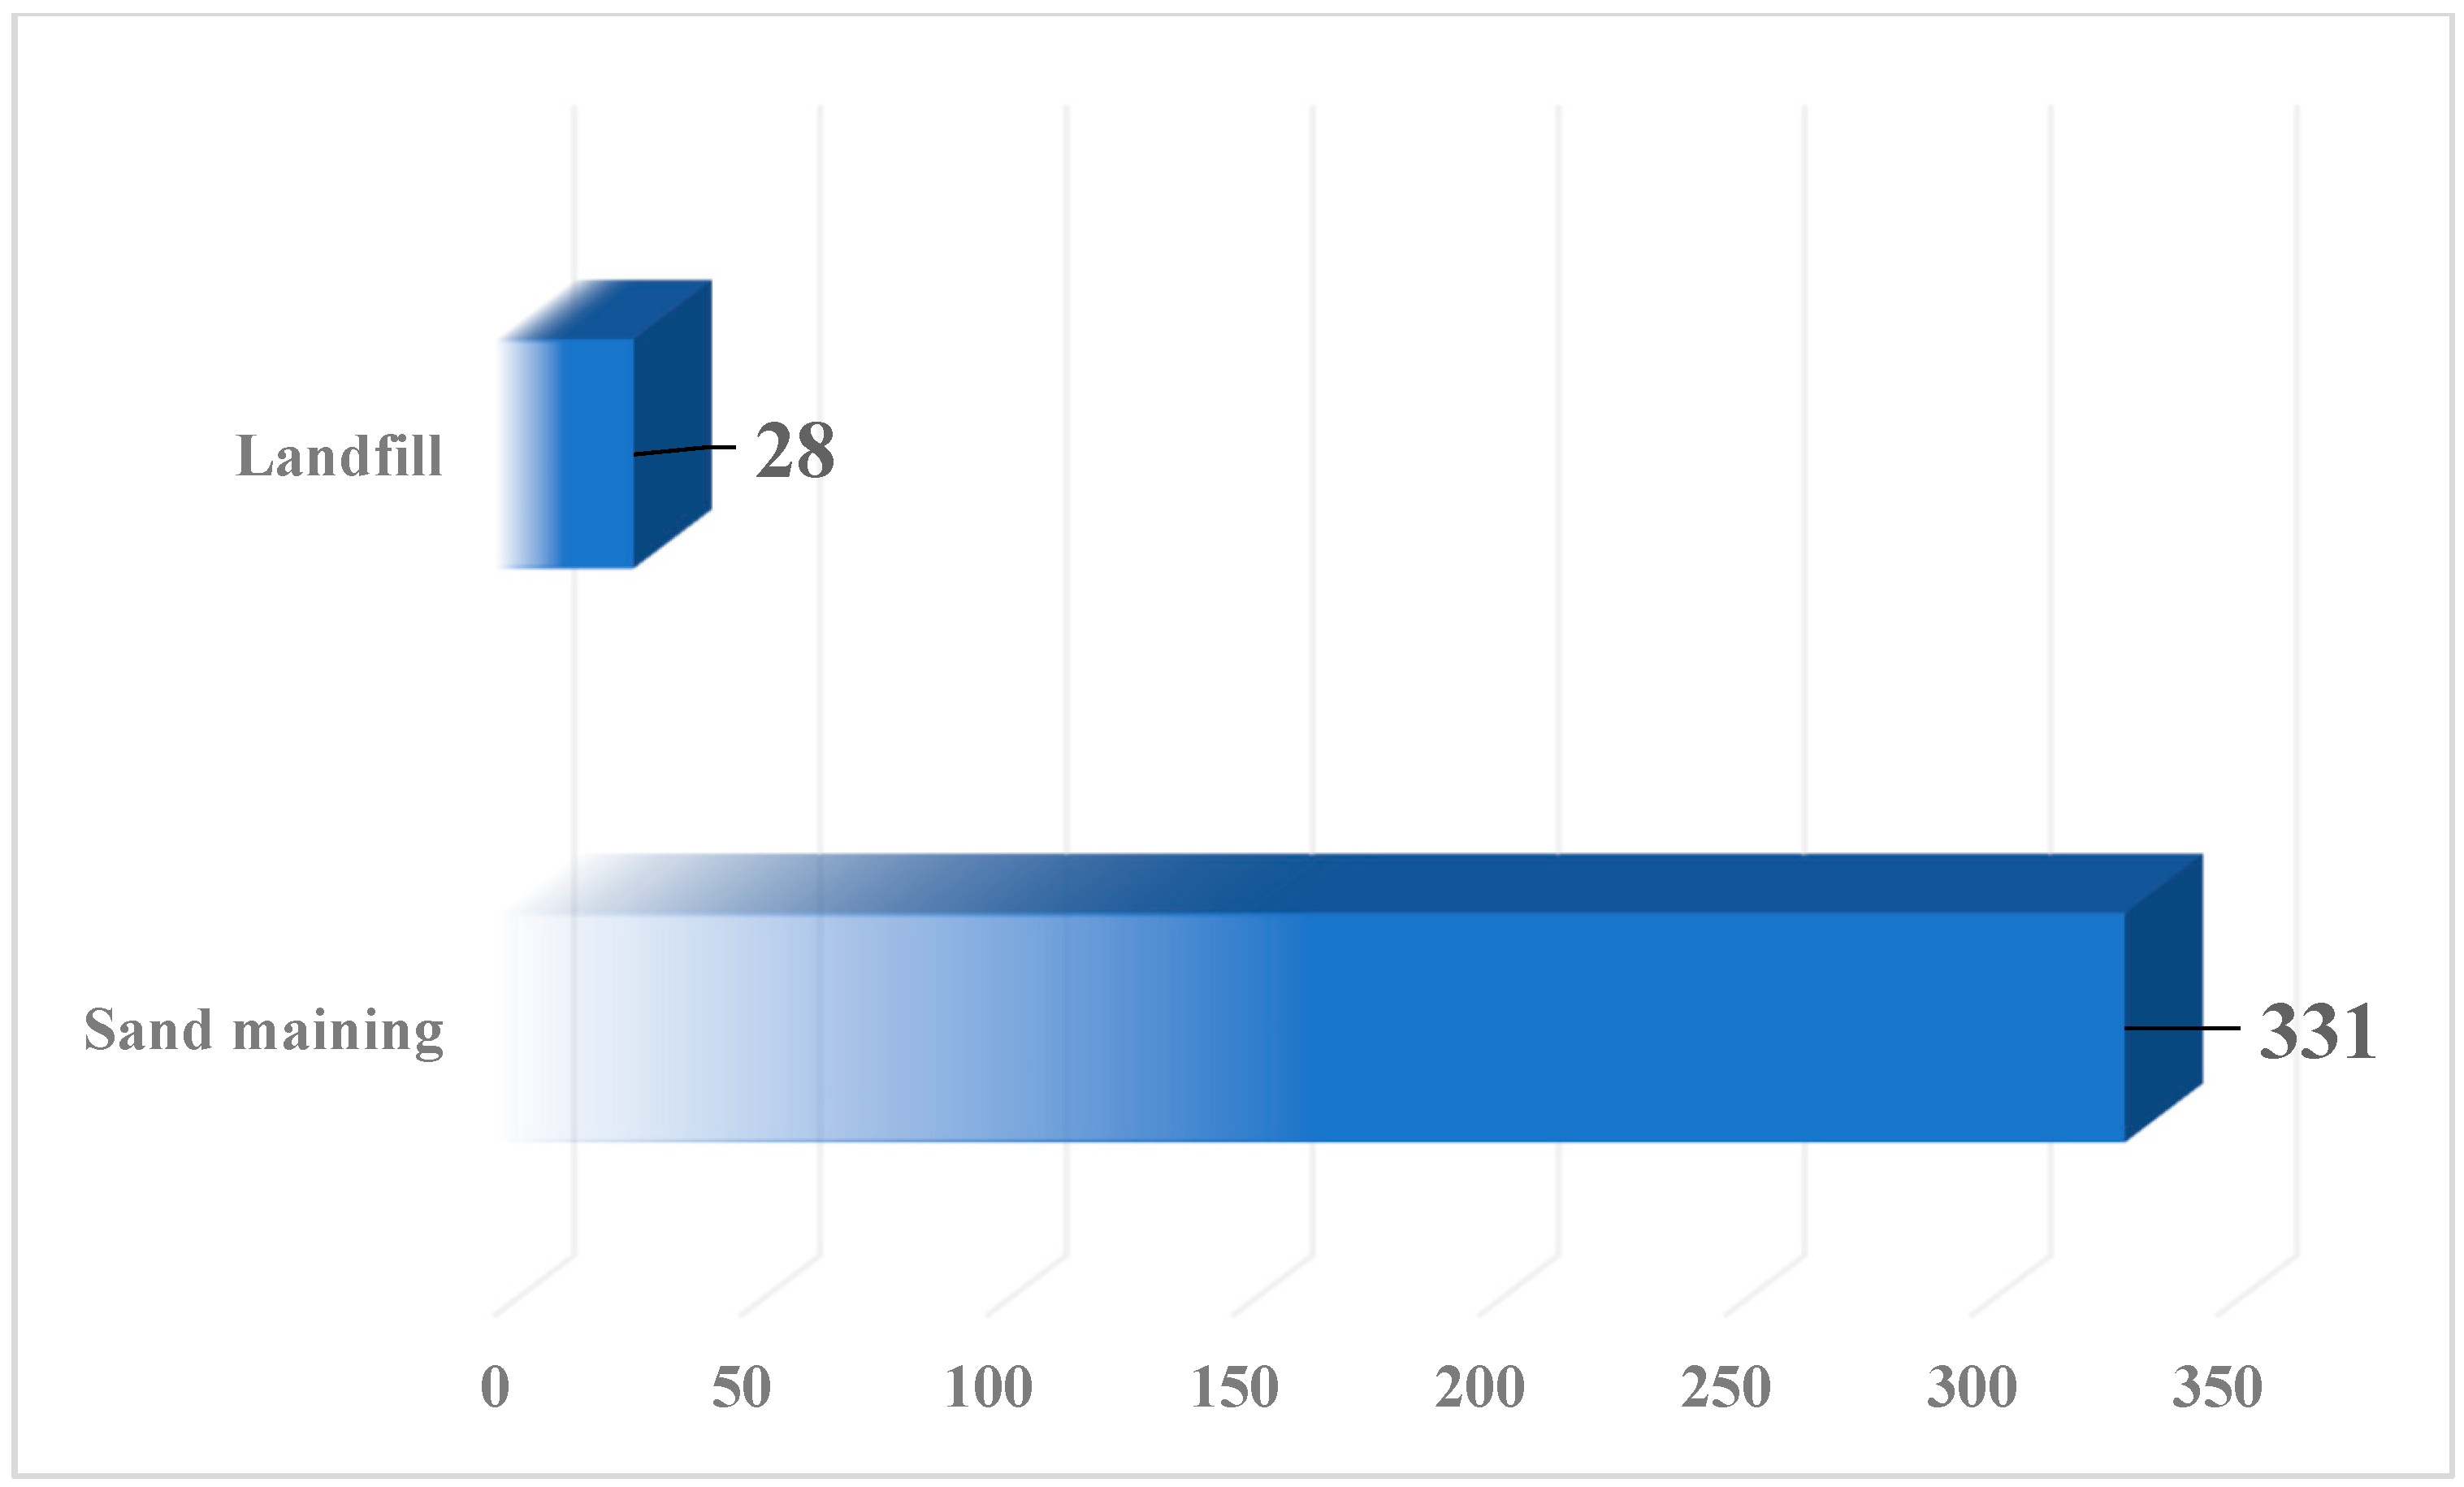
Public participation enables real-time monitoring of river events and promptly updates stored information. The volunteer participants may vary in patterns, types, and roles in terms of their purposes and motivations, which need to be determined at an early stage. Understanding volunteer characteristics and strategies would, therefore, affect the outcomes of the initiative. The use of collective data from public groups can compensate for information gaps in river basin management. The public’s engagement in reporting incidents (e.g., illegal sand mining and waste disposal) allows for a more rapid response to violations, ensuring a timely update of the stored data. In this study, 359 reports were registered for statistical analysis. Figure 6 shows the reported type of activity in the riverbank area. Based on this diagram, the number of sand mining events is much higher than that of waste disposal events. In total, 331 out of 359 reports were related to sand mining, and only 28 reports were related to waste disposal. Field observations also revealed that most of the disposed waste was in locations where sand mining had previously taken place.
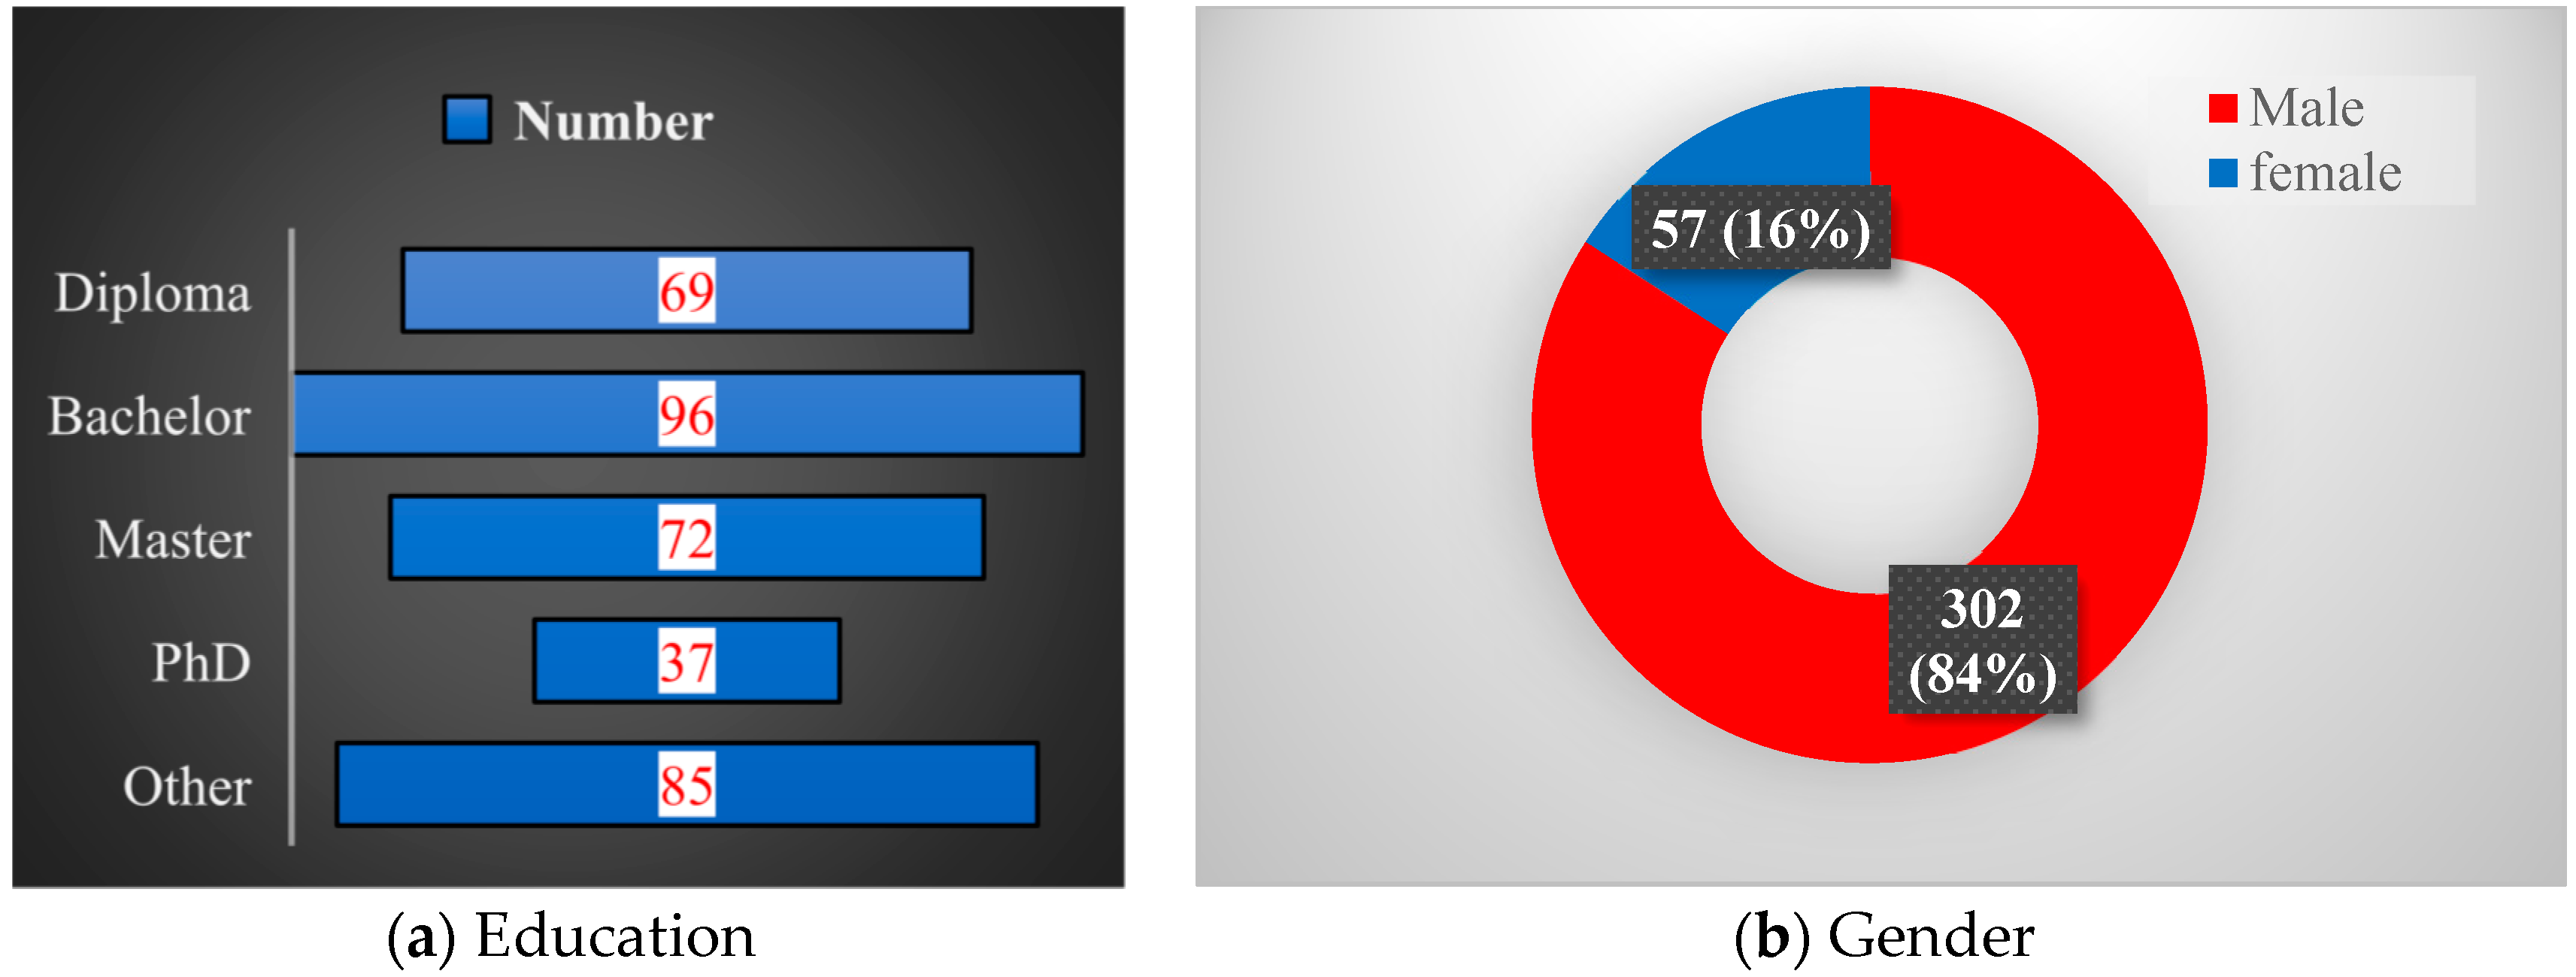
Figure 7 shows the distribution of volunteer participants. The educational degree of individuals was registered on sand mining and waste disposal in the system (Figure 7a). According to this diagram, the majority of participants contributing to the development of this system had a bachelor’s degree (96 individuals), while the lowest participation was from PhD holders, with 37 participants. The reason for the low number of PhD users sending reports is that the number of holders of this academic degree is small compared to other degrees. However, users with a bachelor’s degree, are more than those with a diploma, implying their concerns with the environment. Figure 7b depicts the gender distribution of participants in the development of the system. It can be seen that 84% of participants were male, while the remainder were female. This does not imply that environmental issues are more important to men than women; rather, it reflects the potential dangers of areas outside the city and environments with anonymous individuals, leading to lower female participation.

3.3. Regional Evaluation with Radar Interference Images

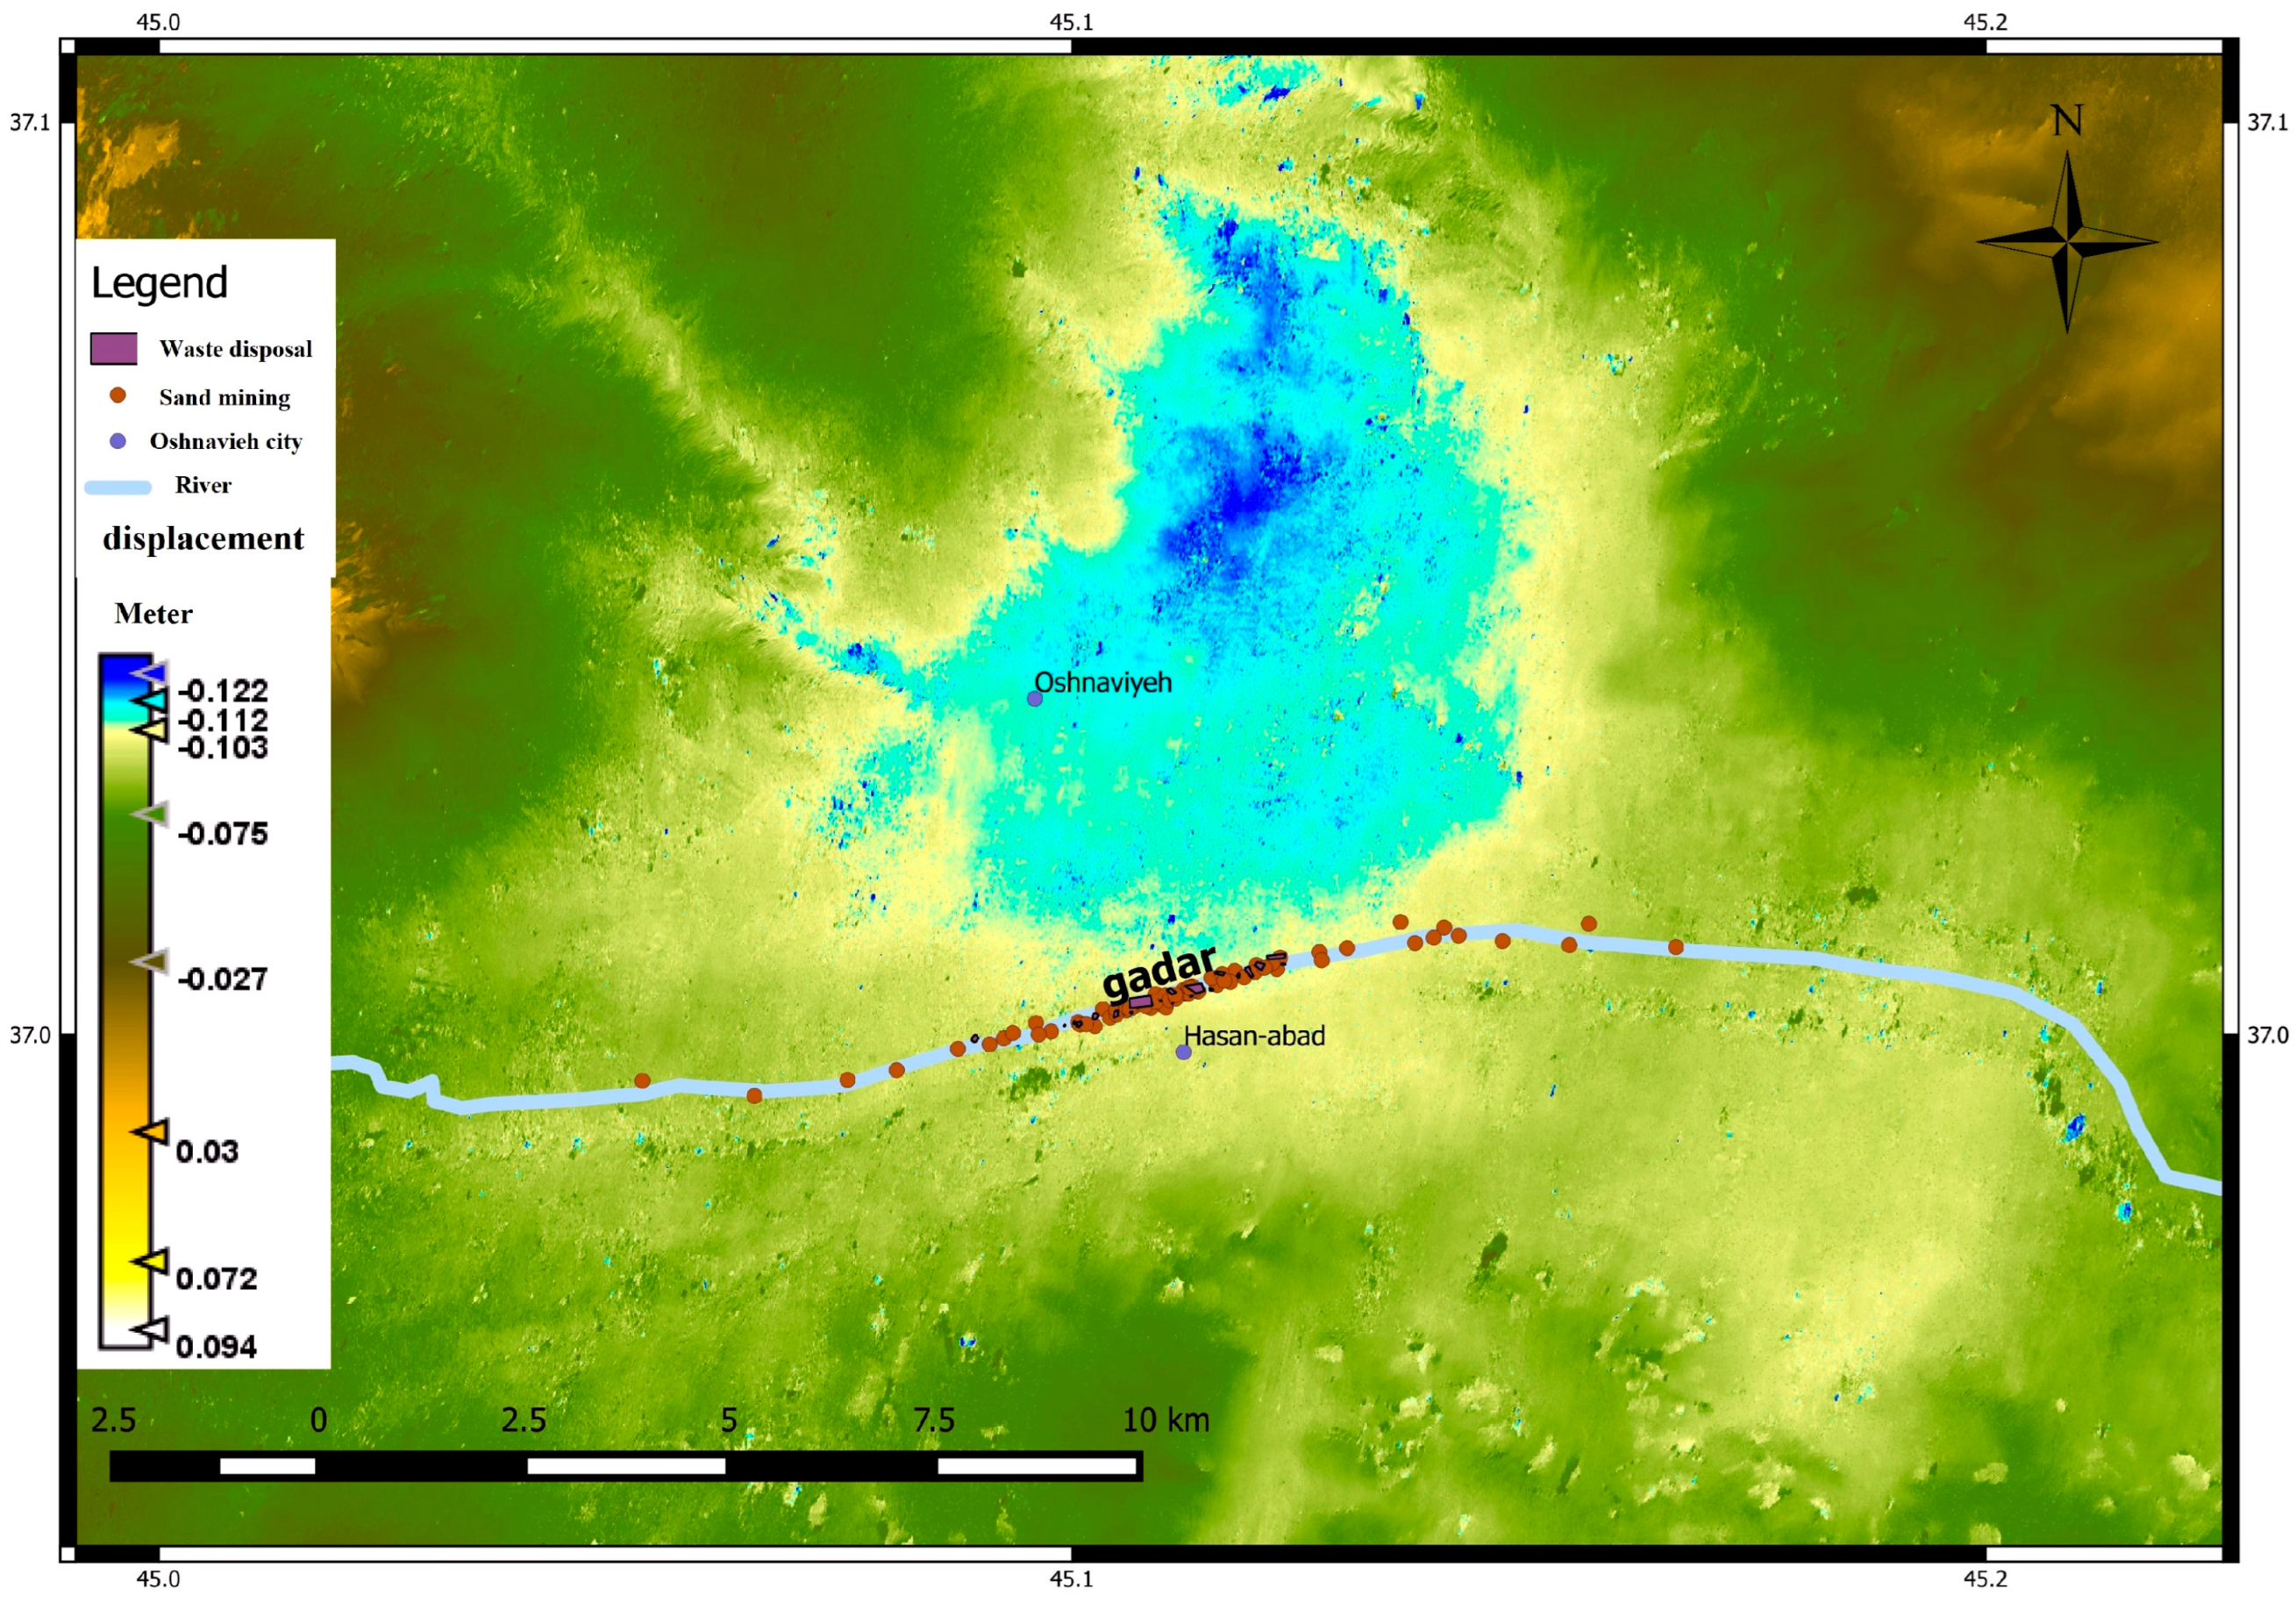
On a regional scale, radar interference images have been utilized for assessing reported data to increase the speed and precision of validation. Given the previous extensive sand mining in this region, its effects on subsidence were shown on radar interference images. Our database confirms that this region has the highest sand mining compared to other regions. VGI online reporting systems enhance reporting speed considerably compared to conventional methods such as phone calls to relevant organizations. Additionally, precise location identification through point or polygon reduces confusion and uncertainties. Such an accurate geographic location allows experts to respond promptly and reduce response times. Figure 8 shows the calculated subsidence using radar interference images. The public reporting locations are shown on the map. As depicted in the above graphs, the majority of reports on sand mining were located in the riverbed. It can be found that continuous legal and illegal subsidence due to sand mining threatened the river’s health over time, endangering both the river’s well-being and the lives and property of residents. Uncontrolled material mining could lead to river self-cannibalization, destroying its banks and shores. With farmlands and villages located nearby, uncontrolled mining leads to potential irreversible risks. Sand mining without sufficient monitoring and riverbed care has caused various issues in the area.
Riverbed dredging is considered a significant influencing factor in subsidence phenomena because rivers are the primary contributors to groundwater recharge, determining the groundwater table. Lowering the riverbed could lead to a decrease in the groundwater table. As evident in Figure 8, the highest subsidence levels are associated with the area where a high number of reports were received regarding sand and gravel mining from the river. This region has a history of extensive material mining due to its high-quality sand and gravel. The sand and gravel mining from the river could exacerbate subsidence in the area. Figure 8 displays the spatial distribution of sand mining and waste disposal sites, represented as points (sand mining) or polygons (waste disposal) overlaid on a subsidence map. The areas surrounding the south bank of the river show significantly more subsidence than those on the north bank. This was attributed to the fact that the south bank was extracted mainly because of high-quality sand and gravel, while the north bank was extracted less because of clay deposits at deeper levels. This confirmed that the areas along the south bank have experienced more substantial subsidence. In the near future, sinkholes may form in the areas surrounding the north bank due to subsidence. Therefore, monitoring riverbed dredging is crucial to prevent further subsidence and potential environmental hazards. The public reporting system proves invaluable in accurately identifying dredging locations, allowing for more controlled mining practices and preventing the exacerbation of subsidence in the region.
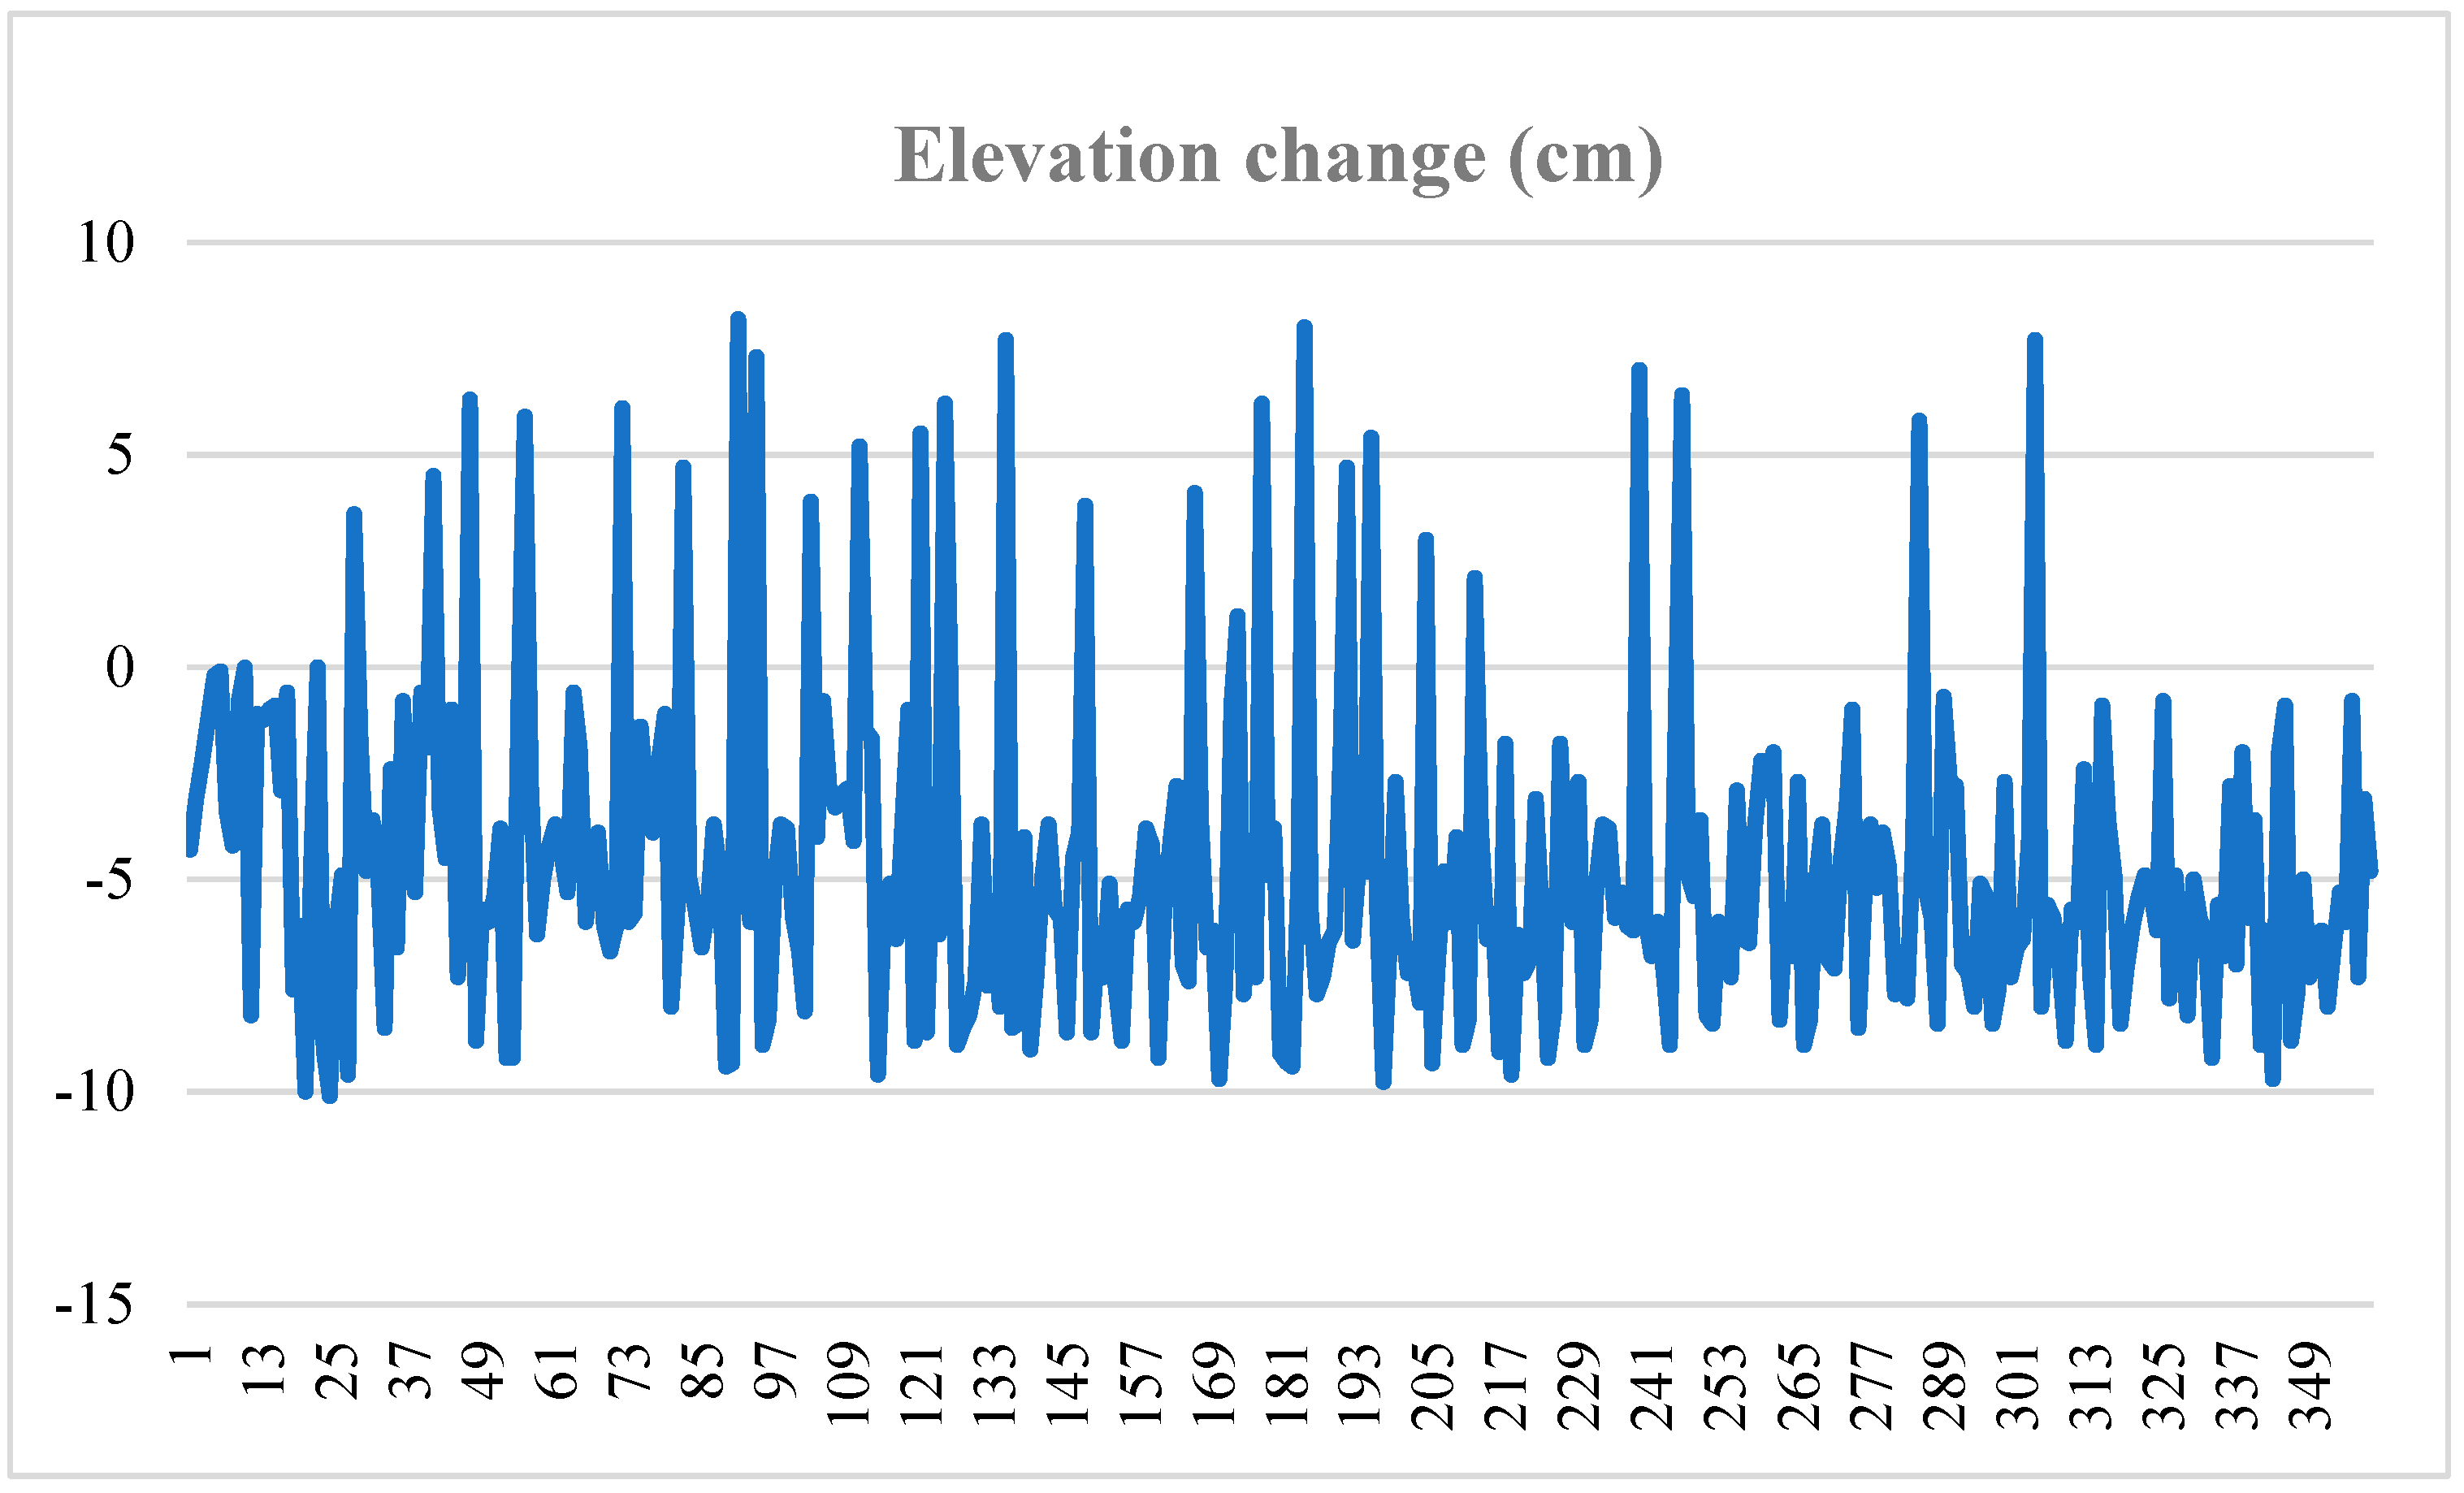
Figure 9 shows a graph of the height changes calculated from satellite imagery in the points reported by people. Points with positive heights represent areas related to waste disposal, while points with negative heights are areas where sand mining has occurred. According to this graph, the maximum subsidence at the riverbank was −10.1 cm, and the maximum uplift was 8.2 cm. The reported average subsidence was −5.1 cm.’ Subsidence is a natural disaster and can be caused by groundwater extraction. The depletion of underground aquifers can also be one of its primary causes. Therefore, the public can consistently participate in these areas, provide vigilant oversight, and report any destructive or illegal activities. The public reporting system offers a more accurate means of monitoring mining sites and helps a more controlled mining process to mitigate potential environmental disasters. Regarding the increase in elevation in some areas, this could be attributed to waste disposal, which contributes to the elevation increase (though field investigations indicate that the majority of waste disposal occurs in the sand mining area). Additionally, when sand mining is conducted using mechanical excavators, a quantity of sand accumulates at the edge of the mining site.
On-site visits were performed to verify the results of remote sensing analyses. Field investigations indicate that the majority of waste disposal occurred in the sand mining area. We examined 359 reports that were sent to the system; 338 of them were correct and 21 were incorrect. Also, 27 cases (sand mining or waste disposal) were discovered by system administrators in the study area and not reported by users. Of these, 26 cases resulted in elevation increases. This verified that the elevation increases were from waste disposal. Three parameters of completeness, correctness, and quality were used to evaluate the performance of the VGI system in identifying environmental manipulations by humans, as shown in Table 2. Completeness was 94.15%, correctness was 92.48%, and quality was 86.63%. According to these statistics, the proposed system has a strong ability to identify environmental manipulations and events.

4. Conclusions

In this study, a web-based GIS platform has been developed and implemented for monitoring sand mining and waste disposal in the Gadar River in Oshnavieh, Iran. The objectives of the VGI are to increase public awareness regarding environmental concerns, foster a sense of shared responsibility among the community, enhance transparency, and encourage public engagement by allowing users to access all recorded reports and essential information. VGI has been shown to increase opportunities for public involvement in sand mining management through tasks such as volunteer mapping. The system comprises various components such as open-source software, Windows Server 2012, a web server, and a database management system and provides an effective means of data collection, analysis, and public participation in environmental monitoring. The results show that the report registration component of the system can serve as the input component where users can select the type of report (point or polygonal) and separate the editing tools from databases to ensure efficient storage and later spatial analyses of the collected data. The public’s engagement in reporting incidents allows real-time and prompt updates of stored information, which is not easy to collect through traditional geographic data collection protocols such as planned sampling and surveys. These collective data from public groups compensated for information gaps in river basin management and facilitated the faster generation of geographic data needed for river monitoring and control. Field observations reveal a significantly higher occurrence of sand mining than waste disposal. Furthermore, most disposed of wastes were found in locations where sand mining had previously occurred. The spatial distribution of mining sites indicated the monitoring needs to prevent environmental hazards, particularly in areas with a history of extensive material mining. The reported data were compared with radar interference images, confirming the reliability of the system’s findings. The calculated subsidence agreed with the monitoring data of mining sites. This demonstrates the effectiveness of the public reporting system in providing insights for controlled processes and management of potential environmental disasters. However, the public reporting system also shows imbalances of participants between genders and educational levels. The majority of participants had a bachelor’s degree or above with diverse expertise. The web-based GIS platform has proven to be a valuable tool for environmental monitoring, fostering public participation, mitigating subsidence and associated environmental risks, and providing insights into the spatial impact of material mining. This underscores the importance of addressing safety concerns to encourage more inclusive public participation in environmental monitoring efforts, ultimately contributing to river ecosystems’ long-term health and sustainability. Based on the evaluation results, the VGI system has demonstrated significant success in identifying human-induced environmental manipulations through completeness, correctness, and quality assessments. With 359 reports received, the system accurately identified 338 reports while registering only 21 errors. Moreover, by detecting 27 instances of sand mining and waste disposal not reported by users, it exhibited completeness, correctness, and quality rates of 94.15%, 92.48%, and 86.63%, respectively. These findings underscore the system’s highly capable performance in detecting environmental interventions. Particularly, no special knowledge is required for volunteered reporting due to direct data storage and simple inputs. Simple inputs can be enhanced with satellite data for detailed reports. Our system possesses the several advantages, including simplicity, accessibility, low cost, minimal training, and expert reports by integrating user data with remote sensing.

Author Contributions

Conceptualization, M.B. and R.M.; Methodology, M.B.; Validation, M.M.; Formal analysis, M.M.; Investigation, M.M.; Data curation, M.M.; Writing—original draft, M.M., A.K. and A.M.S.; Writing—review & editing, J.W. and R.R.; Supervision, J.W. and R.R. All authors have read and agreed to the published version of the manuscript.

Funding

This research received no external funding.

Data Availability Statement

The data presented in this study are available on request.

Conflicts of Interest

The authors declare that they have no known competing financial interests or personal relationships that could have appeared to influence the work reported in this paper.

References

  1. Xiaohong, L.; Jie, C.; Hongyan, S. Cultural Connotation of Mountains, Rivers, Forests, Farmlands, Lakes, Grasslands and Deserts. J. Educ. Soc. Behav. Sci. 2023, 36, 104–115. [Google Scholar] [CrossRef]
  2. Horte, O.S.; Eisenman, T.S. Urban greenways: A systematic review and typology. Land 2020, 9, 40. [Google Scholar] [CrossRef]
  3. Sohns, A. River definitions reciprocally define us. Riv. Res. Appl. 2023; in press. [Google Scholar] [CrossRef]
  4. Fernandes, G.W.; Arantes-Garcia, L.; Barbosa, M.; Barbosa, N.P.; Batista, E.K.; Beiroz, W.; Resende, F.M.; Abrahão, A.; Almada, E.D.; Alves, E.; et al. Biodiversity and ecosystem services in the Campo Rupestre: A road map for the sustainability of the hottest Brazilian biodiversity hotspot. Perspect. Ecol. Conserv. 2020, 18, 213–222. [Google Scholar] [CrossRef]
  5. Miriti, M.N.; Rawson, A.J.; Mansfield, B. The history of natural history and race: Decolonizing human dimensions of ecology. Ecol. Appl. 2023, 33, e2748. [Google Scholar] [CrossRef] [PubMed]
  6. Karr, J.R.; Chu, E.W. Introduction: Sustaining living rivers. In Assessing the Ecological Integrity of Running Waters, Proceedings of the International Conference, Vienna, Austria, 9–11 November 1998; Springer: Dordrecht, The Netherlands, 2000; pp. 1–14. [Google Scholar]
  7. Postel, S.; Richter, B. Rivers for Life: Managing Water for People and Nature; Island Press: Lahaina, HI, USA, 2012. [Google Scholar]
  8. Rasul, G. Food, water, and energy security in South Asia: A nexus perspective from the Hindu Kush Himalayan region. Environ. Sci. Policy 2014, 39, 35–48. [Google Scholar] [CrossRef]
  9. Best, J. Anthropogenic stresses on the world’s big rivers. Nat. Geosci. 2019, 12, 7–21. [Google Scholar] [CrossRef]
  10. Anderson, E.P.; Jackson, S.; Tharme, R.E.; Douglas, M.; Flotemersch, J.E.; Zwarteveen, M.; Lokgariwar, C.; Montoya, M.; Wali, A.; Tipa, G.T.; et al. Understanding rivers and their social relations: A critical step to advance environmental water management. Wiley Interdiscip. Rev. Water 2019, 6, e1381. [Google Scholar] [CrossRef] [PubMed]
  11. Herman, F.; Beaud, F.; Champagnac, J.D.; Lemieux, J.M.; Sternai, P. Glacial hydrology and erosion patterns: A mechanism for carving glacial valleys. Earth Planet. Sci. Lett. 2011, 310, 498–508. [Google Scholar] [CrossRef]
  12. Gardner, J. How water, wind, waves and ice shape landscapes and landforms: Historical contributions to geomorphic science. Geomorphology 2020, 366, 106687. [Google Scholar] [CrossRef]
  13. Post, D.M.; Doyle, M.W.; Sabo, J.L.; Finlay, J.C. The problem of boundaries in defining ecosystems: A potential landmine for uniting geomorphology and ecology. Geomorphology 2007, 89, 111–126. [Google Scholar] [CrossRef]
  14. Morandín-Ahuerma, I.; Contreras-Hernández, A.; Ayala-Ortiz, D.A.; Pérez-Maqueo, O. Socio–ecosystemic sustainability. Sustainability 2019, 11, 3354. [Google Scholar] [CrossRef]
  15. Allan, J.D.; Castillo, M.M.; Capps, K.A.; Allan, J.D.; Castillo, M.M.; Capps, K.A. Rivers in the Anthropocene. In Stream Ecology: Structure and Function of Running Waters; Springer: Cham, Switzerland, 2021; pp. 1–17. [Google Scholar]
  16. Gladis, J.E. Conflict to Cooperation: An Axiological Analysis of Collaborative Resource Stewardship in the Nisqually River Watershed. Ph.D. Dissertation, University of Oregon, Eugene, OR, USA, 2023. [Google Scholar]
  17. Romagosa, F.; Eagles, P.F.; Lemieux, C.J. From the inside out to the outside in: Exploring the role of parks and protected areas as providers of human health and well-being. J. Outdoor Recreat. Tour. 2015, 10, 70–77. [Google Scholar] [CrossRef]
  18. Olivadese, M.; Dindo, M.L. Historic and Contemporary Gardens: A Humanistic Approach to Evaluate Their Role in Enhancing Cultural, Natural and Social Heritage. Land 2022, 11, 2214. [Google Scholar] [CrossRef]
  19. Sreebha, S.; Padmalal, D. Environmental impact assessment of sand mining from the small catchment rivers in the southwestern coast of India: A case study. Environ. Manag. 2011, 47, 130–140. [Google Scholar] [CrossRef]
  20. Koehnken, L.; Rintoul, M.S.; Goichot, M.; Tickner, D.; Loftus, A.C.; Acreman, M.C. Impacts of riverine sand mining on freshwater ecosystems: A review of the scientific evidence and guidance for future research. River Res. Appl. 2020, 36, 362–370. [Google Scholar] [CrossRef]
  21. Peduzzi, P. Sand, rarer than one thinks. Environ. Dev. 2014, 11, 682. [Google Scholar]
  22. Manju, U. I-sand: An environment friendly alternative to river sand in Reinforced Cement Concrete constructions. Constr. Build. Mater. 2016, 125, 1152–1157. [Google Scholar]
  23. Bhattacharya, R.K.; Chatterjee, N.D. River Sand Mining Modelling and Sustainable Practice; Springer International Publishing: Berlin/Heidelberg, Germany, 2021. [Google Scholar]
  24. Gavriletea, M.D. Environmental impacts of sand exploitation. Analysis of sand market. Sustainability 2017, 9, 1118. [Google Scholar] [CrossRef]
  25. Padmalal, D.; Maya, K.; Padmalal, D.; Maya, K. Impacts of river sand mining. In Sand Mining: Environmental Impacts and Selected Case Studies; Springer: Berlin/Heidelberg, Germany, 2014; pp. 31–56. [Google Scholar]
  26. Pandey, S.; Kumar, G.; Kumari, N.; Pandey, R. Assessment of causes and impacts of sand mining on river ecosystem. In Hydrogeochemistry of Aquatic Ecosystems; John Wiley & Sons Inc.: Hoboken, NJ, USA, 2023; pp. 357–379. [Google Scholar]
  27. Padmalal, D.; Maya, K.; Sreebha, S.; Sreeja, R. Environmental effects of river sand mining: A case from the river catchments of Vembanad lake, Southwest coast of India. Environ. Geol. 2008, 54, 879–889. [Google Scholar] [CrossRef]
  28. Ashraf, M.A.; Maah, M.J.; Yusoff, I.; Wajid, A.; Mahmood, K. Sand mining effects, causes and concerns: A case study from Bestari Jaya, Selangor, Peninsular Malaysia. Sci. Res. Essays 2011, 6, 1216–1231. [Google Scholar]
  29. Tobin, G.A. The levee love affair: A stormy relationship? JAWRA J. Am. Water Resour. Assoc. 1995, 31, 359–367. [Google Scholar] [CrossRef]
  30. Grundy-Warr, C.; Lin, S. The unseen transboundary commons that matter for Cambodia’s inland fisheries: Changing sediment flows in the Mekong hydrological flood pulse. Asia Pac. Viewp. 2020, 61, 249–265. [Google Scholar] [CrossRef]
  31. Gautam, D.; Adhikari, R.; Gautam, S.; Pandey, V.P.; Thapa, B.R.; Lamichhane, S.; Talchabhadel, R.; Thapa, S.; Niraula, S.; Aryal, K.R.; et al. Unzipping flood vulnerability and functionality loss: Tale of struggle for existence of riparian buildings. Nat. Hazards 2023, 119, 989–1009. [Google Scholar] [CrossRef]
  32. Madyise, T. Case Studies of Environmental Impacts of Sand Mining and Gravel Extraction for Urban Development in Gaborone. Ph.D. Dissertation, University of South Africa, Pretoria, South Africa, 2013. [Google Scholar]
  33. Jones, R.; Bessell-Browne, P.; Fisher, R.; Klonowski, W.; Slivkoff, M. Assessing the impacts of sediments from dredging on corals. Mar. Pollut. Bull. 2016, 102, 9–29. [Google Scholar] [CrossRef] [PubMed]
  34. Jan, F.; Min-Allah, N.; Düştegör, D. Iot based smart water quality monitoring: Recent techniques, trends and challenges for domestic applications. Water 2021, 13, 1729. [Google Scholar] [CrossRef]
  35. Mishra, R.K. Fresh water availability and its global challenge. Br. J. Multidiscip. Adv. Stud. 2023, 4, 1–78. [Google Scholar] [CrossRef]
  36. Yang, Y.; Zheng, J.; Zhang, M.; Zhu, L.; Zhu, Y.; Wang, J.; Zhao, W. Sandy riverbed shoal under anthropogenic activities: The sandy reach of the Yangtze River, China. J. Hydrol. 2021, 603, 126861. [Google Scholar] [CrossRef]
  37. Siddha, S.; Sahu, P. Impact of climate change on the river ecosystem. In Ecological Significance of River Ecosystems; Elsevier: Amsterdam, The Netherlands, 2022; pp. 79–104. [Google Scholar]
  38. Ayyam, V.; Palanivel, S.; Chandrakasan, S.; Ayyam, V.; Palanivel, S.; Chandrakasan, S. Sand mining and strategies for Its management. In Coastal Ecosystems of the Tropics-Adaptive Management; Springer: Singapore, 2019; pp. 201–217. [Google Scholar]
  39. Ta, W.; Jia, X.; Wang, H. Channel deposition induced by bank erosion in response to decreased flows in the sand-banked reach of the upstream Yellow River. Catena 2013, 105, 62–68. [Google Scholar] [CrossRef]
  40. Kondolf, G.M.; Schmitt, R.J.; Carling, P.; Darby, S.; Arias, M.; Bizzi, S.; Castelletti, A.; Cochrane, T.A.; Gibson, S.; Kummu, M.; et al. Changing sediment budget of the Mekong: Cumulative threats and management strategies for a large river basin. Sci. Total Environ. 2018, 625, 114–134. [Google Scholar] [CrossRef]
  41. Ekka, A.; Pande, S.; Jiang, Y.; der Zaag, P.V. Anthropogenic modifications and river ecosystem services: A landscape perspective. Water 2020, 12, 2706. [Google Scholar] [CrossRef]
  42. Da, S.; Le Billon, P. Sand mining: Stopping the grind of unregulated supply chains. Extr. Ind. Soc. 2022, 10, 101070. [Google Scholar] [CrossRef]
  43. Langer, W. Sustainability of aggregates in construction. In Sustainability of Construction Materials; Woodhead Publishing: Sawston, UK, 2016; pp. 181–207. [Google Scholar]
  44. Agboola, O.; Babatunde, D.E.; Fayomi, O.S.I.; Sadiku, E.R.; Popoola, P.; Moropeng, L.; Yahaya, A.; Mamudu, O.A. A review on the impact of mining operation: Monitoring, assessment and management. Results Eng. 2020, 8, 100181. [Google Scholar] [CrossRef]
  45. Venkateswarlu, K.; Nirola, R.; Kuppusamy, S.; Thavamani, P.; Naidu, R.; Megharaj, M. Abandoned metalliferous mines: Ecological impacts and potential approaches for reclamation. Rev. Environ. Sci. Bio/Technol. 2016, 15, 327–354. [Google Scholar] [CrossRef]
  46. Worlanyo, A.S.; Jiangfeng, L. Evaluating the environmental and economic impact of mining for post-mined land restoration and land-use: A review. J. Environ. Manag. 2021, 279, 111623. [Google Scholar] [CrossRef]
  47. Hackney, C.R.; Darby, S.E.; Parsons, D.R.; Leyland, J.; Best, J.L.; Aalto, R.; Nicholas, A.P.; Houseago, R.C. River bank instability from unsustainable sand mining in the lower Mekong River. Nat. Sustain. 2020, 3, 217–225. [Google Scholar] [CrossRef]
  48. Arthington, Á.H.; Naiman, R.J.; Mcclain, M.E.; Nilsson, C. Preserving the biodiversity and ecological services of rivers: New challenges and research opportunities. Freshw. Biol. 2010, 55, 1–16. [Google Scholar] [CrossRef]
  49. Capodaglio, A.G. Integrated, decentralized wastewater management for resource recovery in rural and peri-urban areas. Resources 2017, 6, 22. [Google Scholar] [CrossRef]
  50. Srinivas, R.; Singh, A.P.; Shankar, D. Understanding the threats and challenges concerning Ganges River basin for effective policy recommendations towards sustainable development. Environ. Dev. Sustain. 2020, 22, 3655–3690. [Google Scholar] [CrossRef]
  51. Elwood, S.; Goodchild, M.F.; Sui, D.Z. Researching volunteered geographic information: Spatial data, geographic research, and new social practice. Ann. Assoc. Am. Geogr. 2012, 102, 571–590. [Google Scholar] [CrossRef]
  52. See, L.; Mooney, P.; Foody, G.; Bastin, L.; Comber, A.; Estima, J.; Fritz, S.; Kerle, N.; Jiang, B.; Laakso, M.; et al. Crowd-sourcing, citizen science or volunteered geographic information? The current state of crowd-sourced geographic information. ISPRS Int. J. Geo-Inf. 2016, 5, 55. [Google Scholar] [CrossRef]
  53. Antoniou, V. On volunteered geographic information quality: A framework for sharing data quality information. In Geoinformatics for Geosciences; Elsevier: Amsterdam, The Netherlands, 2023; pp. 149–160. [Google Scholar]
  54. Vahidnia, M.H. Citizen participation through volunteered geographic information as equipment for a smart city to monitor urban decay. Environ. Monit. Assess. 2023, 195, 181. [Google Scholar] [CrossRef]
  55. Moghadas, M.; Rajabifard, A.; Fekete, A.; Kötter, T. A framework for scaling urban transformative resilience through utilizing volunteered geographic information. ISPRS Int. J. Geo-Inf. 2022, 11, 114. [Google Scholar] [CrossRef]
  56. Koswatte, S.; McDougall, K.; Liu, X. SDI and crowd-sourced spatial information management automation for disaster management. Surv. Rev. 2015, 47, 307–315. [Google Scholar] [CrossRef]
  57. Bao, J.; Zheng, Y.; Wilkie, D.; Mokbel, M. Recommendations in location-based social networks: A survey. GeoInformatica 2015, 19, 525–565. [Google Scholar] [CrossRef]
  58. Li, Z.; Huang, Q.; Emrich, C.T. (Eds.) Social Sensing and Big Data Computing for Disaster Management; Routledge: London, UK, 2020. [Google Scholar]
  59. Tiwari, P.C.; Pal, R.; Chaudhary, M.J.; Nath, R. Artificial intelligence revolutionizing drug development: Exploring opportunities and challenges. Drug Dev. Res. 2023, 84, 1652–1663. [Google Scholar] [CrossRef]
  60. Verplanke, J.; McCall, M.K.; Uberhuaga, C.; Rambaldi, G.; Haklay, M. A shared perspective for PGIS and VGI. Cartogr. J. 2016, 53, 308–317. [Google Scholar] [CrossRef]
  61. Boella, G.; Calafiore, A.; Grassi, E.; Rapp, A.; Sanasi, L.; Schifanella, C. FirstLife: Combining social networking and VGI to create an urban coordination and collaboration platform. IEEE Access 2019, 7, 63230–63246. [Google Scholar] [CrossRef]
  62. Abbasi, K.; Mouludi-Saleh, A.; Eagderi, S. The variability of morphometric and meristic characteristics of Urmia chub, Petroleuciscus ulanus (Günther, 1899) in the Mahabd-Chai and Godar-Chai rivers, Lake Urmia basin. Limnol. Freshw. Biol. 2021, 4, 1156–1159. [Google Scholar] [CrossRef]
  63. Houshyar, H. CDS Strategy-Based Participatory Vision Building in Border Cities (Case Study: Oshnavieh City). J. Bord. Sci. Technol. 2020, 9, 1–33. [Google Scholar]
  64. Mohammadpour, M. Water Use Management Effect on the Oshnavieh and Naghadeh Plain’s Surface-Water Resource Using WEAP Model. Water Resour. Eng. 2020, 13, 71–84. [Google Scholar]
  65. Geo Server. An Open Source Server for Sharing Geospatial Data. Available online: http://geoserver.org/ (accessed on 20 February 2024).
  66. Miu, M.; Zhang, X.; Dewan, M.A.A.; Wang, J. Development of Framework for Aggregation and Visualization of Three-Dimensional (3D) Spatial Data. Big Data Cogn. Comput. 2018, 2, 9. [Google Scholar] [CrossRef]
  67. Crosetto, M.; Monserrat, O.; Cuevas-González, M.; Devanthéry, N.; Crippa, B. Persistent scatterer interferometry: A review. ISPRS J. Photogramm. Remote Sens. 2016, 115, 78–89. [Google Scholar] [CrossRef]
  68. Cian, F.; Blasco, J.M.D.; Carrera, L. Sentinel-1 for monitoring land subsidence of coastal cities in Africa using PSInSAR: A methodology based on the integration of SNAP and staMPS. Geosciences 2019, 9, 124. [Google Scholar] [CrossRef]
  69. Serco Italia SPA. SNAP2StaMPS: Data Preparation for StaMPS PSI Processing with SNAP-Mexico City 2020 (Version 1.1). 2020. Available online: https://eo4society.esa.int/wp-content/uploads/2022/01/HAZA09_SNAP2StaMPS_MexicoCity_Tutorial.pdf (accessed on 20 February 2024).
  70. Delgado Blasco, J.M.; Foumelis, M.; Stewart, C.; Hooper, A. Measuring urban subsidence in the Rome metropolitan area (Italy) with Sentinel-1 SNAP-StaMPS persistent scatterer interferometry. Remote Sens. 2019, 11, 129. [Google Scholar] [CrossRef]
  71. Roostaei, S.; Najafvand, S. Plain Subsidence Monitoring based on SNAP2STAMPS Automated Algorithm by Radar Interferometry (PSI) Method (Case study: Marand Plain). J. Geogr. Environ. Hazards 2023, 11, 21–42. [Google Scholar]
  72. Duan, M.; Xu, B.; Li, Z.; Wu, W.; Cao, Y.; Liu, J.; Wang, G.; Hou, J. A new weighting method by considering the physical characteristics of atmospheric turbulence and decorrelation noise in SBAS-InSAR. Remote Sens. 2020, 12, 2557. [Google Scholar] [CrossRef]
  73. Maleki, M.; Sabour, S.M.T.; Rahmati, M.; Arjomand, B. Statistical integration of radar and optical data for geomorphological feature extraction. Int. J. Image Process. Pattern Recognit. 2017, 3, 1–10. [Google Scholar]
  74. Maleki, M.; Tavakkoli Sabour, S.M.; Zeaieanfirouzabadi, P.; Raeisi, M. Comparison of optic and radar data for terrain feature extraction. J. RS GIS Nat. Resour. 2018, 9, 93–107. [Google Scholar]
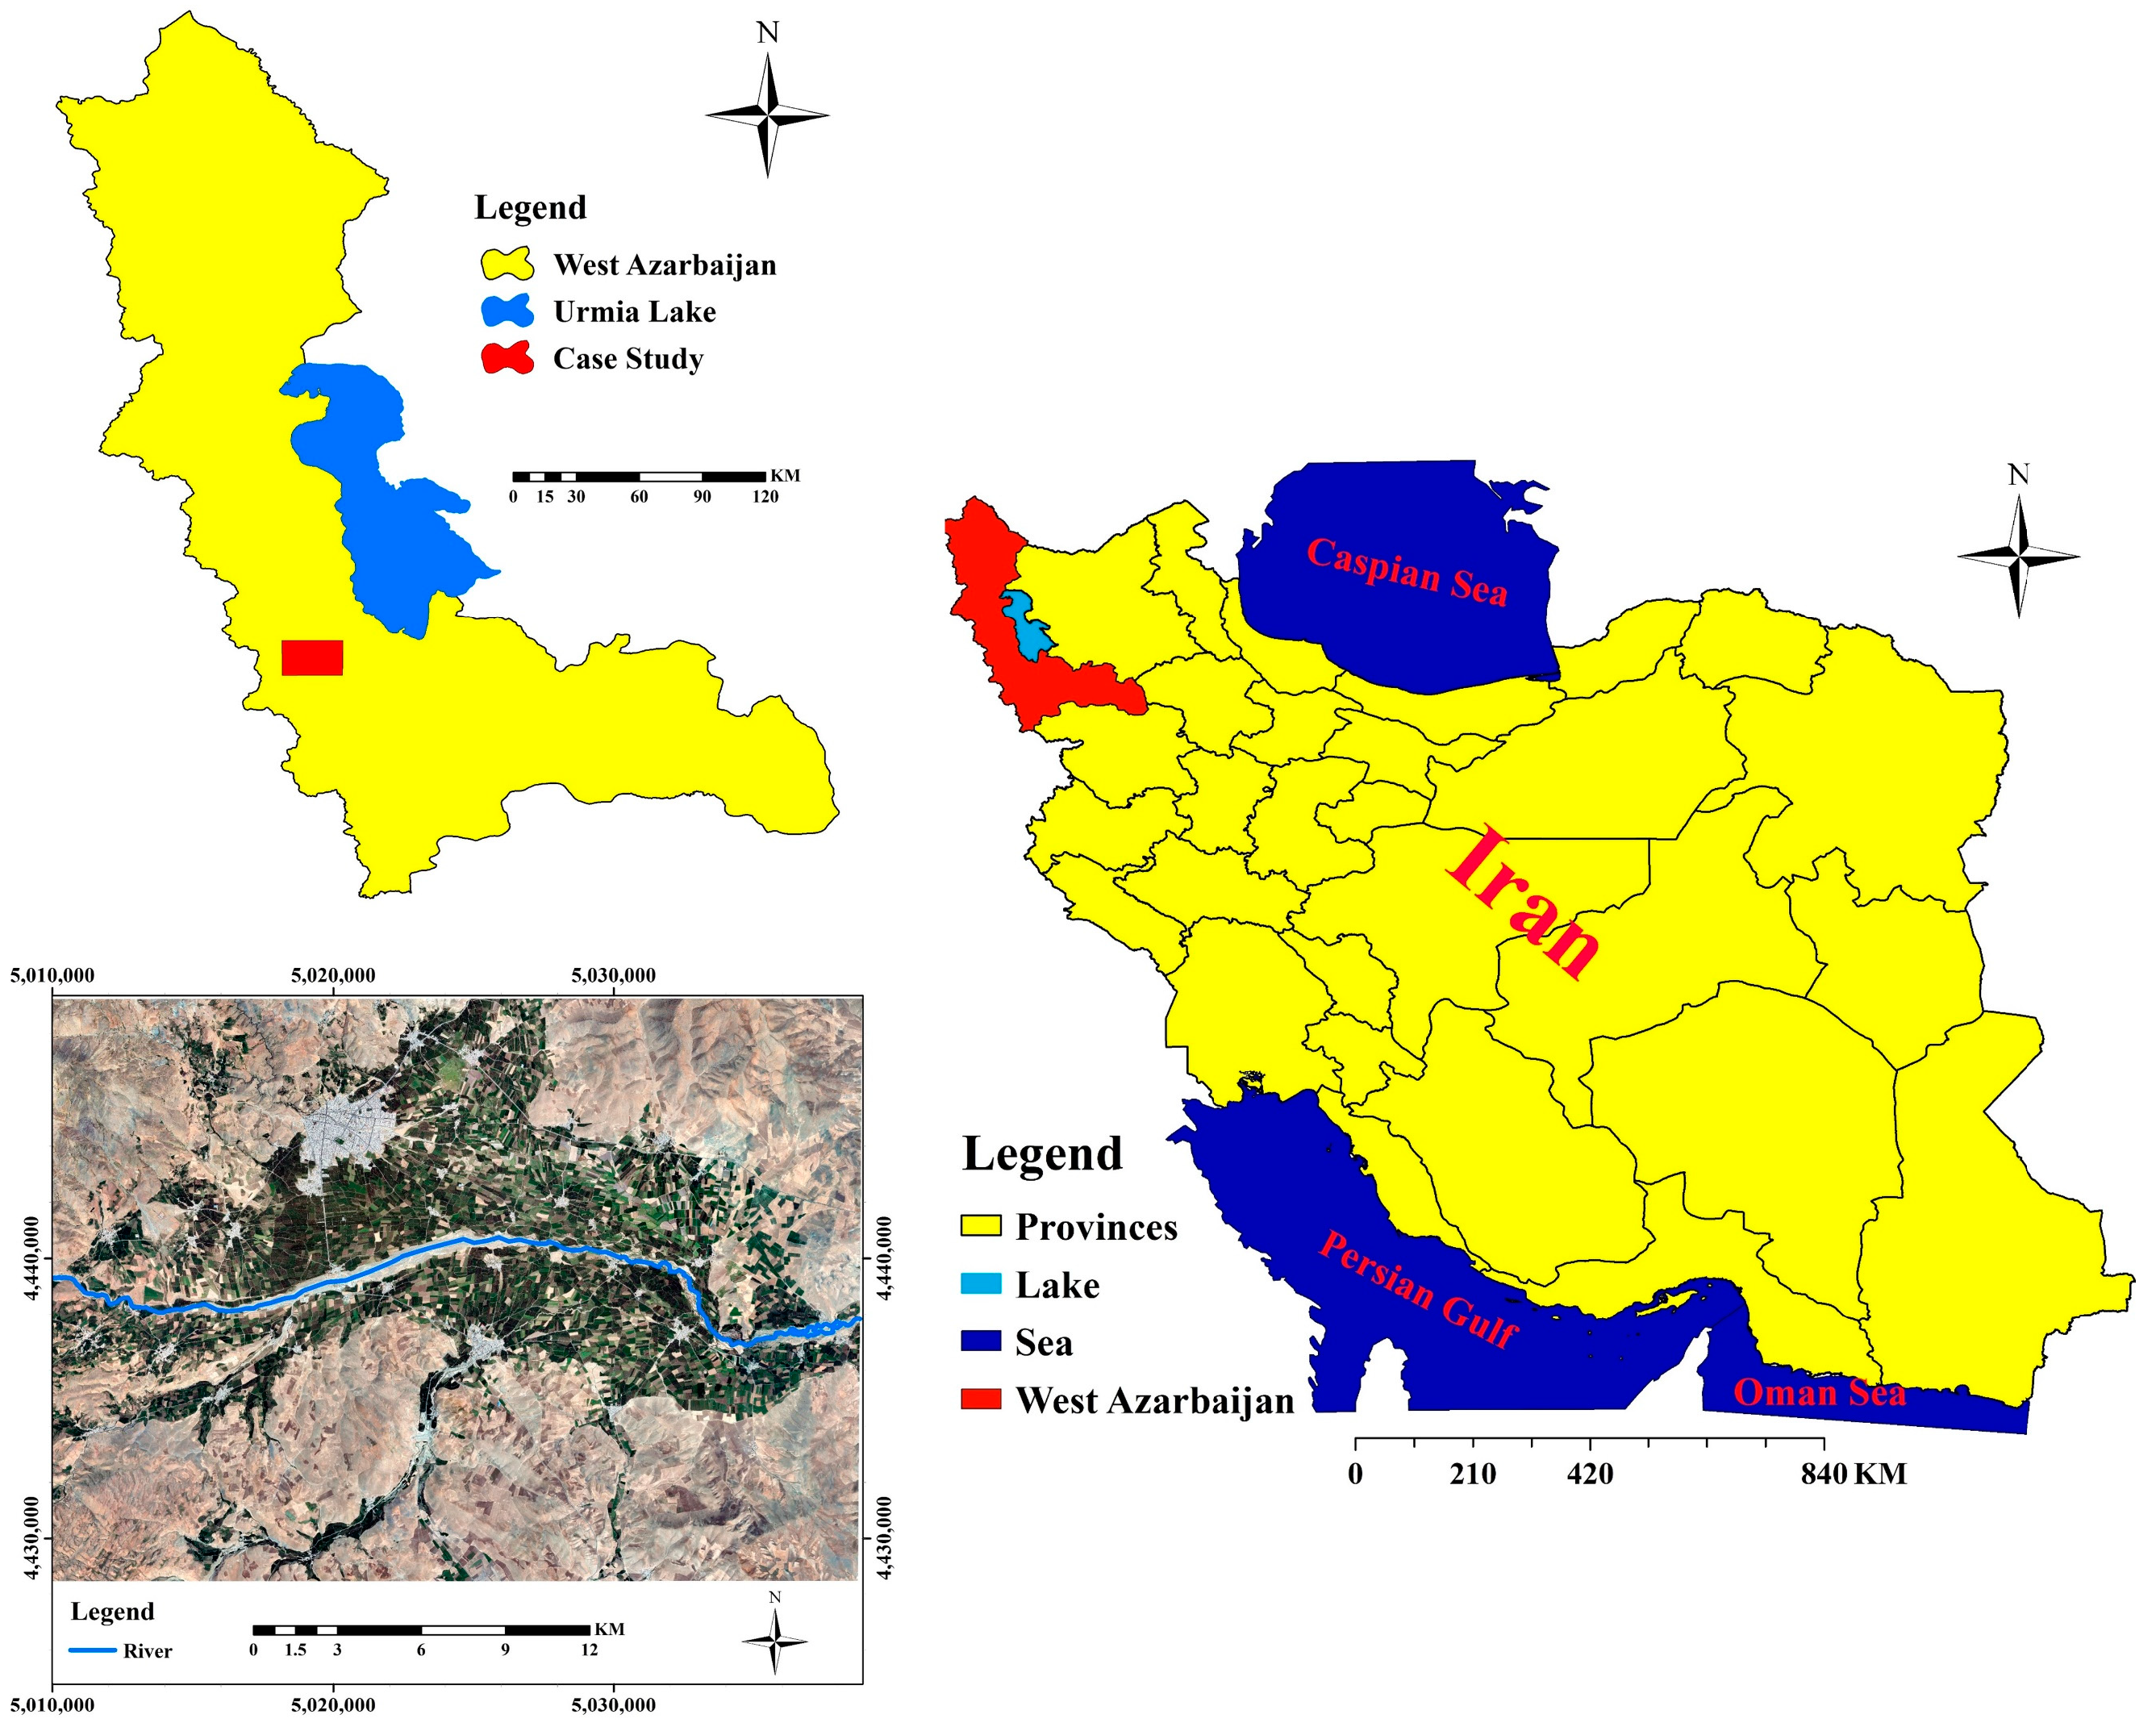
Figure 1. Study area location of the Gadar River in Oshnavieh, Iran.
Water 16 00734 g001
Figure 2. The structure and main components of the web-based VGI system for data management.
Water 16 00734 g002
Figure 3. Graphic user interface for entering the users’ information.
Water 16 00734 g003
Figure 4. View results of event types and location and reports.
Water 16 00734 g004
Figure 5. Report event types and queries implemented by the public participants.
Water 16 00734 g005
Figure 6. The reported types of activity.
Water 16 00734 g006
Figure 7. Distribution of volunteer participants: (a) educational degree and (b) gender.
Water 16 00734 g007
Figure 8. Land subsidence map with reported points.
Water 16 00734 g008
Figure 9. The height changes in points reported by people are calculated from satellite images.
Water 16 00734 g009
Table 1. Input data land subsidence.
Type of ImagesDataChannelPolarizationAngle of IncidenceSpatial Resolution
Master15 February 2021CVV23.85 × 20
Slave23 June 2023CVV23.85 × 20
Table 2. Validation report.
All ReportsTPFPFNCompletenessCorrectnessQuality
359338212794.15%92.48%86.63%
Disclaimer/Publisher’s Note: The statements, opinions and data contained in all publications are solely those of the individual author(s) and contributor(s) and not of MDPI and/or the editor(s). MDPI and/or the editor(s) disclaim responsibility for any injury to people or property resulting from any ideas, methods, instructions or products referred to in the content.