Abstract
This study examined the impacts of climate change and human activities on runoff within the Feiling Hydrological Station watershed in the Qinhe River basin, utilizing the SWAT (Soil and Water Assessment Tool) model. Several climate change and extreme land-use scenarios were evaluated for their effects on runoff. Results demonstrated the SWAT model’s suitability for runoff simulation in the watershed, revealing a negative correlation between runoff and temperature changes, and a positive correlation with precipitation changes. Significantly, runoff responses to precipitation variations of ±10% and ±20% were more marked than those to temperature changes of ±1 °C and ±2 °C. In scenarios of extreme woodland and fallow land, runoff decreased, whereas in scenarios of extreme cropland and grassland, it increased, particularly in the extreme farmland scenario. The study’s findings are important for the sensible management of soil and water resources and the enhancement of the natural environment in the studied area.
1. Introduction
Water scarcity is a prevalent issue in many locations worldwide due to rapid socioeconomic growth and a significant rise in population density [1,2]. The runoff volume of numerous basins has substantially changed due to the combined influence of climate change and human activities, resulting in a considerable impact on the water resources and channels of these basins [3,4,5]. Water science is a prominent research area among researchers worldwide. Investigating runoff processes and patterns is crucial for understanding and effectively managing water resources in a river basin and is the foundation for addressing water resource issues [6].
The distributed hydrological model SWAT (Soil and Water Assessment Tool), with its robust simulation capabilities and versatile applications, has been extensively used across fields like hydrological processes, non-point source pollution, land use, and agricultural management [7,8]. SWAT’s strengths lie in its capacity to simulate complex hydrological processes in large and medium-sized basins by integrating GIS and remote sensing technologies and performing long-term sequence simulations efficiently and with readily available input variables. Internationally, SWAT is predominantly applied to study the spatiotemporal evolution characteristics of runoff processes and make future hydrological predictions [9], while in China it is often utilized to explore the spatio-temporal variability of hydrological processes, predict hydrological shifts in response to changing environments, and calculate ecological recharge and flow [10,11,12,13].
Recent years have seen significant strides in research on the effects of climate change and human activities on runoff, especially as global warming and frequent human activities intensify. Studies indicate that global warming has led to an increase in extreme precipitation events, profoundly impacting hydrological balance and water resource availability [14,15]. In China, rapid economic growth and urbanization have accentuated human impacts on basin runoff [16,17]. Although ample research has concentrated on this field, the intricate mechanisms of these factors under specific geographic locations, climatic backdrops, and socio-economic conditions still demand more in-depth exploration.
Against this background and need, the current study, using the latest data and advanced hydrological model SWAT, delves into the combined impacts of climate change and human activities on runoff in the Feiling Hydrological Station watershed above the Qinhe River. Located in Shanxi Province of China, an important agricultural area and one of the water-rich regions of the North China Plain, the watershed faces increasing conflicts between water supply and demand amid swift economic development and accelerating urbanization [18,19]. However, existing research has mostly focused on diffuse pollution and ecological water replenishment [20,21,22,23], with scarce in-depth examination of runoff characteristics in the basin reported. By constructing a SWAT model and analyzing the impact of different climate change and land-use scenarios on runoff, this study aims to provide scientific evidence and theoretical guidance for future water resource management and environmental conservation in the Qinhe River basin and similar areas. By combining historical data and scenario simulations, we seek to reveal the hydrological responses of the Feiling Hydrological Station watershed above the Qinhe River under the dual pressures of climate change and human activities and assess the potential implications of these shifts for sustainable water resource management [24,25].
Recent findings underscore that the formulation of adaptive water resource management strategies must be grounded in a profound understanding of the hydrological dynamics of a basin [26,27]. Consequently, this study’s outcomes not only provide empirical foundations for water resource management above the Feiling Hydrological Station watershed but also serve as a reference for formulating effective adaptive management strategies in global regions facing the challenges brought about by climate change and human activities [28,29].
In summary, the comprehensive analysis conducted on the Feiling Hydrological Station watershed above the Qinhe River using the SWAT model not only fills a gap in existing research but also contributes new insights into the scientific management and sustainable use of basin water resources. By exploring the influences of climate change and human activities, this study highlights the importance of bolstering research into the hydrological processes and their trends within a basin, particularly against the backdrop of global warming, to ensure the effective management and conservation of water resources.
2. Materials and Methods
2.1. Overview of the Study Area and Data Sources
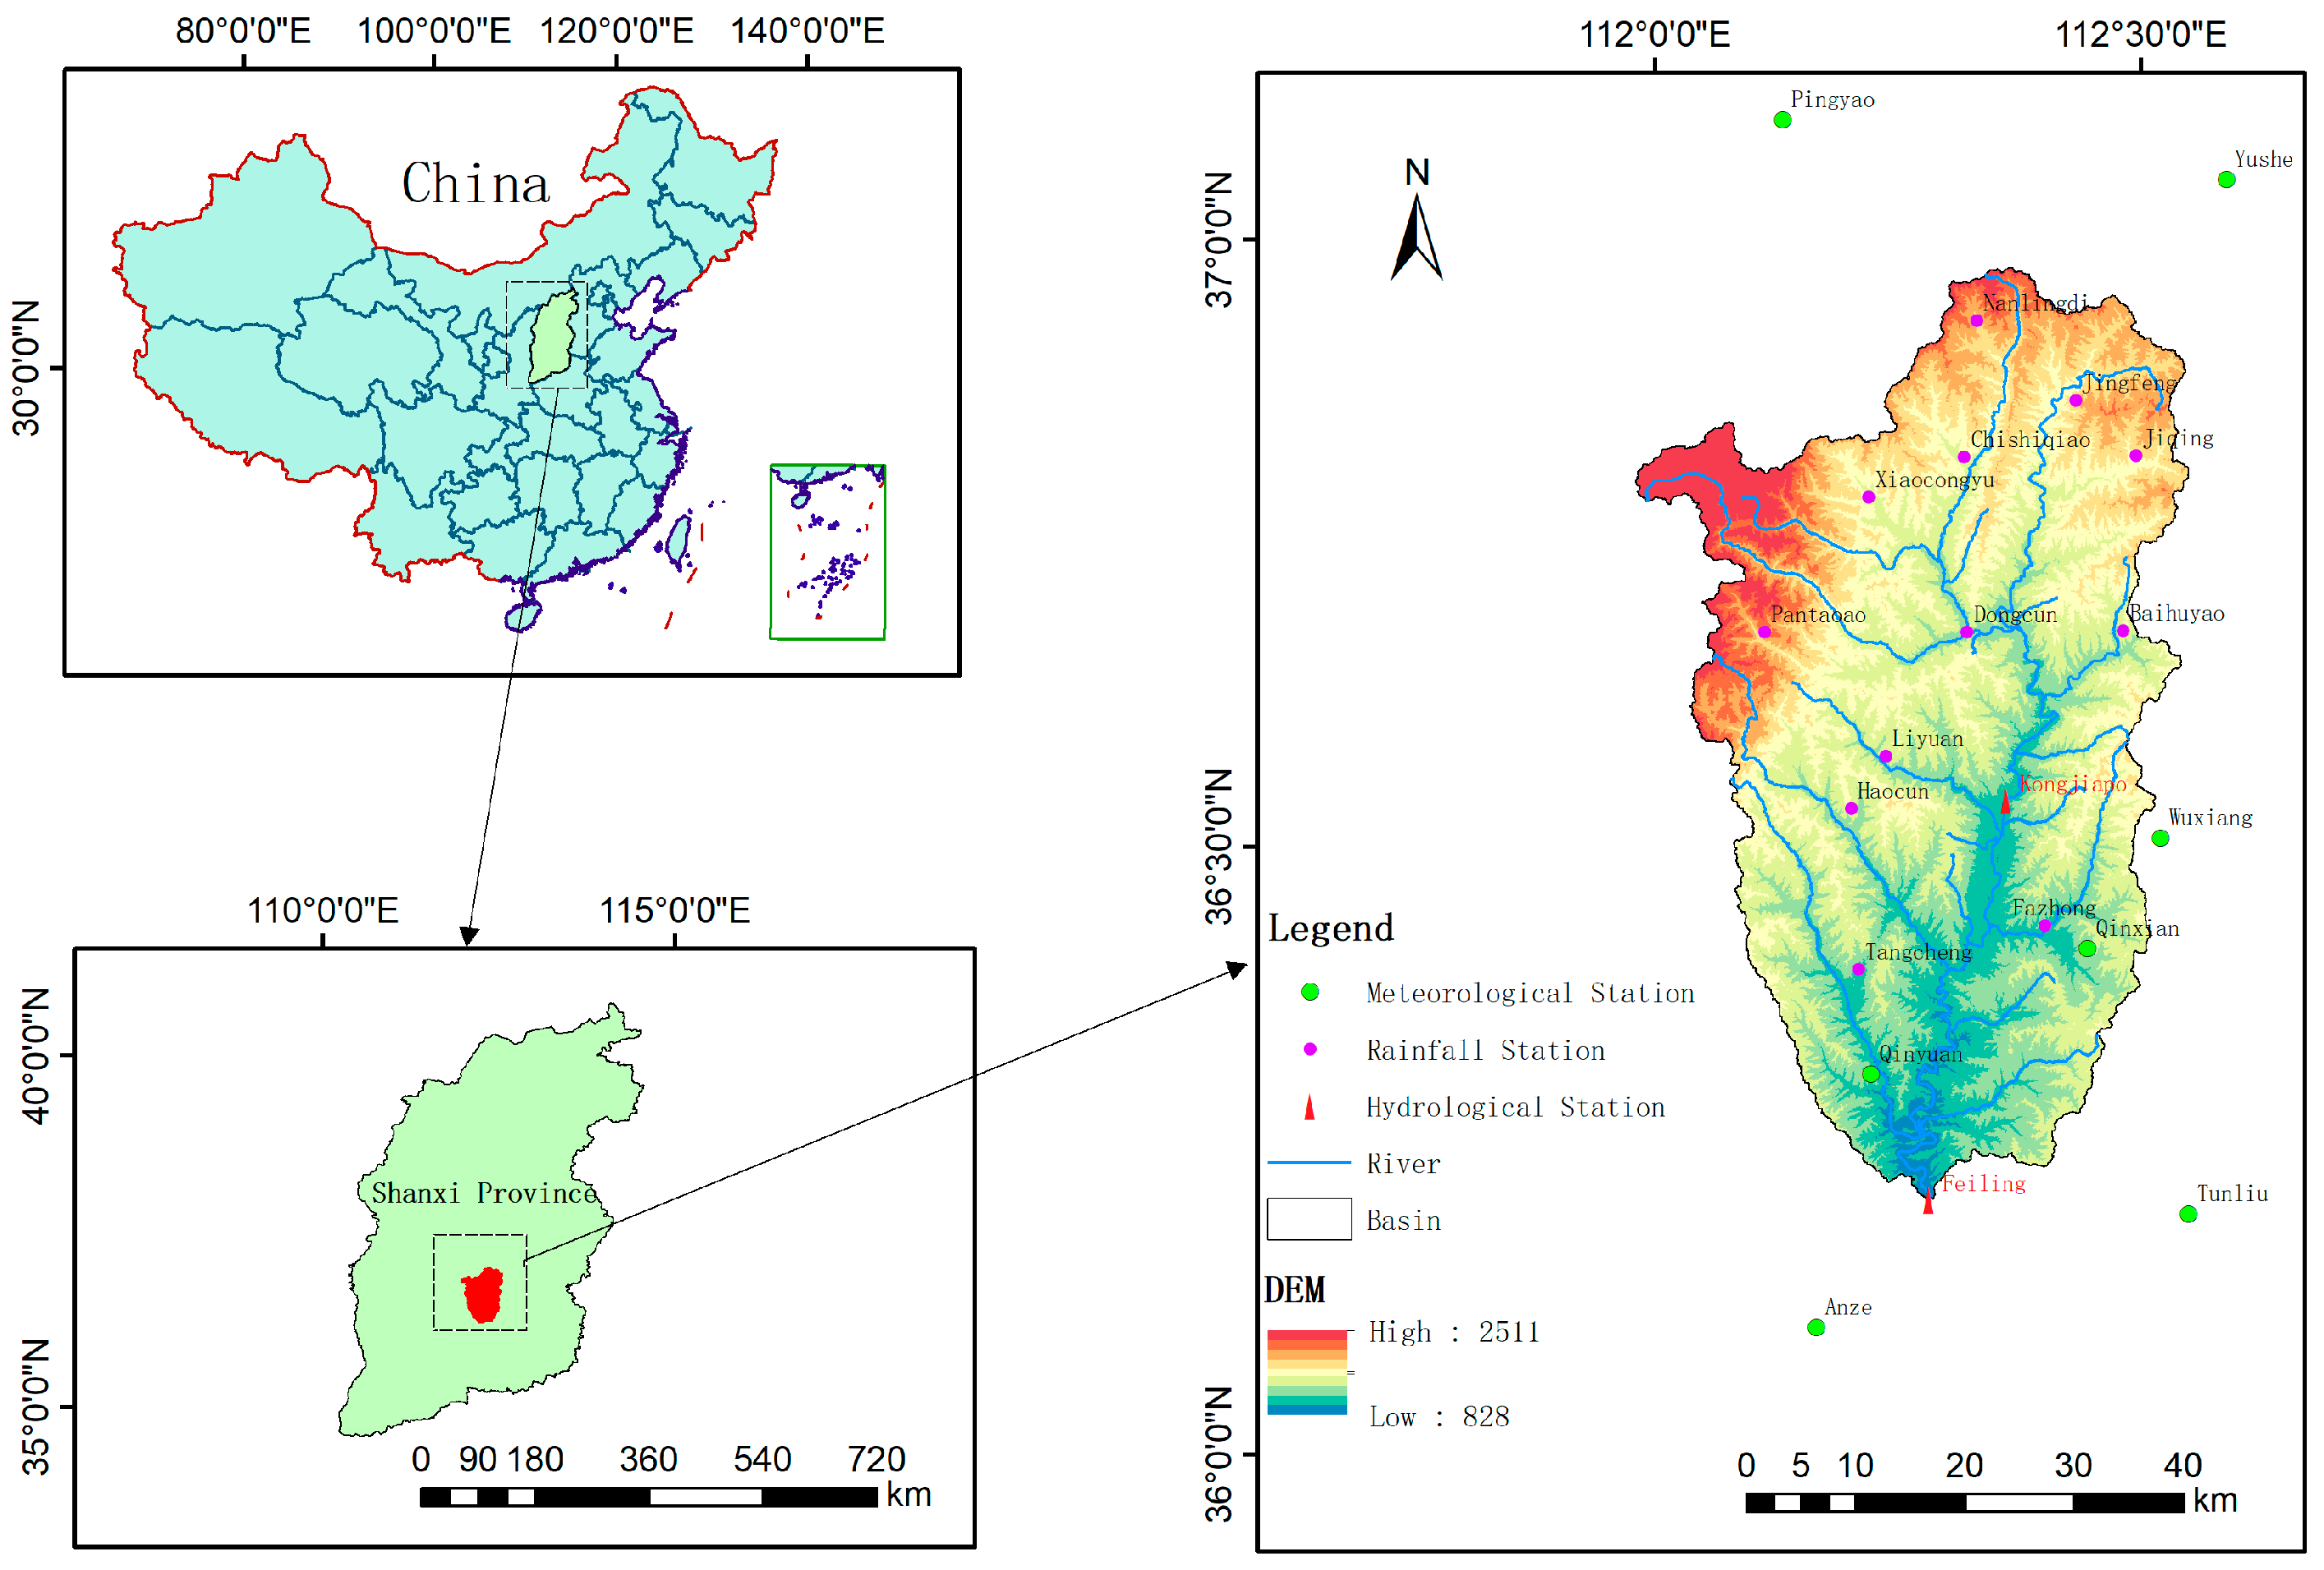
The study area is located in the control basin of the Feiling Hydrological Station of the Qinhe River, geographically located between 111°56′~112°34′ E longitude and 36°12′~36°59′ N latitude. The main Qinhe River in the study area has a length of 137 km, with a watershed area of 2683 km2, a longitudinal drop of 2.9‰, and a watershed shape coefficient of 0.143. The watershed has a continental monsoon climate, with an average rainfall of 597.8 mm, average temperature of 5~11 °C, and average water surface evaporation of 1000 mm. The average sunshine hours are 2314 h, the average evapotranspiration (ET) is 857.61 mm, and the average potential evapotranspiration (PET) is 1688.88 mm [30]. The location map of the study area is shown in Figure 1.
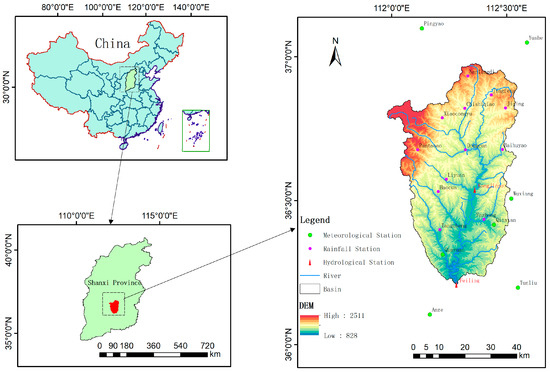
Figure 1.
Location map of the study area and distribution of hydrometeorological stations.
The spatial data for the watersheds in the research area were obtained from multiple databases for this study. This study employed 30 m resolution Digital Elevation Model (DEM) data sourced from the Geospatial Data Cloud, a repository operated by the Chinese Academy of Sciences (http://www.gscloud.cn (accessed on 1 June 2023)). In addition, land-use data were acquired from the Resource and Environment Science Data Center, which is, likewise, managed by the Chinese Academy of Sciences (http://www.resdc.cn (accessed on 1 June 2023)). The data include watershed soil type information from the Harmonized World Soil Database (HWSD) at a scale of 1:1 million. The data utilized in this study consist of daily precipitation measurements from 12 rainfall stations within the study area, as well as daily average flow data from the Kongjiapo Hydrological Station and Feiling Hydrological Station. These data were provided by the General Station of Hydrological and Water Resource Surveying of Shanxi Province for the period of 1988–2018. Meteorological data for the analysis were sourced from the Pingyao, Yushe, Wuxiang, Qinxian, Qinyuan, Anze, and Tunliu meteorological stations, as part of the China Meteorological Data Sharing Network (CMDSN). These data included daily records of precipitation, temperature, solar radiation, wind speed, and relative humidity, which are essential for assessing the Qinhe River’s hydrological response. The precise details and arrangement of the hydrometeorological stations in the study area can be observed in Table 1 and Figure 1. The data utilized in this study underwent rigorous testing and compilation to adhere to the prescribed parameters. They were thoroughly assessed for consistency, completeness, and representativeness, ensuring their completeness, accuracy, and reliability.

Table 1.
Basic information on hydrometeorological stations in the study area.
2.2. SWAT Model Fundamentals
The SWAT model, developed by the U.S. Agricultural Research Service (ARCS), is a widely used hydrological model in domestic and international studies. It is open-source and semi-distributed, with a strong physical mechanism. The model allows for the simulation of long-term continuous time series and is particularly useful for assessing the impact of climate change and evaluating and managing water resources. Basin hydrological modeling consists of two primary phases. The first is the terrestrial phase of the hydrological cycle, which involves the mobilization and alteration of water, sand, and other components (such as nutrients and pesticides) as they are transported and changed in each sub-basin before reaching the main river channel. The second is the confluence and dynamic phases of the hydrological cycle, which refers to the movement of water flow, sediment, nutrients, and other substances in the river channel toward the basin outlet.
The water balance is an important foundation for driving the hydrological cycle processes of the SWAT model [31], as described in Equation (1):
where is the water content of the soil at time , mm; is the soil water content at the beginning of the time period, mm; is the calculation time period, d; is the precipitation on day , mm; is the runoff from the surface on day , mm; is the evapotranspiration on day , mm; is the infiltration water into the soil profile on day , mm; and is the base flow rate on day , mm.
During precipitation, part of the water is retained by the canopy, and the other part reaches the ground to form surface runoff or infiltrate into the soil. The surface runoff sinks into the river to produce a short-term hydrological response, and part of the infiltrated water undergoes evapotranspiration or is absorbed by plants. The remaining part laterally sinks into the river or continues to infiltrate.
2.3. Indicators for Model Evaluation
The paper selects the relative error (), the determination coefficient (), and the Nash–Sutcliffe efficiency coefficient () as the indices for evaluating the simulation accuracy of the model through comparison [32]. The calculated equations are shown in Equations (2)–(4):
where represents the simulated value, represents the measured value, represents the simulated mean value, represents the measured mean value, and n represents the number of measured values.
The relative error quantifies the discrepancy between the model simulation and the actual value. A positive number indicates a large simulated value, while a negative value shows a small simulated value. A simulation’s degree of accuracy increases as its value approaches 0. The coefficient of determination quantifies the extent to which the observed and simulated values are linearly related. A value closer to 1 indicates a stronger fit of the simulated value to the measured value. On the other hand, the Nash–Sutcliffe efficiency coefficient measures the degree of agreement between the simulated and observed values. It ranges from 0 to 1, with a value closer to 1 indicating a higher level of agreement. Based on prior study findings, it is established that the runoff simulation results are deemed acceptable when the Relative Error () is within the range of ±25%, the coefficient of determination () is greater than 0.5, and the Nash–Sutcliffe Efficiency () is greater than 0.5 [33].
2.4. Design of Climate Change and Land-Use Scenarios
2.4.1. Climate Change Scenario Design
Temperature directly reflects climate change, while precipitation is the direct force behind runoff formation. Therefore, this study primarily focuses on temperature and precipitation when examining the impact of climate change on runoff. Based on the IPCC’s Fourth Assessment Report predictions for China’s climate trends over the next 40 years [34], the “incremental scenario approach” was employed to design climate change scenarios. This involved adjusting baseline climatic data based on selected incremental changes to generate a series of scenarios simulating different climatic conditions.
The specific settings for the climate change scenarios are shown in Table 2, comprising 25 different scenarios: Scenarios C13, C23, C43, and C53 involve climate change scenarios where precipitation remains constant while temperature rises or falls; Scenarios C31, C32, C34, and C35 involve climate change scenarios where temperature remains constant while precipitation increases or decreases; Scenario C33 serves as the baseline scenario; and the rest involve climate change scenarios with various changes in both temperature and precipitation.
Table 2.
Climate Change Scenario Settings.
It is anticipated that a rise in temperature will accelerate snowmelt and increase evaporation, potentially leading to a decrease in runoff, while a decrease in temperature would have the opposite effect; an increase in precipitation would directly lead to an increase in runoff, especially in scenarios where extreme precipitation events become more frequent, potentially exacerbating flood risks, with a reduction in precipitation having the opposite effect.
Although a rise in temperature may indirectly alter precipitation patterns, such as increasing the frequency and intensity of short-duration heavy precipitation events, the core focus of this study was to explore the direct impacts of temperature and precipitation changes on runoff volume and its seasonal distribution. Given the scope of the present study and the specific limitations of the employed model, this paper does not delve into how an increase in temperature might indirectly affect runoff by altering precipitation patterns. Future research could consider employing more advanced models and methodologies to more precisely simulate the impacts of climate changes on precipitation patterns and the complex feedback mechanisms of hydrological processes, thereby providing a more comprehensive assessment of climate change impacts.
2.4.2. Land-Use Scenario Design
To better understand the impact of land-use changes on runoff in the area upstream of the Feiling Hydrological Station in the Qinhe River, this study designed a series of land-use scenarios aimed at assessing the potential impact of changes in different land cover types on runoff [35]. Keeping climatic conditions constant, the land-use data for the study area from 2010 and the meteorological data from 1988 to 2018 were taken as the baseline for the basic scenario (L0).
The extreme forest land scenario (L1): In this scenario, all land in the current study area, except for water bodies and built-up land, is assumed to be converted to forest land. This transformation is expected to increase vegetation coverage, which may lead to increased evapotranspiration and reduced surface runoff, ultimately decreasing the runoff volume in the watershed.
The extreme pasture scenario (L2): In this scenario, all land in the current study area, except for water bodies and built-up land, is assumed to be converted to pasture. Pasture coverage may affect runoff volume by enhancing precipitation infiltration and water retention capabilities through its root structure and soil cover characteristics.
The extreme agricultural land scenario (L3): In this scenario, all land in the current study area, except for water bodies and built-up land, is assumed to be converted to cropland. An increase in cropland is expected to lead to an increase in surface runoff due to farming activities such as land leveling, compaction, and plowing, which decrease soil porosity and permeability, thereby increasing surface runoff.
The retirement of agricultural land to forest land scenario (L4): Following national policy for returning farmland on slopes over 25° to forest land, this study assumes the conversion of all 75.12 km2 of cropland with a slope greater than 25° in the basic scenario to forest land to simulate the effects of this policy on watershed runoff. It is anticipated to increase vegetation coverage in the watershed, thereby enhancing the soil’s water retention capability and reducing the rate of surface runoff, leading to a reduction in the watershed’s runoff volume.
In these simulation scenarios, we assume that the transition of land-use types occurs instantaneously, aiming to simulate the maximum impact of a single land-use type on watershed runoff without gradual transition processes. We acknowledge that, in the real world, land-use transitions are typically gradual and complex, rather than the instantaneous changes assumed in our model. Therefore, our simulation results should be regarded as a theoretical assessment of the potential impact of extreme policy changes, rather than specific predictions of real-world conditions.
The areas of each land-use type under different scenarios are shown in Table 3 below.
Table 3.
Statistics on the area of each land-use type under different scenarios.
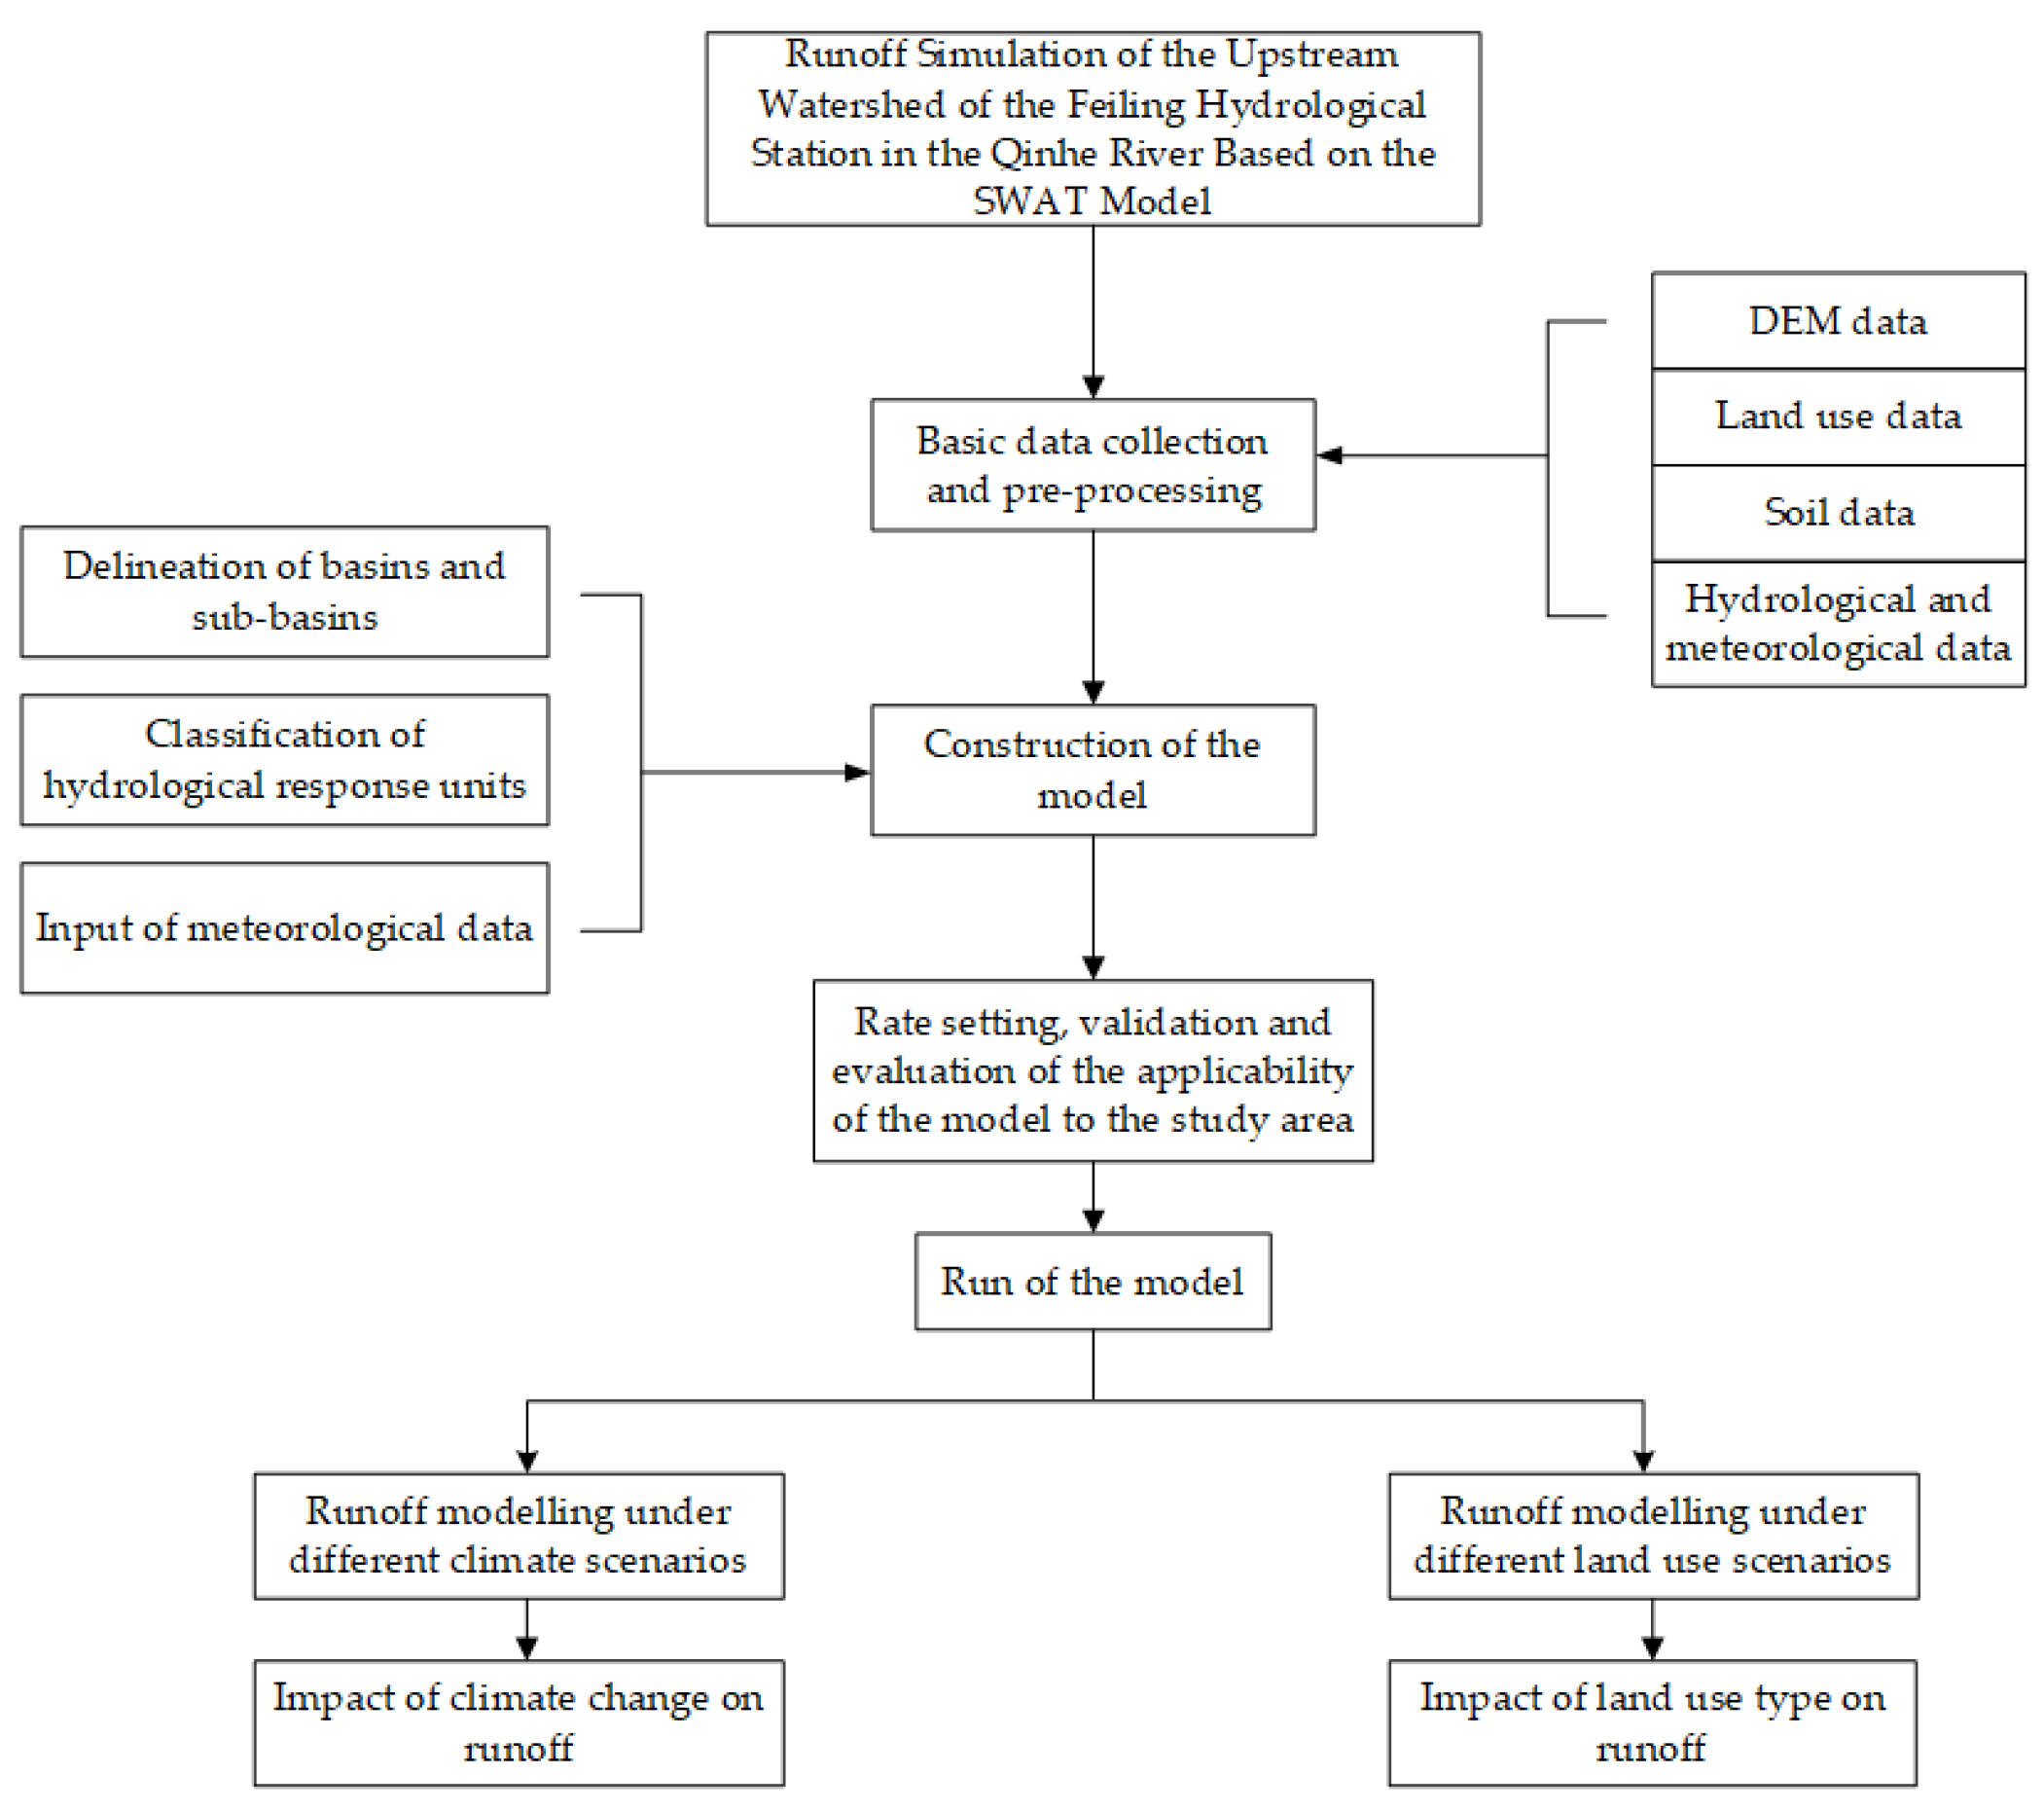
The methodology of this study, as well as the detailed steps of data processing and model application, are visually presented in the following figure. The flowchart meticulously illustrates the entire process of SWAT model construction, from the delineation of watersheds and sub-basins and classification of hydrological response units to the input of meteorological data. Additionally, the model’s parameterization, validation, and the assessment of its applicability to the study area are also depicted. Upon the completion of the model’s run, further simulations of runoff under various climate and land-use scenarios were conducted, analyzing the impacts of climate change and land-use variation on runoff. The flowchart (Figure 2) succinctly summarizes the technical route of this research, facilitating a deeper understanding of the entire research framework for the readers.
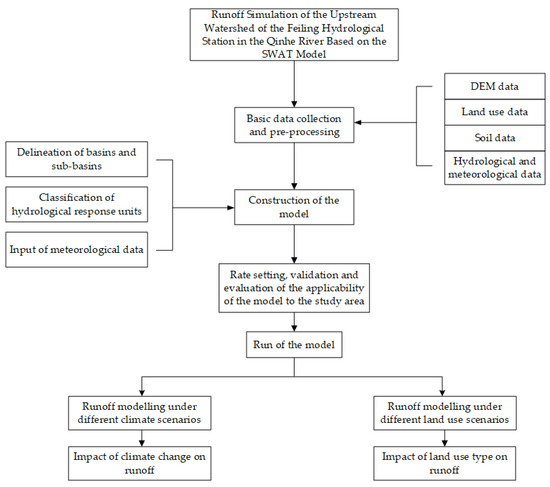
Figure 2.
Schematic of the research methodology.
3. Results and Discussion
3.1. Model Building
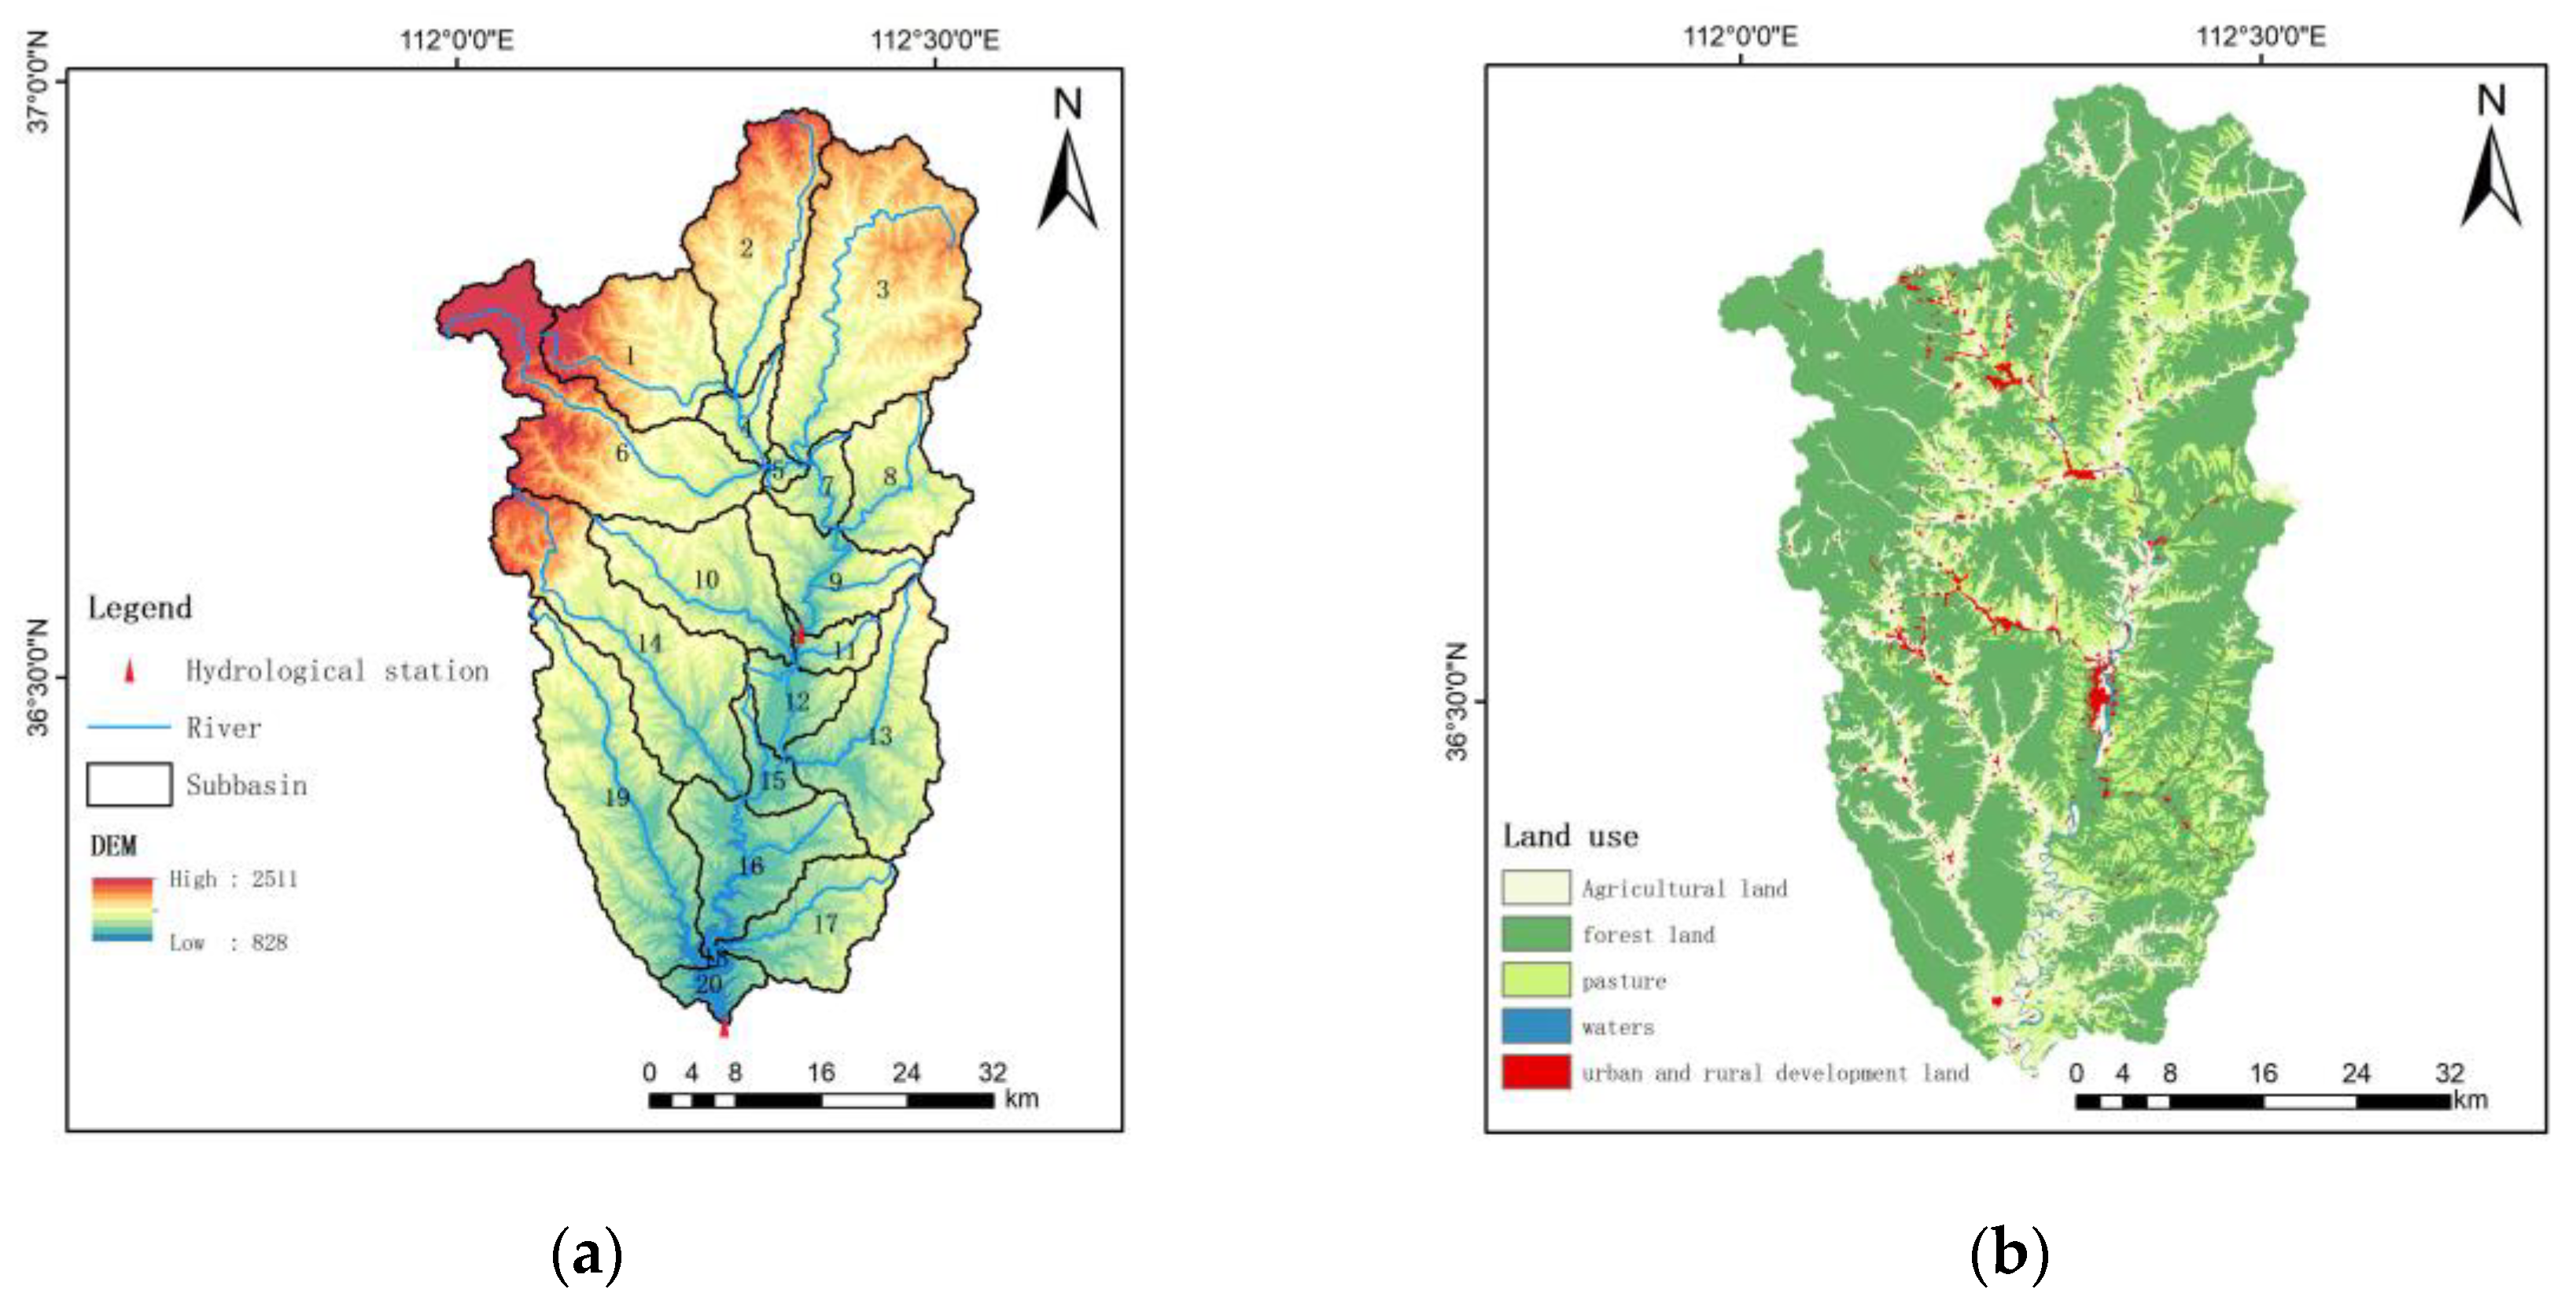
The runoff simulation of the study area was carried out using ARCSWAT, version 2012. For the watershed delineation, the catchment area threshold was set to 10,000 hm2 after splicing the DEM data, filling depressions, calculating the flow direction, and calculating the cumulative catchment area [36]. The Feiling Hydrological Station was used as the outlet of the watershed to divide the entire study area into 20 sub-watersheds and generate the river network and water system of the study area, as detailed in Figure 3a. It is necessary to input the land-use data, soil type data, and slope data when establishing the hydrological response units (HRUs).

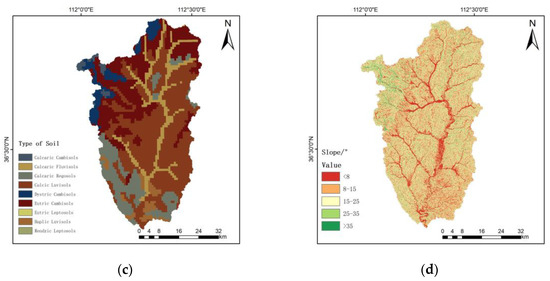
Figure 3.
Sub-watershed delineation (a), type of land use (b), type of soil (c), and slope classification (d) in the study area.
The land-use type has an important influence on the catchment yield and catchment flow. The pre-prepared land-use data of the study area in 2010 were reclassified into cropland, forest land, pasture, watershed, construction land, and unused land. The statistical results show that there was no unused land in the study area, and there were five main land types. The most dominant land type was forest land, with an area of 62.84% of the watershed area, followed by cropland and pasture, with areas of 18.63% and 17.55% of the watershed area, respectively. The other two land-use types together accounted for less than 3% of the watershed area. The distribution of land-use types in the study area in 2010 is shown in Figure 3b.
The input soil data were extracted from HSWD’s soil database for the study area and reclassified into nine different soil types, as shown in Table 4 and Figure 3c. Slopes in the watershed were classified into five levels (0–8°, 8–15°, 15–25°, 25–35°, and >35°), as shown in Figure 3d.
Table 4.
Soil types and their area share in the study area.
In the HRU definition, the land-use threshold was set at 10%, the soil threshold at 10%, and the slope threshold at 15%. A total of 342 HRUs were classified. The impacts of land use, soil type, and slope on the precision of the model’s simulation outcomes can be mitigated by establishing thresholds in cases where the region is insufficiently large. The collated meteorological data, such as day-by-day precipitation, air temperature, solar radiation, wind speed, and relative humidity data, were input into the SWAT model, and the SWAT model could then be run after writing them into the database [37].
3.2. Rate Setting, Validation, and Evaluation of the Applicability of the Model to the Study Area
A sensitivity analysis of the relevant parameters of the SWAT model is necessary to decrease the uncertainty and enhance the efficiency of the model run, as multiple parameters affect the model’s simulation results [38]. In this study, the SUFI-2 algorithm was used to perform sensitivity analysis on the parameters of the SWAT model, which has the advantages of easy operation, high operation efficiency, and the ability to directly input the simulation results of the run into the model. The p- and t-test values were used as the judgment criteria for the sensitivity of parameters, where the closer p is to 0 and the larger the t-value, the more sensitive the parameter. Fifteen parameters with strong sensitivity were finally selected for the rate determination. In the SWAT-CUP 2012 software, version 5.1.6, the selected parameters were simulated in multiple iterations using rate periodic data, and the number of iterative simulations was set as 1000. The results of sorting by parameter sensitivity and the optimal values of parameters are shown in Table 5.
Table 5.
Sensitivity ranking and optimal values of rate-setting parameters.
As shown in Table 5, the parameters that had the greatest influence on the runoff simulation results in the study area were the SCS runoff curve number CN2, which determined the size of the runoff volume, where the larger the CN2 value, the larger the surface runoff volume, followed by ALPHA_BF, which described the baseflow recession coefficient and the shallow groundwater runoff parameter GWQMN, etc. The other parameters that had a greater influence on the study area runoff simulation results were the groundwater delay time GW_DELAY, the groundwater runoff delay coefficient SURLAG, and the soil effective water content SOL_AWC, which were sensitive to the watershed runoff simulation results.
The collected measured monthly mean flow data of the study area watershed were divided into three phases: the warm-up period (1988 and 1989), the rating period (1990–2005), and the validation period (2006–2018). The simulated values of the rate-determined runoff-related parameters were input into the SWAT model for comparison with the measured values. This allowed the model’s simulation accuracy to be assessed, and the results can be seen in Table 6.
Table 6.
Statistical table of runoff modelling accuracy indicators.
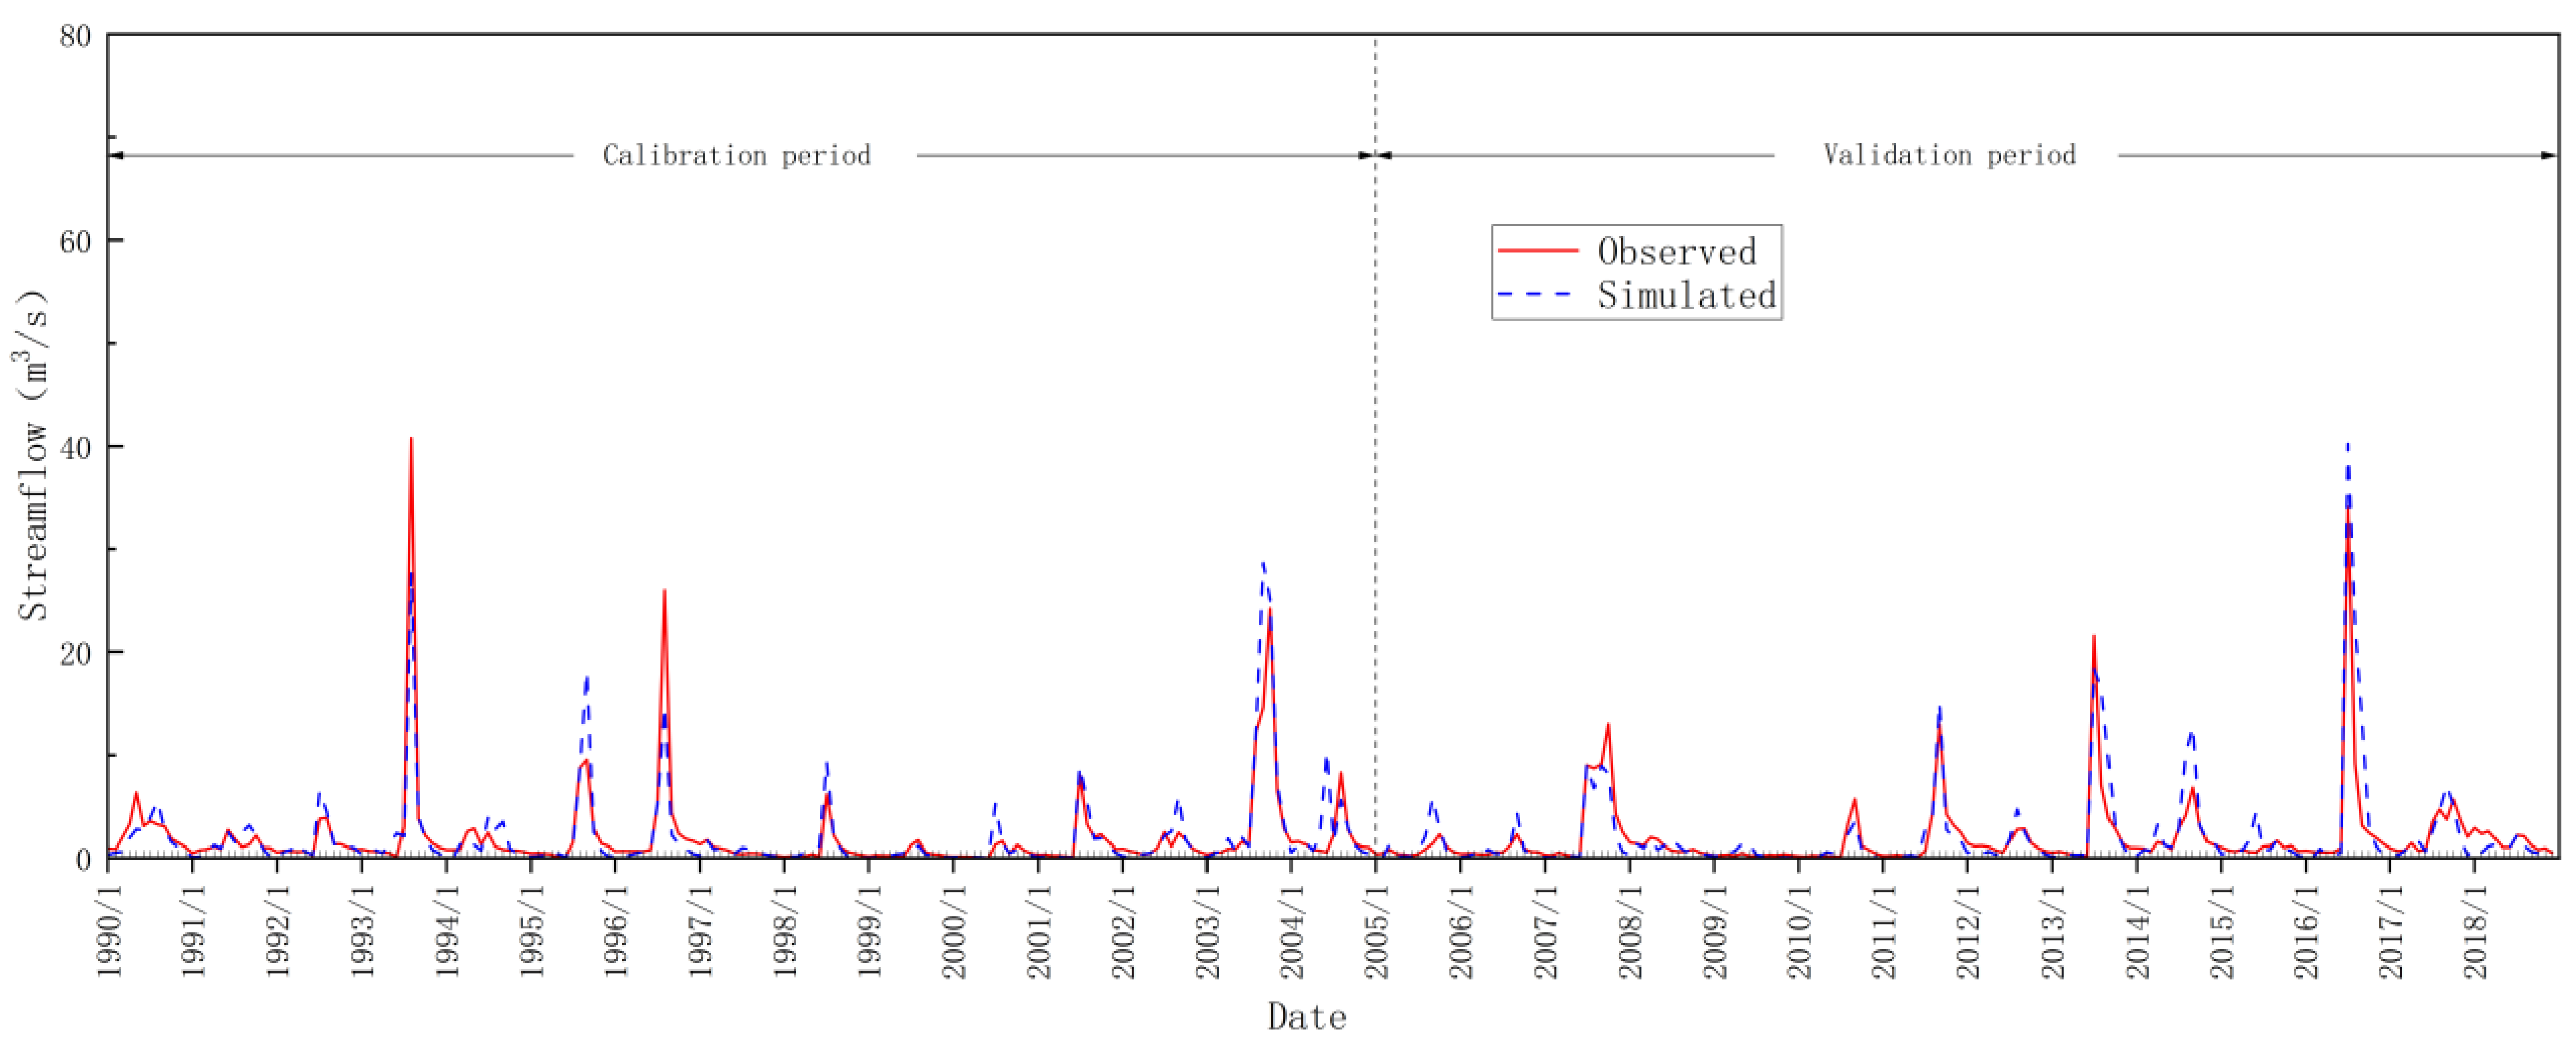
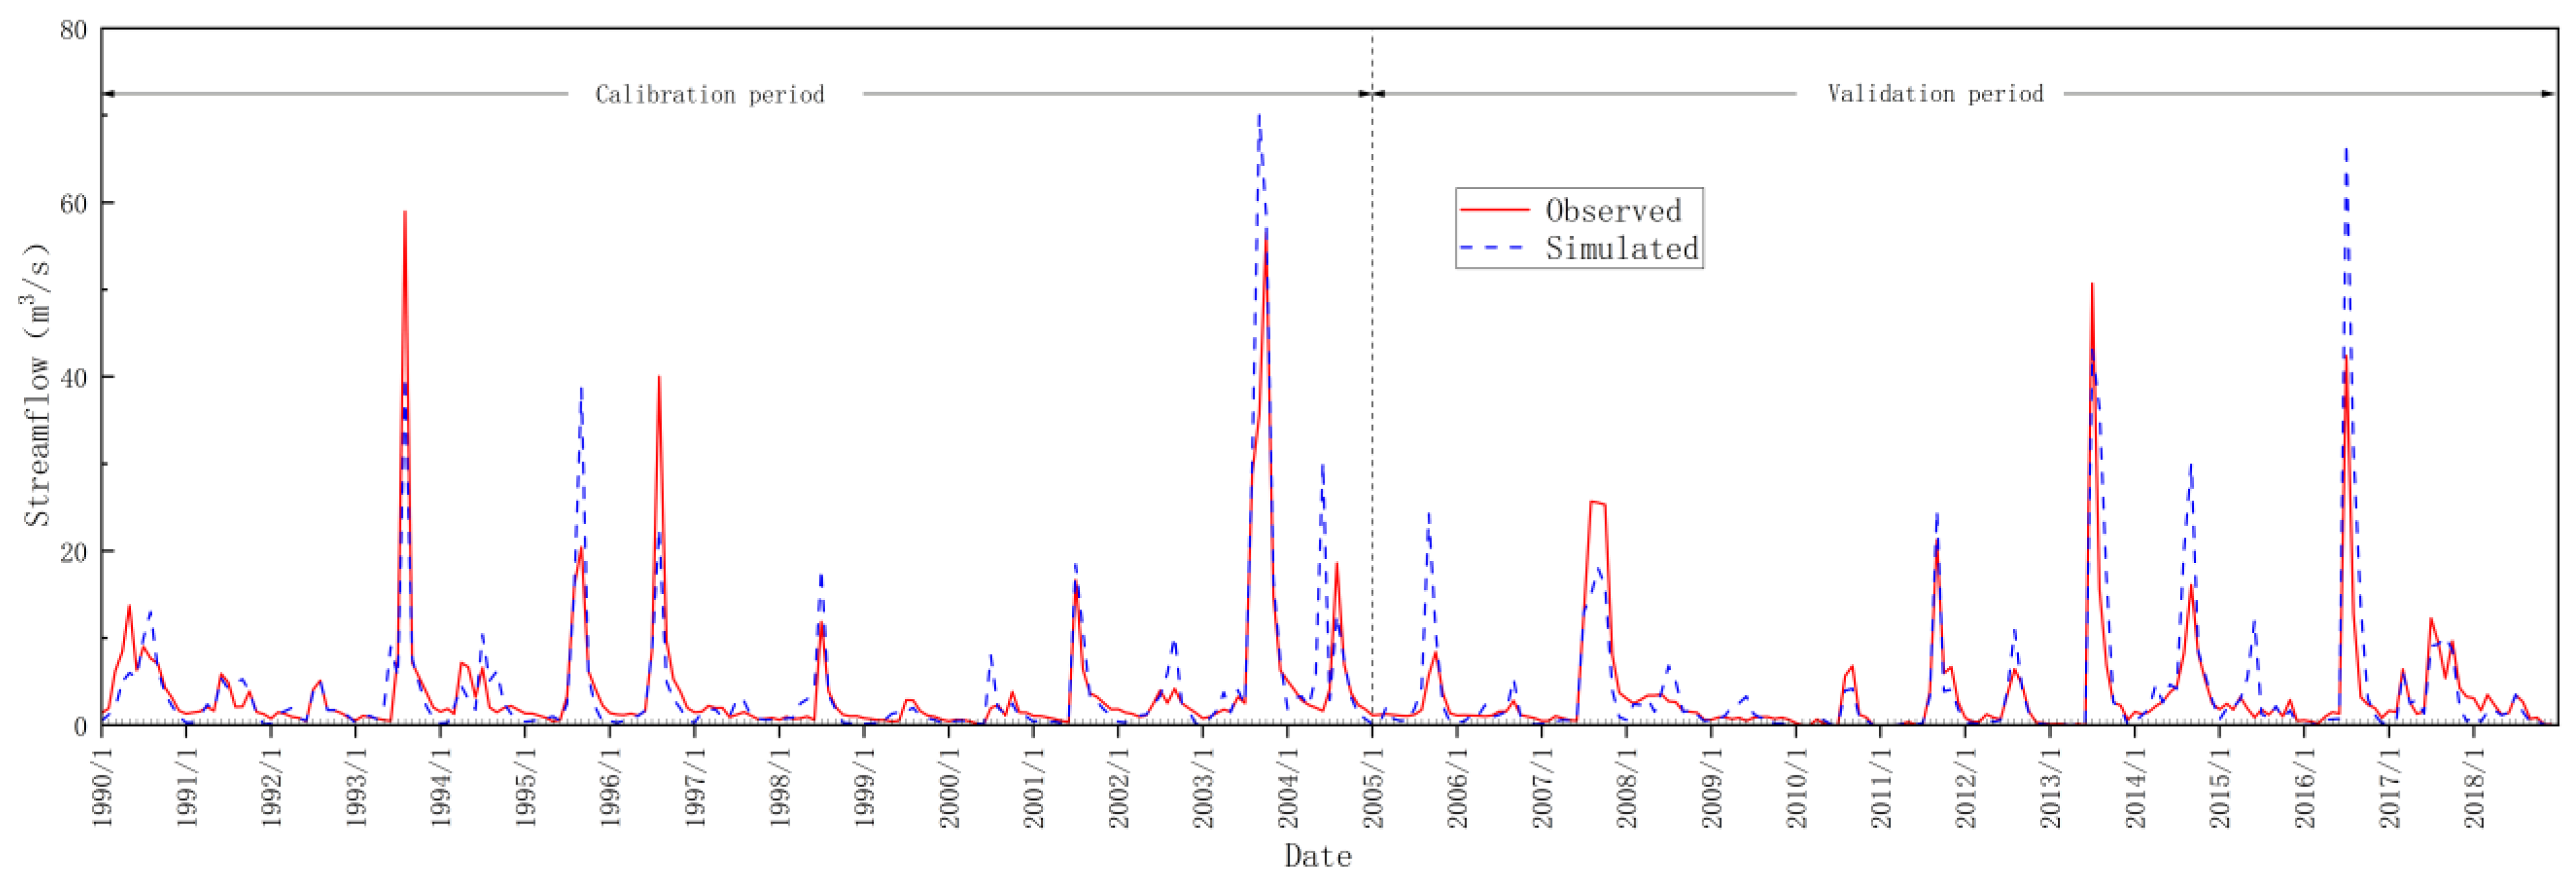
In general, the simulation results can be considered more satisfactory when the evaluation index of the model || < 25%, > 0.5, > 0.5, while the simulation results of our model are much higher than this; therefore, it is considered that the simulation results of the monthly flow process in the study area are credible, and the SWAT model has a good applicability in the study area. The simulation process for the rate period and validation period is shown in Figure 4 and Figure 5.
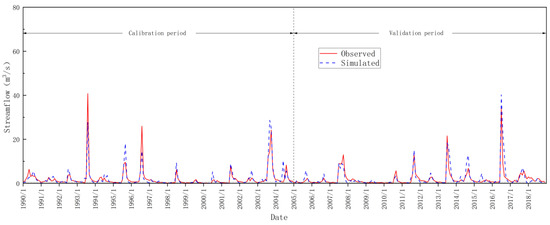
Figure 4.
Comparative analysis of observed and simulated monthly stream discharge at Kongjiapo Hydrological Station.
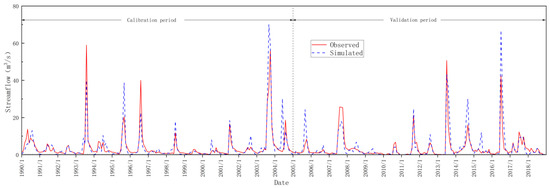
Figure 5.
Comparative analysis of observed and simulated monthly stream discharge at Feiling Hydrological Station.
3.3. Analysis of Runoff Response under Climate Change
Following rigorous calibration and validation of the SWAT model to ensure its applicability for the study area, this research meticulously adjusted the model inputs, including precise modifications to temperature and precipitation data, thus independently running the SWAT model for each climate change scenario designed in Section 2.4.1. This approach aimed at accurately simulating the hydrological processes for each scenario. By extracting and analyzing the runoff data from the model outputs, this research presents the runoff simulation results under 25 climate change scenarios, with detailed results provided in Table 7 and Table 8 below.
Table 7.
Simulation results of runoff from Kongjiapo Hydrological Station under future climate change scenarios based on IPCC reports.
Table 8.
Simulation results of runoff from Feiling Hydrological Station under future climate change scenarios based on IPCC reports.
- (1)
- When the temperature was kept constant, the annual runoff changes in the study area watersheds showed a positive correlation with the precipitation changes. Comparing the C31, C32, C34, and C35 scenarios, the temperature remained constant, the precipitation increased by 10%, and the average annual runoffs at the two hydrological stations increased by 0.374 m3/s and 0.751 m3/s, which were increases of 19.06% and 20.02% compared with the baseline scenario, respectively. When the precipitation was reduced by 10%, the yearly average runoffs at the two hydrological stations were reduced by 0.413 m3/s and 0.830 m3/s compared with the baseline scenario, which were reductions of 21.08% and 22.13%, respectively. This indicates that an increase in precipitation in the study area will lead to an increase in the runoff. This is mainly because the study area is an inland watershed, and precipitation is the main source of runoff. To keep the temperature unchanged, the increase in precipitation increases the relative increase in surface production and retention, which leads to an increase in runoff.
- (2)
- When the precipitation was kept constant, the annual runoff in the study area watershed showed a negative correlation with the change in the air temperature. When comparing the C13, C23, C43, and C53 scenarios, when the precipitation was kept constant and the air temperature increased by 2 °C, the mean annual runoff at the two hydrological stations decreased by 0.023 m3/s and 0.045 m3/s compared with the baseline scenario, which were decreases of 1.15% and 1.21%, respectively. When the temperature decreased by 2 °C, the mean annual runoff at the two hydrological stations increased by 0.023 m3/s and 0.046 m3/s, or 1.15% and 1.22%, compared with the baseline scenario, respectively. This indicates that an increase in temperature in the study area will lead to a decrease in runoff, and, conversely, an increase in runoff. This is mainly because, under constant precipitation conditions, the ET in the watershed will increase with the increase in temperature, so the runoff will be reduced accordingly.
- (3)
- The response of runoff to a ±10% or ±20% change in precipitation in the study area was more significant compared with the response to a ±1 °C or ±2 °C change in temperature. Comparing the C33 and C31 scenarios and the C33 and C53 scenarios, the magnitude of the runoff change for a 20% decrease in precipitation was much larger than that for a 2 °C increase in temperature; similarly, comparing the C43 and C34 scenarios with the C33 scenario, the percentage change in runoff for a 1 °C decrease in temperature was much smaller than the percentage change in runoff for a 10% increase in precipitation. In conclusion, precipitation will be the main factor affecting runoff in the study area in the future, while the effect of temperature on runoff in the basin is relatively insignificant.
- (4)
- The combined scenario of a 10% reduction in precipitation and a 2 °C increase in temperature had the most significant impact on runoff volume. Among the 25 different climate change scenarios, this combination scenario exhibited the largest change in runoff volume, with the annual average runoff volume at the two hydrological stations decreasing by 0.431 m3/s and 0.865 m3/s, respectively, representing decreases of 21.98% and 23.08% compared to the baseline scenario. This may be due to the direct reduction in water entering the watershed from decreased precipitation, while the increase in temperature exacerbates water evaporation, further reducing water availability in the watershed.
Comparing the scenarios with individual changes in precipitation and temperature, we found that the impact of precipitation on runoff volume generally exceeds that of temperature changes. However, when changes in both variables are combined, the reduction in runoff volume surpasses the impact of either precipitation or temperature change alone. This indicates that the interactive effects of multiple variables in climate change could have a far greater impact on the hydrological cycle than the effects of single variables.
The runoff trends in response to air temperature and rainfall are similar to those in related research results in China [39,40], which further confirmed the applicability of the SWAT model in the study area and the feasibility of using the model to analyze the runoff response to climate change.
Future research should continue to explore how these independent variables interact under different temporal scales and watershed conditions and consider the impact of other potential climate variables (such as changes in wind speed, atmospheric pressure, etc.) and non-climate factors (such as land-use changes, population growth, etc.) on watershed hydrology. These complex interactions are important considerations for future model improvements and water resource management strategy formulation.
3.4. Analysis of Runoff Response under Land-Use Type Change
Following rigorous calibration and validation of the SWAT model to ensure its applicability to the study area, this research proceeded to meticulously adjust the land-use input data within the model, modifying it according to the land-use scenarios designed in Section 2.4.2, and reran the model. Through this process, the study aimed to accurately simulate the hydrological processes for each land-use scenario, presenting the runoff simulation results for the Feiling Hydrological Station and the Kongjiapo Hydrological Station under five different land-use scenarios. Detailed results are provided in Table 9 below.
Table 9.
Changes in average annual runoff under different land-use scenarios.
The results of multi-year average runoff simulations for various scenarios are presented in Table 9. The analysis shows that the runoff trends are consistent across two hydrological stations under different scenarios. In the extreme forest land scenario (L1) and the retirement of agricultural land to forest land scenario (L4), the simulated average runoff decreased compared to the baseline scenario, with the largest reduction observed in the extreme forest land scenario (L1), where runoff at the two stations decreased by 1.46% and 1.54%, respectively. In contrast, the reduction in the retirement of agricultural land to forest land scenario (L4) was smaller, with runoff decreases of 0.96% and 0.92% at the two stations, respectively. On the other hand, the extreme pasture scenario (L2) and the extreme agricultural land scenario (L3) showed an increase in average runoff compared to the baseline scenario. The most significant increase was in the extreme agricultural land scenario (L3), where runoff at the two stations increased by 3.50% and 3.68%, respectively; the increase in the extreme pasture scenario (L2) was smaller, with runoff increasing by 1.13% and 1.15% at the two stations, respectively.
From the overall analysis, the magnitude of watershed runoff under different land-use scenarios was ranked as follows: Scenario L3 (extreme agriculture land scenario) > Scenario L2 (extreme pasture scenario) > Scenario L0 (base scenario) > Scenario L4 (fallow land to forest scenario) > Scenario L1 (extreme forest land scenario). This indicates that the implementation of agriculture land return to forest land with slope > 25° will have a negative effect on watershed runoff; under the single land-use/cover scenario, the three land-use types of forest land, pasture, and cropland contribute to watershed runoff in the study area in the following order: cropland > pasture > forest land. In principle, for the extreme agricultural land scenario (L3), the pre-analysis assumed that an increase in cultivated land would reduce surface cover and vegetation roots, leading to an increase in surface runoff. The actual simulation results align with this expectation, showing that an increase in cultivated land coverage indeed leads to a significant increase in watershed runoff. Human farming activities, such as flattening, compaction, and ridging, increase soil compactness, which further promotes the increase in surface runoff, fully consistent with our pre-analysis. For the extreme forest land scenario (L1) and the reforestation scenario (L4), the pre-analysis anticipated that an increase in forest coverage would reduce runoff through mechanisms such as water conservation and erosion control. The simulation results confirmed this, especially under the extreme forest land and reforestation scenarios, both of which showed a reduction in watershed runoff, with the extreme forest land scenario having a greater reduction. This reflects the role of forest land in increasing transpiration water consumption and enhancing soil water retention capacity, further strengthening the contribution of forest land in reducing runoff, consistent with expectations. For the extreme pasture scenario (L2), the pre-analysis posited that pasture coverage might affect runoff through its root structure and soil cover characteristics, enhancing precipitation infiltration and water retention capacity. The simulation results showed a slight increase in runoff under the extreme pasture scenario compared to the baseline scenario, but the increase was less than in the agricultural land scenario. This might be due to the lower transpiration efficiency of pasture compared to forest land, and in the context of a large amount of forest land being converted to pasture, the water conservation capacity of pasture is relatively weaker. This finding reveals the different roles of pasture and forest land in affecting watershed hydrological processes, consistent with the reasoning in the pre-analysis. These simulation results are consistent with the pre-analysis expectations, further validating the hypotheses regarding the impact of different land-use change scenarios on watershed runoff. They also underscore the importance of integrating land-use strategies in the context of climate change and water resource management. Additionally, the runoff response to different land-use types aligns with domestic research findings [41,42], further confirming the applicability of the SWAT model in the study area and the effectiveness of using this model for land-use and runoff response analysis.
When discussing the impact of different independent variables on runoff, it is also essential to recognize that the hydrological effects induced by land-use changes are not singular or linear. Forest and pasture lands may affect evapotranspiration and runoff processes through different mechanisms, while the runoff effect of cultivated land is more direct and pronounced. Although reforestation policies are beneficial for soil and water conservation, they may have limited effects on increasing the total runoff volume of the watershed. Therefore, we believe that adjustments in watershed land use and ecological management should consider the impacts of different land-use types on hydrological processes and their potential interactions in future developments.
Our study highlights the potential impact of land-use changes on watershed runoff and provides policymakers with initial insights into the hydrological effects of extreme land-use alterations. However, these findings are based on simulated extreme land-use changes, so when interpreting and applying these results, the theoretical nature and limitations of our modeling approach need to be considered.
While our study has made strides in establishing the SWAT model and exploring the impacts of various climate and land-use scenarios on runoff, it is imperative to acknowledge certain limitations. Specifically, our methodology may not have significantly contributed to the field of surface hydrology, underscoring the need for further exploration in future research endeavors. Addressing the potential inclusion of other input variables, such as soil type, vegetation cover, and topography, is crucial for a comprehensive understanding of hydrological processes. In forthcoming studies, we aim to integrate these variables into the model to better assess their influence on runoff response. Furthermore, we will delve deeper into examining the correlation between temperature and precipitation, while meticulously considering associated uncertainties. By expanding the scope of our research to encompass more climate change and land-use scenarios, we anticipate providing valuable insights for advancing the field of surface hydrology.
4. Conclusions
In this paper, a SWAT hydrological model was constructed using hydrometeoro-logical data and subsurface data in the area above the Feiling Hydrological Station in the Qinhe River Basin and the sensitivity of runoff to various climate change scenarios and alterations in land use was evaluated, leading to deductions drawn regarding their impacts.
- (1)
- The SWAT model was developed for the Qinhe Feiling Hydrological Station watershed. The calibration and validation periods yielded coefficient of determination (), efficiency coefficient (), and relative error coefficient () values that met the standards. The SWAT model demonstrated strong applicability to the Feiling Hydrological Station watershed of the Qinhe River. The simulation results are sufficiently accurate for investigating the impact of changing environmental conditions on runoff responses in the research area.
- (2)
- Runoff response analysis in precipitation and temperature change scenarios was conducted based on scenario driving. The results show that the changes in precipitation were positively correlated with the changes in runoff volume and negatively correlated with the changes in air temperature in the study area. Among the 25 scenarios, the magnitude of runoff change caused by a 1 °C and 2 °C change in air temperature with a certain change in precipitation was smaller than that caused by a 5% and 10% change in precipitation with a certain change in air temperature. Precipitation is the dominant climatic factor affecting runoff changes at the Kongjiapo Hydrological Station and Feiling Hydrological Station. Among the scenarios, the combined scenario of a 10% decrease in precipitation and a 2 °C increase in temperature had the most significant impact on runoff.
- (3)
- When the climate conditions were kept constant, the simulation results of the different land type scenarios showed that the extreme agricultural land and extreme pasture scenarios increased the annual runoff at the Kongjiapo and Feiling Hydrological Stations. The extreme agricultural land scenario increased the annual runoff at the two hydrological stations the most, followed by the extreme pasture scenario. The extreme forest land scenario reduced the annual runoff the most, and the fallow land reduced the annual runoff in the study area. The fallowing of farmland, to some extent, decreases the mean annual runoff in the study area.
Author Contributions
Writing—review and editing, K.W.; resources, H.Z.; software and supervision, D.Y. All authors have read and agreed to the published version of the manuscript.
Funding
This research was funded by Water Resources Science and Technology Research and Promotion Programmer of Shanxi Province, China (Grant No. 2023ZF06).
Data Availability Statement
The data that support the findings of this study are available upon reasonable request from the corresponding author.
Conflicts of Interest
The authors declare no conflicts of interest.
References
- He, C.; Liu, Z.; Wu, J. Future global urban water scarcity and potential solutions. J. Nat. Commun. 2021, 12, 4667. [Google Scholar] [CrossRef]
- Mi, Z.; Gao, Y.; Liao, H. Carbon neutrality and socio-economic development. J. Chin. Econ. Bus. Stud. 2023, 21, 1–3. [Google Scholar] [CrossRef]
- Qin, H.; Yuan, W.; Wang, J. Climate change attribution of the 2021 Henan extreme precipitation: Impacts of convective organization. J. Sci. China Earth Sci. 2022, 65, 1837–1846. [Google Scholar] [CrossRef]
- Wu, L.; Chen, D.; Yang, D. Response of runoff change to extreme climate evolution in a typical watershed of Karst trough valley, SW China. J. Atmos. 2023, 14, 927. [Google Scholar] [CrossRef]
- Jia, Z.; Liu, P.; Liu, Y. Impact of climate change and human activities on vegetation coverage in the Songhua-Liaohe River Basin. J. Ecol. Environ. Sci. 2023, 32, 1–10. [Google Scholar]
- Su, J.; Long, A.; Chen, F.; Ren, C.; Zhang, P.; Zhang, J.; Gu, X.; Deng, X. Impact of the Construction of Water Conservation Projects on Runoff from the Weigan River. J. Water 2023, 15, 2431. [Google Scholar] [CrossRef]
- Wang, Z. A generalized reservoir module for SWAT applications in watersheds regulated by reservoirs. J. Hydrol. 2023, 616, 128770. [Google Scholar] [CrossRef]
- Lu, J.; Xiang, X.; Li, C. Research on General Hydrological Model Data Structure in GIS. J. Water Resour. Prot. 2021, 37, 89–93. [Google Scholar]
- Du, B. CMADS and CFSR data-driven SWAT modeling for impacts of climate and land-use change on runoff. J. Water 2023, 15, 3240. [Google Scholar] [CrossRef]
- Liu, Y. Using SWAT Model to Assess the Impacts of Land Use and Climate Changes on Flood in the Upper Weihe River, China. J. Water 2022, 14, 2098. [Google Scholar] [CrossRef]
- Ma, X.; Wu, T.; Yu, Y. Research on runoff scenario prediction in the upstream of Hanjiang River based on SWAT model. J. Remote Sens. Land Resour. 2021, 33, 174–182. [Google Scholar]
- Qu, S.; Yang, Q.; Zheng, H. Application of System Differential Response Parameter Calibration Method in SWAT Model of Jianyang River Basin. J. Water Resour. Prot. 2023, 39, 118–124. [Google Scholar]
- Wang, X.; Zhao, X. Impact of Human Activities on Ecosystem Services in National Parks: A Case Study of Qilian Mountain National Park. J. Nat. Resour. 2023, 38, 966–982. [Google Scholar] [CrossRef]
- FotsoKamga, G.; FotsoNguemo, C.; Diallo, I. Projected changes in extreme precipitation and temperature events over Central Africa from COSMO-CLM simulations under the global warming level of 1.5 °C and above. Int. J. Climatol. 2023, 43, 6330–6351. [Google Scholar] [CrossRef]
- Getachew, A.; Ayele, T.; Taddele, Y. Modeling impacts of projected land use and climate changes on the water balance in the Baro basin, Ethiopia. J. Heliyon 2023, 9, e13965. [Google Scholar]
- Chen, P.; Wang, Z.; Zeng, Z.; Chen, X. Simulation and Prediction of the Impact of Urbanization on Watershed Hydrological Processes. J. Hydroelectr. Eng. 2020, 39, 67–77. [Google Scholar]
- Huang, S.; Fu, X.; Qin, J.; Xu, Y. Evaluation of Water Resources Pressure in the Yangtze River Basin Based on Human Activities and Climate Change. J. China Rural Water Hydropower 2019, 28, 12–16. [Google Scholar]
- Li, J.; Zhang, L. Evaluation of Water Resources Carrying Capacity in Shanxi Province Based on “Quantity-Quality-Area-Flow”. J. Water Conserv. Plan. Des. 2023, 11, 55–58. [Google Scholar]
- Juanjuan, D. Analysis of water conservation status and supply and demand situation in the Yellow River Basin of Shanxi Province. J. Water Resour. Dev. Manag. 2020, 11, 24–27. [Google Scholar]
- Liu, Y.; Shi, P.; Liu, M. Analysis of Water Balance in the Middle Reaches of the Yellow River Based on Ecological Water Demand: A Case Study of the Qinhe River Basin. J. Hydrogeol. Eng. Geol. 2024, 51, 30–40. [Google Scholar]
- Qiu, X.; Ma, J.; Zuo, Q. Analysis of Evolution of Water Budget Balance in Qinhe River Basin Based on Regional Water Balance Theory and SWAT Model. J. Adv. Sci. Technol. Water Resour. 2024, 44, 9–15. [Google Scholar]
- Qin, X.; Zhang, Y.; Ma, J. Calculation of Ecological Footprint of Water Resources and Analysis of Carrying Capacity in Qinhe River Basin Based on SWAT. J. Water Resour. Water Eng. 2023, 34, 1–9. [Google Scholar]
- Liu, Y.; Shi, P.; Liu, M. Spatial Pattern of Water Conservation Function and Ecological Governance Suggestions in the Upstream Catchment Area of the Qinhe River in the Yellow River Basin from 1990 to 2020. J. Geol. China 2024, 1, 3–22. [Google Scholar]
- Wang, Y. Climate change impacts on runoff in the Fujiang River Basin based on CMIP6 and SWAT Model. J. Water 2022, 14, 3614. [Google Scholar] [CrossRef]
- Zhao, X.; Zhang, F.; Lu, Q. Variation Characteristics of Evapotranspiration and Water Yield in Inner Mongolia under Future Climate Scenarios. J. Soil Water Conserv. 2022, 36, 151–159. [Google Scholar]
- Wang, Y. Climate services for water resource management in China: The case study of Danjiangkou Reservoir. J. Meteorol. Res. 2021, 35, 87–100. [Google Scholar] [CrossRef]
- Wu, H. A hydrologic similarity-based parameters dynamic matching framework: Application to enhance the real-time flood forecasting. J. Sci. Total Environ. 2024, 907, 167767. [Google Scholar] [CrossRef] [PubMed]
- Su, Q. Runoff Simulation and Climate Change Analysis in Hulan River Basin Based on SWAT Model. J. Water 2023, 15, 2845. [Google Scholar] [CrossRef]
- Hong, M.; Zhao, M.; Wei, T. Research on River Replenishment in the Fuyang River Basin Based on the SWAT Model. J. Jilin Univ. 2024, 54, 253–263. [Google Scholar]
- Li, Y.; Pan, J. Rivers of Shanxi. Master’s Thesis, Science Publishing House, Beijing, China, 2004; pp. 25–30. [Google Scholar]
- Gupta, H.V.; Sorooshian, S.; Yapo, P.O. Status of automatic calibration for hydrologic models: Comparison with multilevel expert calibration. J. Hydrol. Eng. 1999, 4, 135–143. [Google Scholar] [CrossRef]
- Hosseini, S.H.; Khaleghi, M.R. Application of SWAT model and SWAT-CUP software in simulation and analysis of sediment uncertainty in arid and semi-arid watersheds (case study: The Zoshk–Abardeh watershed). J. Model. Earth Syst. Environ. 2020, 6, 2003–2013. [Google Scholar] [CrossRef]
- Scott-Shaw, C.; Lechmere-Oertel, R.; Hill, R. Calibration, validation and application of the SWAT model to determine the hydrological benefit of wetland rehabilitation in KwaZulu-Natal. J. Water 2022, 48, 348–358. [Google Scholar] [CrossRef]
- Chen, S.; Chen, W.; Wu, R. Performance of the IPCC AR6 models in simulating the relation of the western North Pacific subtropical high to the spring northern tropical Atlantic SST. Int. J. Climatol. 2021, 41, 2189–2208. [Google Scholar] [CrossRef]
- Li, B.; Marek, G.; Marek, T. Impacts of Ongoing Land-Use Change on Watershed Hydrology and Crop Production Using an Improved SWAT Model. J. Land 2023, 12, 591. [Google Scholar] [CrossRef]
- Wu, H.; Liu, X.; Li, Q. The Effect of Multi-Source DEM Accuracy on the Optimal Catchment Area Threshold. J. Water 2023, 15, 209. [Google Scholar] [CrossRef]
- Zhang, S.; Lang, Y.; Yang, F. Hydrological Modeling in the Upper Lancang-Mekong River Basin Using Global and Regional Gridded Meteorological Re-Analyses. J. Water 2023, 15, 2209. [Google Scholar] [CrossRef]
- Tang, L.; Yu, S.; Yu, W. Sensitivity Analysis of SWAT Model Parameters and Runoff Simulation under Land Use Change in the Xiangjiang River Basin. J. Water Power 2021, 47, 12–17. [Google Scholar]
- Liu, L. Simulation Study of Runoff in Miyun Reservoir Watershed Based on SWAT Model. Ph.D. Thesis, China University of Geosciences (Beijing), Beijing, China, 2014. [Google Scholar]
- Qi, M. Simulation Study of Runoff in Xinjiang Aksu River Basin Based on SWAT Model. Ph.D. Thesis, Southwest Forestry University, Kunming, China, 2017. [Google Scholar]
- Feng, X.; Cheng, W.; Fu, B. The role of climatic and anthropogenic stresses on long-term runoff reduction from the Loess Plateau, China. J. Sci. Total Environ. 2016, 571, 688–698. [Google Scholar] [CrossRef]
- Li, Z.; Liu, W.; Zhang, X. Impacts of land use change and climate variability on hydrology in an agricultural catchment on the Loess Plateau of China. J. Hydrol. 2009, 377, 35–42. [Google Scholar] [CrossRef]

Disclaimer/Publisher’s Note: The statements, opinions and data contained in all publications are solely those of the individual author(s) and contributor(s) and not of MDPI and/or the editor(s). MDPI and/or the editor(s) disclaim responsibility for any injury to people or property resulting from any ideas, methods, instructions or products referred to in the content. |
© 2024 by the authors. Licensee MDPI, Basel, Switzerland. This article is an open access article distributed under the terms and conditions of the Creative Commons Attribution (CC BY) license (https://creativecommons.org/licenses/by/4.0/).