Article

Effect of Simulated Eutrophication of Peatlands on the Microbiome of Utricularia vulgaris L.

by
Aleksandra Bartkowska
* and
Tomasz Mieczan
Department of Hydrobiology and Protection of Ecosystems, Faculty of Environmental Biology, University of Life Sciences, Dobrzańskiego 37, 20-262 Lublin, Poland
*
Author to whom correspondence should be addressed.
Water 2024, 16(7), 1046; https://doi.org/10.3390/w16071046
Submission received: 26 February 2024 / Revised: 29 March 2024 / Accepted: 30 March 2024 / Published: 5 April 2024
(This article belongs to the Section Hydrology)

Abstract

:
Global climate change and increasing human impact are the main factors intensifying eutrophication of peatland ecosystems. Due to the high sensitivity of certain groups of microorganisms, they can serve as indicators of the degree of eutrophication and thereby provide much important information for assessment of the state of peatland ecosystems. However, there is still little knowledge of how changes in the fertility of the environment can affect the microbiome of carnivorous plants in these ecosystems. This study was conducted to verify the following hypotheses: (1) the microbiome of carnivorous plant traps reflects the trophic status of the habitat; (2) an increase in the concentration of biogenic compounds causes a greater increase in the size of microbial communities in the aquatic environment than in the traps. An experiment was carried out in laboratory conditions to determine the effect of simulated eutrophication on the microbiome of Utricularia vulgaris L. An experimental increase in habitat fertility caused an increase in the abundance of bacteria, flagellates, testate amoebae, ciliates, and rotifers, while a decrease in abundance was observed for crustaceans. The increase in the concentration of biogenic compounds also modified the taxonomic composition of communities of microorganisms and small metazoa as well as the strength of trophic relationships; as the trophic level increased, the relationships between bacteria and heterotrophic flagellates; bacteria and testate amoebae; and bacteria and ciliates became stronger.

1. Introduction

Peatlands are valuable natural ecosystems with enormous biological diversity [1]. Nutrient availability and food web structure are probably the two most important factors influencing the functioning of these ecosystems [2]. Variable concentrations of nutrients in the environment are characteristic of peatland ecosystems and can influence the global carbon cycle [3]. This is especially important as peatlands accumulate 25–30% of the carbon accumulated in ecosystems, and at the same time, they are rapidly vanishing ecosystems [4,5,6].
The eutrophication process increases the rate of primary production (especially by phycoflora) [7]. Increasing nutrient levels influence the growth rate of primary producers but are also associated with changes in entire microbial communities [7]. The richness and abundance of species, the presence of different evolutionary lines, and the diversity of traits associated with the strategy of resource use can react significantly to changes in the environment [8]. These elements of biological diversity may not necessarily be correlated; moreover, they can have varied effects on the functioning of the ecosystem [9]. The literature data indicate that eutrophication clearly modifies the functioning of various groups of organisms and influences their diversity (taxonomic, phylogenetic, and functional) [10,11]. A commonly identified effect of eutrophication is ‘biotic homogenization’. This term refers to an increase in the repeatability of species composition in different places or samples and is determined quantitatively by means of a dissimilarity index [12,13].
Peatland ecosystems are fed by groundwater and surface water and therefore are particularly susceptible to eutrophication. Deterioration of environmental conditions can lead to peat mineralization processes [14]. Water inflows from agricultural catchments and atmospheric precipitation are also potential sources of biogenic substances such as nitrogen (N) and phosphorus (P). An excessive concentration of one or more biogenic compounds leads to an increase in the level of habitat fertility, thereby creating favourable conditions for the excessive development of organisms such as cyanobacteria [15,16]. Nutrient compounds taken up by peatland plants are accumulated in their biomass and incorporated in peat-formation processes due to microbiological changes [16,17]. Due to the variable concentrations of nutrients in peatland ecosystems, the carnivorous plants living in them have developed numerous mechanisms that allow them to function in these variable conditions [18]. They supplement their food base in part by using traps equipped with sensory hairs [19]. The epidermis of the trap has pores enabling the absorption of nutrient substances [20]. A crucial factor determining inhibition of trap formation is nitrogen. When the concentration of this element is high, the plant does not need to form traps to increase the concentration of nutrient compounds. Otherwise, it forms them in order to obtain reserves, which may be microorganisms [21].
The effect of eutrophication on peatland ecosystems, which are complex systems with many components, cannot be assessed without analysing microbiological components. The degree of accumulation of biogenic compounds in the peat layer depends on microbial communities and their activity [22]. In the era of global climate change and increasing human impact, the concentration of biogenic compounds in wetland ecosystems is systematically increasing [23]. Due to the high sensitivity of certain groups of microorganisms, they can serve as indicators of the degree of eutrophication and thereby provide much important information for assessment of the state of peatland ecosystems in different regions (and provide important information about the bioeconomy). The literature data indicate that eutrophication can negatively affect the species richness of microbial communities and peatland vegetation [24,25,26,27,28]. Studies by Gong et al. and Krasuska et al. indicate that the relationships between microorganisms and the physicochemical properties of peatland waters are very important and that microbial communities show high sensitivity to changes taking place in their living environment [18,29,30]. However, studies are lacking on the effect of habitat eutrophication on the microbiome of carnivorous peatland plants. Understanding key mechanisms behind the changing water–microbial–plant interactions in responses to eutrophication processes is significant. It is important to obtain answers to the following research hypotheses.
Hypothesis 1:
The microbiome of traps reflects the trophic level of the habitat.
Hypothesis 2:
An increase in the concentration of biogenic compounds causes a much greater increase in the size of microbial communities in the aquatic environment than in carnivorous plant traps.
Therefore, the aim of the study was to determine the effect of simulated eutrophication of peatlands on the microbiome of the carnivorous plant Utricularia vulgaris L.

2. Materials and Methods

2.1. Experiment and Laboratory Analyses

An experiment was carried out in laboratory conditions to determine the effect of simulated eutrophication on the microbiome of Utricularia vulgaris L., a carnivorous plant classified as NT (near-threatened) on the red list. This plant, which floats freely in the water column, is a cosmopolitan species commonly occurring in inland water bodies in Europe and Asia. The main threat facing it is the loss of habitats due to land drainage and the drying out and overgrowth of peatlands. In the experiment, the concentration of biogenic compounds was modified, increasing them twofold and fourfold relative to the control sample.
For the experiment, peat bog water and Utricularia vulgaris L. were sampled from the Jelino peatland in spring, summer, and autumn (eastern Poland, 51× N, 23× E; Figure 1). On this peatland are located small humic pools. Then, in laboratory conditions, an experiment was carried out with three treatments: a control treatment (C), a treatment with a twofold increase in the concentration of nitrogen compounds relative to the control sample (×2N), and a treatment with a fourfold increase in the concentration of nitrogen compounds relative to the control sample (×4N).
Each experimental treatment was conducted in triplicate. The experiment was carried out in 600 mL glass containers filled with peatbog water, in which Utricularia vulgaris L. plants were placed (three plants in each). These treatments were left for two days in a light regime similar to natural conditions in order to stabilize the experimental conditions. Next, the samples were enriched with nitrogen compounds (ammonium nitrogen).
The experiment was carried out for a period of 21 days, because traps are fully developed between 10 and 19 days (Friday and Quarmby, 1994) [31]. Samples for biological and physicochemical analyses were collected at the start of the experiment and after 21 days. To assess the effect of the habitat on the microbiome of Utricularia, samples were collected from each treatment for qualitative and quantitative analysis—from the water surrounding Utricularia vulgaris L. (250 mL) and from the traps. The experiment was carried out three times during the year (in spring, summer, and autumn). From each treatment, water and five traps were analysed. Each time, two samples were preserved in Lugol’s solution (2%) and one live sample was taken (from both the water and the traps). The abundance and biomass of bacteria were determined using DAPI (4′,6-diamidino-2-phenylindole) according to Porter and Feig (1980) [32]. The abundance and biomass of flagellates were determined according to Caron (1983) [33]. Water samples with a volume of 10 mL were placed in dark, sterilized bottles, after which they were preserved in formalin and stored in darkness at 4 °C. The abundance and species composition of testate amoebae, ciliates, rotifers, and crustaceans were determined according to Utermöhl (1931) [34]. In the case of rotifers, 50 mL samples were placed for 24 h in a cylinder sealed with parafilm, and then the upper 400 mL was gently removed. To determine abundance and biomass, three samples were preserved in Lugol’s solution and then examined using plankton chambers in an inverted microscope. For analysis of traps, they were first placed on Petri dishes and then rinsed with water filtered through a filter with 0.2 μm pore size and examined under a microscope. Biomass of microorganisms was determined using the following conversion factors: heterotrophic bacteria 1 μm3 = 5.6 × 10⁻⁷ μgC; flagellates 1 μm3 = 2.2 × 10⁻⁷ μgC; ciliates and testate amoeba 1 μm3 = 1.1 × 10⁻⁷ μgC [35]. Biomass of rotifers was assessed on the basis of the ratio of body length to body width of a given individual [36].
Physical and chemical parameters of the water were analysed as well: temperature, electrical conductivity, pH, phosphates (P-PO43−), ammonium nitrogen (N-NH4+), chemical oxygen demand (COD), biological oxygen demand (BOD), chlorophyll a, and total organic carbon (TOC). Temperature, electrical conductivity and pH were assessed using a multiparameter probe (YSI 556 MES; OMC ENVAG, Yellow Spring, OH, USA). P-PO43− was determined by colourimetry and N-NH4 by Kjeldahl’s method [37]. Total organic carbon (TOC), nitrite nitrogen (N-NO2), and chemical oxygen demand (COD) were analysed by spectrophotometry.

2.2. Statistical Analysis

Statistical analyses were performed to determine the effect of the physicochemical parameters of the water on the size of microbial communities. First, DCA (detrended correspondence analysis) was carried out to calculate the gradient of the variation representing the data, which determined the type of analysis chosen. Because the gradient obtained was less than 2 SD, RDA (redundancy analysis) was used for the analyses. RDA was carried out to identify the relationships linking microorganisms and small metazoa with environmental parameters. In addition, a Monte Carlo permutation test was carried out to identify the environmental variables which statistically significantly (p < 0.05) influenced numbers of microorganisms. The analyses were carried out in CANOCO for Windows 5.0 (WUR, Wageningen, The Netherlands) and Statistica 13 software (StatSoft, Hamburg, Germany). The significance of differences between means was determined by one-way analysis of variance (ANOVA), and Tukey’s test was used to determine which groups differed significantly.

3. Results

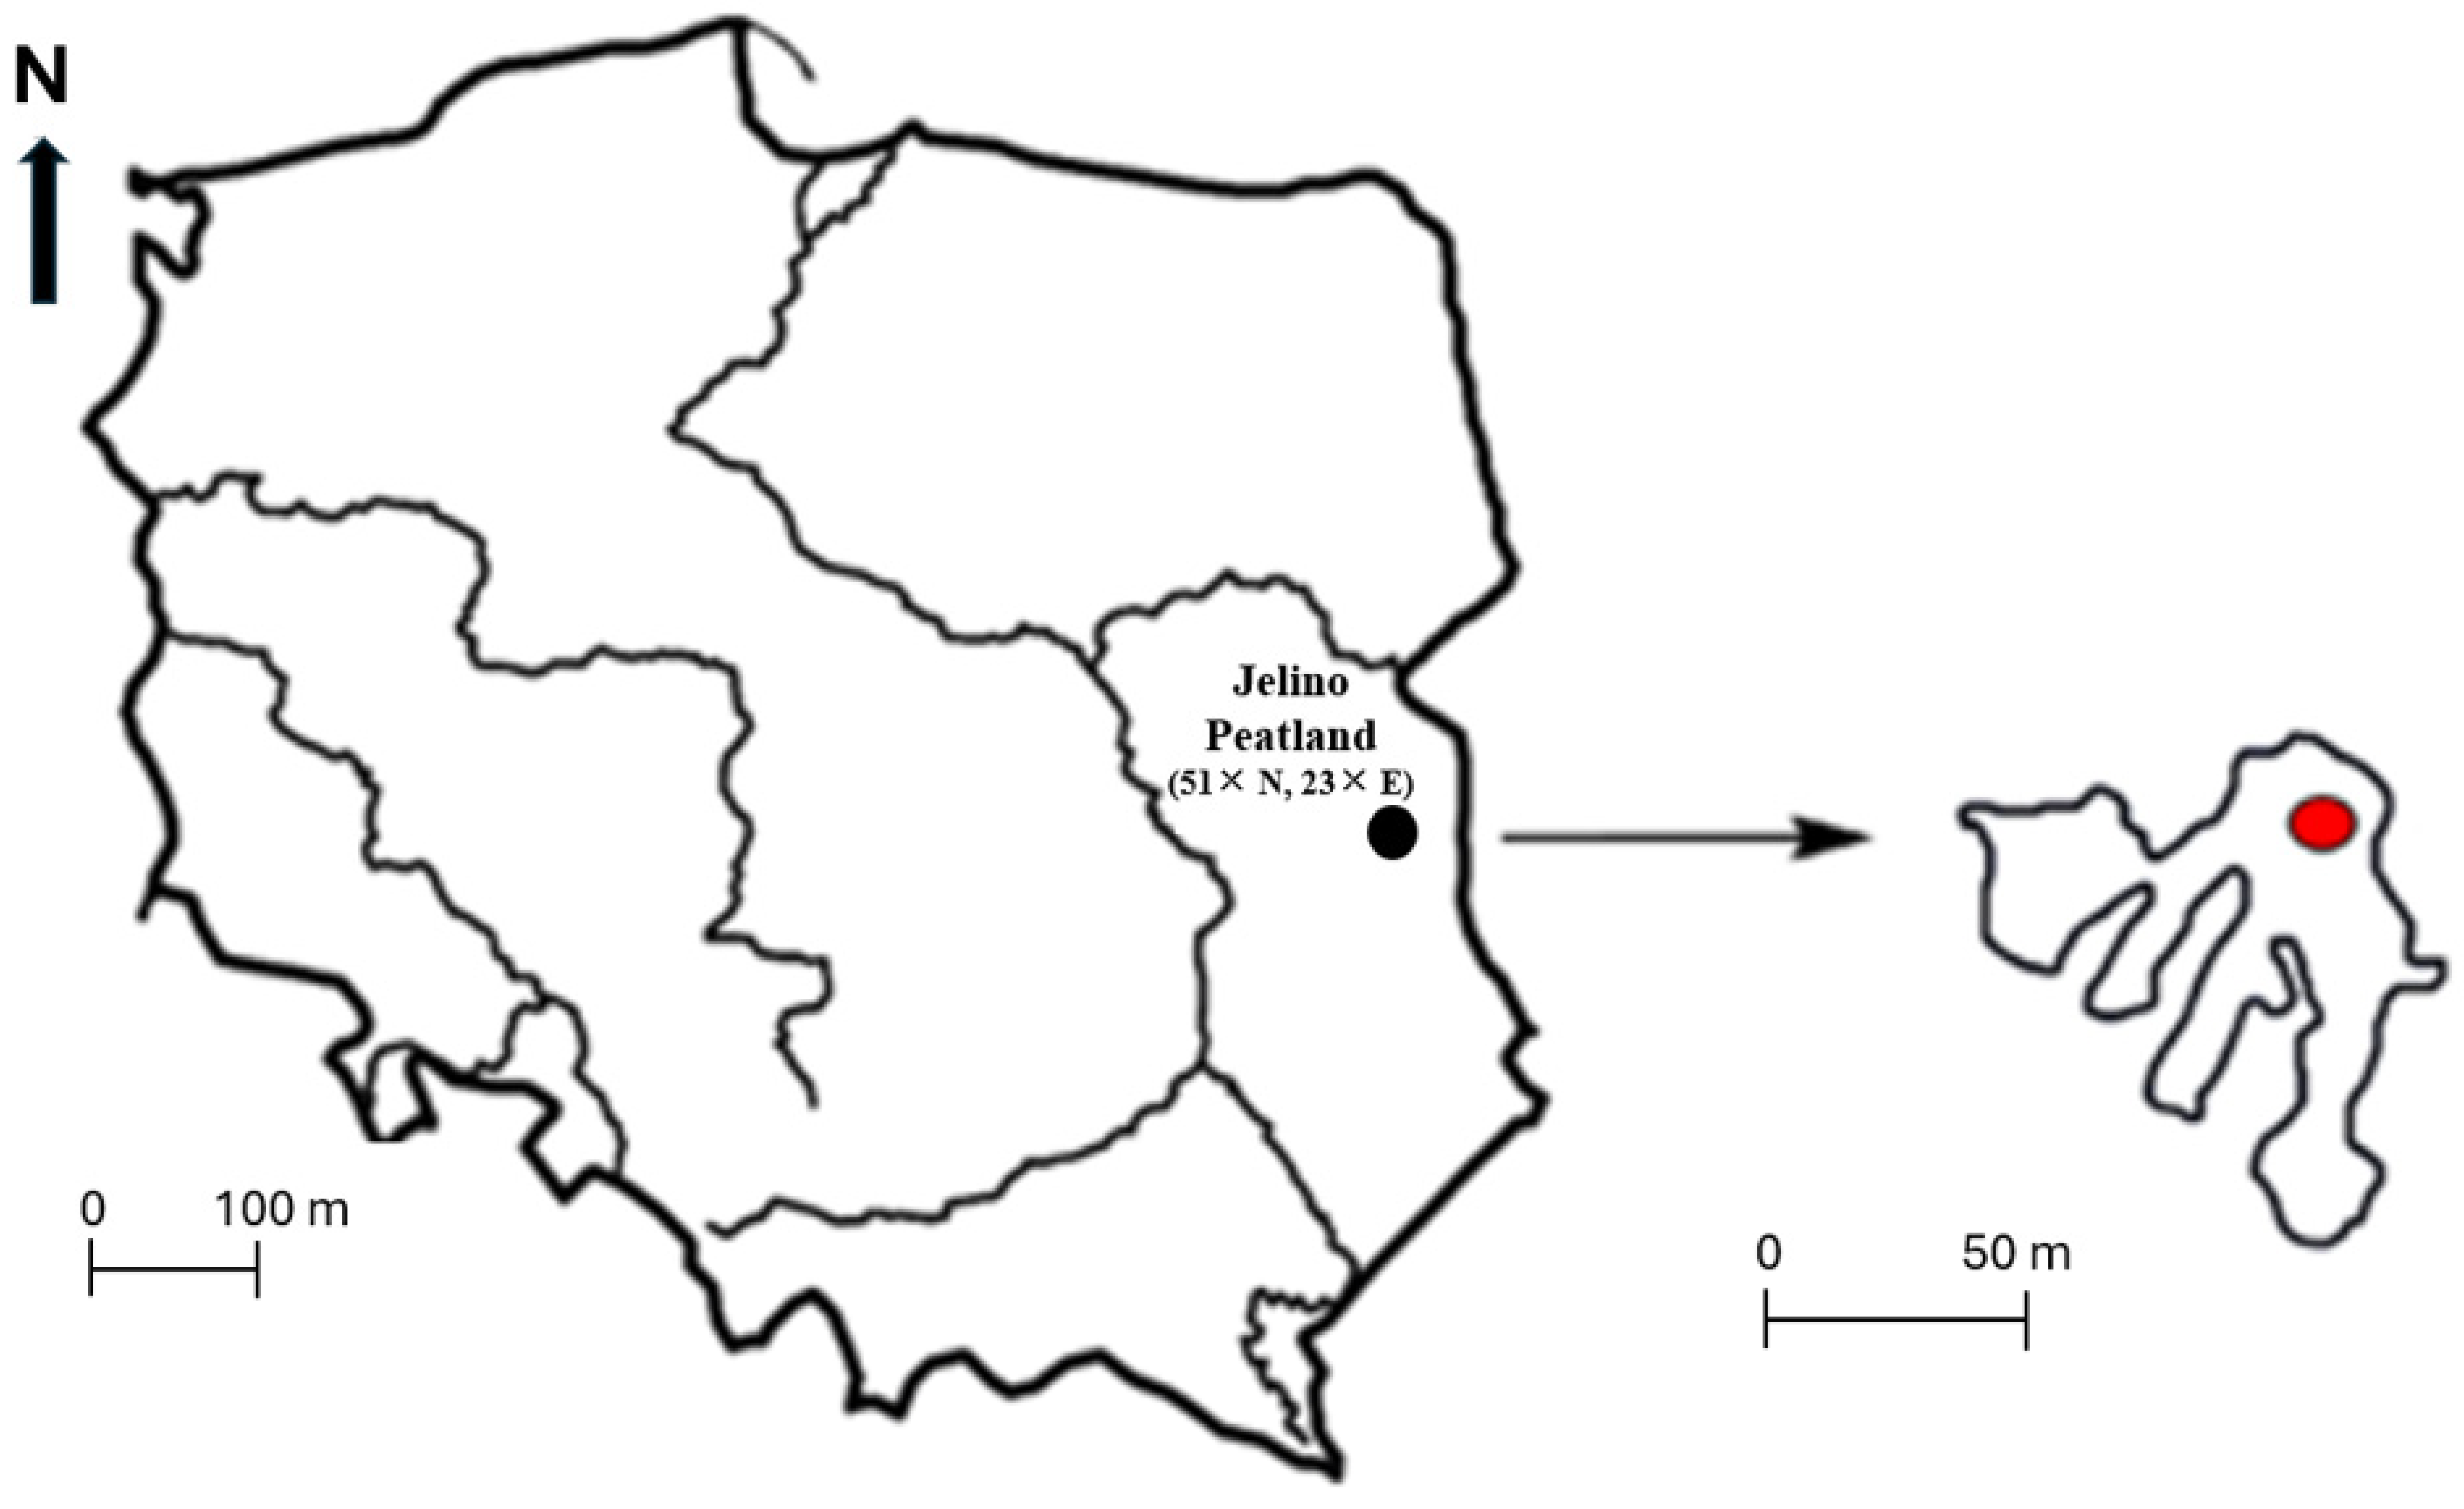
3.1. Environmental Variables

Analysis of the physical and chemical parameters of the water showed that in spring, as the concentration of biogenic compounds increased, there was an increase in the level of electrical conductivity (from 29.1 μS cm−1 to 33.3 μS cm−1), chemical oxygen demand (65.6–70 mg L−1), biological oxygen demand (40–42.5 mg L−1), and TOC (30–32 mg L−1). The concentrations of oxygen and chlorophyll a gradually decreased in successive experimental treatments (p < 0.05 for all). Analysis of the physical and chemical parameters of the water showed that in summer, as the concentration of biogenic compounds increased, there was also an increase in the concentration of chlorophyll a, from 50 to 280 mg L−1. In autumn, as the concentration of biogenic compounds increased, there was an increase in the level of electrical conductivity (from 31 μS cm−1 to 39.1 μS cm−1) and chlorophyll (from 50 to 252 mg L−1). The level of BOD and TOC remained relatively stable. The oxygen concentration and COD gradually decreased with each experimental treatment (p < 0.05 for all; Table 1).

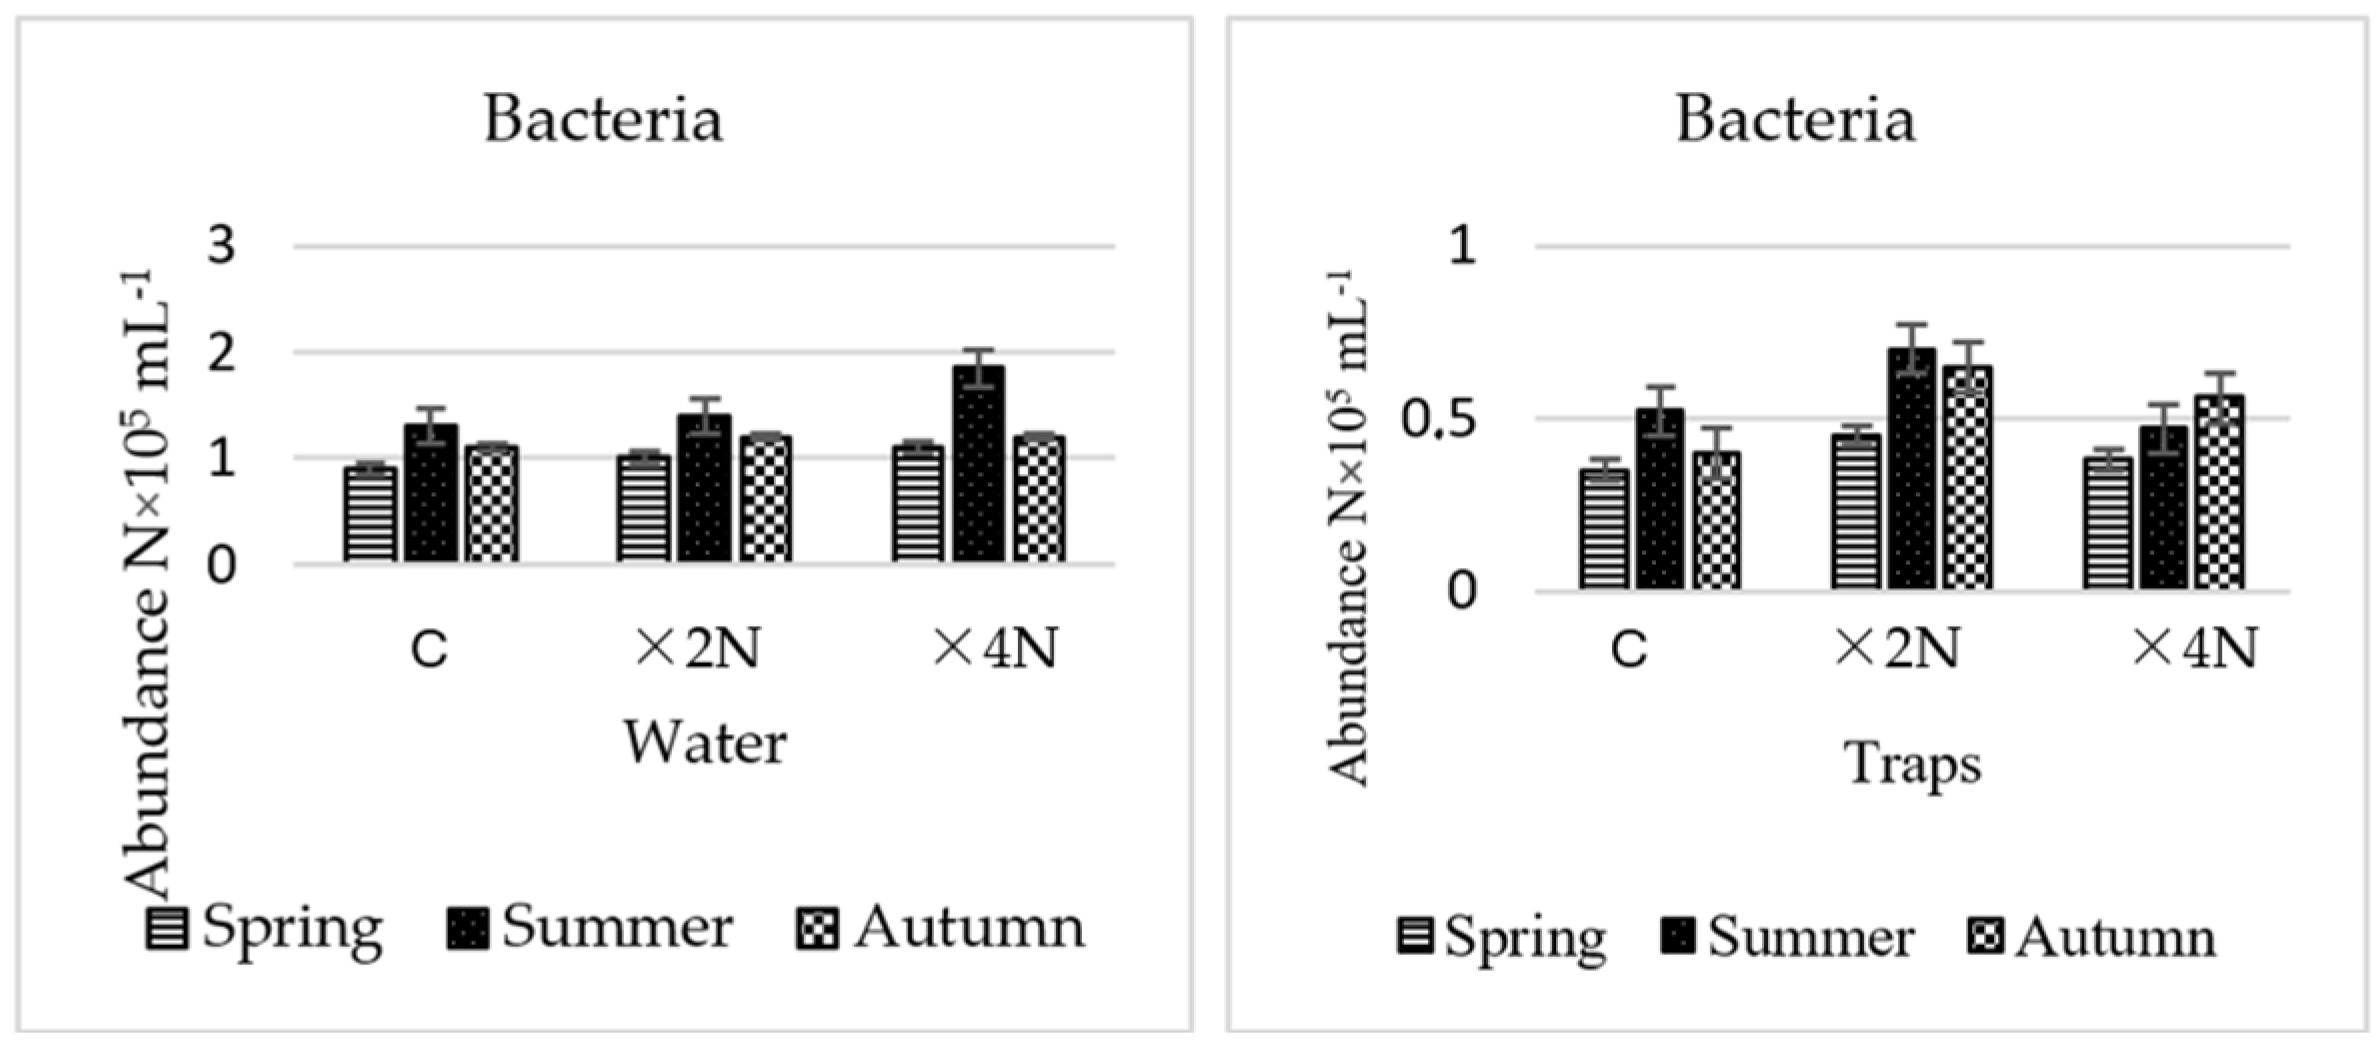
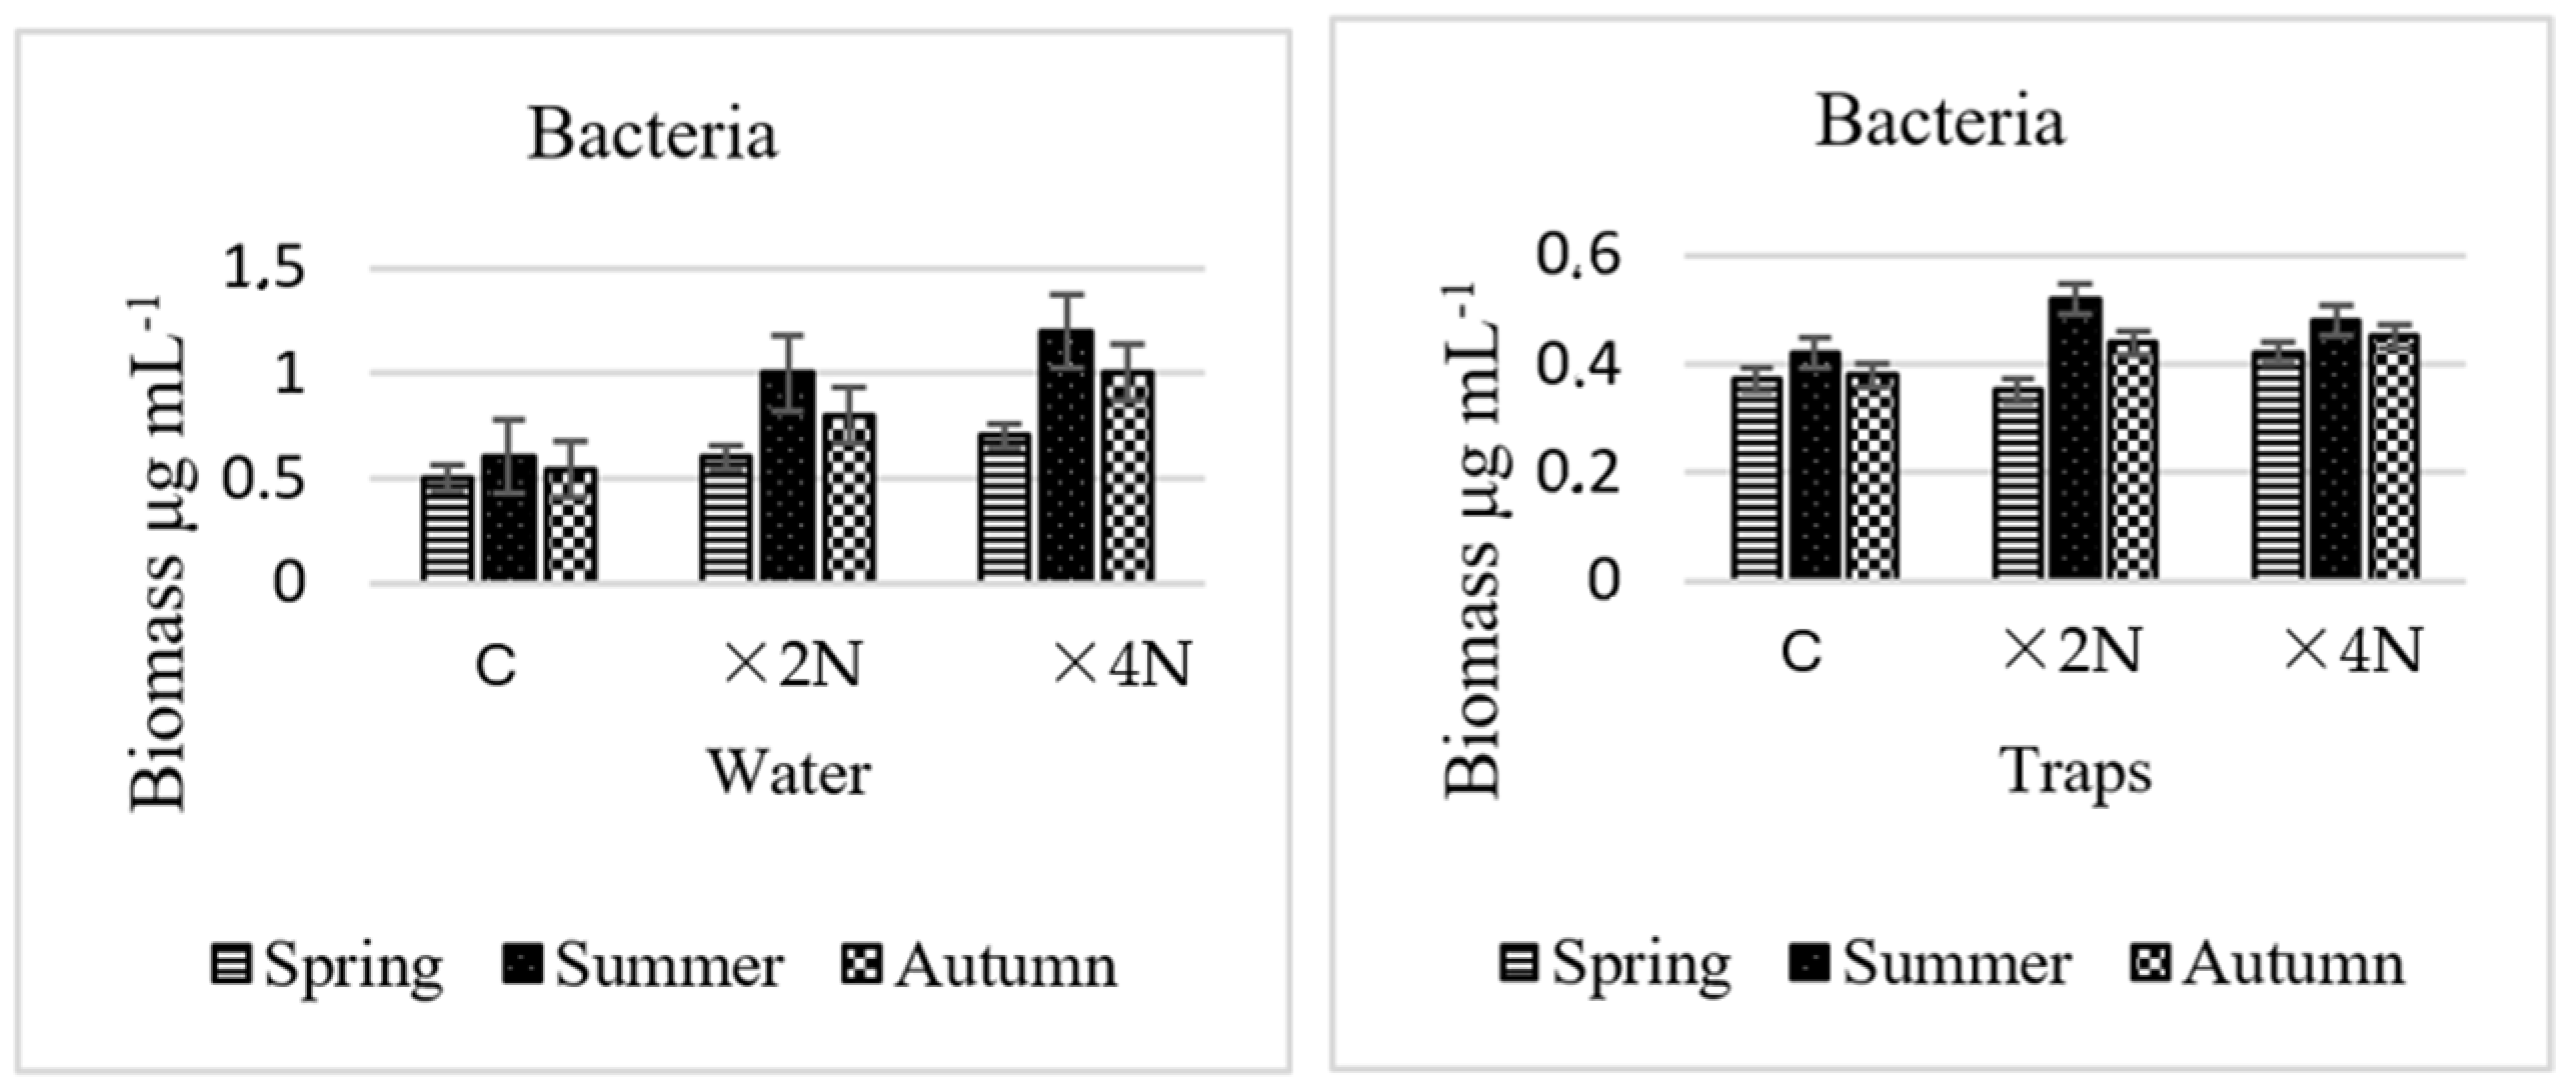
3.2. Abundance and Biomass of Bacteria

The abundance of bacteria was mostly higher in the water than in the traps in both the ×2N and the ×4N treatments compared to the control. In the water, abundance in both experimental treatments (×2N and ×4N) was highest in summer and lowest in spring. In the traps, the highest abundance in treatment ×2N was noted in summer, while in treatment ×4N it was highest in autumn (ANOVA, F3.33 = 0.546, p = 0.521) (Figure 2).
Biomass of bacteria was higher in the water than in the traps, in both treatment ×2N and treatment ×4N. In addition, the biomass was lower in treatment ×2N than in treatment ×4N. In treatment ×2N, bacterial biomass in the water ranged from 0.54 to 1.02 μg mL−1, while in ×4N it ranged from 0.7 to 1.2 μg mL−1. The value of this parameter in the traps was higher in treatment ×2N (0.35–0.65 μg mL−1) than in treatment ×4N (0.4–055 μg mL−1) (Figure 3). In both the traps and the water, an increase in biomass was observed following enrichment of the environment with nitrogen compounds.

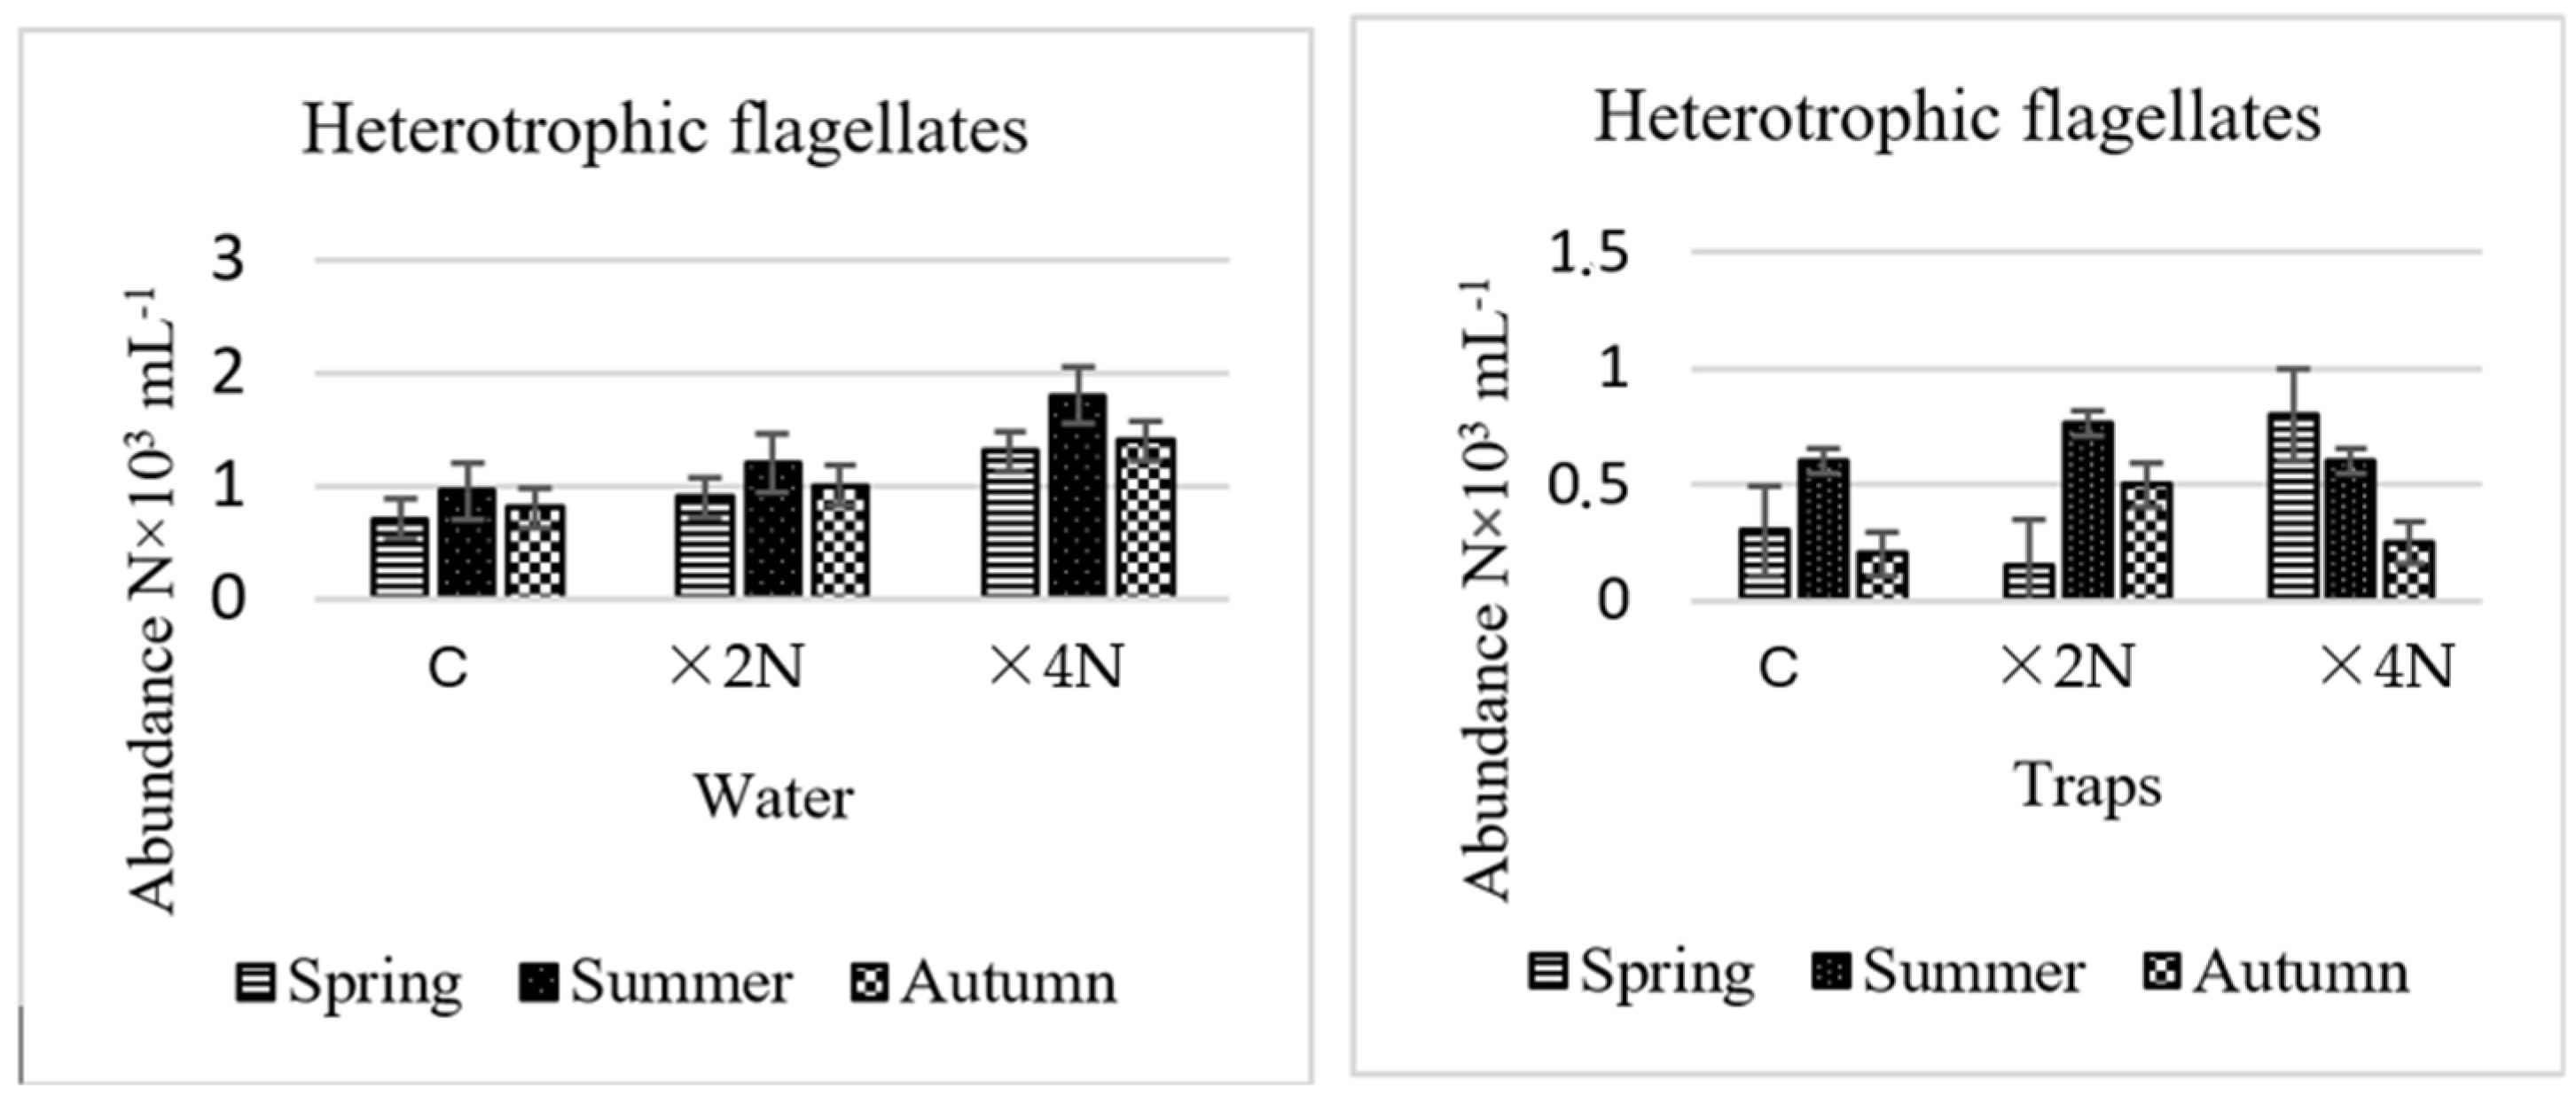
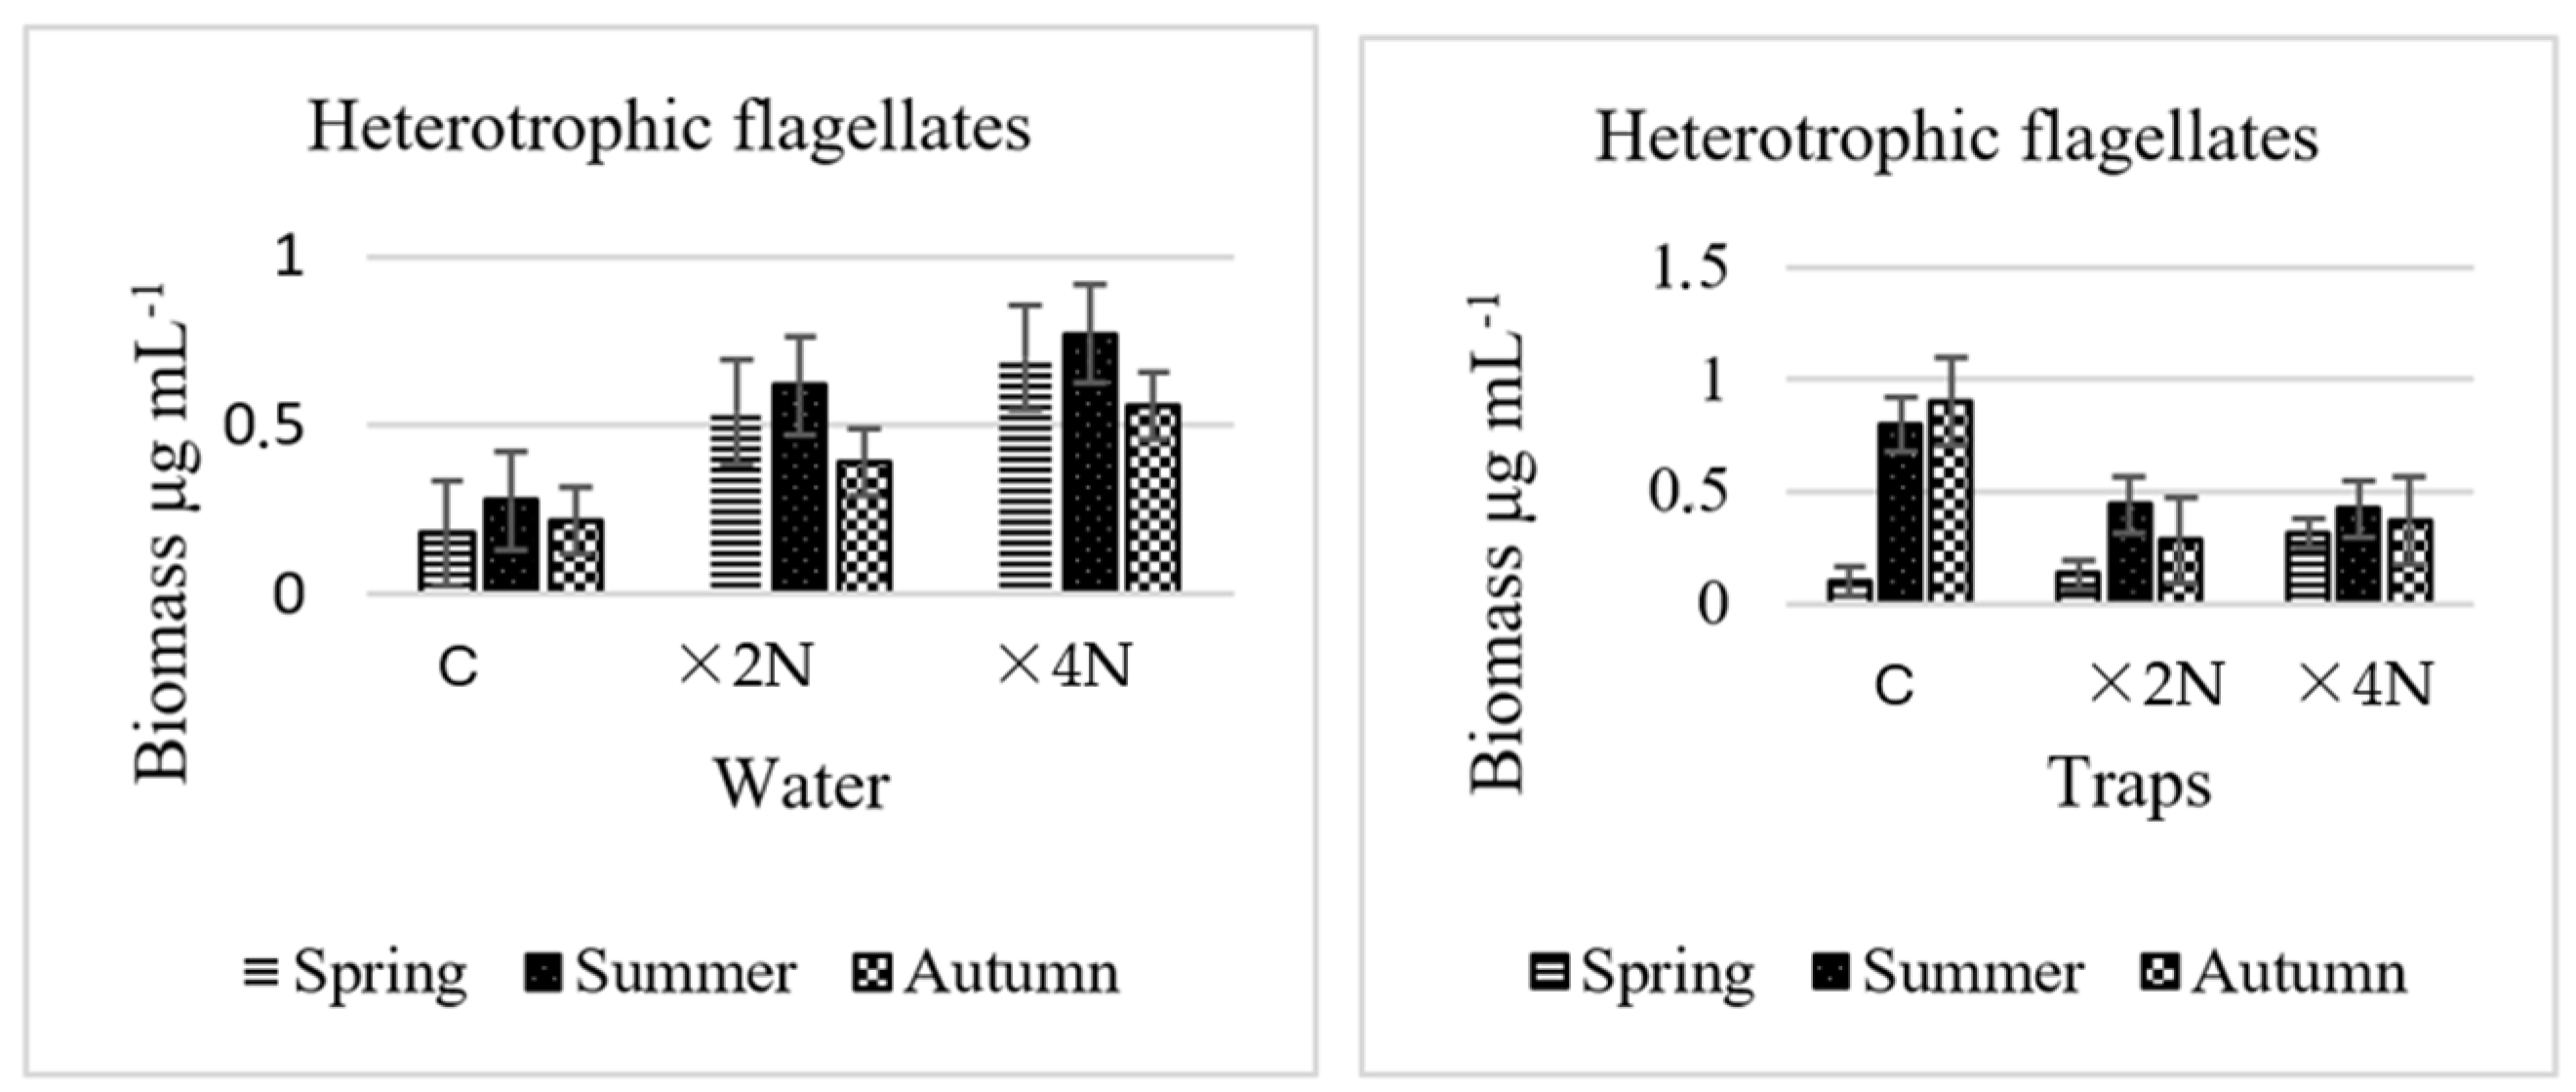
3.3. Abundance and Biomass of Heterotrophic Flagellates

The abundance of heterotrophic flagellates in treatment ×2N was much lower than in treatment ×4N (in both the aquatic environment and the traps). In the water, in treatments ×2N and ×4N the abundance of these microorganisms was highest in summer (Figure 4). In the traps of Utricularia vulgaris, the number of flagellates was much lower than in the aquatic environment, with lower abundance of these microorganisms noted in treatment ×2N than in treatment ×4N. The highest abundance was recorded in summer in treatment ×2N, and in spring in treatment ×4N (ANOVA, F3.30 = 0.687, p = 0.501) (Figure 4).
With the increase in fertility in successive experimental treatments in the water, the biomass of heterotrophic flagellates increased. In treatment ×4N in the water, the biomass of flagellates was higher (0.52–0.75 μg mL1) than in treatment ×2N (0.4–0.61 μg mL1). An increase in biomass was observed in both treatment ×2N and treatment ×4N (in water) in comparison with the control. With the increase in fertility in successive experimental treatments in the traps, the biomass of the heterotrophic flagellates was different (Figure 5).

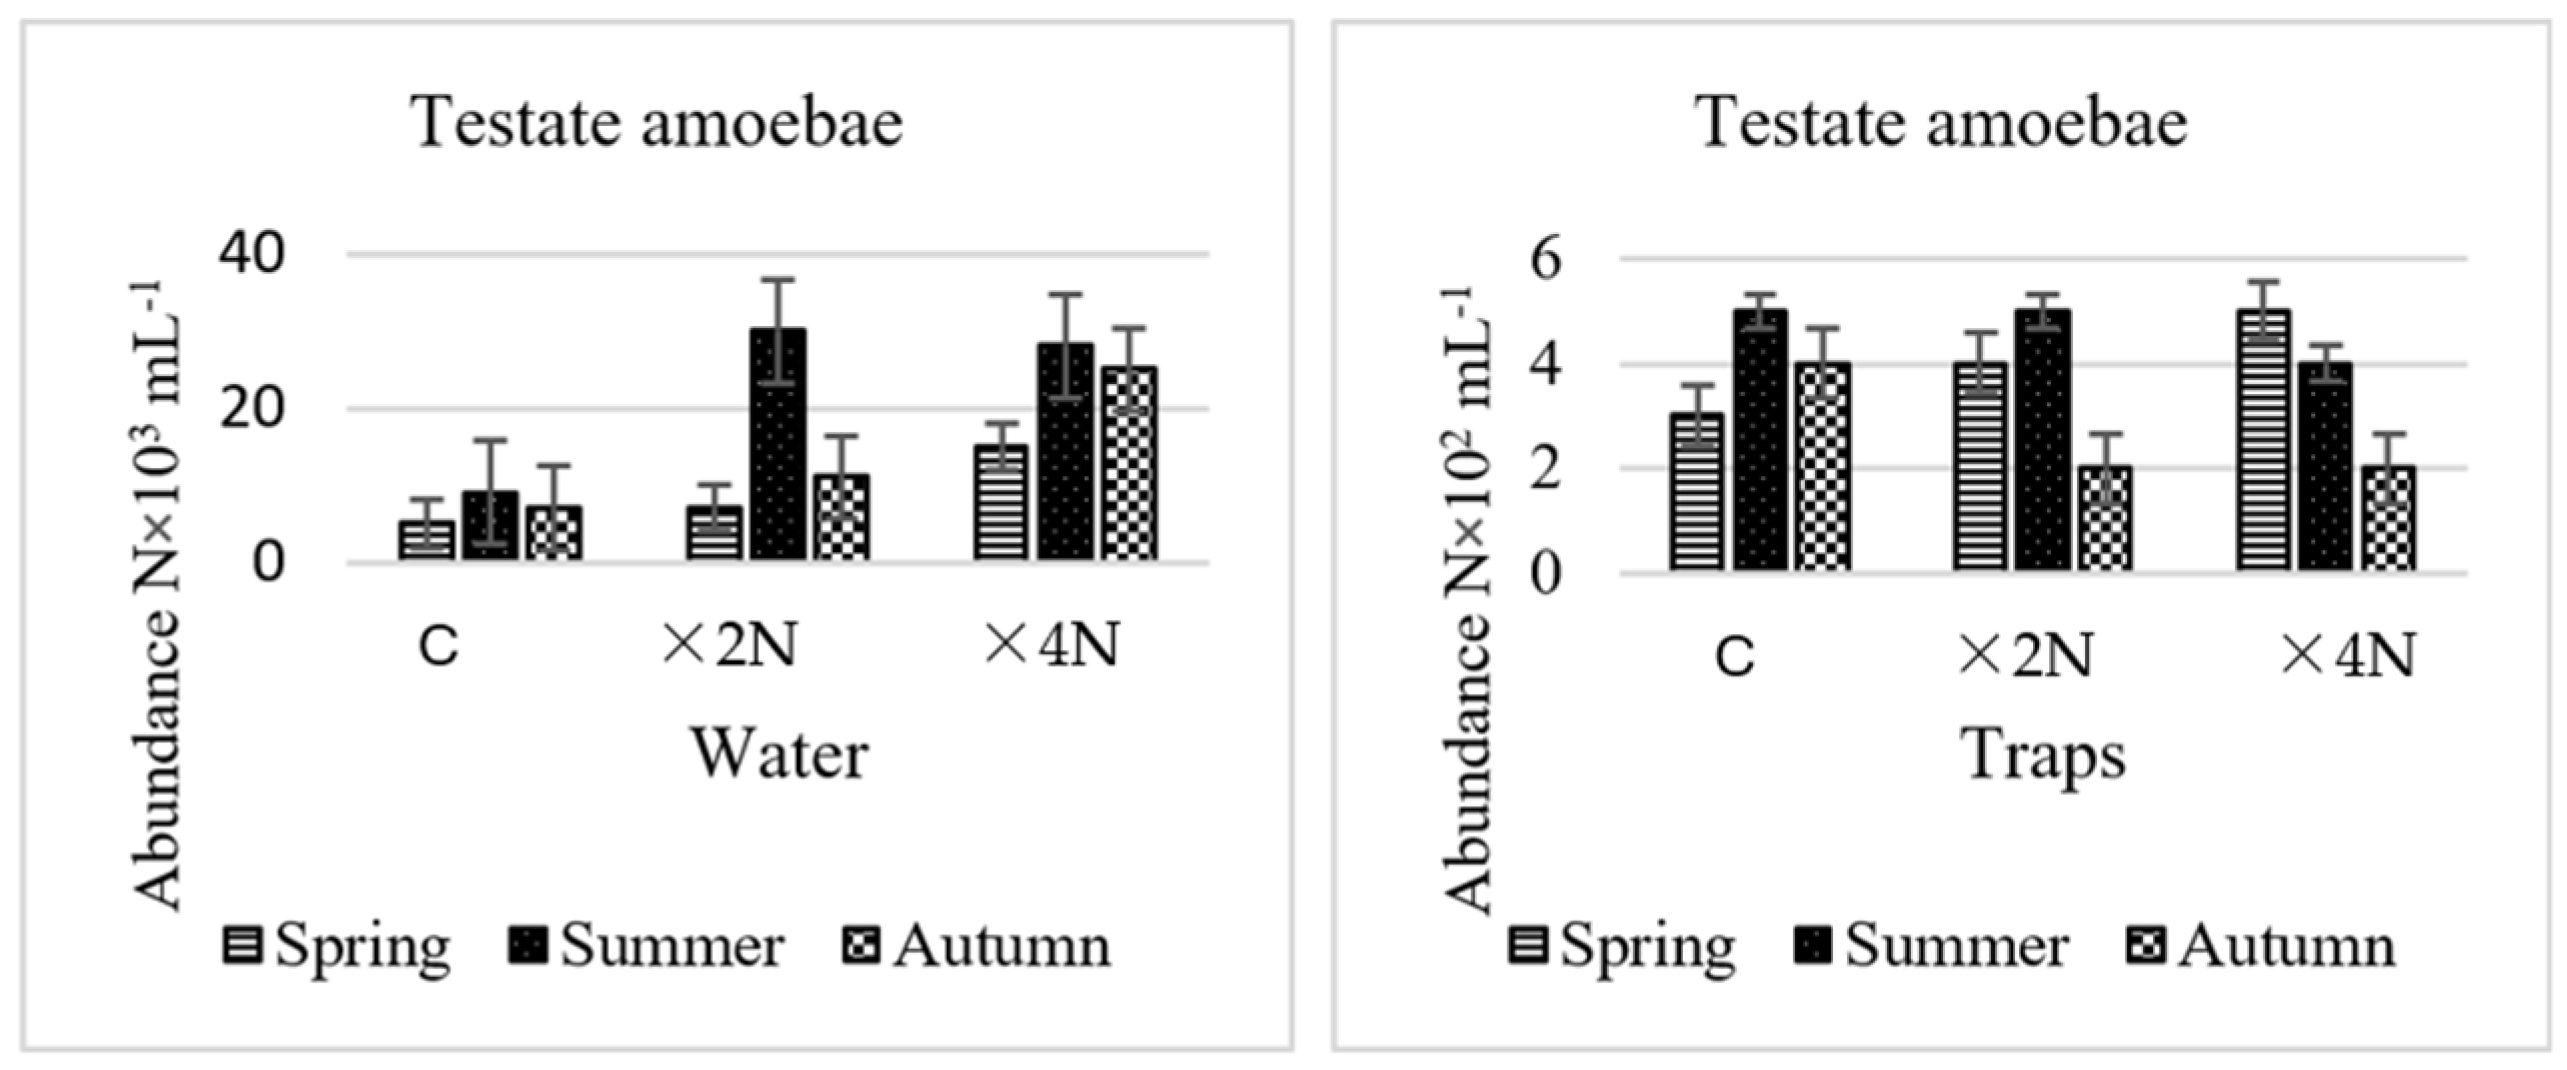
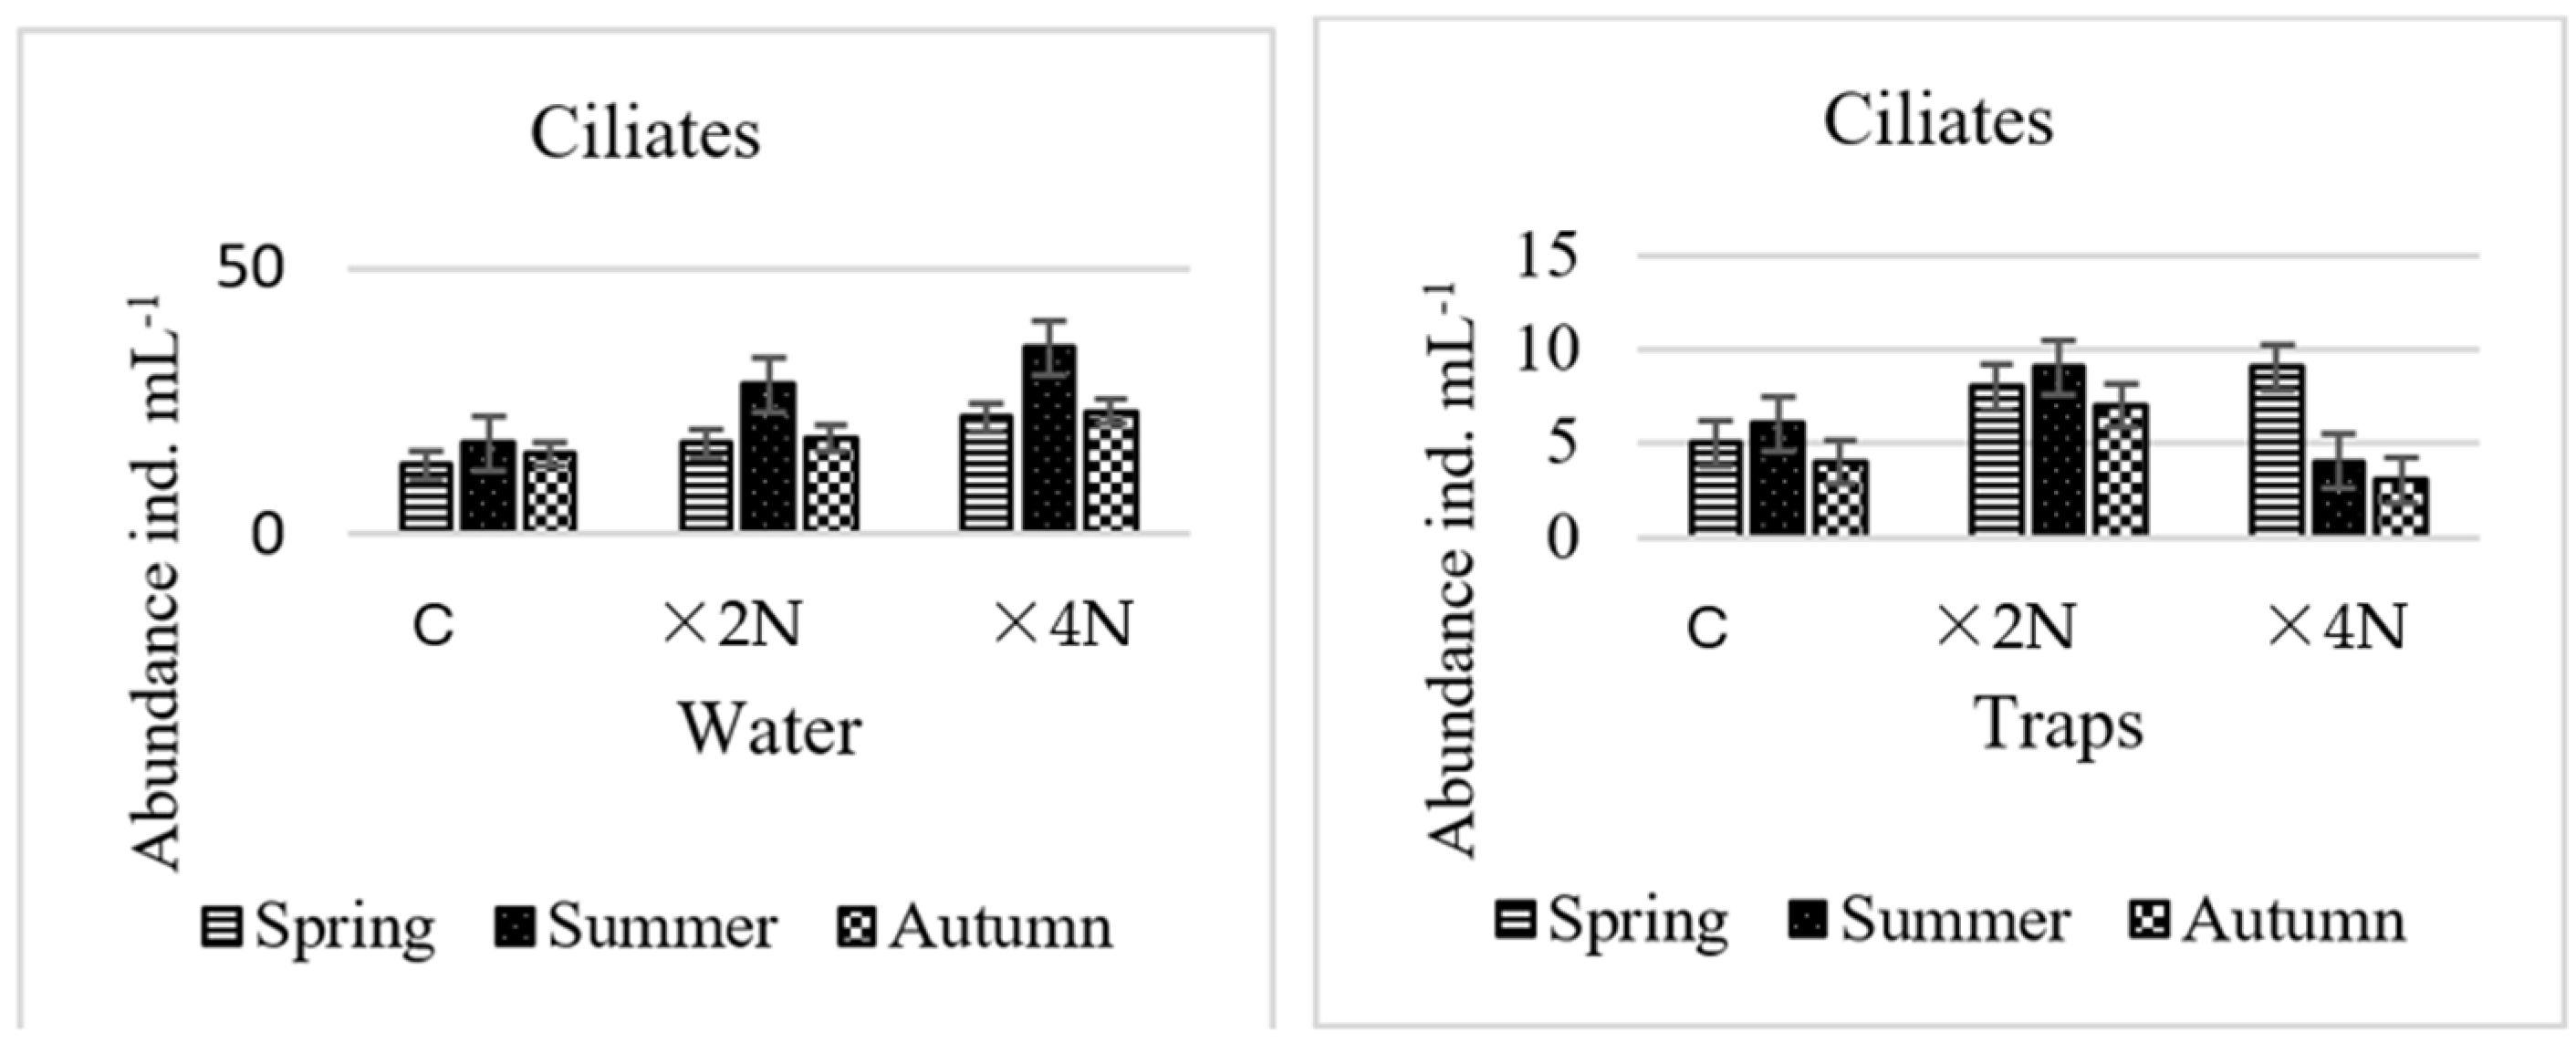
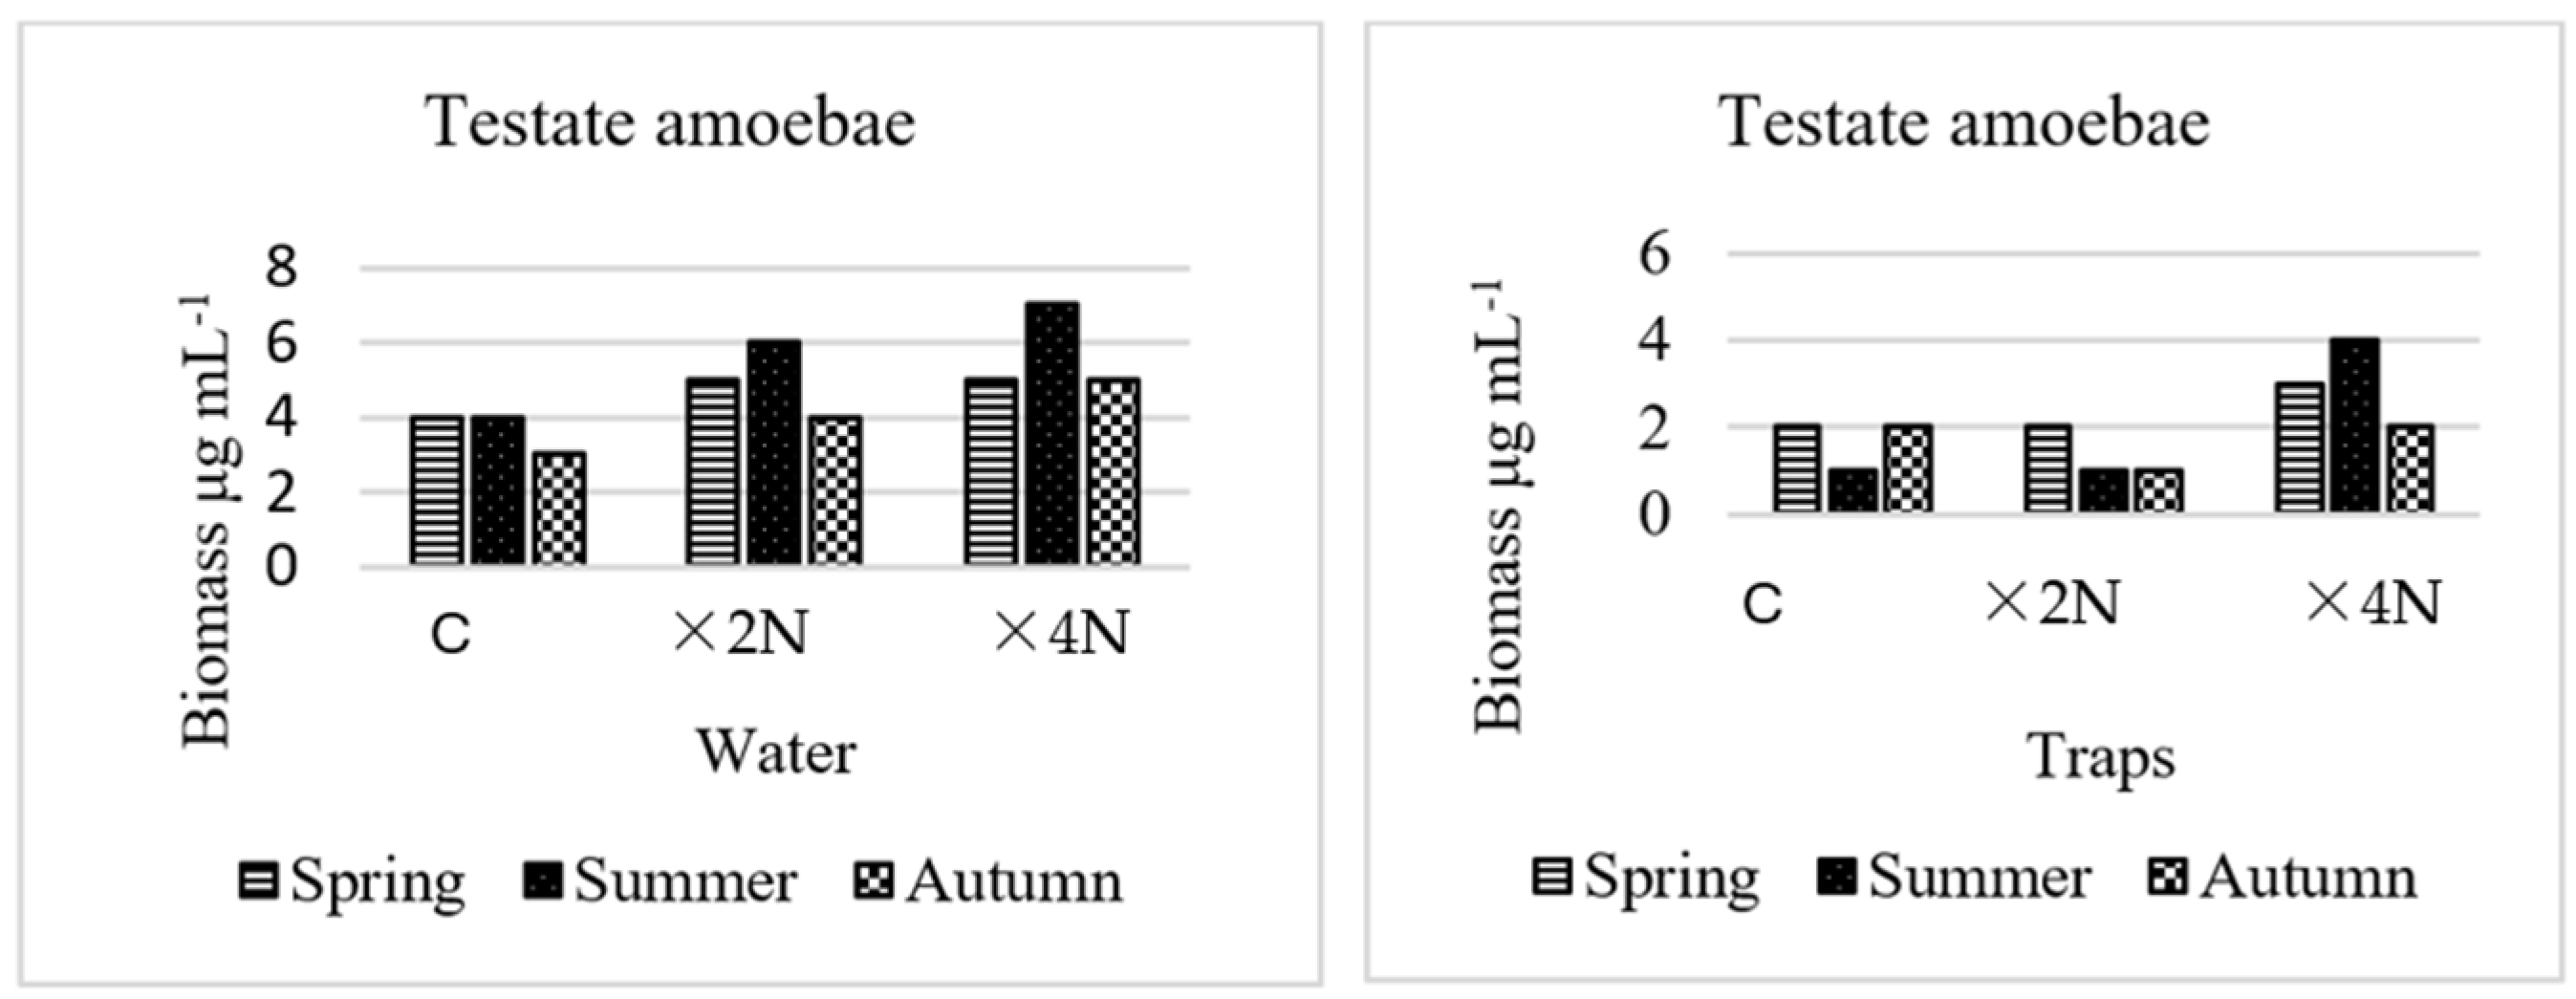
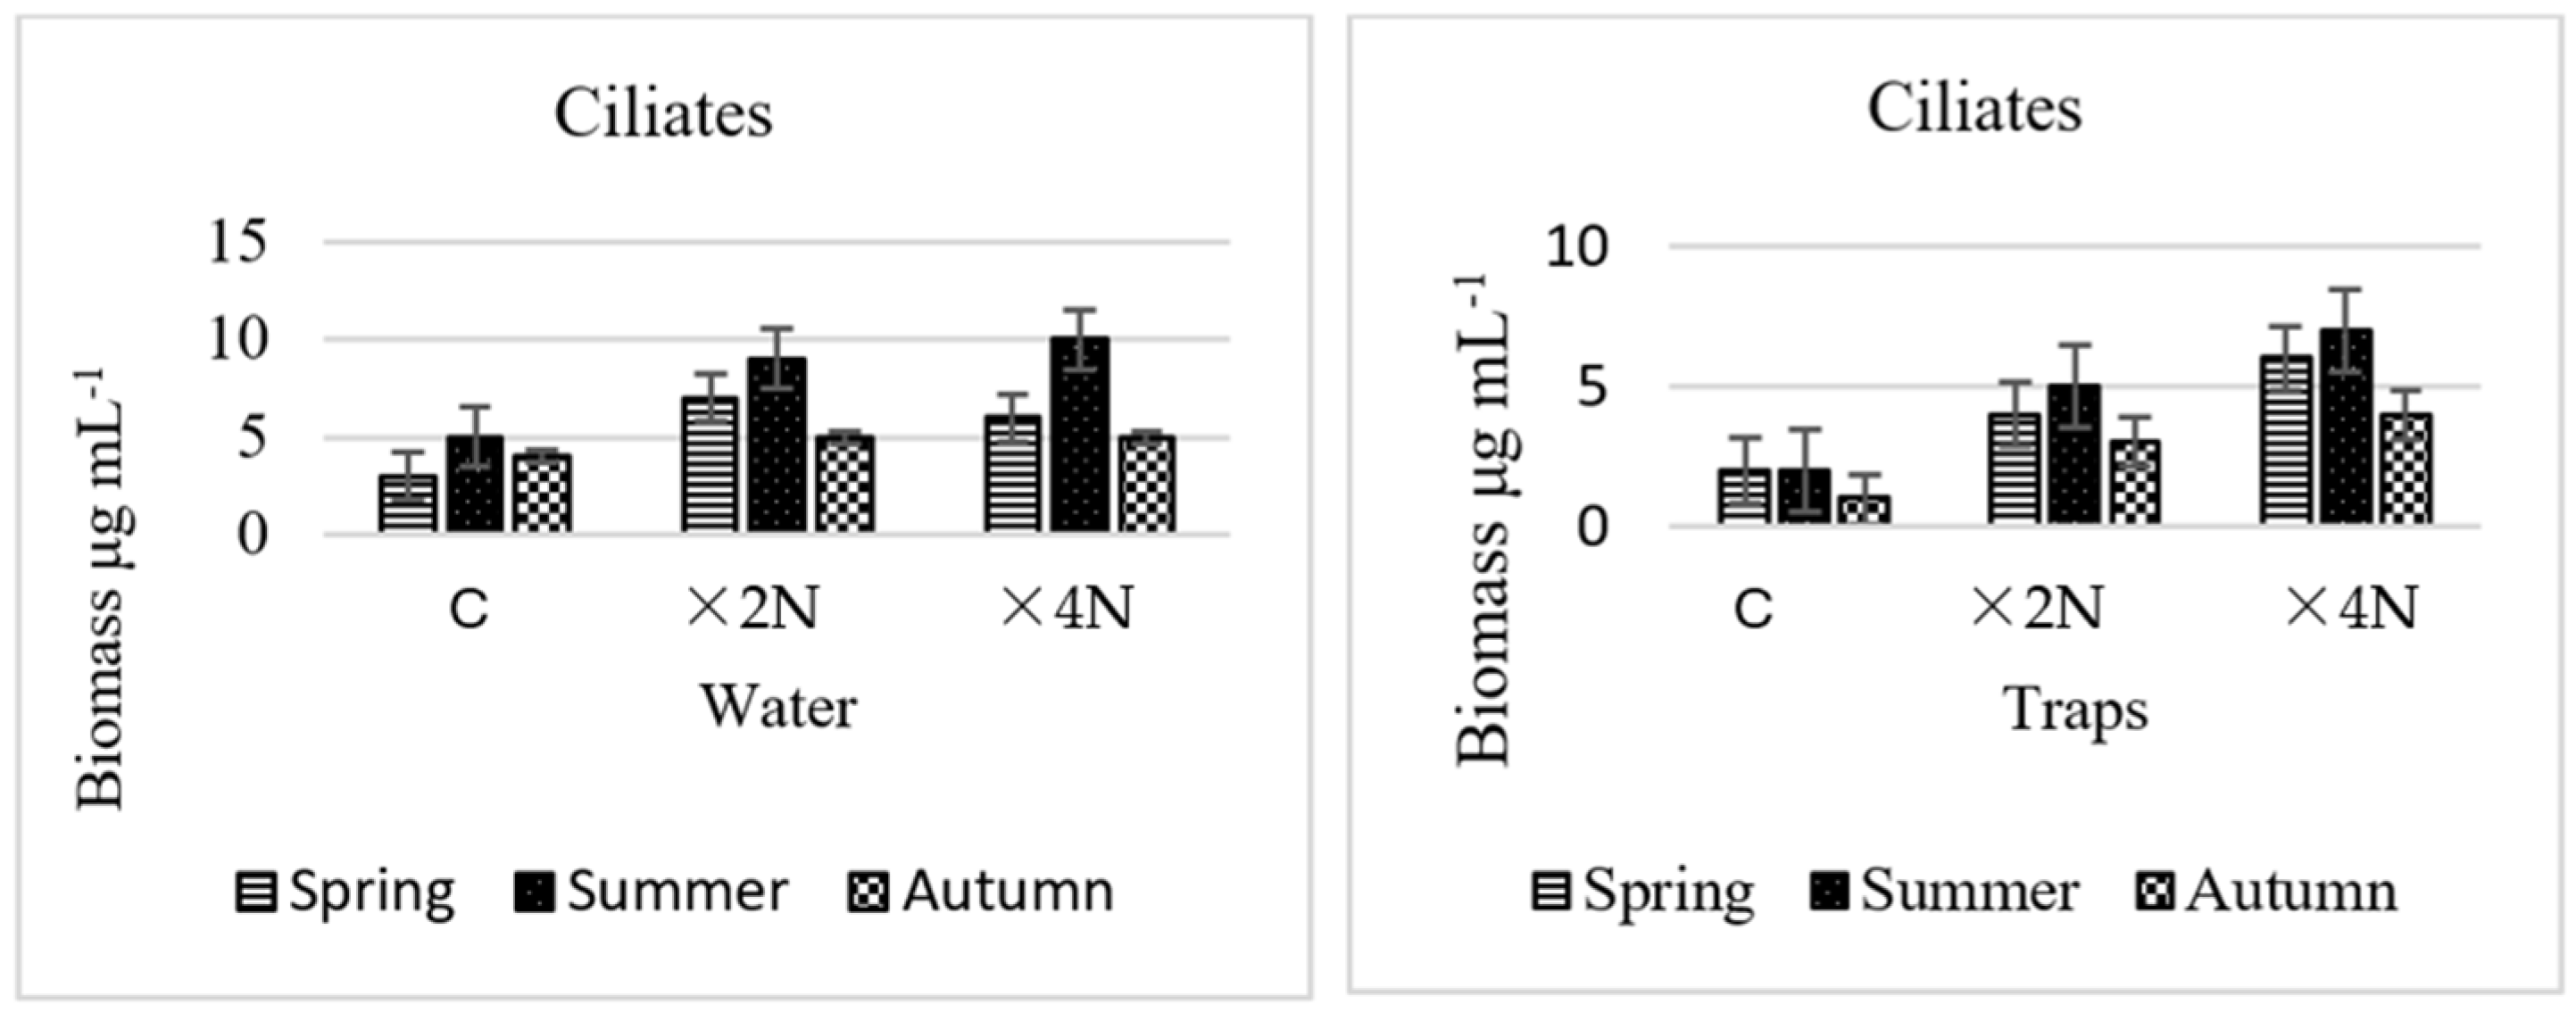
3.4. Abundance and Biomass of Testate Amoebae and Ciliates

The number of species of testate amoebae was higher in treatment ×2N (three species in the water and two species in the traps). In the water samples (×4N) there were two species of testate amoebae, while on average one species of testate amoebae was recorded in the traps. In the treatments enriched with nitrogen compounds, Arcella discoides was the most numerous in the traps, while Arcella discoides, Amphitrema flavum, and Hyalosphenia elegans were the most numerous in the water. In the control sample, Arcella discoides was the most numerous in the water and in the traps. In the case of ciliates, species diversity was higher in treatment ×4N, with 15–19 taxa in the water (and 2–3 taxa in the traps). In the case of ciliates Paramecium bursaria and Litonotus lamella were the most numerous in the water, while Paramecium bursaria had the largest share in the traps.
The abundance of testate amoebae and ciliates was much higher in the water than in the traps of Utricularia vulgaris (in both ×2N and ×4N compared to the control sample) (Figure 6 and Figure 7). The abundance of testate amoebae and ciliates in treatment ×2N was highest in summer and lowest in spring. In treatment ×4N, the highest abundance of testate amoebae and ciliates in the water was observed in summer. In the traps, the highest abundance of both testate amoebae and ciliates in treatment ×2N was recorded in summer. In the traps, the highest abundance of both testate amoebae and ciliates in treatment ×4N was recorded in spring (ANOVA for testate amoebae F3.36 = 0.521, p = 0.511; ANOVA for ciliates F3.30 = 0.676, p = 0.512) (Figure 6 and Figure 7).
The biomass of testate amoebae and ciliates in the water mostly increased with fertility. The biomass of testate amoebae was highest in summer in both treatment ×2N and treatment ×4N in water (Figure 8) In the case of ciliates, the value for this parameter in both treatment ×2N and treatment ×4N was highest in the summer (Figure 9).

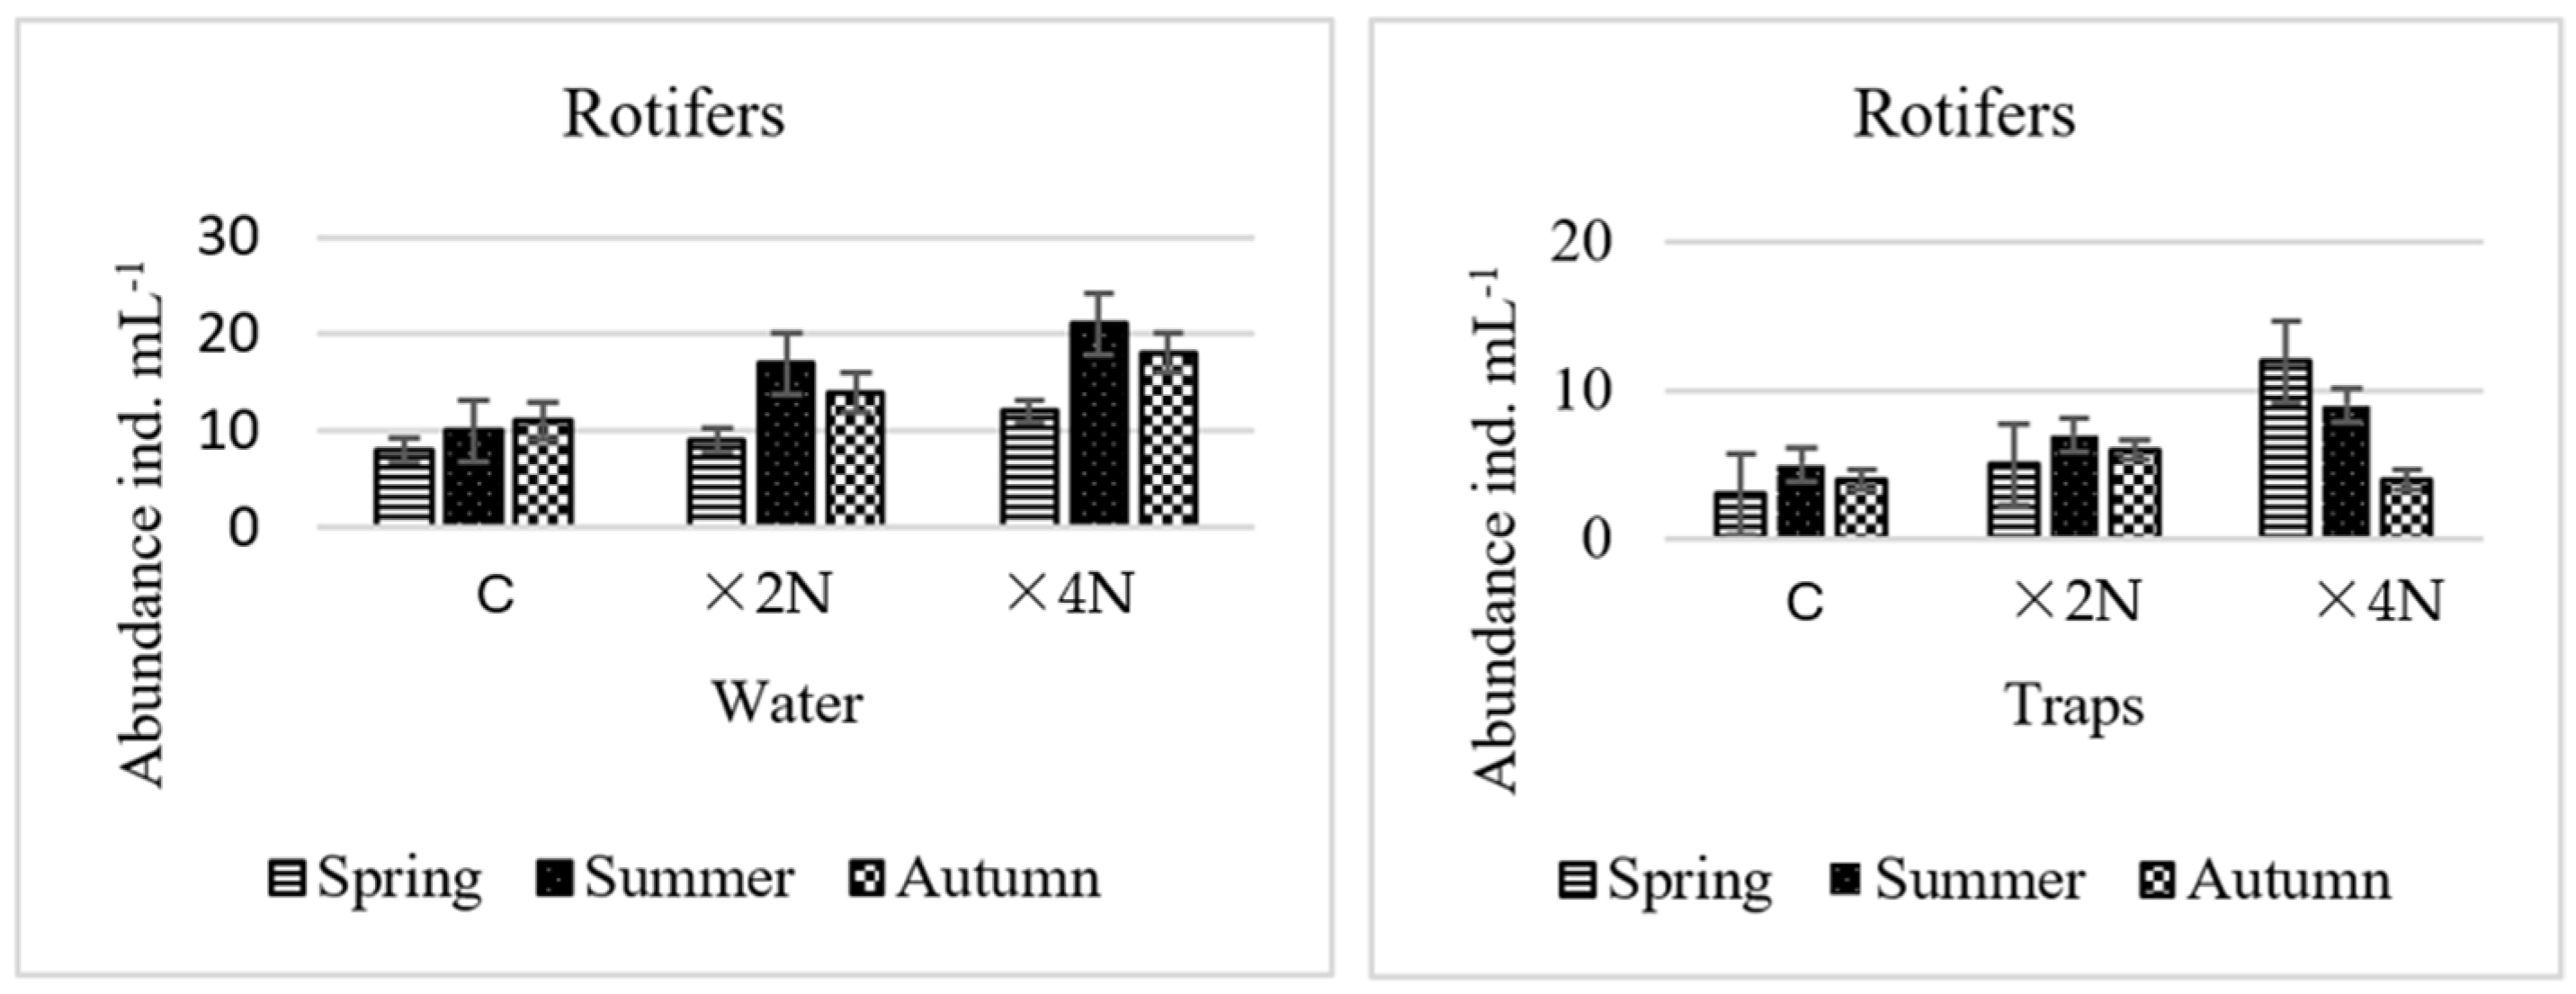
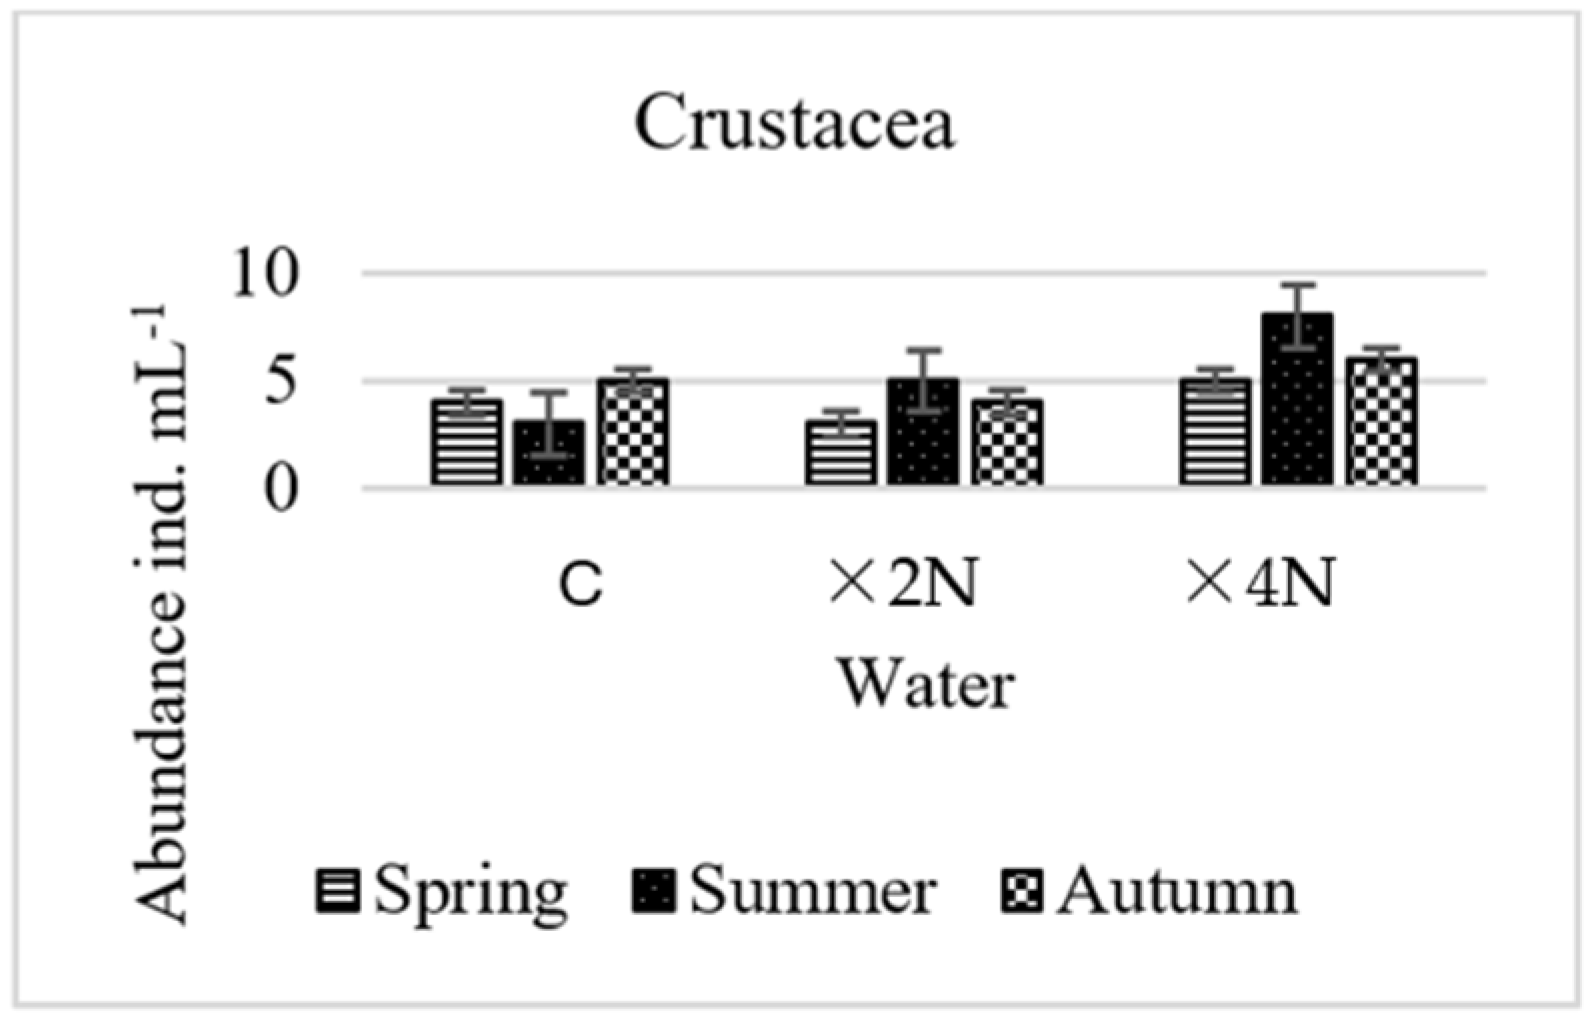
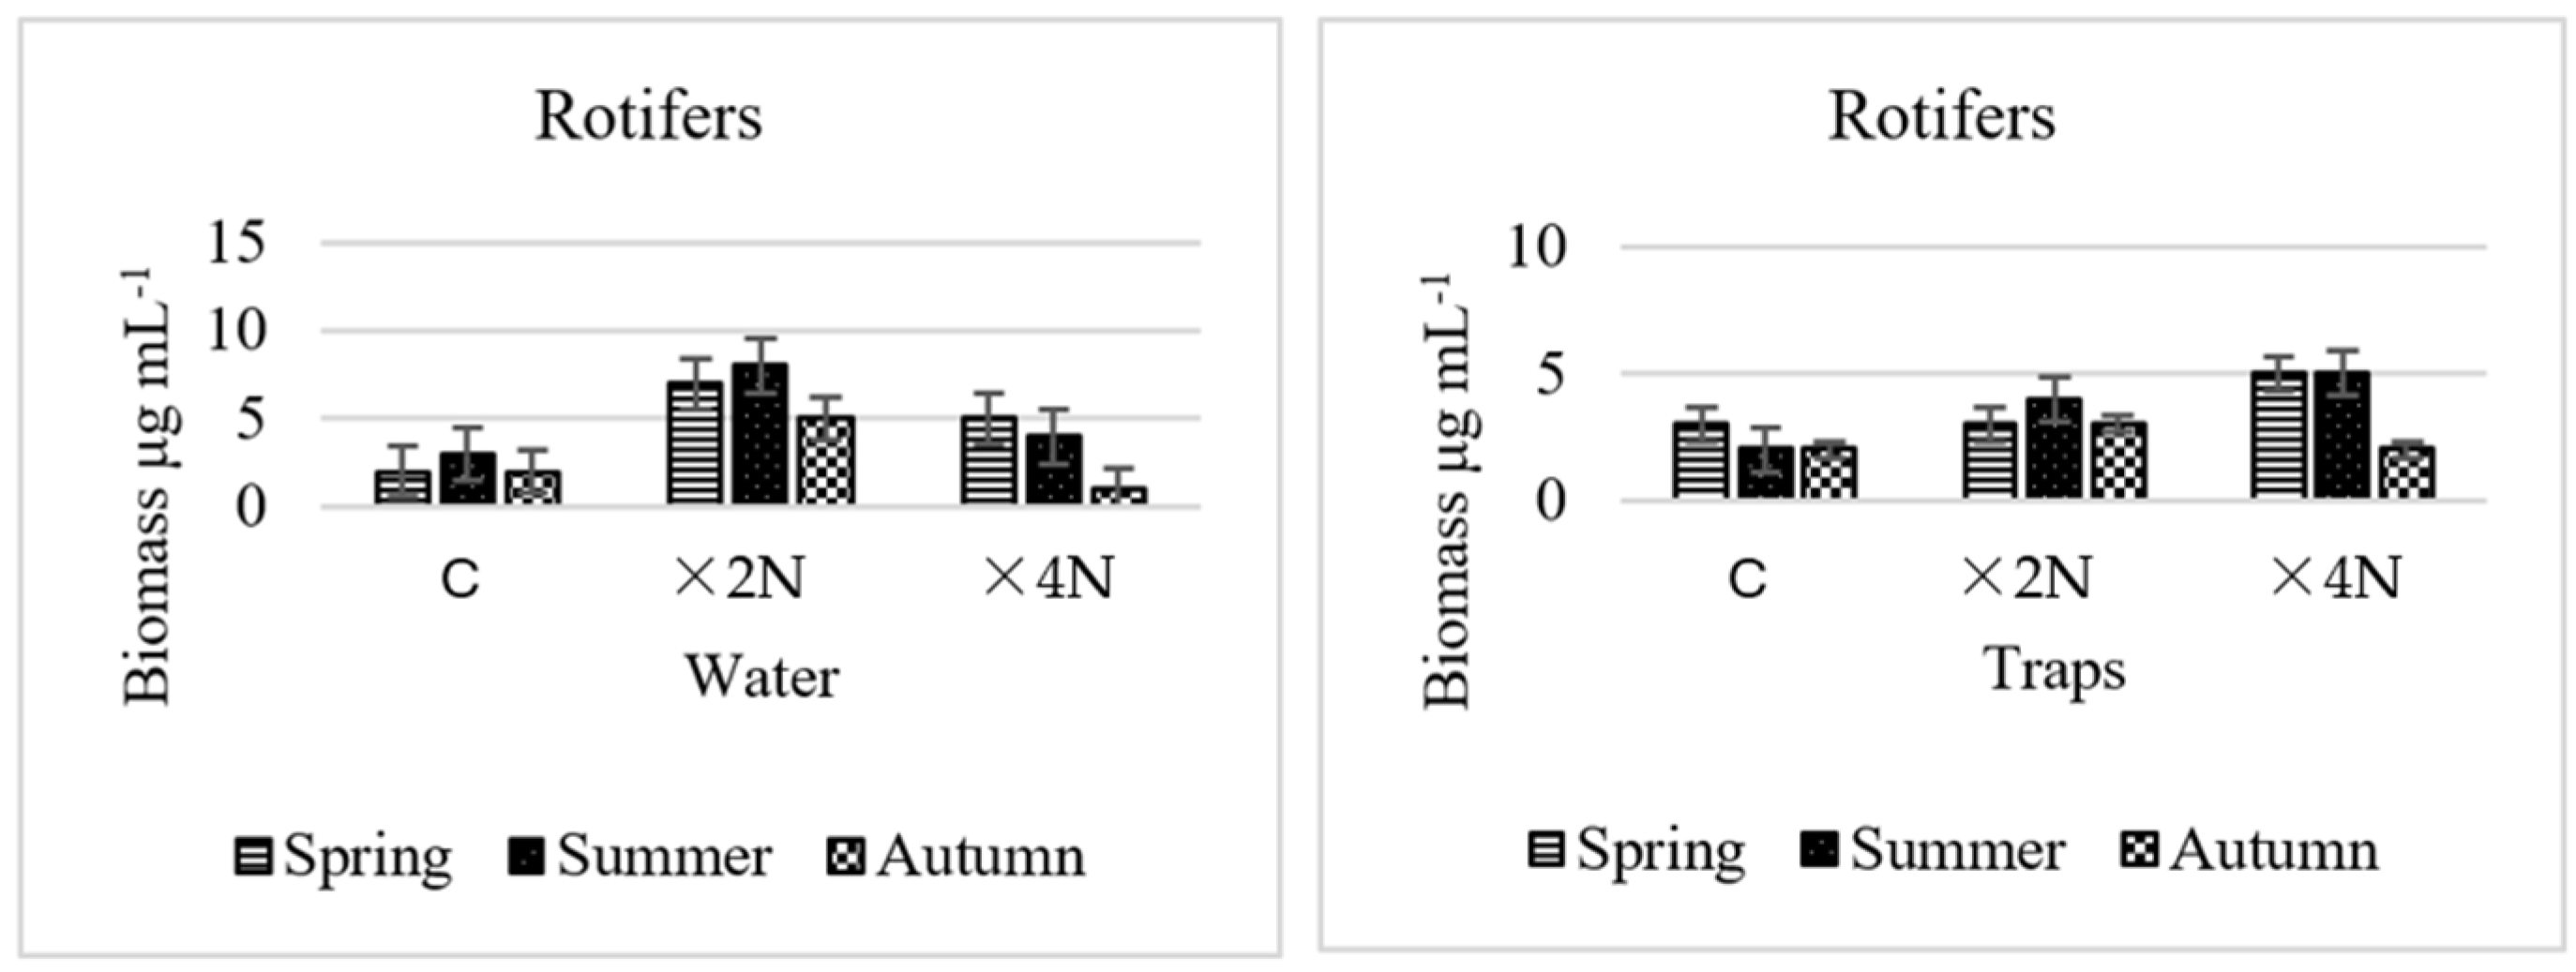
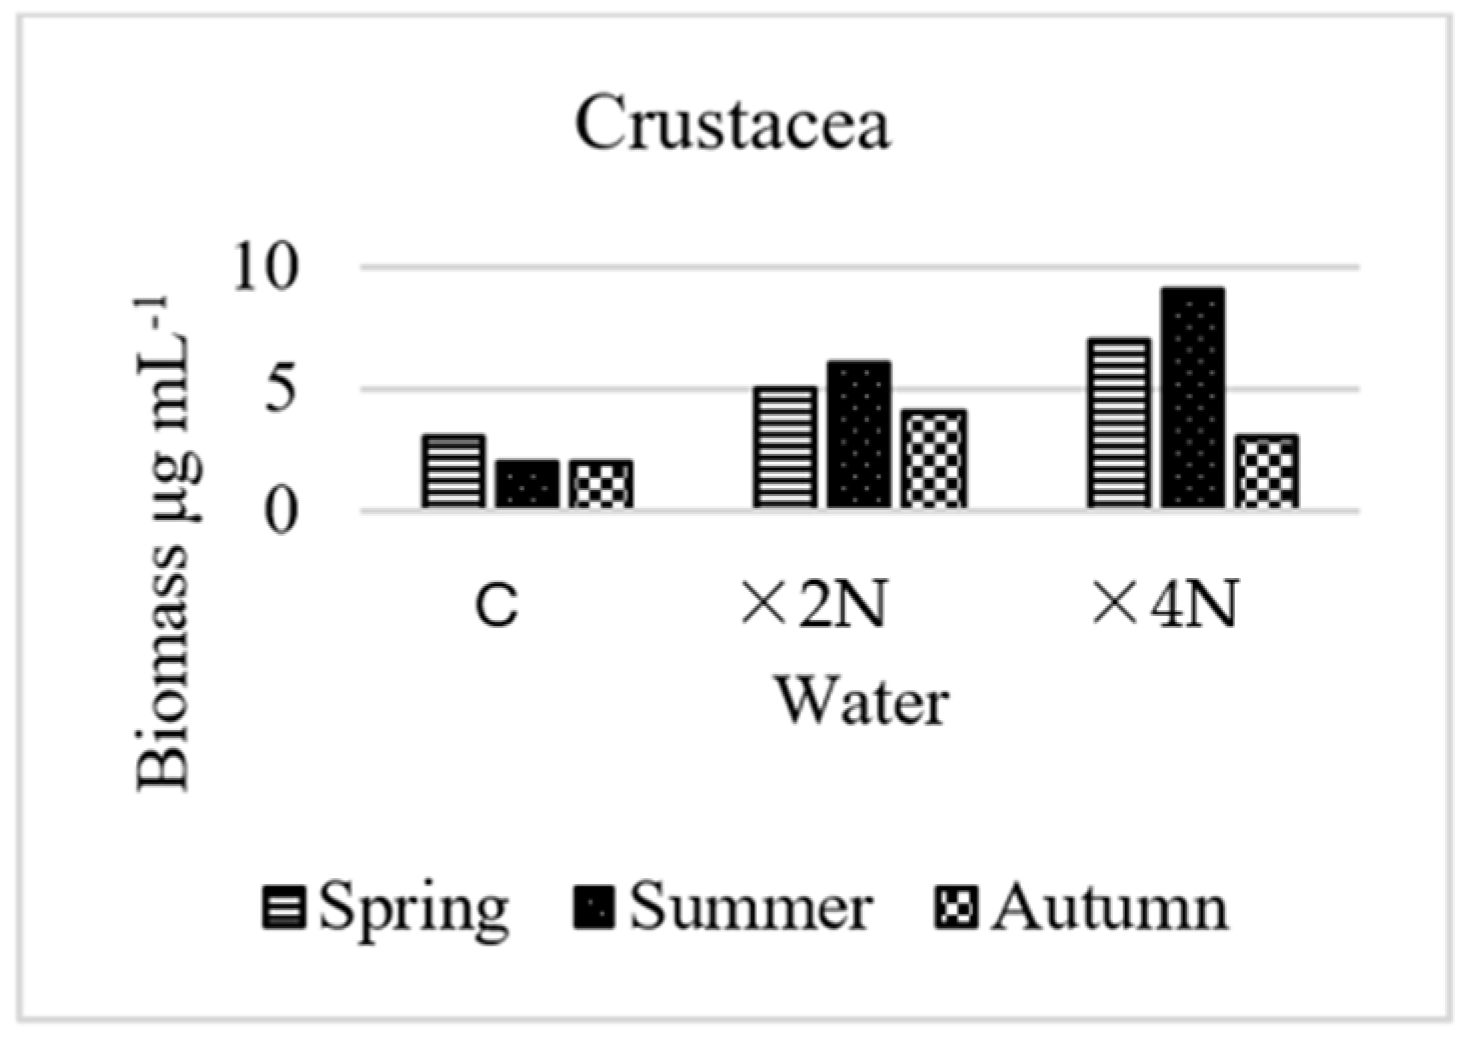
3.5. Abundance and Biomass of Small Metazoa

The number of species of rotifers and crustaceans was low in both treatment ×2N and treatment ×4N. Rotifers were present in the water and in the traps, although their species diversity was lower in summer than in spring and autumn. Crustaceans were present only in the water samples, and their richness was lower in summer than in spring and autumn. Bdelloidea and Lecane were dominant among rotifers in the aquatic environment, while Bdelloidea was dominant in the traps. Among crustaceans, the dominant taxon was Ceriodaphnia sp.
Significantly higher abundance of rotifers compared to the control was observed in the water enriched with nitrogen (Figure 10). In the traps, the highest abundance of rotifers was noted in summer in treatment ×2N and in spring in treatment ×4N (Figure 11).
Crustaceans were not present in the traps. Their abundance in the aquatic environment was much higher in treatment ×4N (from 2 to 8 ind. mL−1). The highest abundance was noted in summer in both ×2N and ×4N (Figure 11).
The biomass of rotifers in the water in treatment ×4N was lower than in treatment ×2N. Moreover the biomass of crustacea in the water in treatment ×2N was lower than in treatment ×4N—in spring and summer (Figure 12 and Figure 13). In the traps, the biomass of these organisms was higher in treatment ×4N—in spring and summer. The maximum biomass of rotifers in the water in treatment ×2N was 8 μg mL1, and the lowest biomass (5 μg mL1) was recorded in autumn. In the traps, the maximum biomass was 4 μg mL1, and the minimum was 3 μg mL1(Figure 12). In treatment ×4N, the highest biomass in the water was 5 μg mL1, and the lowest was 1 μg mL1. In the traps, the maximum value was 5 μg mL1, and the minimum was 2 μg mL1 (Figure 13).

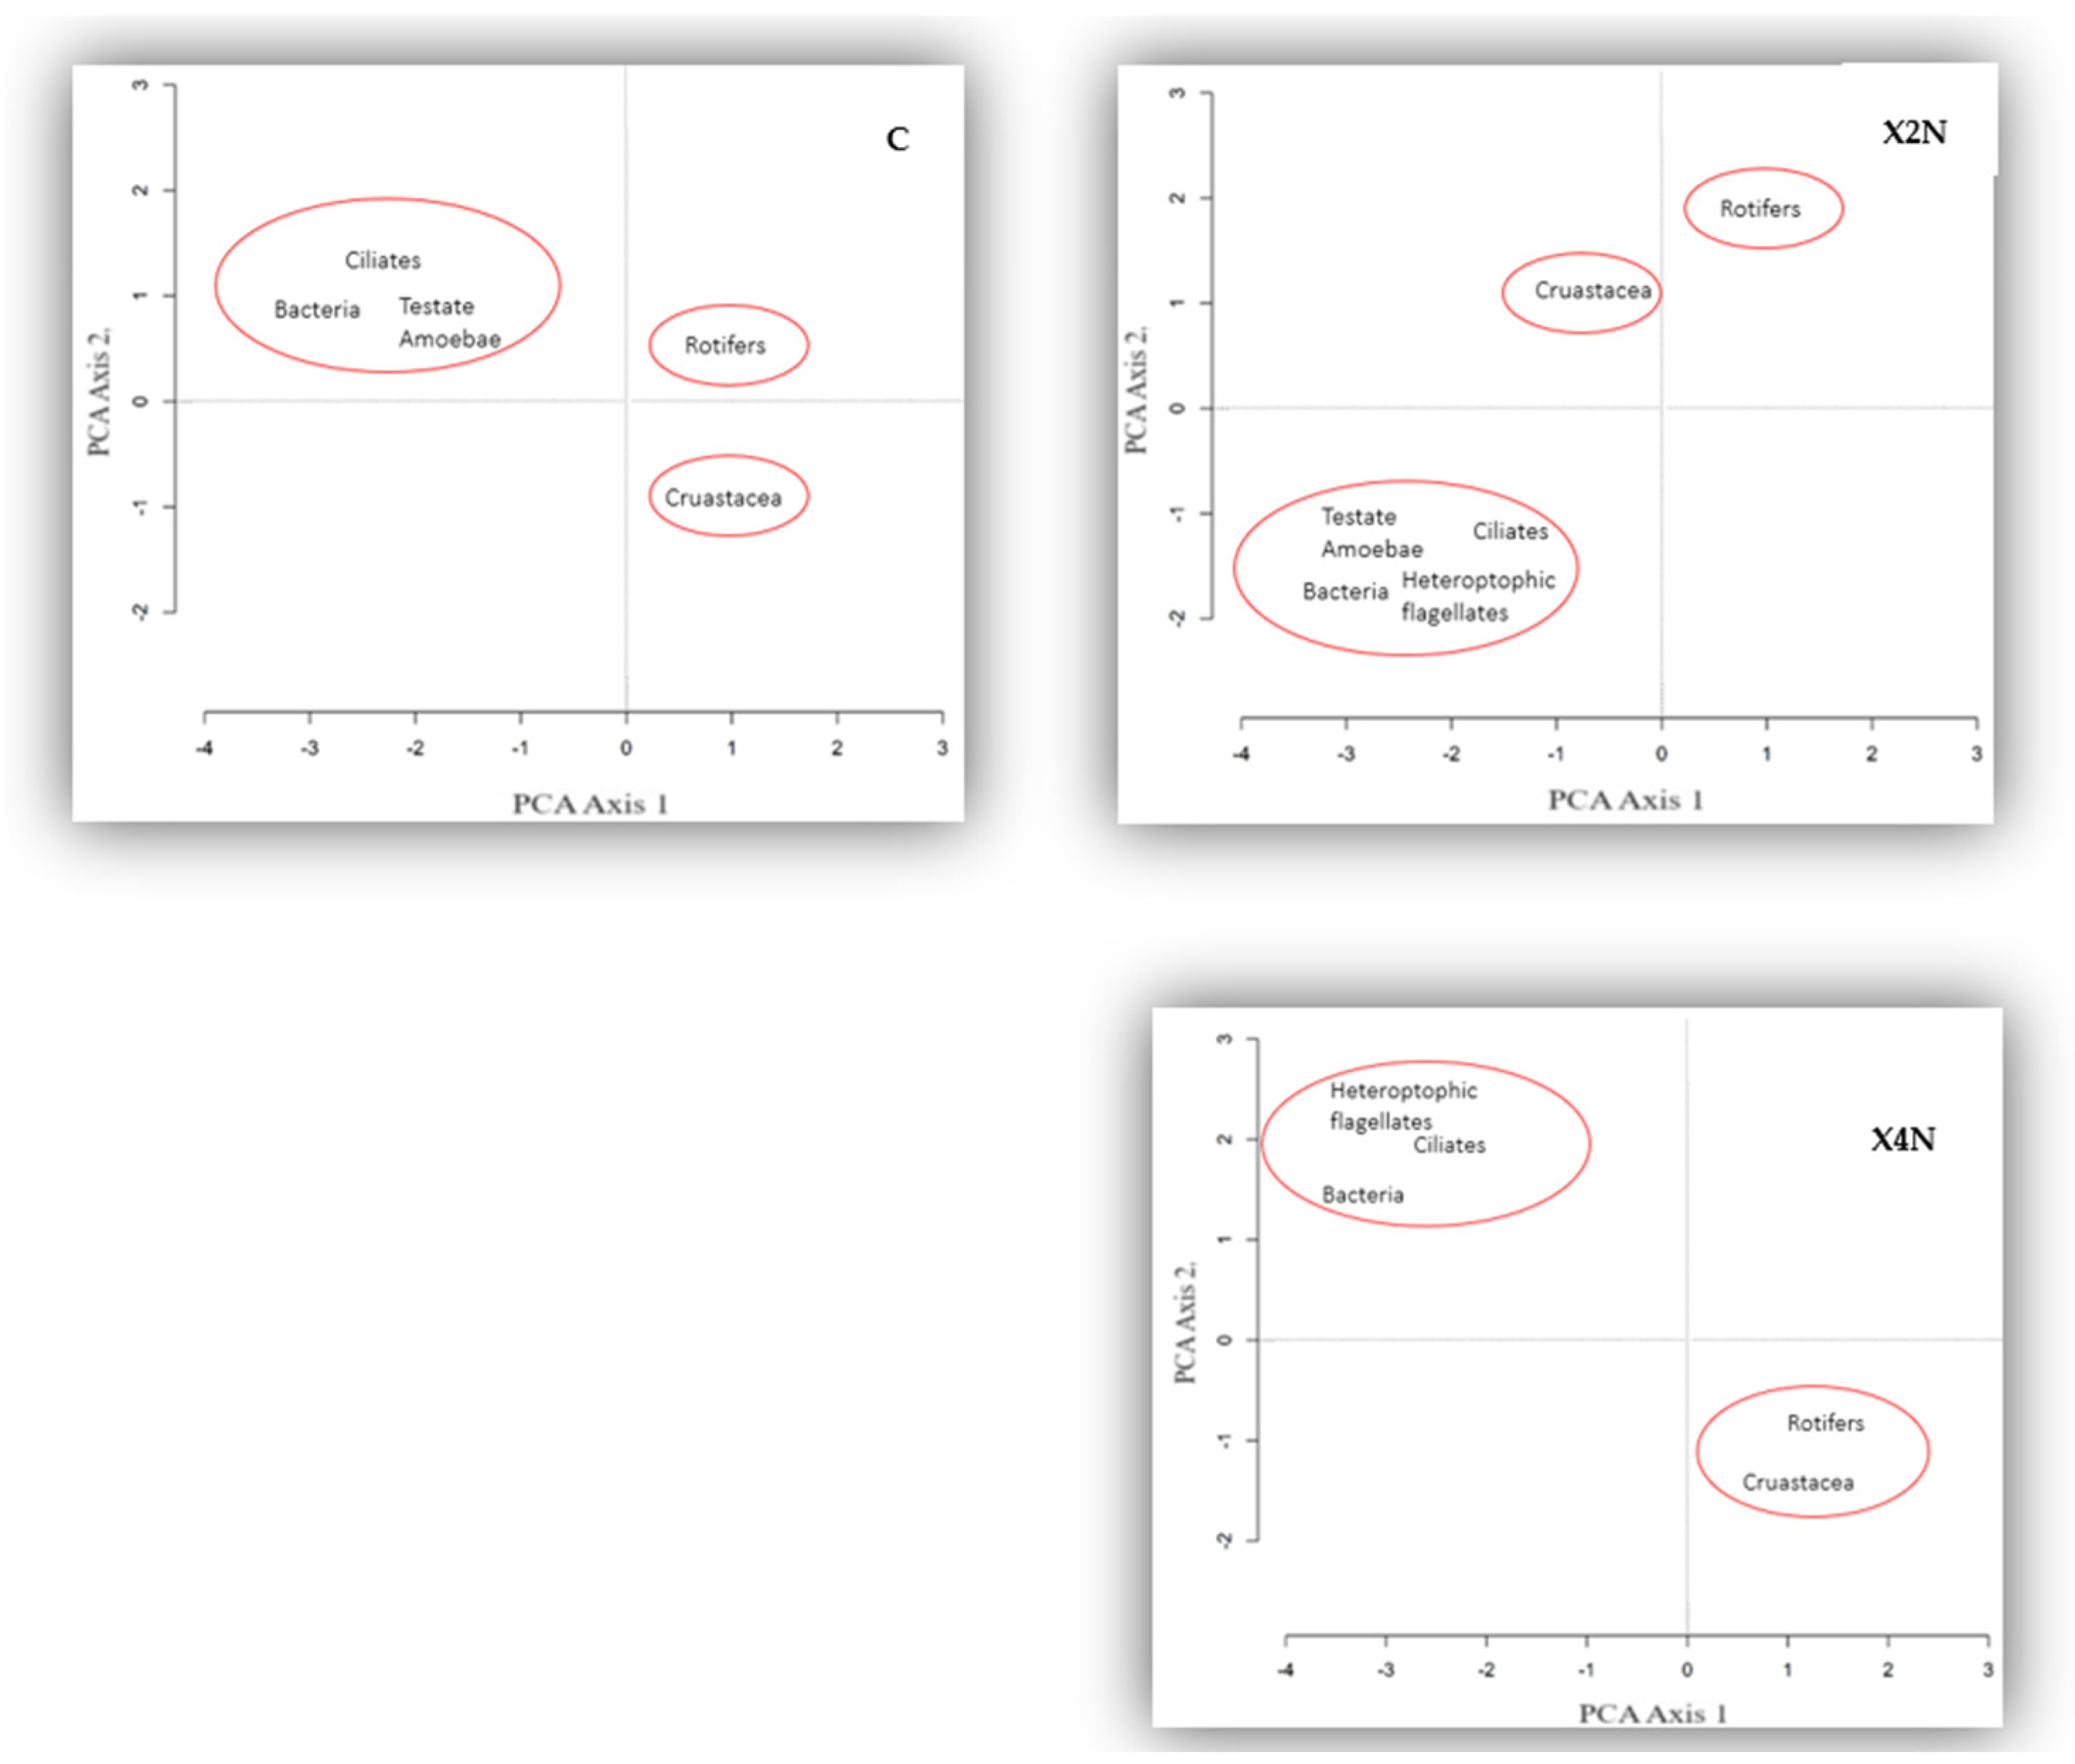
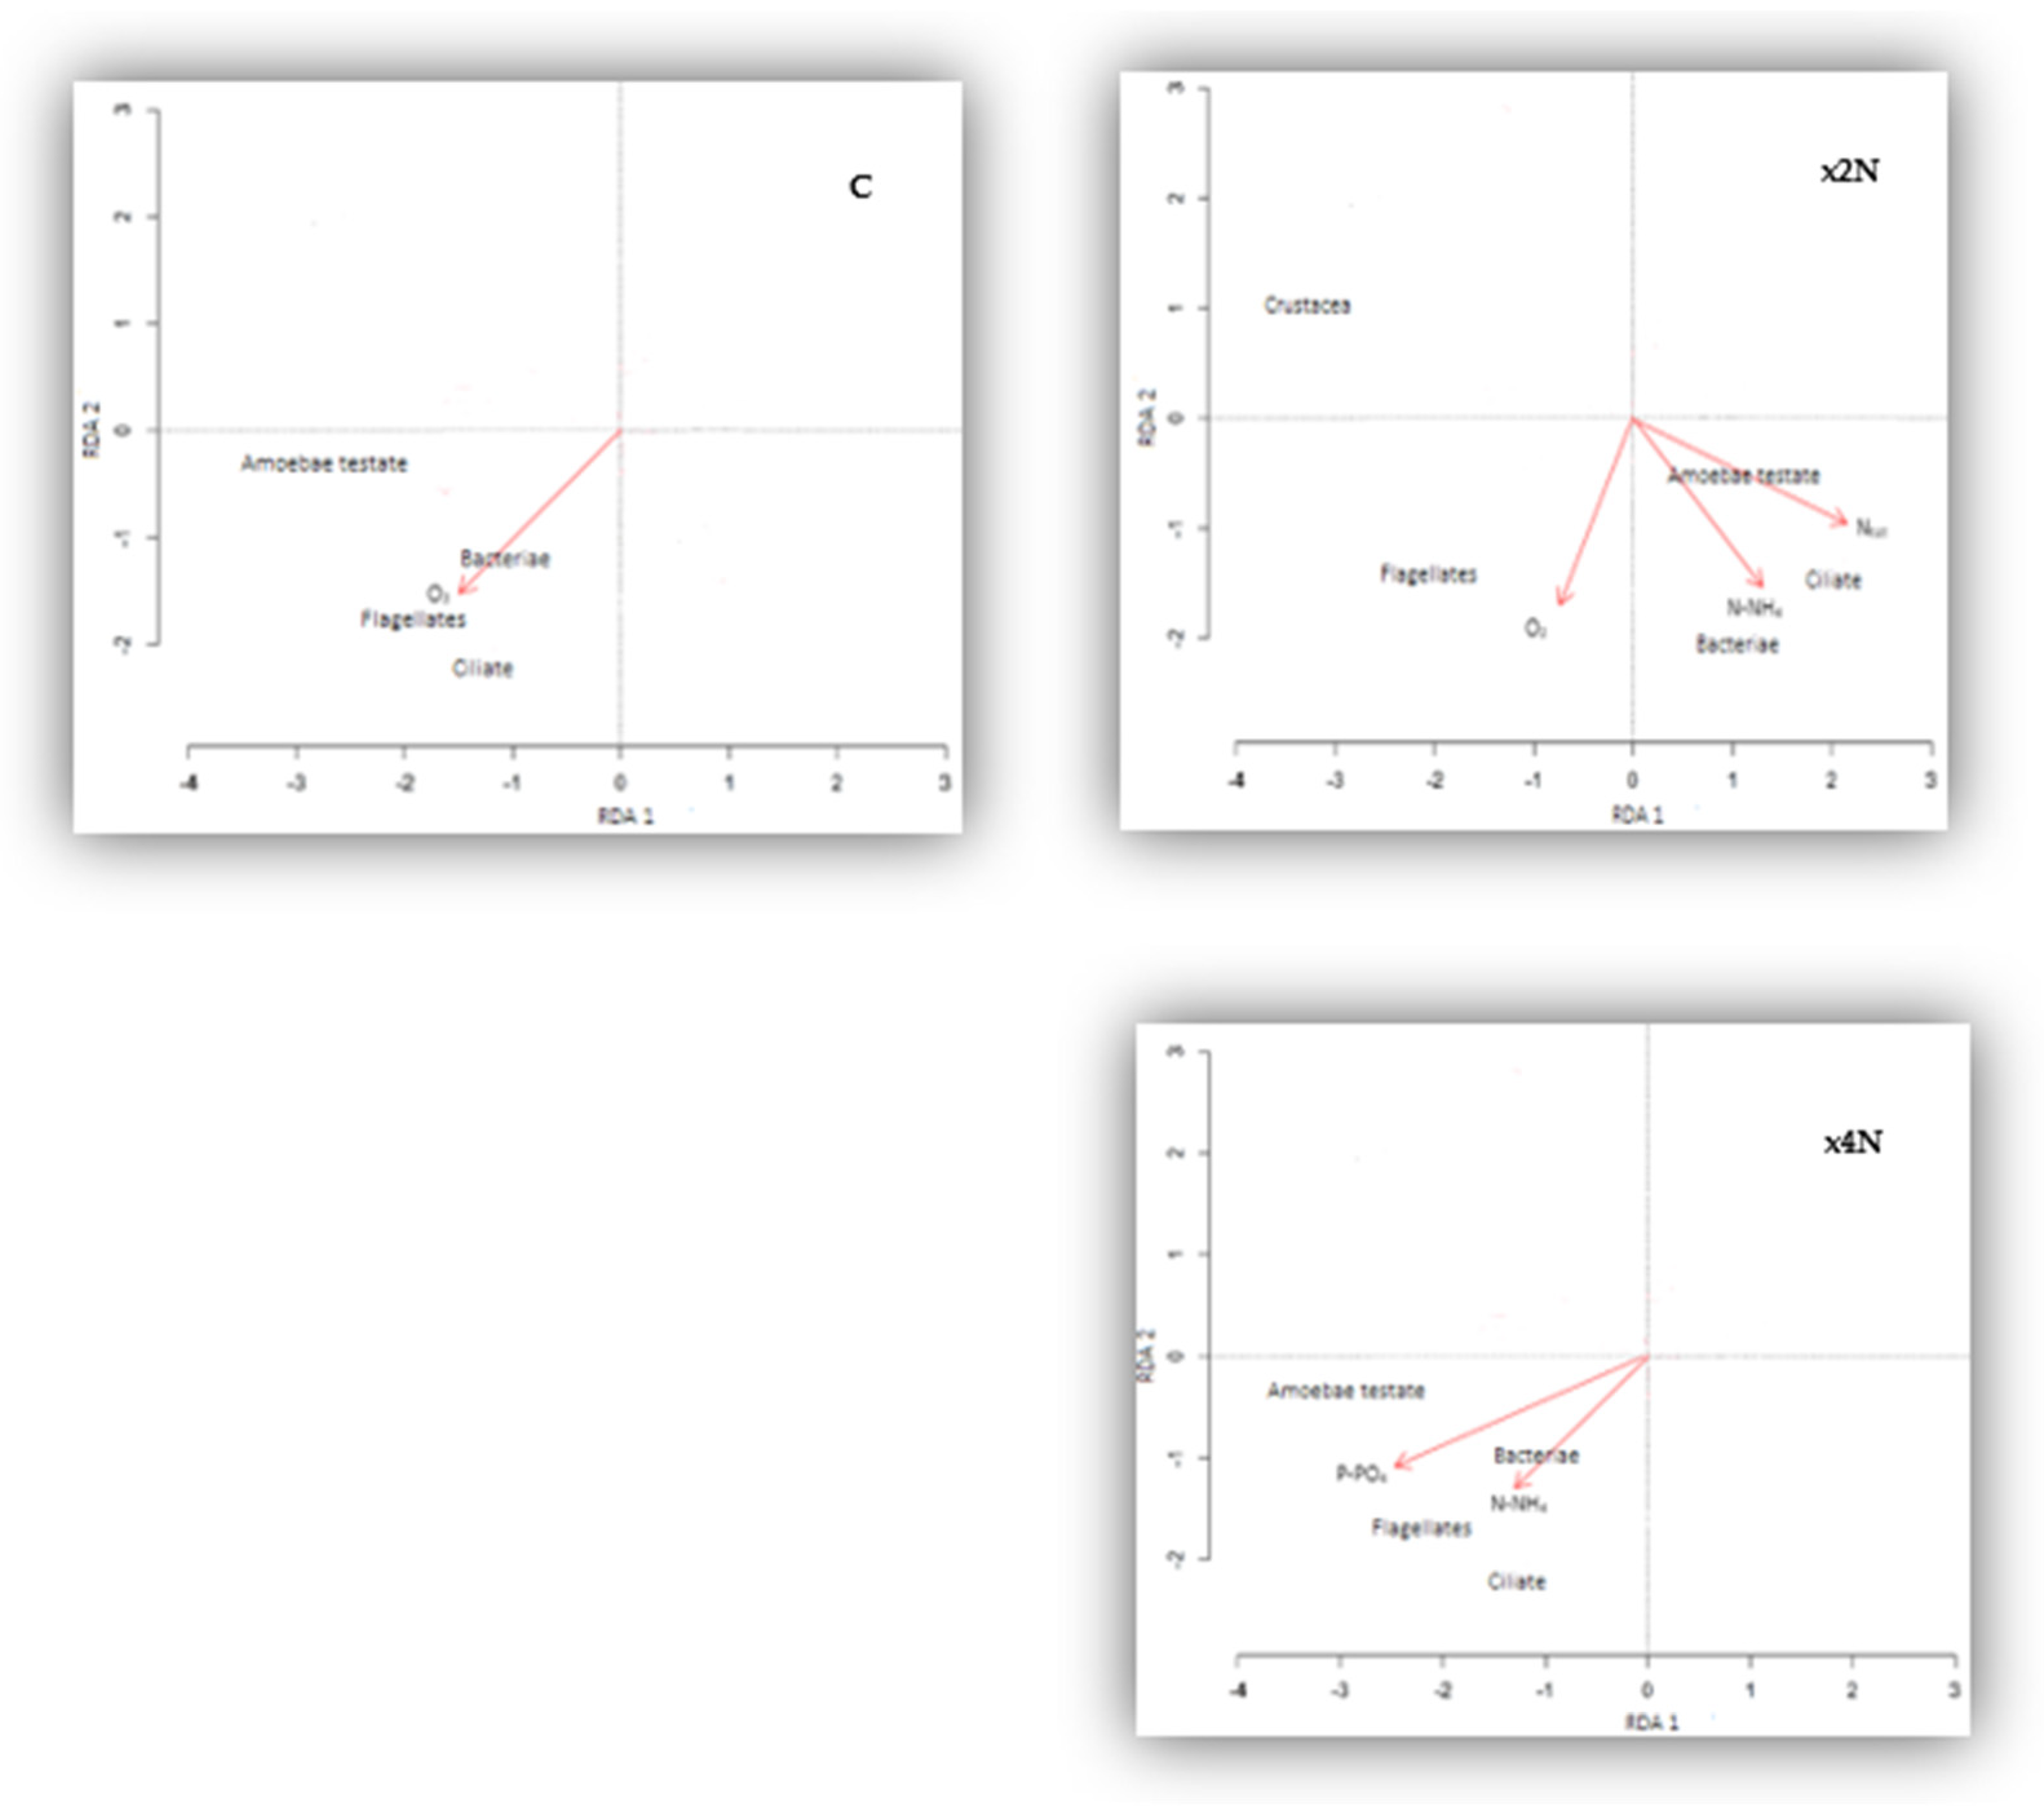
3.6. PCA, Redundancy Analysis (RDA), and Correlations

PCA analysis revealed a division of microbial communities into groups, differing in species composition in individual treatments. In the control sample, three groups were shown: the first consisted of bacteria, testate amoebae, and ciliates; the second comprised rotifers; and the third comprised crustaceans. In treatment ×2N, the microbial communities were formed by three main groups: the first consisted of bacteria, heterotrophic flagellates, testate amoebae, and ciliates; the second comprised rotifers, and the third comprised crustaceans. In treatment ×4N, there were two groups of microorganisms: the first consisted of bacteria, heterotrophic flagellates, testate amoebae, and ciliates, while the other comprised rotifers and crustaceans (Figure 14).
The environmental variables were standardized prior to RDA analysis. The analysis showed that the parameters N-NH4, DOC, and oxygen were significant elements determining the occurrence of microorganisms. In the control treatment, the main factors influencing the microbial communities were the concentrations of oxygen and chlorophyll a. In treatment ×2N, the main factors were N-NH4 and oxygen. These parameters were the factors determining the occurrence of microbial communities. In treatment ×4N, the deciding parameters were N-NH4 and P-PO4 (Figure 15).
Correlation analysis shows that in spring and in summer, the most significant factors influencing the microbial communities in the water in the control treatment were oxygen (r = 0.62; r = 0.57; p < 0.05) and pH (r = 0.68; r = 0.46; p < 0.05). In autumn, a correlation was noted between microorganisms and oxygen (r = 0.43, p < 0.05). In the traps, in spring and in summer, microorganisms were shown to be correlated with oxygen (r= 0.51; r = 0.58; p < 0.05). In spring in treatment ×2N, microorganisms were positively correlated with biogenic compounds and oxygen and negatively with chlorophyll a. In summer and autumn in the traps in treatment ×2N, the factors with the most significant influence were biogenic compounds and oxygen (positive correlation). On the other hand, a negative correlation was shown between microorganisms and chlorophyll a. In treatment ×4N, in the water in spring and summer, microbial communities were correlated positively with electrical conductivity and negatively with pH. In the traps in summer, there was a negative correlation with chlorophyll a. The degree of correlation between microbial communities was varied (Table 2).

3.7. Correlations between Food Web Components

The degree of correlation varied substantially between experimental treatments. In the control group in spring, there were positive correlations between abundance of testate amoebae and flagellates and between ciliates and bacteria (r = 0.52; r = 0.45, p < 0.01). In summer, there were positive correlations between flagellates and bacteria; testate amoebae and flagellates; and ciliates and bacteria (r = 0.56 and 0.48; r = 0.47; r = 0.57; p < 0.05). In autumn, only bacteria and testate amoebae were correlated (r = 0.43; p < 0.05). In treatment ×2N, there were positive correlations in spring for bacteria and ciliates and for flagellates and testate amoebae (r = 0.48; r = 0.62; p < 0.05), and in summer for bacteria and flagellates; testate amoebae and bacteria; testate amoebae and flagellates; and ciliates and bacteria (r = 0.78; r = 0.69; r = 0.76; r = 0.43; p < 0.01). In autumn, there were no significant correlations between microbial communities (r = 0.58; p < 0.01). In experimental treatment ×4N in spring, there were positive correlations between bacteria and testate amoebae and between bacteria and ciliates (r = 0.59, r = 0.53; p < 0.01), and in summer there was an additional positive correlation between bacteria and flagellates (r = 0.82, r = 0.69, r = 0.51; p < 0.05). In autumn, there were no significant correlations between microbial communities (Table 3).

4. Discussion

4.1. Changes in Physical and Chemical Parameters Accompanying Eutrophication Processes

Analysis of the physical and chemical parameters of the water showed that the experimental increase in fertility caused mostly an increase in electrical conductivity, pH, and the concentration of chlorophyll a, as well as a decrease in the oxygen concentration in the water. Similar observations were made in Swedish peatland ecosystems [38]; the authors showed that an increase in pH, electrical conductivity, and phosphorus and nitrogen concentrations is linked to the degree of anthropogenic modification of ecosystems [38]. In our study, the increase in electrical conductivity, pH, and chlorophyll a was most evident in experimental treatment ×4N and was accompanied by a decrease in the oxygen concentration relative to the control sample. Studies by Gilbert (1998) and Mieczan et al. (2015) also showed that changes in the content of biogenic compounds caused a decrease in the oxygen concentration in the water and an increase in electrical conductivity [35,39]. Temporary decreases in O2 levels in the water may be a natural process, but as demonstrated by Diaz and Rosenberg (2008), it is very often caused by human activity, which promotes eutrophication processes [40].
Research by Bragazze et al. (2006) showed that a higher nitrogen concentration causes a faster peat decomposition rate [41]. For this reason, an increase in the concentration of nutrients can cause qualitative and quantitative changes in biogenic sediments and in the species composition of plants and thereby influence the microbial communities inhabiting them [42]. The literature data indicate that enrichment of the environment with nitrogen compounds accelerates plant growth [43]. An increase in the fertility of the environment positively influences the development and activity of microbial communities [44]. The short life cycle of the trap has a significant influence on the microbial community associated with it [45]. An increase in the concentration of biogenic compounds can modify the functioning of traps. Young traps intensively utilize biogenic compounds and support the development of bacteria, flagellates, testate amoebae, and ciliates until the concentration of biogenic compounds in the environment causes inhibition of trap formation [45]. Biogenic compounds present in the environment were utilized by Utricularia and caused partial degradation of traps. Similar findings were reported by Sirova et al. (2018) [23].

4.2. Effect of Biogenic Compounds on Heterotrophic Bacteria and Heterotrophic Flagellates

The response of microbial communities to a change in the physical and chemical parameters of the water depends on the type of peatland as well as on the intensity of the changes in these parameters [46]. Hydromorphological changes in peatland ecosystems affect the functioning of plant communities, which in turn influences communities of microbes present in peatlands [47]. A study conducted by Mieczan et al. (2015) in a habitat dominated by Sphagnum sp. also revealed significant correlations between habitat fertility and abundance of bacteria [39]. In the present study, enrichment of the aquatic environment with nitrogen compounds caused an increase in the abundance of bacterial communities. The highest abundance of these microorganisms (in the water and in the microbiome of Utricularia) was recorded mostly in summer (in the water ×2N and ×4N—summer; in the traps ×2N—summer; in the traps ×4N—autumn). The abundance of these microorganisms was positively correlated with TOC, which was also demonstrated by Mitchell (2003), Chróst and Siuda (2006) and Lin et al. (2012) [48,49,50]. According to the literature data, pH and organic matter are key factors influencing the abundance and species diversity of bacteria [51]. In a study by Chróst et al. (2009), the abundance of bacteria was significantly influenced not only by the quantity of organic compounds but also by their composition [52,53].
In the traps, the abundance of bacteria was only slightly higher in treatment ×2N than in ×4N, but their abundance was markedly lower than in the water environment. The literature data indicate that the interior of the Utricularia vulgaris trap is inhabited mainly by bacteria but also by protozoa and rotifers [30]. Siragus et al. (2007) showed that bacteria can survive and multiply in traps and can also support the digestion of prey or themselves be digested over time [54,55]. When nutrient levels in the environment are adequate, the intensity of the work of traps decreases [30]. This may explain the lower abundance of microorganisms in the traps in comparison to the water environment in our study.
The highest abundance of bacteria in the Utricularia vulgaris traps was recorded mostly in summer. Similar observations were made by Buosi et al. (2011), who showed a positive relationship between an increase in the temperature of the environment and the abundance of bacteria [56]. A study by Sirova (2009) showed that bacteria are a significant element supporting the uptake of biogenic compounds from both the water environment and traps [57]. This was reflected in our study, which also showed a marked increase in the abundance of microorganisms as the degree of eutrophication increased. A relationship between the abundance of heterotrophic bacteria and nutrient levels was observed by Giang et al. (2015) [30].
Auer and Ardt (2001) observed a significant relationship between the abundance of flagellates and elevated concentrations of biogenic compounds in lake ecosystems [58]. Our experiment showed similar relationships in the water. The abundance of heterotrophic flagellates was markedly higher in the treatments enriched with biogenic compounds. In every experimental treatment, their abundance and biomass were highest in summer and lowest in spring. This is to some extent surprising, because in summer the abundance of these microorganisms often declines due to the increase in predation pressure from testate amoebae, rotifers, and crustaceans [58]. The increase in abundance in summer may have been due to an increase in temperature or in the fertility of the environment [41,59].
Heterotrophic flagellates are a relatively stable element of the microbiome of Utricularia vulgaris L. [60]. Lower abundance of flagellates was noted in the traps in both treatment ×2N and treatment ×4N. Mieczan and Bartkowska (2022) also observed lower abundance of heterotrophic flagellates in the traps compared to the water, but that study did not take into account the influence of habitat fertility [61]. The literature indicates that traps are sensitive to changes in environmental conditions [62]. Enrichment of the environment with biogenic compounds resulted in the inhibition of trap formation.

4.3. Effect of Biogenic Compounds on Testate Amoebae and Ciliates

Testate amoebae are one of the best-described microbial communities occurring in peatland ecosystems [63,64,65]. Due to their high diversity and close connection to environmental factors, they are a reliable indicator of environmental conditions [66]. In our study (in the water), the abundance of amoebae was increased by enrichment of the habitat with nitrogen compounds, while the number of amoeba species decreased. Jessey et al. (2012) also observed a decline in the species diversity of testate amoebae when the concentration of nutrients in the environment increased [67]. That study, however, concerned microorganisms inhabiting Sphagnum sp. In our study, lower species diversity was accompanied by a decrease in the oxygen concentration in the habitat. Similar relationships were observed by Mazei et al. (2007), who showed a decline in the species diversity of testate amoebae as the oxygen concentration in peatland ecosystems decreased [68].
Abundance of testate amoebae in the water and in the traps increased with the increase in the fertility of the environment. Similar relationships were reported by Mitchell et al. (2008) and Lamentowicz et al. (2020) [69,70]. The favourable environmental conditions may also have led testate amoebae, as predators, to play a key role in the microbiological structure of the food web. Due to the high abundance of the other microbial communities (as their potential food base), they did not have to compete for resources [6]. Abundance of testate amoebae was higher in the water than in the traps. This was probably due to the enrichment of the habitat with biogenic (nitrogen) compounds, which inhibit the trap formation process [62]. Thus, it can be concluded that the composition and structure of testate amoebae communities are highly sensitive to the ecological conditions in peatland ecosystems. This is confirmed by numerous studies on the effect of variation in environmental conditions on testate amoebae in different seasons [69,71,72,73]. In our study, the abundance of testate amoebae, in both treatment ×2N and treatment ×4N, was highest in summer. Similar patterns were observed by Warner et al. (2007) [74]. Mieczan et al. (2015) showed an increase in the abundance of these microorganisms in spring and summer and also demonstrated that it was caused by an increase in the concentration of biogenic compounds in the environment and in pH. That study, however, investigated microhabitats dominated by Sphagnum sp. The dominant amoebae in the aquatic environment were Hyalosphenia elegans, Arcella discoides, and Amphitrema flavum, while Arcella discoides was dominant in the traps. Hyalosphenia elegans and Amphitrema flavum are mixotrophic taxa. Mixotrophs are very frequently observed in peatlands with low pH and low electrical conductivity. These taxa have photosynthetic symbionts which help them to adapt to variable environmental conditions [75]. Arcella discoides, on the other hand, has high ecological tolerance and is also often present in nutrient-rich environments. The present study showed an increase in the abundance of Arcella discoides, Hyalosphenia elegans, and Amphitrema flavum as the concentration of nitrogen compounds increased. Nicolau et al. (2005) also observed an increase in the abundance of these species in water bodies with high contents of biogenic compounds [76].
Ciliates are important predators regulating the abundance of bacteria, flagellates, and algae, and they are also food for organisms at higher trophic levels [77,78]. Both mixotrophic and heterotrophic ciliates regulate nutrient circulation through mineralization of nitrogen and phosphorus compounds in the environment [78]. Research by Mitchell et al. (2003), Kexin et al. (2007), Nguyen-Viet et al. (2007), Wilkinson and Mitchell (2010), and Mieczan et al. (2012) has shown that these microorganisms may be present in high numbers in peatland ecosystems [69,79,80,81,82]. The literature indicates that in environments rich in biogenic compounds, the abundance of ciliates is higher than in ecosystems with low fertility [83]. In the present study, the abundance of ciliates increased with the fertility of the environment. Similar relationships were reported by Mieczan et al. (2015), who showed that an increase in the concentration of biogenic compounds positively influences the abundance of ciliates in various types of peatlands [84]. A study by Mieczan and Tarkowska-Kukuryk (2015) demonstrated an increase in the abundance of these microorganisms as the concentration of biogenic compounds and the pH increased. The present study also showed that the abundance (in the water) of ciliates increased with the increase in the concentration of biogenic compounds, which was accompanied by an increase in the pH of the environment. The literature data indicate that an increase in habitat fertility causes an increase in the species richness of ciliates [56,85]. In our study, the species diversity of ciliates was higher in treatment ×4N than in the control sample.
Ciliate abundance was highest in spring and summer. Similar observations were reported by Gilbert et al. (1998) and by Lukic et al. (2022), who showed the highest abundance of ciliates in spring and summer in the aquatic environment [35,86]. According to the literature, ciliates are sensitive to changes in environmental conditions due to their thin cell membrane [87]. For this reason, their potential reaction time to fluctuations in environmental parameters is short [85]. In addition, ciliates have the ability to rapidly adapt to variable environmental conditions due to their capacity for autotrophy or heterotrophy [88]. In our study, the abundance of mixotrophic ciliates was highest in autumn and lowest in spring. Similar patterns were observed by Weisse et al. (2016), who also showed the highest abundance of this group in autumn [89].
Ciliate abundance was markedly lower in the traps than in the water. Higher abundance was noted in the water than in the traps in treatments ×2N and ×4N in comparison with the control. The development of this community of microorganisms was also favoured by the higher abundance of bacteria in the traps, which may have been a potential food base for them. Sirova (2018) showed that ciliates present in trap fluid significantly influenced the abundance of bacteria, especially in young traps. An increase in fertility positively influences the abundance of ciliates, unfortunately reducing their diversity. Płachno et al. (2012) reported a small number of ciliate taxa in traps. In our study, as well, the species diversity of ciliates was much lower in the traps than in the aquatic environment [60]

4.4. Effect of Biogenic Compounds on Small Metazoa

Among small metazoa, rotifers were clearly dominant. Their abundance increased with the enrichment of the habitat with biogenic compounds. Higher habitat fertility was conducive to an increase in the abundance of bacteria and heterotrophic flagellates, which are a food source for this group of organisms. This is confirmed by the correlation coefficients between these groups of organisms. In treatments ×2N and ×4N, the genus Lecane was dominant in the water and the class Bdelloidea in the traps. Arndt (1993) reported that rotifers of the genus Lecane are present in fertile environments [90]. In addition, the highest abundance of Lecane was noted in summer. The literature indicates that in water bodies with a higher temperature, the abundance of rotifers of this genus was higher than in water bodies in the temperate climate zone [91].
Sirova et al. (2018) reported that the inside of the trap is characterized by variable oxygen conditions and very low pH. This can significantly limit the occurrence of small metazoa. We also observed low abundance of small metazoa in the traps. The low abundance was accompanied by a lower oxygen concentration in treatments ×2N and ×4N in comparison to the control treatment.
The dominance structure of crustaceans did not undergo dynamic changes—mainly Ceriodaphnia was dominant, and the increase in the concentration of biogenic compounds in the environment did not significantly influence the functioning of crustaceans. It should be noted, however, that low abundance of this group may positively affect the abundance of rotifers by decreasing the risk of predation by crustaceans [92]. Jeppesen et al. (2011) showed that an increase in habitat fertility negatively affects the functioning of crustaceans [93]. Mieczan et al. (2015) showed an increase in the abundance of rotifers and a decrease in the abundance of crustaceans following treatments causing an increase in the fertility of peatland ecosystems.

4.5. Effect of Biogenic Substances on Food Web Structure

The food web significantly influences the functioning of peatland ecosystems [94]. The literature data indicate that the productivity of the ecosystem declines when the biodiversity of microorganisms decreases [95]. In the water, the most significant correlations were shown between bacteria and protozoa (testate amoebae and ciliates) and between bacteria and heterotrophic flagellates, while the most significant correlation in the traps was between bacteria and ciliates. Thus, it can be concluded that it was mainly protozoa that controlled the abundance of bacterial communities. Testate amoebae in particular can control the abundance of bacteria and flagellates in peatland ecosystems [96]. Gilbert et al. (2003) showed that the food preferences of these protozoa may undergo changes depending on the time of year and the level of biogenic compounds in the environment. Mieczan et al. (2015) showed a significant effect of ciliates on other groups of microorganisms.
Ciliates can function as consumers of bacteria and flagellates and can also provide a food base for small metazoa [89]. In addition, they can feed on other ciliates. Ciliates can also provide a food base for organisms at higher trophic levels, such as rotifers [97,98,99]. Most likely, due to the relatively low abundance of rotifers and crustaceans, ciliates were not subject to significant predation pressure, which may explain their high abundance in the experimental treatments.

5. Conclusions

The microbiome of the traps was shown to reflect the trophic status of the habitat analysed in this study. As the concentration of biogenic compounds increased, the abundance of microorganisms increased as well, and it was markedly higher and more dynamic in the water than in the traps. At the same time, increased habitat fertility limits trap formation and thereby contributes to a decrease in the biological diversity of the microbiome of Utricularia vulgaris.
An increase in the concentration of nitrogen compounds in the environment causes changes not only in the quantitative composition but also in the species composition of these organisms and the strength of their trophic relationships. Increased fertility and temperature are probably key factors influencing the taxonomic diversity of microorganisms and the functioning of the microbiome.
The present analysis significantly contributes to knowledge of the effect of peatland eutrophication on the microbiome of carnivorous plants. Future analyses should also focus on the effect of temperature on the functioning of microbiome–carnivorous plant relationships. This is particularly important in view of intensifying global climate change and the extreme sensitivity of peatland ecosystems to these changes.

Author Contributions

Conceptualization, T.M. and A.B.; Methodology, T.M. and A.B.; software, T.M. and A.B.; validation, T.M. and A.B.; Formal analysis, T.M. and A.B.; writing—original draft preparation, A.B. and T.M.; writing—review and editing, T.M. All authors have read and agreed to the published version of the manuscript.

Funding

This research received no external funding.

Institutional Review Board Statement

Not applicable.

Informed Consent Statement

Not applicable.

Data Availability Statement

Data are contained within the article.

Conflicts of Interest

The authors declare no conflict of interest.

References

  1. Ahmad, S.; Liu, H.; Günther, A.; Couwenberg, J.; Lennartz, B. Long-term rewetting of degraded peatlands restores hydrological buffer function. Sci. Total. Environ. 2020, 749, 141571. [Google Scholar] [CrossRef] [PubMed]
  2. Jiroušek, M.; Poulíčková, A.; Kintrová, K.; Opravilová, V.; Hájková, P.; Rybníček, K.; Kočí, M.; Bergová, K.; Hnilica, R.; Mikulášková, E.; et al. Long-term and contemporary environmental conditions as determinants of the species composition of bog organisms. Freshw. Biol. 2013, 58, 2196–2207. [Google Scholar] [CrossRef]
  3. Jurasinski, G.; Ahmad, S.; Anadon-Rosell, A.; Berendt, J.; Beyer, F.; Bill, R.; Blume-Werry, G.; Couwenberg, J.; Günther, A.; Joosten, H.; et al. From understanding to sustainable use of peatlands: The Wetscapes approach. Soil Syst. 2020, 4, 14. [Google Scholar] [CrossRef]
  4. Bragazza, L.; Buttler, A.; Habermacher, J.; Brancaleoni, L.; Gerdol, R.; Fritze, H.; Hanajík, P.; Laiho, R.; Johnson, D. High nitrogen deposition alters the decomposition of bog plant litter and reduces carbon accumulation. Glob. Chang. Biol. 2012, 18, 1163–1172. [Google Scholar] [CrossRef]
  5. Temmink, R.J.M.; Lamers, L.P.M.; Angelini, C.; Bouma, T.J.; Fritz, C.; van de Koppel, J.; Lexmond, R.; Rietkerk, M.; Silliman, B.R.; Joosten, H.; et al. Recovering wetland biogeomorphic feedback to restore the world’s biotic carbon hotspots. Science 2022, 6, 376–1479. [Google Scholar] [CrossRef]
  6. Basińska, A.M.; Reczuga, M.K.; Gąbka, M.; Stróżecki, M.; Luców, D.; Samson, M.; Urbaniak, M.; Leśny, J.; Chojnicki, B.H.; Gilbert, D.; et al. Experimental warming, and precipitation reduction affect the biomass of microbial communities in Sphagnum peatland. Ecol. Indic. 2020, 112, 106059. [Google Scholar] [CrossRef]
  7. Alexander, T.J.; Vonlanthen, P.; Seehausen, O. Does eutrophication-driven evolution change aquatic ecosystems? Philos. Trans. R. Soc. B 2017, 19, 372–1712. [Google Scholar] [CrossRef]
  8. García-Girón, J.; Bini, L.M.; Heino, J. Shortfalls in our understanding of the causes and consequences of functional and phylogenetic variation of freshwater communities across continents. Biol. Conserv. 2023, 282, 110082. [Google Scholar] [CrossRef]
  9. Le-Bagousse-Pinguet, J.; Soliveres, S.; Gross, N.; Maestre, F.T. Phylogenetic, functional, and taxonomic richness have both positive and negative effects on ecosystem multifunctionality. Biol. Sci. 2019, 116, 8419–8424. [Google Scholar] [CrossRef]
  10. Le Moal, M.; Gascuel-Odoux, C.; Ménesguen, A.; Souchon, Y.; Étrillard, C.; Levain, A.; Moatar, F.; Pannard, A.; Souchu, P.; Lefebvre, A.; et al. Eutrophication: A new wine in an old bottle? Sci. Total Environ. 2019, 651, 1–11. [Google Scholar] [CrossRef]
  11. Heino, J.; Alahuhta, J.; Bini, L.M.; Cai, Y.; Heiskanen, A.S.; Hellsten, S.; Kortelainen, P.; Kotamäki, N.; Tolonen, K.; Vihervaara, P.; et al. Lakes in the era of global change: Moving beyond single-lake thinking in maintaining biodiversity and ecosystem services. Biol. Rev. 2021, 96, 89–106. [Google Scholar] [CrossRef]
  12. Mondragón-Camarillo, L.; Zaragoza, S.R. Food Webs. Plankton Communities 2022, 1, 1–24. [Google Scholar]
  13. Rolls, R.; Deane, D.; Johanson, S.; Heino, J.; Anderson, M.; Ellingsen, K. Biotic homogenisation and differentiation as directional change in beta diversity: Synthesising driver–response relationships to develop conceptual models across ecosystems. Biol. Rev. 2023, 98, 1388–1423. [Google Scholar] [CrossRef] [PubMed]
  14. Van Diggelen, R.; Middleton, B.; Bakker, J.; Grootjans, A.; Wassen, M. Fens and floodplains of the temperate zone: Present status, threats, conservation and restoration. Appl. Veg. Sci. 2006, 9, 157–162. [Google Scholar] [CrossRef]
  15. Schindler, D.W. Recent advances in the understanding and management of eutrophication. Limnol. Oceanogr. 2006, 51, 356–363. [Google Scholar] [CrossRef]
  16. Zak, D.; Wagner, C.; Payer, B.; Augustin, J.; Gelbrecht, J. Phosphorus mobilization in rewetted fens: The effect of altered peat properties and implications for their restoration. Ecol. Appl. 2010, 20, 1336–1349. [Google Scholar] [CrossRef] [PubMed]
  17. Walton, C.R.; Zak, D.; Audet, J.; Petersen, R.J.; Lange, J.; Oehmke, C.; Wichtmann, W.; Kreyling, J.; Grygoruk, M.; Jabłońska, E.; et al. Wetland buffer zones for nitrogen and phosphorus retention: Impacts of soil type, hydrology and vegetation. Sci. Total Environ. 2020, 727, 138709. [Google Scholar] [CrossRef]
  18. Giang, T.; Hieu, X.; Szmutzera, T.; Scholz, U.; Pecinka, A.; Schuberta, I. Metatranscriptome analysis reveals host-microbiome interactions in traps of carnivorous Genlisea species. Front. Microbiol. 2015, 6, 526. [Google Scholar]
  19. Płachno, B.J.; Adamec, L.; Kaińska, I. Relationship between trap anatomy and function in Australian carnivorous bladderworts (Utricularia) of the subgenus Polypompholyx. Aquat. Bot. 2015, 120, 290–296. [Google Scholar] [CrossRef]
  20. Adamec, L. Mineral nutrition of carnivorous plants: A review. Bot. Rev. 1997, 63, 273–299. [Google Scholar] [CrossRef]
  21. Adamec, L. Oxygen concentrations inside the traps of the carnivorous plants Utricularia and Genlisea (Lentibulariaceae). Ann. Bot. 2007, 100, 849–856. [Google Scholar] [CrossRef]
  22. Grodnitskaya, I.; Karpenko, L.V.; Knorre, A.; Syrtsov, S.N. Microbial activity of peat soils of boggy larch forests and bogs in the permafrost zone of central Evenkia. Eurasian Soil Sci. 2013, 46, 61–73. [Google Scholar] [CrossRef]
  23. Sirovà, D.; Bàrta, J.; Šimek, K.; Posch, T.; Pech, J.; Stone, J.; Borovec, J.; Adamec, L.; Vrba, J. Hunters or farmers? Microbiome characteristics help elucidate the diet composition in an aquatic carnivorous plant. Microbiome 2018, 7, 225. [Google Scholar] [CrossRef]
  24. Donohue, I.; Jackson, A.L.; Pusch, M.T.; Irvine, K. Nutrient enrichment homogenizes lake benthic assemblages at local and regional scales. Ecology 2009, 90, 3470–3477. [Google Scholar] [CrossRef] [PubMed]
  25. Cook, S.C.; Housley, L.; Back, J.A.; King, R.S. Freshwater eutrophication drives sharp reductions in temporal beta diversity. Ecology 2018, 99, 47–56. [Google Scholar] [CrossRef]
  26. Zhang, H.; Väliranta, M.; Piilo, S.; Amesbury, M.J.; Aquino-López, M.A.; Roland, T.P.; Salminen-Paatero, S.; Paatero, J.; Lohila, A.; Tuittila, E.S. Decreased carbon accumulation feedback driven by climate-induced drying of two southern boreal bogs over recent centuries. Glob. Chang. Biol. 2020, 26, 2435–2448. [Google Scholar] [CrossRef]
  27. Geng, M.D.; Zhang, W.; Hu, T.; Wang, R.; Cheng, X.; Wang, J. Eutrophication causes microbial community homogenization via modulating generalist species. Water Res. 2022, 210, 118003. [Google Scholar] [CrossRef] [PubMed]
  28. Gong, J.; Song, W.; Warren, A. Periphytic ciliate colonization: Annual cycle and responses to environmental conditions. Aquat. Microb. Ecol. 2005, 39, 159–170. [Google Scholar] [CrossRef]
  29. Krasuska, U.; Glinka, A.; Gniazdowska, A. Carnivorous plant menu. KOSMOS-Probl. Nauk Biol. 2012, 61, 635–646. [Google Scholar]
  30. Tran, T.D.; Cao, H.X.; Jovtchev, G.; Novák, P.; Giang, T.; Vu, H.; Macas, J.; Schubert, J.; Fuchs, J. Chromatin organization and cytological features of carnivorous Genlisea species with large genome size differences. Front. Plant. Sci. 2015, 6, 151809. [Google Scholar] [CrossRef]
  31. Friday, L.E.; Quarmby, C. Uptake and translocation of prey-derived 15N and 32P in Utricularia vulgaris L. New Phytol. 1994, 126, 273–281. [Google Scholar] [CrossRef]
  32. Porter, K.G.; Feig, Y.S. The use of DAPI for identification and counting aquatic microflora. Limnol. Oceanogr. 1980, 25, 943–984. [Google Scholar] [CrossRef]
  33. Caron, D.A. Technique for enumeration of heterotrophic and phototrophic nanoplankton, using epifluorescence microscopy and comparison with other procedures. Appl. Environ. Microbiol. 1983, 46, 491–498. [Google Scholar] [CrossRef] [PubMed]
  34. Utermöhl, H. Zur Vervollkommnung der quantitativen Phytoplankton-Methodik. Mitt. Internat. Verein. Limnol. 1958, 9, 1–38. [Google Scholar] [CrossRef]
  35. Gilbert, D.; Amblard, C.; Bourdier, G.; Francez, A.J. The microbial loop at the surface of a peatland: Structure, functioning and impact of nutrients inputs. Microb. Ecol. 1998, 35, 89–93. [Google Scholar] [CrossRef] [PubMed]
  36. Bottrell, H.H.; Duncan, A.; Gliwicz, Z.M.; Grygierek, E.; Herzig, A.; Hillbricht-Ilkowska, A.; Kurasawa, H.; Larsson, P.; Weglenska, T. A reviewer of some problems in zooplankton production studies. IBP 1976, 24, 419–456. [Google Scholar]
  37. Golterman, H.L. Methods for Chemical Analysis of Fresh Waters; Blackwell Scientific: Oxford, UK; Edinburgh, UK, 1969; p. 172. [Google Scholar]
  38. Lundin, L.; Nilsson, T.; Jordan, S.; Lode, E.; Strömgren, M. Impacts of rewetting on peat, hydrology, and water chemical composition over 15 years in two finished peat extraction areas in Sweden. Wetl. Ecol. Manag. 2017, 25, 405–419. [Google Scholar] [CrossRef]
  39. Mieczan, T.; Adamczuk, M.; Pawlik-Skowrońska, B.; Toporowska, M. Eutrophication of peatbogs: Consequences of P and N enrichment for microbial and metazoan communities in mesocosm experiments. Aqua. Microb. Ecol. 2015, 74, 121–141. [Google Scholar] [CrossRef]
  40. Diaz, R.J.; Rosenberg, R. Spreading dead zones and consequences for marine ecosystems. Science 2008, 321, 926–929. [Google Scholar] [CrossRef]
  41. Bragazza, L.; Freeman, C.; Jones, T.; Rydin, H.; Limpens, J.; Fenner, N.; Ellis, T.; Gerdol, R.; Hàjek, M.; Hàjek, T.; et al. Atmospheric nitrogen deposition promotes carbon loss from peat bogs. Proc. Natl. Acad. Sci. USA 2006, 103, 19386–19389. [Google Scholar] [CrossRef]
  42. Bubier, J.; Moore, T.M.; Bledzki, L. Effects of nutrient addition on vegetation and carbon cycling in an ombrothropic bog. Glob. Chang. Biol. 2007, 13, 1167–1186. [Google Scholar] [CrossRef]
  43. Lin, H.Y.; Yeh, W.Y.; Tsai, S.F.; Chiang, K.P.; Lin, J.Y.; Tsao, C.C.; Lin, H.J. Biological protective effects against vibrio infections in grouper larvae using the Strombidium sp. NTOU1, a marine ciliate amenable for scaled-up culture and with an excellent bacteriovorous ability. Front. Mar. Sci. 2020, 7, 373. [Google Scholar] [CrossRef]
  44. Wu, Y.; Blodau, C.; Moore, T.R.; Bubier, J.; Juutinen, S.T.; Larmola, T. Effects of experimental nitrogen deposition on peatland carbon pools and fluxes: A modelling analysis. Biogeosciences 2015, 12, 79–101. [Google Scholar] [CrossRef]
  45. Sirova, D.; Borovec, J.; Picek, T.; Adamec, L.; Nedbalova, L.; Vrba, J. Ecological implications of organic carbon dynamics in the traps of aquatic carnivorous Utricularia plants. Funct. Plant Biol. 2011, 38, 583–593. [Google Scholar] [CrossRef] [PubMed]
  46. Peltoniemi, K.; Fritze, H.; Laiho, R. Response of fungal and actinobacterial communities to water-level drawdown in boreal peatland sites. Soil Biol. Biochem. 2009, 41, 1902–1914. [Google Scholar] [CrossRef]
  47. Kim, S.Y.; Lee, S.H.; Freeman, C.; Fenner, N.; Kang, H. Comparative analysis of soil microbial communities and their responses to the short-term drought in bog, fen, and riparian wetlands. Soil Biol. Biochem. 2008, 40, 2874–2880. [Google Scholar] [CrossRef]
  48. Mitchell, E.A.D.; Gilbert, D.; Amblard, C.; Grosverinier, P.; Gobat, J.M. Structure of microbial communities in Sphagnum peatlands and effect of atmospheric carbon dioxide enrichment. Microb. Ecol. 2003, 46, 187–199. [Google Scholar] [CrossRef] [PubMed]
  49. Chróst, J.R.; Siuda, I. Microbial production, utilization, and enzymatic degradation of organic matter in the upper trophogenic layer in the pelagial zone of lakes along a eutrophication gradient. Limnol. Oceanogr. 2006, 51, 749–762. [Google Scholar] [CrossRef]
  50. Lin, X.; Green, S.; Tfaily, M.M.; Prakash, O.; Konstantinidis, K.T.; Corbett, J.E.; Chanton, J.P.; Cooper, W.T.; Kostka, J.E. Microbial community structure and activity linked to contrasting biogeochemical gradients in bog and fen environments of the Glacial Lake Agassiz Peatland. Appl. Environ. Microbiol. 2012, 78, 7023–7031. [Google Scholar] [CrossRef]
  51. Larmola, T.; Tuittila, E.S.; Tiirola, M.; Nykanen, H.; Martikainen, M.J.; Yrjälä, K.; Tuomivirta, T.; Fritze, H. The role of Sphagnum mosses in the methane cycling of a boreal mire. Ecology 2010, 91, 2356–2365. [Google Scholar] [CrossRef]
  52. Chróst, R.J.; Adamczewski, T.; Kalinowska, K.; Skowrońska, A. Abundance and structure of microbial loop components (bacteria and protists) in lakes of different trophic status. J. Microbiol. Biotechnol. 2009, 19, 858–868. [Google Scholar] [CrossRef]
  53. Siragusa, A.J.; Swenson, J.E.; Casamatta, D.A. Culturable bacteria present in the fluid of the hooded-pitcher plant Sarracenia minor based on 16S rDNA gene sequence data. Microb. Ecol. 2007, 54, 324–331. [Google Scholar] [CrossRef] [PubMed]
  54. Richards, J.H. Bladder function in Utricularia purpurea (Lentibulariaceae): Is carnivory important? Am. J. Bot. 2001, 88, 170–176. [Google Scholar] [CrossRef]
  55. Sirová, D.; Adamec, L.; Vrba, J. Enzymatic activities in traps of four aquatic species of the carnivorous genus Utricularia. New Phytol. 2003, 159, 669–675. [Google Scholar] [CrossRef]
  56. Buosi, P.R.B.; Pauleto, G.M.; Lansac-Toha, F.A.; Velho, L.F.M. Ciliate community associated with aquatic macrophyte roots: Effects of nutrient enrichment on the community composition and species richness. Eur. J. Protistol. 2011, 47, 86–102. [Google Scholar] [CrossRef] [PubMed]
  57. Sirova, D.; Borovec, J.; Černá, B.; Rejmánková, E.; Adamec, L. Microbial community development in the traps of aquatic Utricularia species. Aquat. Bot. 2009, 90, 129–136. [Google Scholar] [CrossRef]
  58. Auer, B.; Arndt, H. Taxonomic composition, and biomass of heterotrophic flagellates in relation to lake trophy and season. Freshw. Biol. 2001, 46, 959–972. [Google Scholar] [CrossRef]
  59. Davidson, E.D.; Janssens, I.A. Temperature sensitivity of soil C decomposition and feedback to climate change. Nature 2006, 440, 165–173. [Google Scholar] [CrossRef]
  60. Płachno, B.J.; Łukaszek, M.; Wolowski, K.; Adamec, M.; Stolarczyk, P. Aging of Utricularia traps and variability of microorganisms associated with that microhabita. Aquat. Bot. 2012, 97, 101–110. [Google Scholar] [CrossRef]
  61. Mieczan, T.; Bartkowska, A. The effect of experimentally simulated climate warming on the microbiome of carnivorous plants—A microcosm experiment. Glob. Ecol. Conserv. 2022, 34, e02040. [Google Scholar] [CrossRef]
  62. Adamec, L. Soil fertilization enhances growth of the carnivorous plant Genlisea violacea. Biologia 2008, 63, 201–203. [Google Scholar] [CrossRef]
  63. Koenig, I.; Feldmeyer-Christe, E.; Mitchell, E.A.D. Comparative ecology of vascular plant, bryophyte, and testate amoeba communities in four Sphagnum peatlands along an altitudinal gradient in Switzerland. Ecol. Indic. 2015, 54, 48–59. [Google Scholar] [CrossRef]
  64. Marcisz, K.; Marcisz, D.; Colombaroli, V.E.; Jassey, W.; Tinner, P.; Kołaczek, M.; Gałka, M.; Karpińska-Kołaczek, M.; Słowiński, M.; Lamentowicz, M. A novel testate amoebae trait-based approach to infer environmental disturbance in Sphagnum peatlands. Sci. Rep. 2016, 6, 33907. [Google Scholar] [CrossRef] [PubMed]
  65. Lamentowicz, M.; Gałka, M.; Marcisz, K.; Słowiński, M.; Kajukało-Drygalska, K.; Dayras, M.D.; Jassey, V.E.J. Unveiling tipping points in long-term ecological records from Sphagnum—Dominated peatlands. Biol. Lett. 2019, 15, 20190043. [Google Scholar]
  66. Carballeira, R.; Pontevedra-Pombala, X. Diversity of Testate Amoebae as an Indicator of the Conservation Status of Peatlands in Southwest Europe. Ecol. Biogeogr. Evol. Biol. Peatl. 2021, 13, 269. [Google Scholar] [CrossRef]
  67. Jassey, V.E.; Shimano, S.; Dupuy, C.; Toussaint, M.L.; Gilbert, D. Characterizing the feeding habits on the testate amoebae Hyalosphenia papilio and Nebela tincta along narrow “fen-bog” gradient using digestive vacuole content and 13C and 15N isotopic analyses. Protist 2011, 163, 451–464. [Google Scholar] [CrossRef] [PubMed]
  68. Mazei, Y.; Tsyganov, A.N.; Bubnova, O.A. Structure of community of testate amoebae in a sphagnum dominated bog in upper sura flow (Middle Volga Territory). Biol. Bull. 2007, 4, 462–474. [Google Scholar] [CrossRef]
  69. Mitchell, E.A.D.; Charman, D.J.; Warner, B.G. Testate amoebae analysis in ecological and paleoecological studies of wetlands: Past, present and future. Biodivers. Conserv. 2008, 17, 2115–2137. [Google Scholar] [CrossRef]
  70. Lamentowicz, M.; Kajukało-Drygalska, K.; Kołaczek, P.; Jassey, V.E.J.; Gąbka, M.; Karpińska-Kołaczek, M. Testate amoebae taxonomy and trait diversity are coupled along an openness and wetness gradient in pine-dominated Baltic bogs. Eur. J. Protistol. 2020, 73, 125674. [Google Scholar] [CrossRef]
  71. Davis, S.R.; Wilkinson, D.M. The conservation management value of testate amoebae as ‘restoration’ indicators: Speculations based on two damaged raised mires in northwest England. Holocene 2004, 14, 135–143. [Google Scholar] [CrossRef]
  72. Lamentowicz, M.; Mitchell, E.A.D. Testate Amoebae as Ecological and Palaeohydrological Indicators in Peatlands—The Polish Experience; Taylor & Francis Group: London, UK, 2007; pp. 85–90. [Google Scholar]
  73. Marcisz, K.; Jassey, V.E.J.; Kosakyan, A.; Krashevska, V.; Lahr, D.J.G.; Lara, E.; Lamentowicz, M.; Macumber, A.; Mazei, Y.; Mitchell, E.A.D.; et al. Testate amoebae functional traits and their use in paleoecology. Front. Ecol. Evol. 2020, 8, 575–966. [Google Scholar] [CrossRef]
  74. Warner, B.; Asada, T.; Quinn, N. Seasonal influences on the ecology of testate amoebae (Protozoa) in a small Sphagnum peatland in Southern Ontario, Canada. Microb. Ecol. 2007, 54, 91–100. [Google Scholar] [CrossRef] [PubMed]
  75. Jassey, V.E.; Signarbieux, C.; Hättenschwiler, S.; Bragazza, L.; Buttler, A.; Delarue, F.; Fournier, B.; Gilbert, D.; Laggoun-Défarge, F.; Lara, E.; et al. An unexpected role for mixotrophs in the response of peatland carbon cycling to climate warming. Sci. Rep. 2015, 5, 16931. [Google Scholar] [CrossRef] [PubMed]
  76. Nicolau, A.; Martins, M.J.; Mota, M.; Lima, N. Effect of copper in the protistan community of activated sludge. Chemosphere 2005, 58, 605–614. [Google Scholar] [CrossRef]
  77. Payne, R.J. Can testate amoeba-based palaeohydrology be extended to fens? J. Quat. Sci. 2011, 26, 15–27. [Google Scholar] [CrossRef]
  78. Ravindran, C.; Irudayarajan, L.; Raveendran, H.P. Possible beneficial interactions of ciliated protozoans with coral health and resilience. Appl. Environ. Microbiol. 2023, 89, 10. [Google Scholar] [CrossRef] [PubMed]
  79. Kexin, Z.; Muqi, X.; Biao, L.; Hong, C. Characteristics of microfauna and their relationships with the performance of an activated sludge plant in China. J. Environ. Sci. 2007, 20, 482–486. [Google Scholar]
  80. Nguyen-Viet, H.; Gilbert, D.; Mitchell, E.A.D.; Badot, P.M.; Bernard, N. Effects of experimental lead pollution on the microbial communities associated with Sphagnum fallax (Bryophyta). Microb. Ecol. 2007, 54, 232–241. [Google Scholar] [CrossRef]
  81. Wilkinson, D.M.; Mitchell, E.A.D. Testate amoebae and nutrient cycling with particular reference to soils. Geomicrobiol. J. 2010, 27, 520–533. [Google Scholar] [CrossRef]
  82. Mieczan, T.; Bielańska-Grajner, I.; Tarkowska-Kukuryk, M. Hydrochemical and microbiological distinction and function of ombrotrophic peatland lagg as ecotone between Sphagnum peatland and forest catchment (Poleski National Park, eastern Poland). Ann. Limnol.-Int. J. Limnol. 2012, 48, 323–336. [Google Scholar] [CrossRef]
  83. Zingel, P.; Huitu, E.; Makela, S.; Arvola, L. The abundance and diversity of planktonic ciliates in 12 boreal lakes of varying trophic state. Arch. Hydrobiol. 2002, 155, 315–333. [Google Scholar] [CrossRef]
  84. Mieczan, T.; Tarkowska-Kukuryk, M.; Adamczuk, M.; Pęczuła, W.; Demetraki-Paleolog, A.; Niedźwiecki, M. Research of different types of peatbogs: Relationships of biocenosis structures and physico-chemical parameters. Pol. J. Environ. Stud. 2015, 1, 191–198. [Google Scholar]
  85. Andersen, R.; Wells, C.; Macrae, M.; Price, J. Nutrient mineralization and microbial functional diversity in a restored bog approach natural conditions 10 years post restoration. Soil Biol. Biochem. 2013, 64, 37–47. [Google Scholar] [CrossRef]
  86. Lukić, D.; Limberger, R.; Agatha, S.; Montagnes, D.J.; Weisse, T. Thermal performance of planktonic ciliates differs between marine and freshwaters: A case study providing guidance for climate change studies Scientific Significance Statement. Limnol. Oceanogr. 2022, 7, 520–526. [Google Scholar] [CrossRef]
  87. Andersen, R.; Chapman, S.J.; Artz, R.R.E. Microbial communities in natural and disturbed peatlands:a review. Soil Biol. Biochem. 2013, 57, 979–994. [Google Scholar] [CrossRef]
  88. Šimek, K.; Pitsch, G.; Salcher, M.M.; Sirová, D.; Shabarova, T.; Adamec, L. Ecological traits of the algae-bearing Tetrahymena utriculariae (Ciliophora) from traps of the aquatic carnivorous plant Utricularia reflexa. J. Eukaryot. Microbiol. 2017, 64, 336–348. [Google Scholar] [CrossRef] [PubMed]
  89. Weisse, T.; Anderson, R.; Arndt, H.; Calbet, A.; Hansen, P.J.; Montagnes, D.J.S. Functional ecology of aquatic phagotrophic protists—Concepts, limitations, and perspectives. Eur. J. Protistol. 2016, 55, 50–74. [Google Scholar] [CrossRef] [PubMed]
  90. Arndt, H. Rotifers as predators on components of the microbial web (bacteria, heterotrophic flagellates, ciliates)—A review. Hydrobiologia 1993, 255, 231–246. [Google Scholar] [CrossRef]
  91. Kim, S.; Kim, J.; Joo, J.; Choi, J. Response of the rotifer community to human-induced changes in the trophic state of a reservoir. Oceanol. Hydrobiol. Stud. 2020, 49, 329–344. [Google Scholar] [CrossRef]
  92. Płachno, B.J.; Faber, J.; Jankun, A. Cuticular discontinuities in glandular hairs of Genlisea St.-Hil. in relation to their functions. Acta Bot. Gall. 2005, 152, 125–130. [Google Scholar] [CrossRef]
  93. Jeppesen, E.; Nõges, P.; Davidson, T.A.; Haberman, J.; Nõges, T.; Blank, K.; Lauridsen, T.L.; Søndergaard, M.; Sayer, C.; Laugaste, R.; et al. Zooplankton as indicators in lakes:a scientificbased plea for including zooplankton in the ecological quality assessment according to the European Water Framework Directive (WFD). Hydrobiologia 2011, 676, 279–297. [Google Scholar] [CrossRef]
  94. Delgado-Baquerizo, M.; Reich, B.; Trivedi, C.; Eldrige, D.; Abades, S.; Alfaro, F.; Bastide, F.; Berhe, A.; Cutler, N.; Gallardo, A.; et al. Multiple elements of soil biodiversity drive ecosystem functions across biomes. Nat. Ecol. Evol. 2020, 4, 210–220. [Google Scholar] [CrossRef] [PubMed]
  95. Sauvadet, M.; Chauvat, M.; Cluzeau, D.; Maron, P.; Villenave, C.; Bertrand, I. The dynamics of soil micro-food web structure and functions vary according to litter quality. Soil Biol. Biochem. 2016, 95, 262–274. [Google Scholar] [CrossRef]
  96. Jassey, V.E.; Meyer, C.; Dupuy, C.; Bernard, N.; Mitchell, E.A.D.; Toussaint, M.L.; Metian, M.; Chatelain, A.P.; Gilbert, D. To what extent do food preferences explain the trophic position of heterotrophic and mixotrophic microbial consumers in Sphagnum peatland? Microb. Ecol. 2013, 66, 571–580. [Google Scholar] [CrossRef] [PubMed]
  97. Dolan, J.R. Doing a Protist Book. Protist 2013, 164, 154–159. [Google Scholar] [CrossRef]
  98. Bielańska-Grajner, I.; Ejsmont-Karabin, J.; Iakovenko, N. Wrotki (Rotifera, Bdelloidea), Fauna Słodkowodna Polski; Uniwersytet Łódzki: Łódź, Poland, 2013; p. 153. [Google Scholar]
  99. Reczuga, M.K.; Lamentowicz, M.; Mulot, M.; Mitchell, E.A.D.; Buttler, A.; Chojnicki, B.; Słowiński, M.; Binet, P.; Chiapusio, G.; Gilbert, D.; et al. Predator-prey mass ratio drives microbial activity and its response to drought in Sphagnum peatlands. Ecol. Evol. 2018, 8, 5752–5764. [Google Scholar] [CrossRef]
Figure 1. Location of the study area.
Water 16 01046 g001
Figure 2. Abundance of bacteria in the water and traps in each experimental treatment.
Water 16 01046 g002
Figure 3. Biomass of bacteria in the water and traps in each experimental treatment.
Water 16 01046 g003
Figure 4. Abundance of heterotrophic flagellates in the water and in the traps in each experimental treatment.
Water 16 01046 g004
Figure 5. Biomass of flagellates in the water and in the traps in each experimental treatment.
Water 16 01046 g005
Figure 6. Abundance of testate amoebae in the water and in the traps in each experimental treatment.
Water 16 01046 g006
Figure 7. Abundance of ciliates in the water and in the traps in each experimental treatment.
Water 16 01046 g007
Figure 8. Biomass of testate amoebae in the water and in the traps in each experimental treatment.
Water 16 01046 g008
Figure 9. Biomass of ciliates in the water and in the traps in each experimental treatment.
Water 16 01046 g009
Figure 10. Abundance of rotifers in the water and in the traps in each experimental treatment.
Water 16 01046 g010
Figure 11. Abundance of crustaceans in the water in each experimental treatment.
Water 16 01046 g011
Figure 12. Biomass of rotifers in the water and in the traps in each experimental treatment.
Water 16 01046 g012
Figure 13. Biomass of crustaceans in the water in each experimental treatment.
Water 16 01046 g013
Figure 14. PCA presenting microbial communities in the experimental treatments: C-control; ×2N-environment enriched with a twofold concentration of nitrogen compounds; ×4N-environment enriched with a fourfold concentration of nitrogen compounds; red circles- groups.
Water 16 01046 g014
Figure 15. Redundancy analysis biplots showing communities of microbes and metazoa and environmental variables; C—control; ×2N—environment enriched with a twofold concentration of nitrogen compounds; ×4N—environment enriched with a fourfold concentration of nitrogen compounds); red arrows - relevant environmental variables.
Water 16 01046 g015
Table 1. Changes in the physical and chemical properties of the water in each experimental treatment. C—control, ×2N—twofold increase in the concentration of nitrogen compounds relative to the control sample, ×4N—fourfold increase in the concentration of nitrogen compounds relative to the control sample.
SpringSummerAutumn
C×2N×4NC×2N×4NC×2N×4N
T (°C)2423.624.824.428.929.724.42626
pH5.46.26.516.066.066.136.136.576.6
Cond. (μS cm−1)29.129.533.33129.830.043133.339.1
O2 (mg L−1)8.097.97.78.297.77.657.667.666.46
O2%9794.292.410193.592.296.192.383
Ntot (mg N L−1)1.2041.3351.8461.2031.4521.5051.3971.4411.440
N-NO3 (mg N L−1)0.0720.3420.3530.1050.2200.2500.1140.1480.198
N-NH4 (mg N L−1)<0.010.010.0120.017<0.010.0220.0250.0270.031
Chl a (μg L−1)37181750802805058252
COD (mg L−1)65.668.570676665676566.5
BOD (mg L−1)4041.542.539.54040.540.53940.5
TOC (mg L−1)30313229.830.230.529.230.531.5
Table 2. Linear correlation coefficients between microorganisms in the water (W) and traps (T) and environmental variables in the experimental treatments; treatments—C (control), ×2N (treatment enriched with a twofold concentration of nitrogen compounds relative to the control), ×4N (treatment enriched with a fourfold concentration of nitrogen compounds relative to the control), SP—spring, SU—summer, AU—autumn.
SPSUAU
O2pHChl-aElectrical ConductivityN-NH4O2pHChl-aElectrical ConductivityN-NH4O2pHChl-aElectrical ConductivityN-NH4
CW0.620.68 0.370.46 0.43 0.39
T0.51 0.56
×2NW0.57 −0.44 0.56 0.42
T 0.220.67−0.43 0.360.39 −0.21 0.21
×4NW 0.5
T −0.24 0.46 −0.69 0.54
Table 3. Linear correlation coefficients between microbiological components in the experimental treatments; B—bacteria, HNF—heterotrophic flagellates, TA—testate amoebae, C—ciliates, Cr—crustaceans, p > 0.05. Treatments: C (control), ×2N (treatment enriched with a twofold concentration of nitrogen compounds relative to the control), ×4N (treatment enriched with a fourfold concentration of nitrogen compounds relative to the control). SP—spring, SU—summer, AU—autumn.
SPSUAU
BHNFTACCrBHNFTACCrBHNFTACCr
CB 0.48
HNF 0.56
TA 0.52 0.640.47 0.43
C0.45 0.57
Cr
×2NB 0.67
HNF 0.78
TA 0.62 0.690.76
C0.48 0.43 0.58
Cr
B 0.69
×4NHNF 0.82
TA0.59
C0.53 0.62 -
Cr
Disclaimer/Publisher’s Note: The statements, opinions and data contained in all publications are solely those of the individual author(s) and contributor(s) and not of MDPI and/or the editor(s). MDPI and/or the editor(s) disclaim responsibility for any injury to people or property resulting from any ideas, methods, instructions or products referred to in the content.

