1. Introduction
In a context of climate change, which includes an enhancement of extreme climatic events (e.g., droughts and floods) and an increasingly rapid degradation of the cryosphere [
1], alpine lakes, whether natural or artificial, represent a strategic asset for the management of the water resource, aimed at satisfying ecological, power, agricultural and tourism needs [
2]. In this framework, still limited attention is paid to high altitude reservoirs, which are particularly vulnerable to the ongoing climatic and environmental changes that could compromise quantity and quality of the water resource. As for water quality, water colour is the parameter that is most intuitively related to it. Human visual perception of “good” or “bad” water quality is corroborated by the physical reaction between electromagnetic radiation and what is contained in the water mass. Based on the specific reflection and absorption properties of water components, and depending on their quantity, the colour of water varies and takes on different hues. Blue waters are easily associated with a high level of clarity and quality. In contrast, greenish waters result from photosynthetic material, such as algae or cyanobacteria, suspended in the water body. Dark waters are waters typically rich in dissolved organic matter [
3], opaque turquoise colours characterise waters rich in glacial sediments [
4], and brownish colours indicate a rapid pulse of solid transport due, for example, to intense rainfall.
The colours assumed by the natural waters of seas and lakes were distinguished into 21 hue classes, ranging from blue to brown, by François Alphonse Forel and Willi Ule in the 1890s [
5,
6]. Since then, oceanographers and limnologists have been using the Forel-Ule (FU) scale as a reference for quantifying water quality during their measurements, comparing the colour perceived by their eyes looking at the water body with the ones standardised in a hand-held FU scale. The spectral properties of the FU classes were described in the works of Wernand, van der Woerd and Novoa [
7,
8], who reproduced the FU classes with homogenous methodologies and converted them into chromaticity coordinates. This technique allows the water colour to be objectively characterized from every spectral measurement of the water, taken with field or satellite radiometers [
9,
10]. In this case, the limitations of the FUI-based classification system are overcome by a more detailed characterization of water colour hues, carried out by expressing water colour through chromaticity variables such as the hue angle, the dominant wavelength or the purity. In fact, multiple hue angles correspond to the same FUI class, and the range of hue angles represented by one FUI class is larger for blue and green shades [
8].
With the advent of ocean and optical satellites, the observation of the colour of water is become accessible, even in the absence of fieldwork activities, increasing the long time series of measurements with unprecedented synoptic and frequency options [
11,
12]. Besides applications to the marine environment, which revealed the first correlations between water colour and water optical parameters [
13], several studies have been conducted on inland waters at the national [
14,
15,
16,
17] and global level [
18]. All these works highlight temporal (either annual or seasonal) variations in the water colour of lakes, and associate the water colour with a certain climate or with geomorphometric conditions. For instance, blue lakes are globally more frequent in places with high monthly precipitations (>55 mm) and low mean summer air temperatures (<19 °C); they are deeper than 3.6 m and present a period of ice cover [
15]. Some New Zealand lakes show a bimodal distribution of water colour, such that it is not possible to identify them in a specific colour class permanently [
14]. This observation suggests a recurrent temporal variability of water colour, which may depend on seasonal cycles. In addition to climatic variables, certain boundary conditions, such as land cover and hydrology of the lake basin or the proximity of anthropogenic activities, are additional factors that influence water colour [
19,
20].
In this work, we want to analyse at a local scale the relationships between water colour variations and climatic conditions in a high-elevated and glaciated mountain basin (upper Orco Valley, Western Italian Alps). Temporal and spatial variations in water colour and lake extent are evaluated using satellite-derived data (i.e., Sentinel-2) over the 2017–2022 period in a cascading system of three reservoirs. The analysis aims to observe changes in the quality and quantity of the water resource in an environment that is sparsely anthropized and typically highly sensitive to climatic variations due to the presence of the cryosphere, using free and readily available data.
2. Study Site
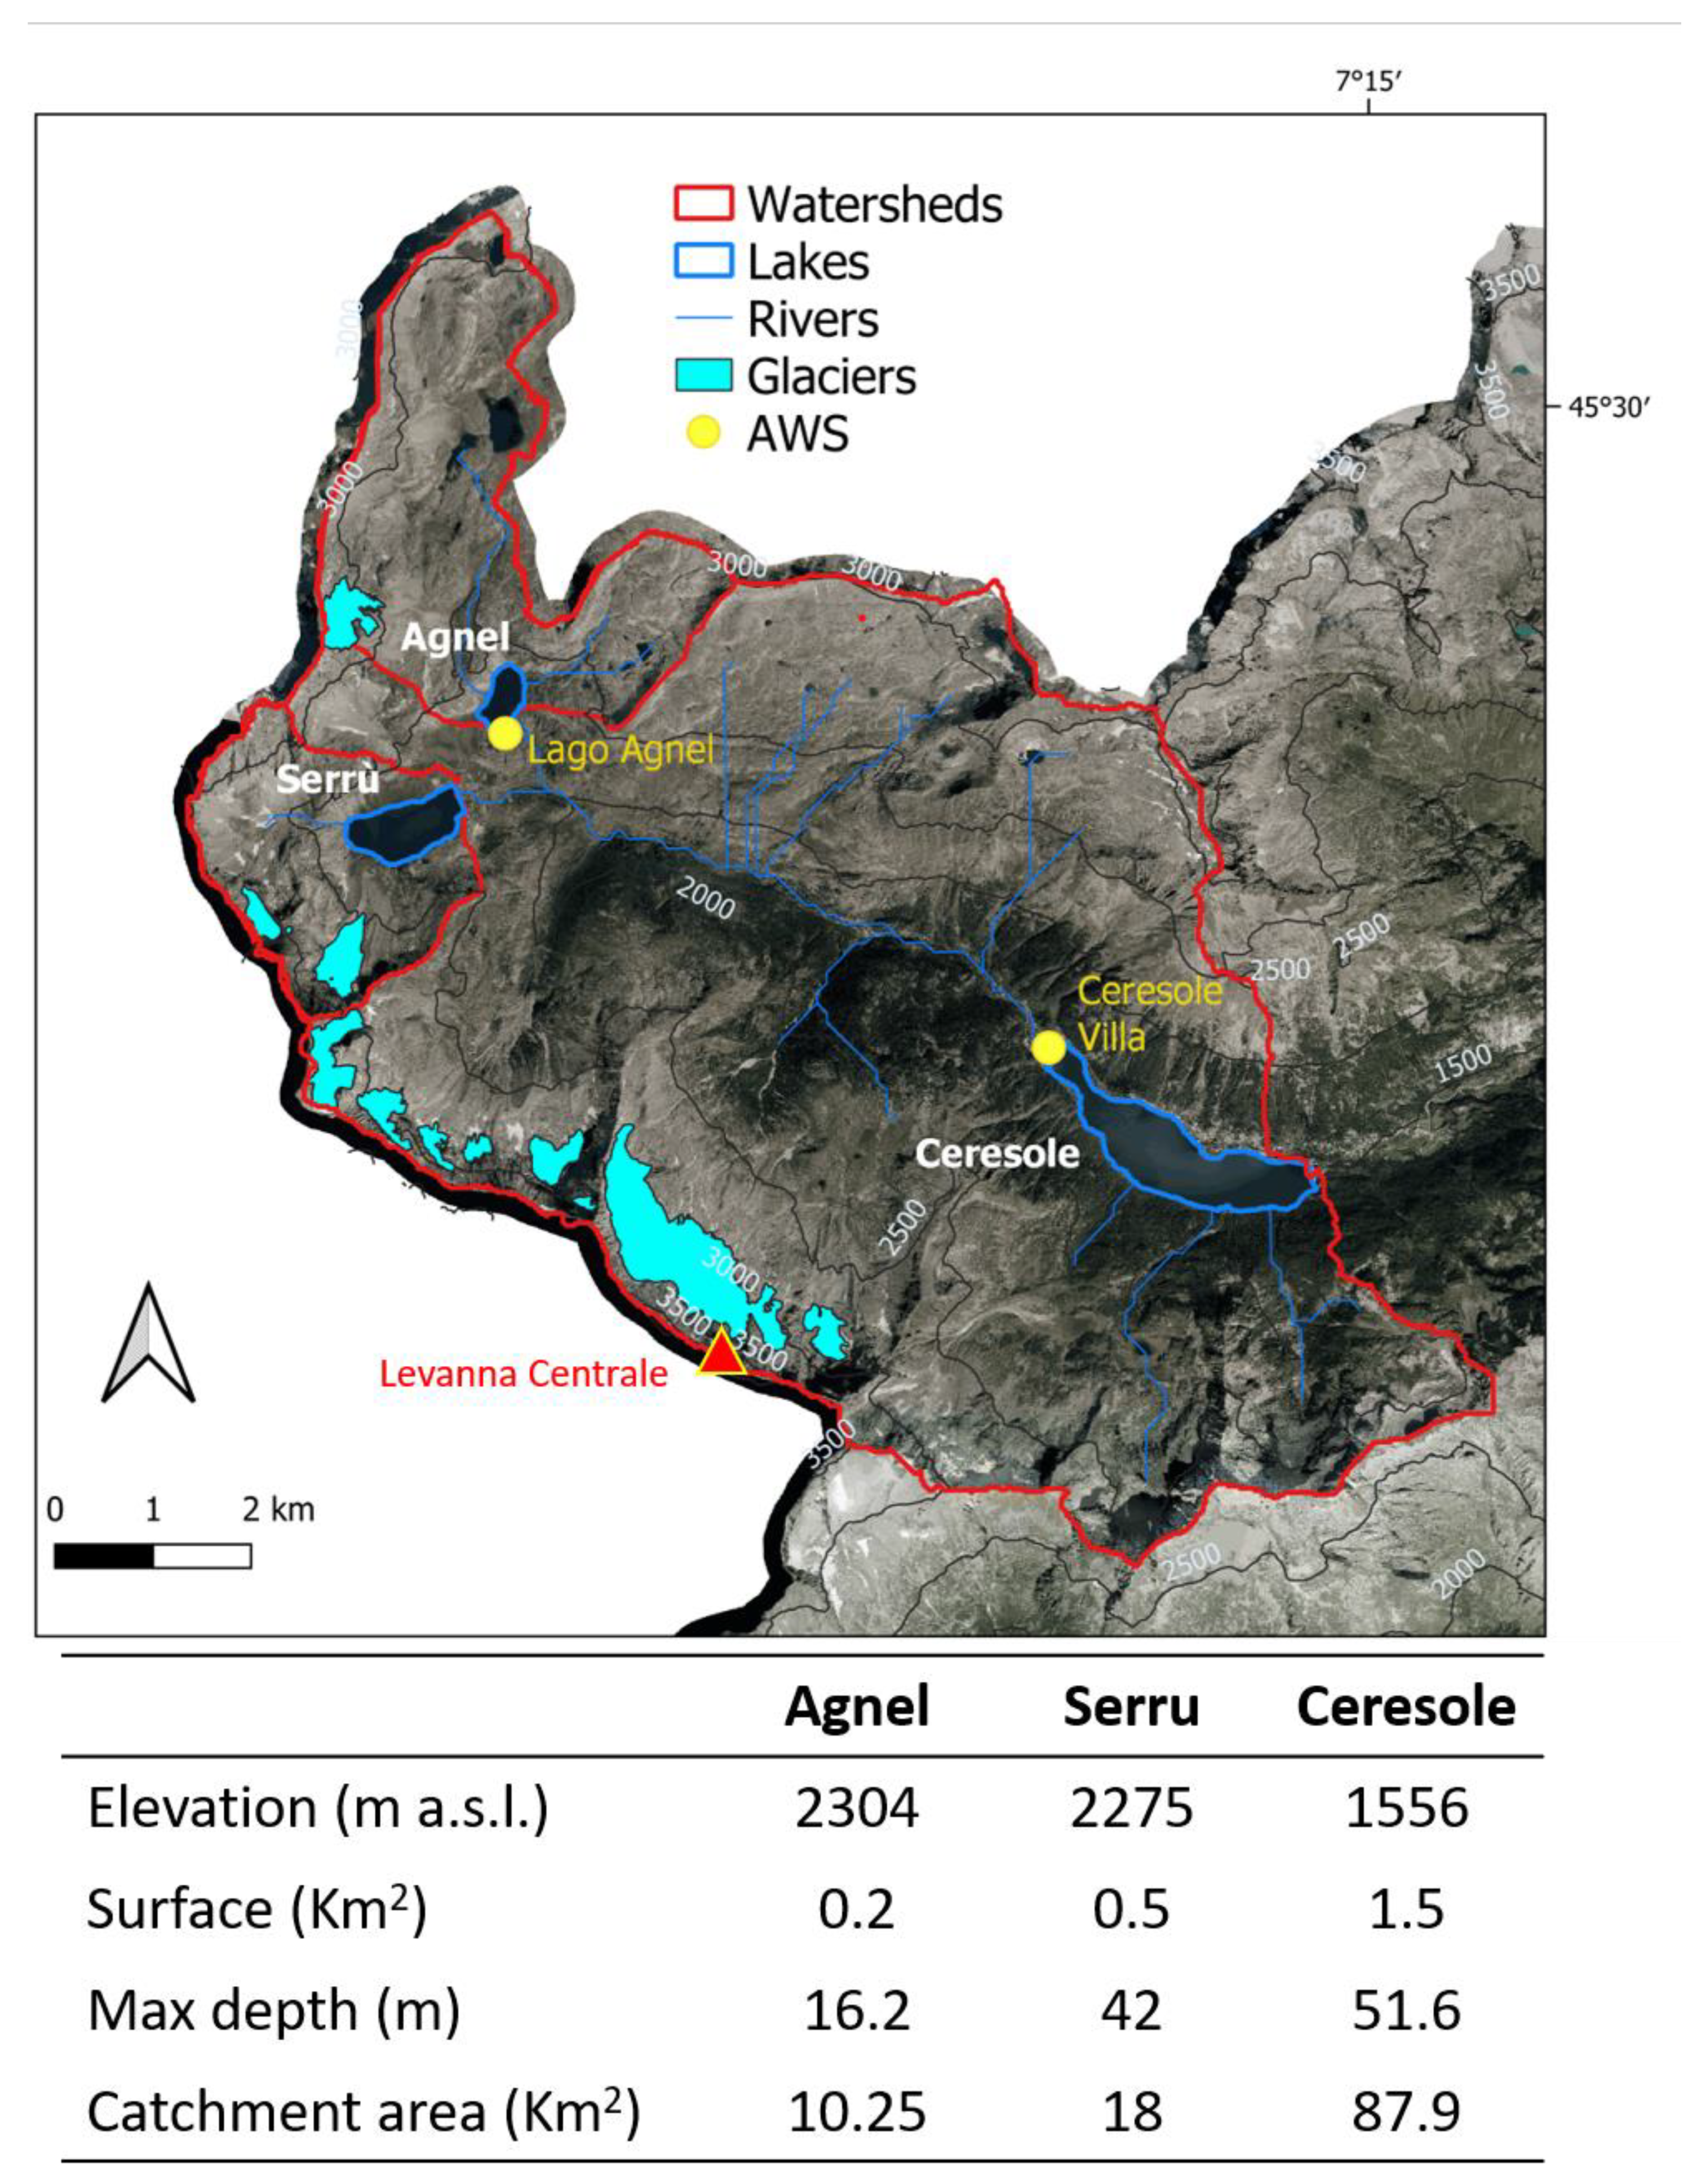
The study site is the upper part of the Orco Torrent watershed, located in northwestern Italy, in the Piedmont Region, inside the Gran Paradiso National Park. It is a high mountain glacial basin (
Figure 1), with an area of about 85 km
2, and elevations ranging from about 1500 m to 3619 m a.s.l. (Levanna Centrale peak).
Figure 1 shows the study site catchment together with the sub-basins of each reservoir, the location of the three reservoirs and the Automatic Weather Stations (AWS) at Ceresole Villa and Lago Agnel. A table with some characteristics of the catchment areas is also shown in
Figure 1. According to Köppen’s classification [
21], the climate at Ceresole Villa AWS (observation period 2000–2022) is “D, Cold”, without a dry season and with a warm summer. The hottest month is July (mean temperature 14.8 °C), and the coldest month is January (mean temperature −2.2 °C). The annual total precipitation (rainfall and snowmelt) is 881 mm, the month with the highest precipitation is May (143 mm), while the month with the least rainfall is February (20 mm). At the same time, the climate at Lago Agnel AWS (observation period 1997–2022) is “D, Cold”, without dry season and with cold summer. The hottest month is July (mean temperature 10.7 °C), and the coldest month is January (mean temperature −4.7 °C). The annual total precipitation (rainfall and snowmelt) is 1133 mm, the month with the highest precipitation is May (158 mm), while the month with the least rainfall is February (43 mm). High altitude air temperature in the Alps is rising rapidly, with the normal climate period 1991–2020 showing an increase of 0.9 °C compared to the 1961–1990 one [
22].
The main lithotypes in the study area are those of the Gran Paradiso Massif, i.e., augen-gneisses and fine-grained gneisses [
23]. Calcschists and micaschists from Oceanic Units are only found in the westernmost end of the valley. The Pleistocene glaciers have deeply shaped the entire valley, although most traces of these glacial phases have been overwritten by the Little Ice Age (LIA, dating around 1850) glacial readvances. At the peak of the LIA, the Orco Valley hosted 36 glaciers, covering a total surface of over 23 km
2. Currently, only 18 glaciers remain, and the glaciated area has reduced to less than 30% of the LIA surface [
24]. Gravitational and fluvial processes have partly modified the former glacial landscape, gaining importance as glaciers shrink and paraglacial processes develop, modifying the once glaciated environments [
25,
26].
The water abundance of the Orco Valley, resulting from glaciers and snow cover, along with the local topography, facilitated the construction of a cascade system of three artificial dams that, together with plants further downstream, provide a production capacity of about 700 GWh per year. These dams have become a distinctive feature of the Orco Valley landscape. Starting from the top, the highest reservoir is Lake Agnel (2304 m a.s.l.), followed by Lake Serrù (2275 m a.s.l.) and by Lake Ceresole (1556 m a.s.l.): the latter is the largest one, and coincides with the closing point of the catchment considered for this work. The three reservoirs are joined by an artificial channel that starts at Lake Agnel, passes through Lake Serrù, and ends near Lake Ceresole. In addition, the waters of Lakes Agnel and Serrù flow into the Orco Torrent, which is the only natural tributary to Lake Ceresole.
3. Materials and Methods
The first part of the work consists of observing the water colour and lake extent of the three reservoirs in the basin, analysing the time series of these variables measured at the daily level (i.e., the day of satellite acquisition) at a theoretical time frequency of 5 days, unless acquisitions are covered by clouds. Satellite-derived lake parameters are observed together with daily temporal series of precipitation and snow depth measured at Automatic Weather Stations (AWS) located inside the basin. At this stage, the goal is to explore the variability among water bodies with different locations, morphologies and contributing area, and to observe the temporal variability of parameters for each lake. Subsequently, the relationship between water quality and various climatic variables is analysed at a basin scale. Climatic variables are, hence, integrated at a watershed level, and Lake Ceresole is chosen as representative of the water quality of the entire basin, due to its position at the closing point of the watershed. In this case, all the considered variables, both satellite-derived and measured at AWS, are scaled up to the monthly level to be comparable.
3.1. Satellite Data
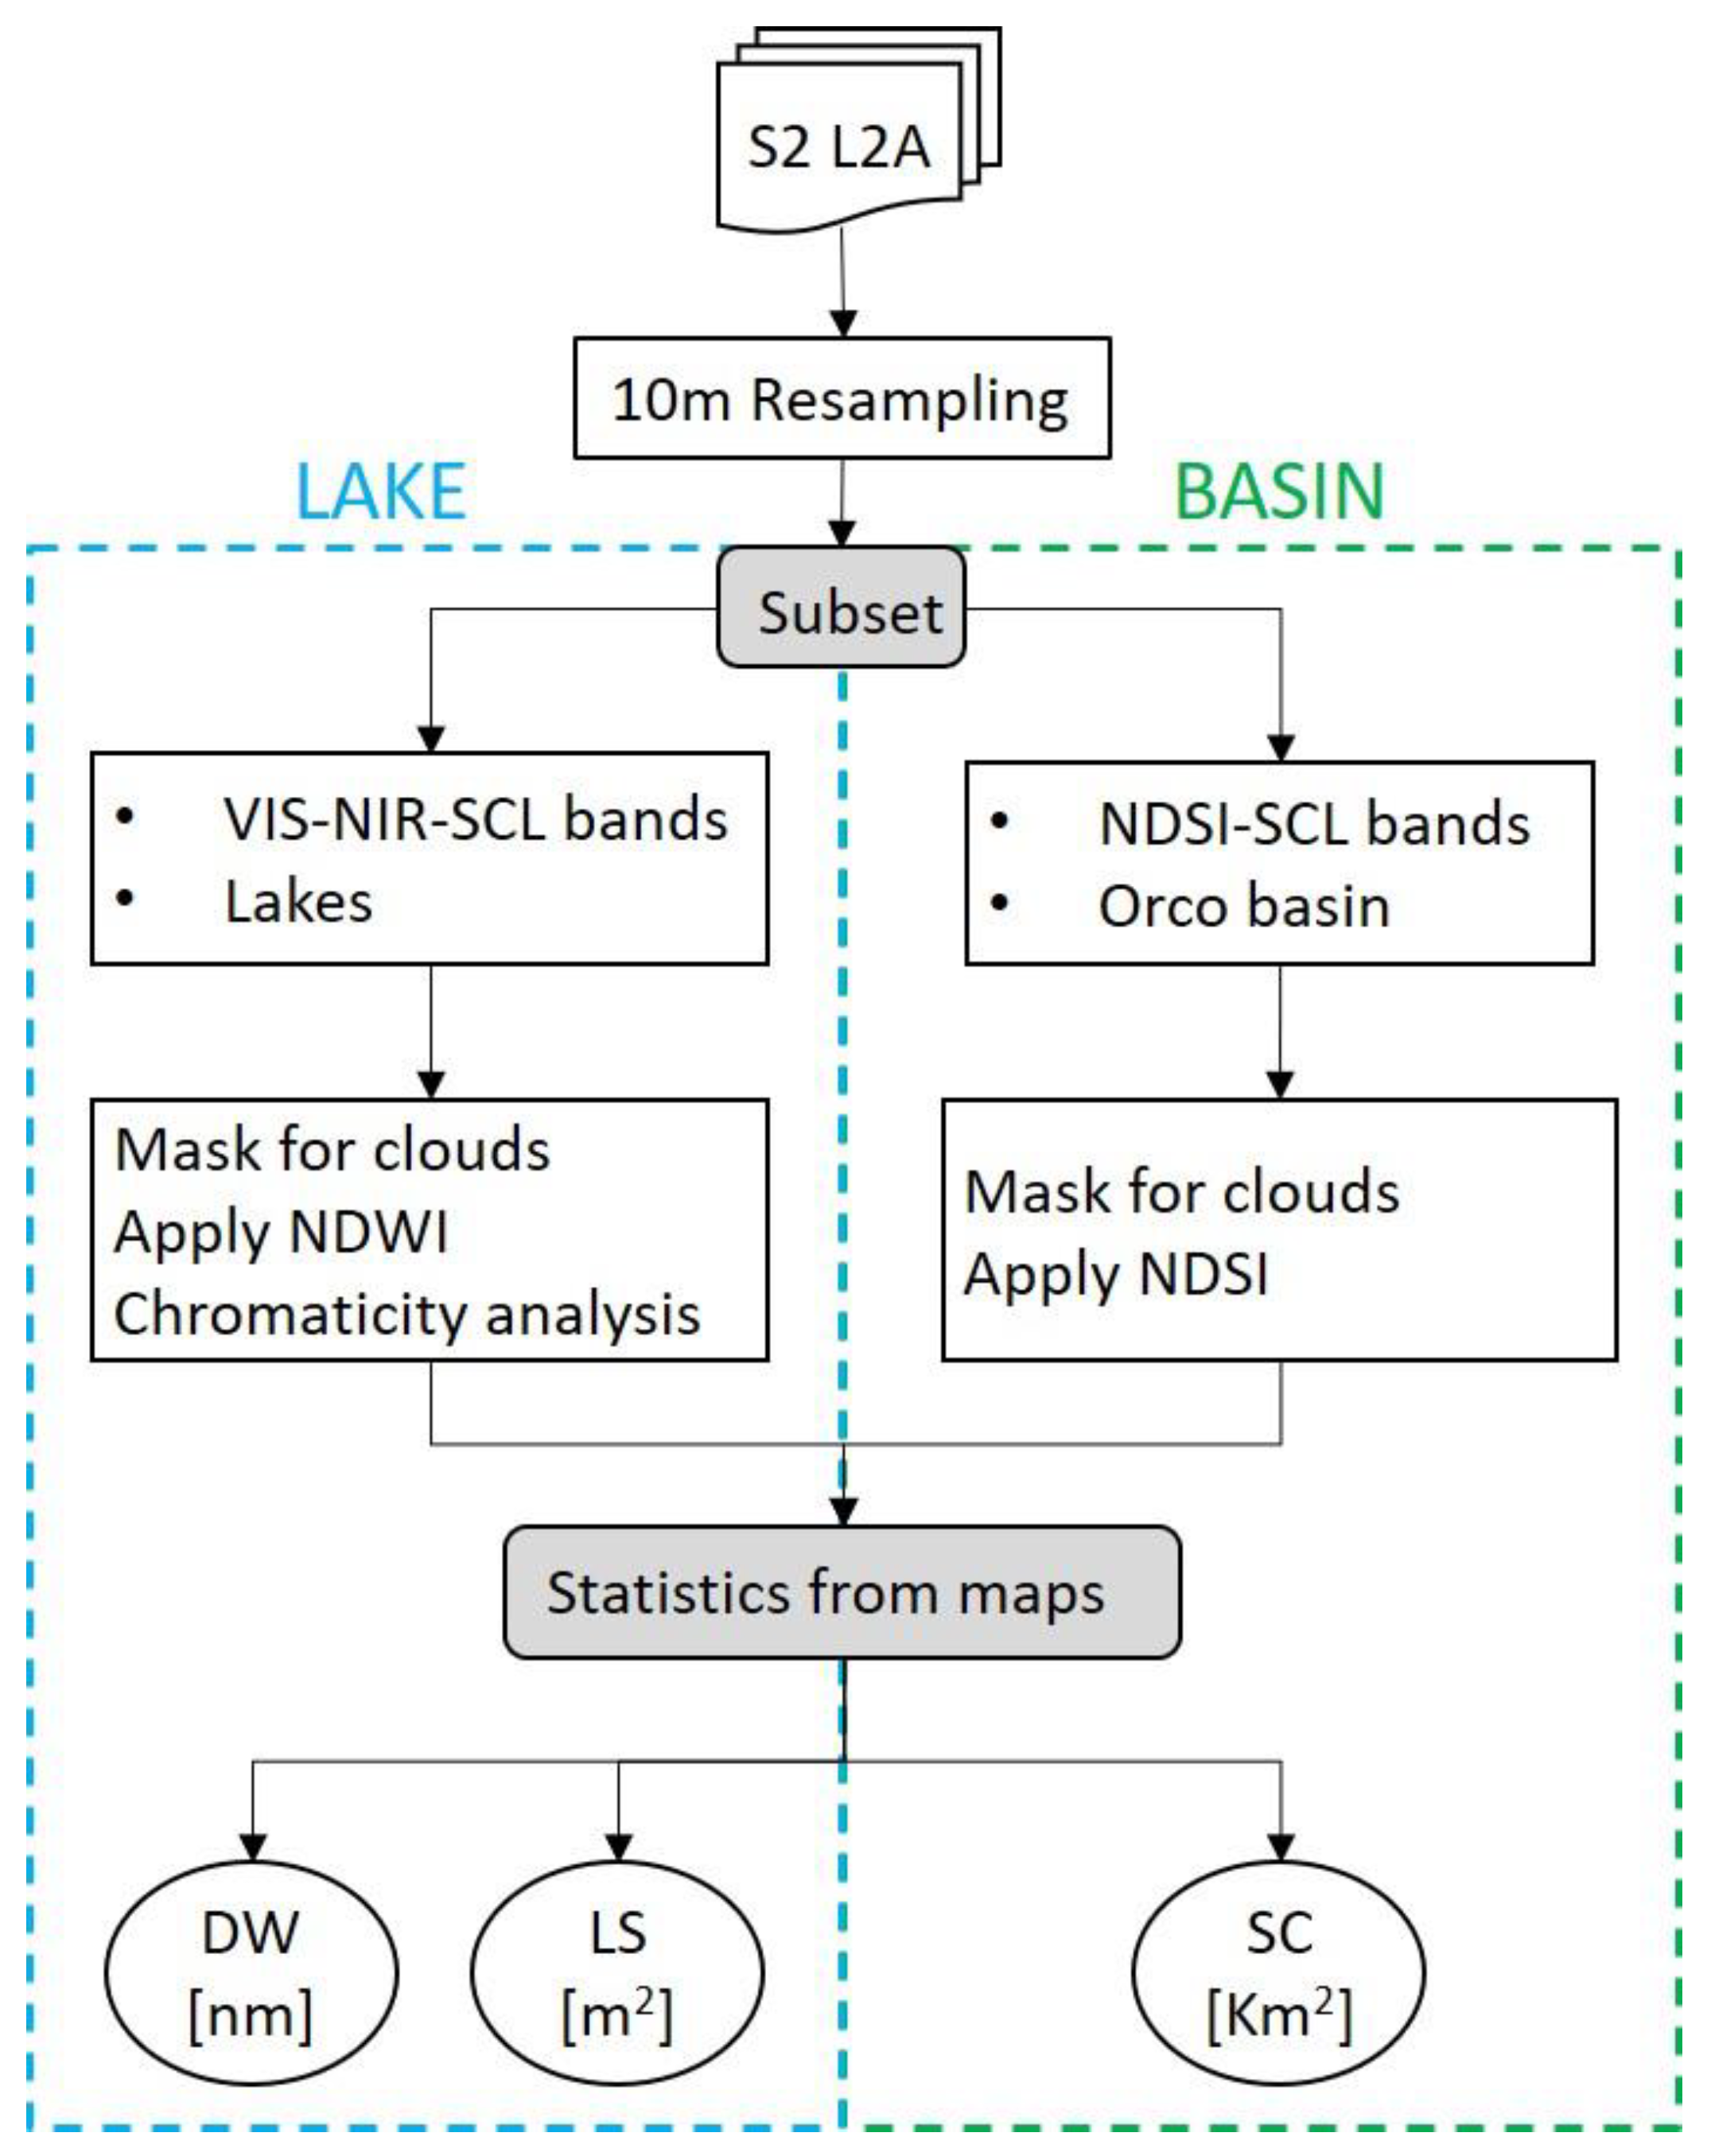
Lake water extent (Lake Size [LS]) and water colour (e.g., Dominant Wavelength [DW]) of Ceresole, Serrù and Agnel Lakes were retrieved from the elaboration of cloud-free (<30% over the tile) Sentinel-2 satellite acquisitions above the upper Orco Valley watershed in the period 2017–2022 (period of availability of atmospherically corrected S2L2 images in Google Earth Engine). The snow cover extent [SC] inside the basin was derived from the same images. The sketch of the elaboration steps is shown in
Figure 2.
Level-2 atmospherically corrected surface reflectances (S2L2A) in the VIS-NIR spectral bands (from band 1 (443 nm) to band 8 (835 nm), plus band 11 (1614 nm) for snow cover analysis), with the relative Scene Classification Map product (SCL), were resampled at 10 m of resolution using the Google Earth Engine environment. The “Harmonized Sentinel-2 MSI” GEE collection was used, as suggested in the Earth Engine Data catalogue (
https://developers.google.com/earth-engine/datasets/catalog/sentinel-2, accessed on 27 March 2024). Images were then processed in R, where residual clouds (SCL classes 8 to 10) were removed. All surfaces other than water were masked, using the Open Street Map lake shapefiles, and successively the Normalized Difference Water Index NDWI [
27] using S2 band 3 (Green) and band 8 (NearInfrared) was applied. Two different thresholds of 0 and 0.2 were used to estimate the lake surface area (LS) and for mapping the water pixels on which to apply the chromaticity analysis. In the first case, the more conservative threshold allows the selection of very dark waters, which is the case of some high-altitude water bodies. The 0.2 threshold was chosen to avoid mixed pixels (e.g., water and land) in the analysis of water colour. S2L2A reflectances [R] in bands 1 to 5 were converted into remote sensing reflectances (Rrs) following the equation below:
The van der Woerd and Wernand procedure ([
9,
10]) was used to transform Rrs into Tristimulus X Y Z values, and then into chromaticity coordinates. The entire process was performed in RStudio, using a specific script adapted from the one by Yang [
18]. Spatial median and standard deviations of DW for each lake were calculated per each S2 acquisition.
For the retrieval of snow cover maps, the Normalized Difference Snow Index (NDSI) was calculated using S2 band 3 (Green) and band 11 (SWIR) [
28]. The commonly applied threshold of 0.4 was used to discriminate the presence/absence of snow. A visual check was finally performed to assure the correctness of LS and SC calculations (e.g., underestimation for the presence of residual clouds or shadows upon the lakes or snow). LS and SC were derived by multiplying the water and snow pixel count, respectively, by 100 m
2 (pixel surface). Successively, DW, LS and SC were aggregated at a monthly scale, in order to observe comparable time series when correlating climatic and satellite derived parameters.
3.2. Climatic Data
In this study, precipitation data (rainfall and snowmelt) were acquired every 10 min by two AWS located inside the basin: Ceresole Villa and Lago Agnel (see
Figure 1). Air temperature and snow depth data were acquired every 30 min at the same AWS. Precipitation data (measured with a heated rain gauge) were summed on a daily scale (Pt). Precipitation intensities (Pint) were calculated as the amount of total daily precipitation divided by the hours of daily precipitation (mm/h). Snow depth data were averaged on a daily scale (Sd). Maximum (TX), minimum (TN) and mean (TG) daily air temperatures were extracted from the 30 min time series. Icing days (count of days where TX < 0 °C, ID) and Frost days, (count of days where TN < 0 °C, FD) were also calculated as in [
29]. Time-series of Pt, Sd and lake variables (DW and LS) were observed and analysed for the three lakes.
Towards the aim of finding relationships among the water colour variations and the local climate of the upper Orco basin, Lake Ceresole was selected for its location at the closing point of the watershed, and climatic data were spatialised all over the basin multiplying the data of each AWS by a specific weight, calculated using the triangulation technique in QGIS (Voronoi Polygons). The obtained climatic variables at basin scale (Pt, Pint, TX, TN, TG, ID and FD) were then aggregated at a monthly scale. Satellite-derived parameters DW, LS and SC were also aggregated at monthly temporal scale. The non-parametric Spearman correlation among all the mentioned parameters was performed considering different seasonal periods: the snow-free season of Lake Ceresole (April–October), the April–July months, in which snowmelt is the dominant source of water runoff to the lake, and the August–October months, during which rainfall (and partially glacier melt) is the main water contributor to the lake. Correlations with p-values < 0.05 were considered significant.
4. Results and Discussion
4.1. Spatial and Temporal Variability
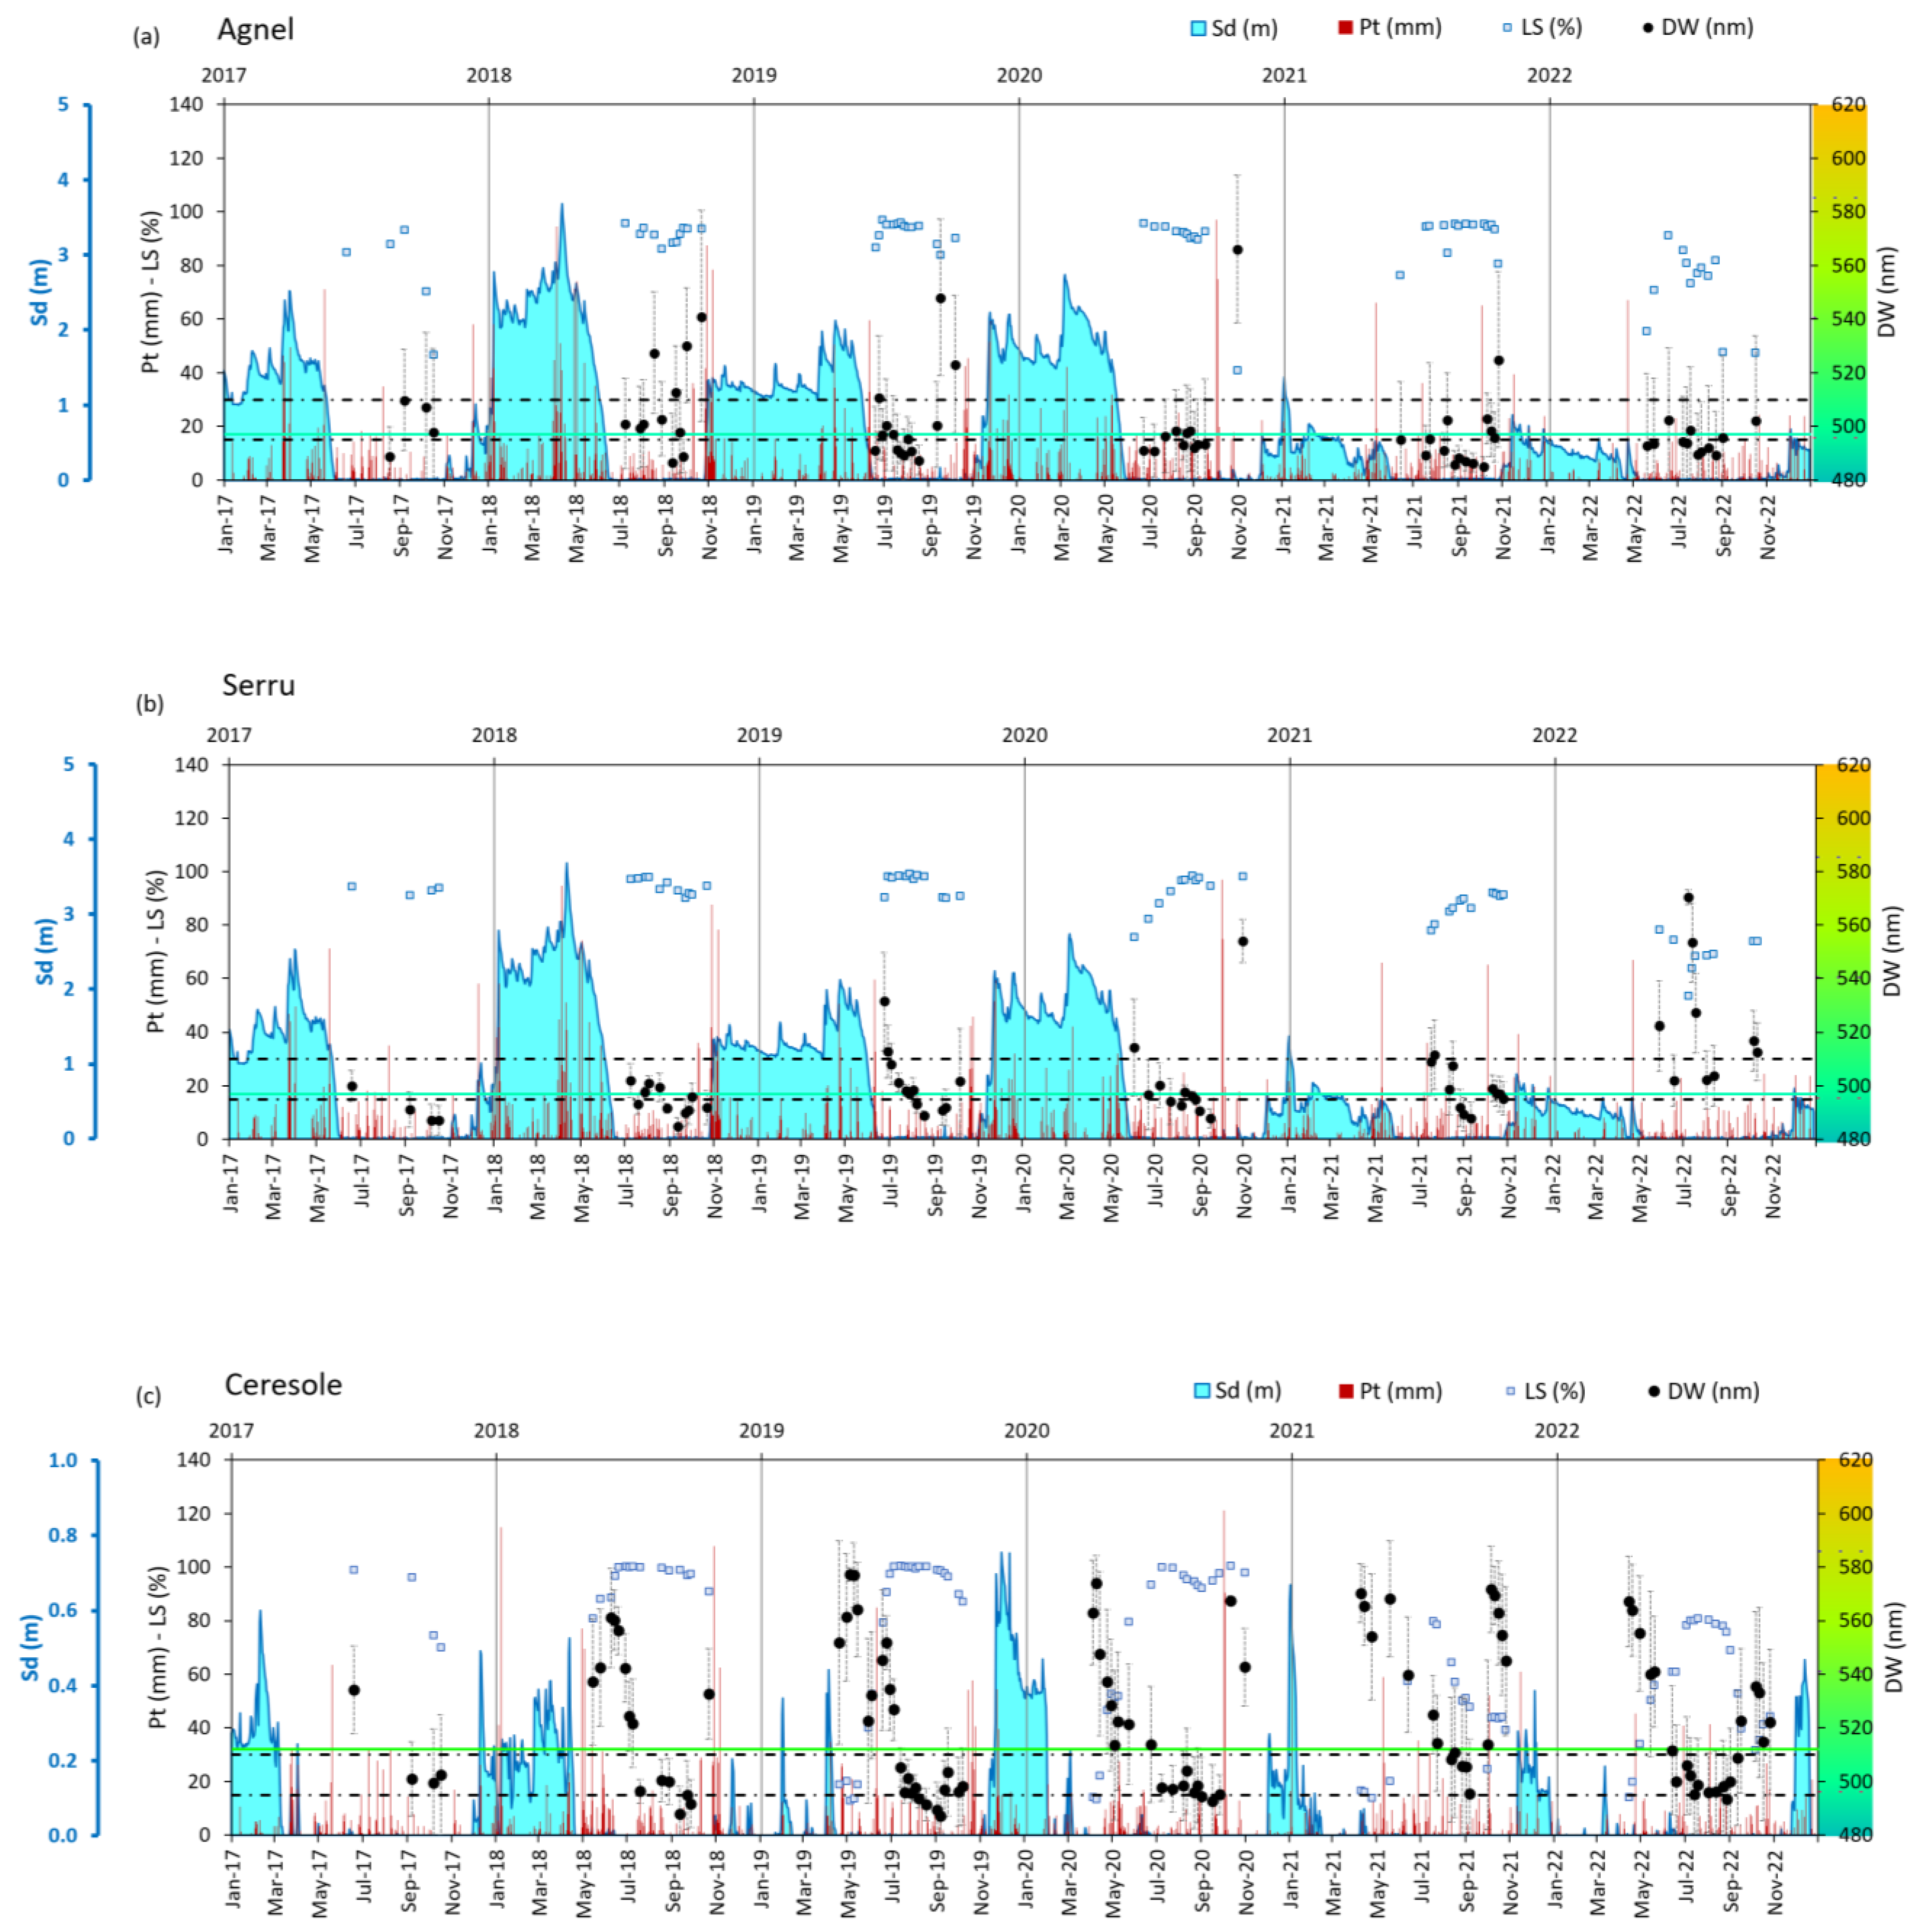
Useful images for water quality analysis in Lake Ceresole range from April to October, due to ice cover on the lake during the snow season and due to a shadow effect that occurs in late autumn, when low solar altitudes project the southeastern slope of the mountain onto the lake surface. Of the images acquired in this time interval, a yearly variable percentage of 37–54% presents good radiometric conditions (e.g., completely free from clouds or shadows or other disturbing effects) for a total of 103 images, which could be elaborated to produce DW and LS for Lake Ceresole. As for Serrù and Agnel lakes, this number is reduced to 58 and 67, respectively, since they are located at higher altitudes where snow cover persists longer. Temporal series of DW, LS, Pt and Sd for the three observed lakes are shown in
Figure 3.
Pt and Sd time series measured at the Lago Agnel AWS are plotted for Lakes Serrù and Agnel, while for Lake Ceresole, time series measured at the Ceresole Villa AWS are used. DW values (black dots) refer to the second y-axis, Sd (cyan areas) to the third y-axis (in blue), while Pt (red bars), and LS (light blue squares) are indicated on the principal y-axis. Note that for Lake Ceresole, the Sd axis has a different scale.
The time series shown in
Figure 3 display very pronounced DW seasonal variability for Lake Ceresole, with higher DW values in April (maximum of 577 nm in 2019) and lower values in July–August (minimum of 487 nm in 2018 and 2019), and an average standard deviation of 17 nm. As we move up in elevation (Serrù and Agnel lakes) this variability is reduced, leaving DW values concentrated around blue–green hues. Average values of DW recorded over 2017–2022 are set around 497 nm (near the blue to green threshold of [
14] for the higher elevated Serrù and Agnel lakes, while for Lake Ceresole, the average value of DW is around 512 nm (near the green to yellow threshold of Lehmann). Lake Agnel shows a higher variability of DW during the five years with respect to Lake Serrù, with an average standard deviation comparable to that of Lake Ceresole, while Lake Serrù is much less variable over time (average standard deviation of 7 nm). Increases in DW are observable during October, mainly in Lake Ceresole (e.g., in 2020, 2021 and 2022), sometimes following rainfall events.
LS for Lake Agnel and Lake Serrù vary usually between 80% and 100% during the year, with minimum values occurring in spring or autumn months. Lake Ceresole, instead, is the lake with the bigger lake size variation during the year, with minimum values of 20% registered in April/May, and a full reservoir in July/August. Year 2021 represents an exception to these trends for Lake Ceresole, which was strongly shrunk for most of the year. Conversely, 2022 is an exceptional year for the three reservoirs, since Lake Agnel and Lake Serrù showed mean values of 70%, with minimums of 50%, and Lake Ceresole reached a maximum of 80% of LS.
Time series of Sd indicate a higher snow supply, both in terms of quantity and time of permanence, for the Agnel and Serrù lakes located at higher elevations than Lake Ceresole. In the 2020–2021 and 2021–2022 snow seasons, the measured Sd at Lago Agnel AWS is about one-third of that of previous seasons, with values beginning to be recorded in December. At Ceresole Villa AWS, Sd usually is smaller than at Lago Agnel AWS (up to nine times, as in 2017–2018) and the snow persists for 3 or 4 months maximum. The 2018–2019 season is an exceptional year, with few and short periods of very low Sd values. The duration and amount of snowfall is also reduced in Ceresole Villa for the 2020–2021 and 2021–2022 seasons, with Sd measured for just two or three months (Dec to Jan or Dec to Feb) and values dropping by half to one-third of that of previous seasons.
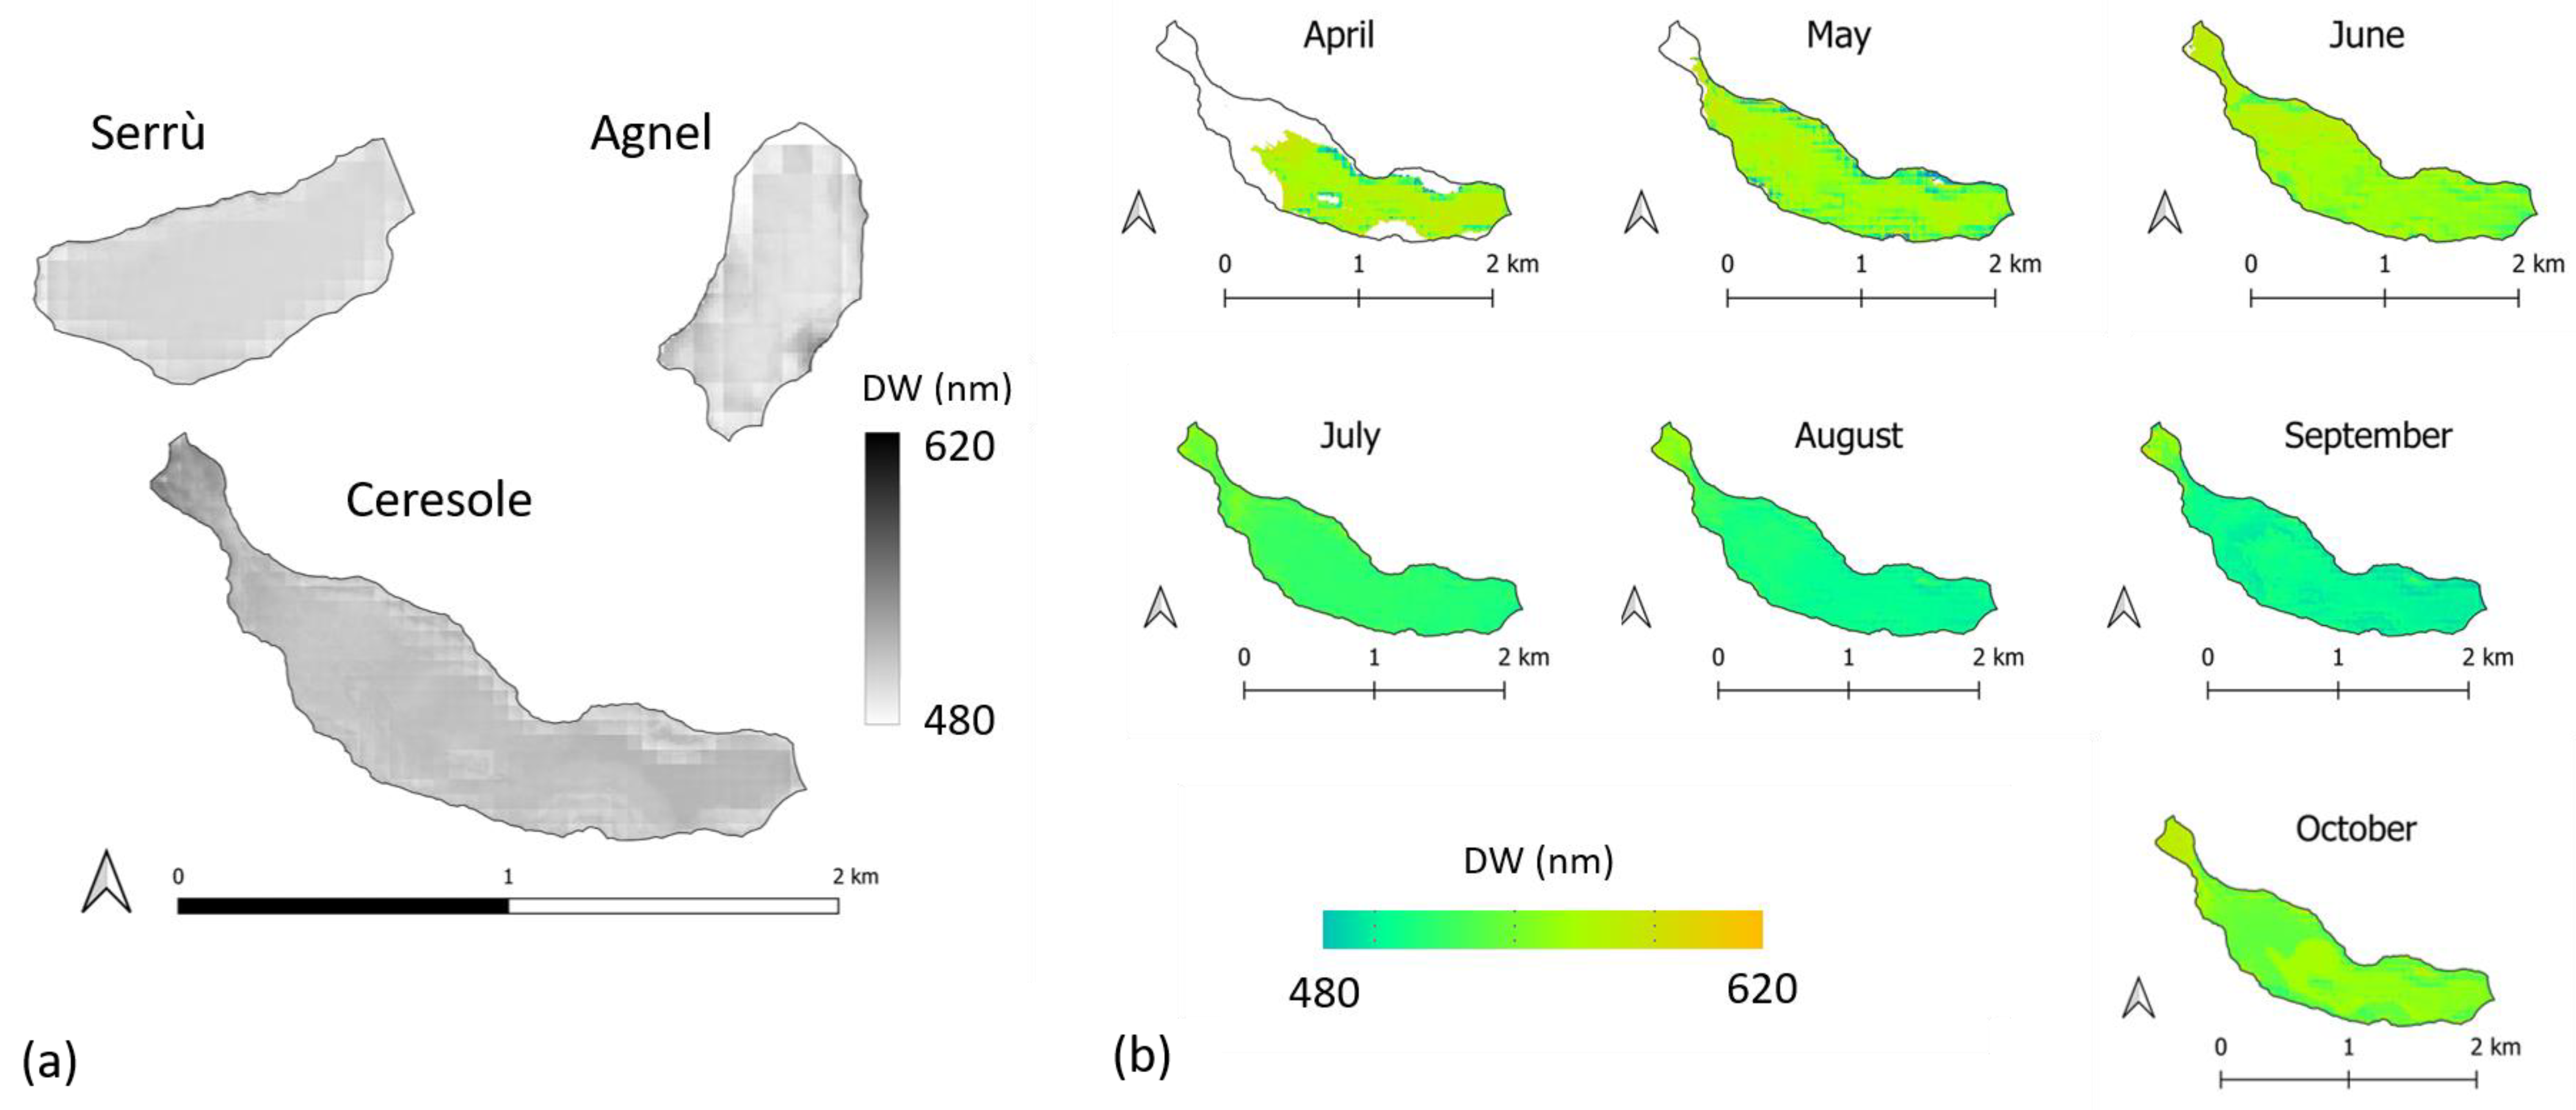
Figure 4a shows average DW maps for each reservoir for the period 2017–2022, while
Figure 4b reports maps of monthly average DW for Lake Ceresole.
Lake Serrù shows spatial homogeneity of DW, while in Lake Agnel and Lake Ceresole, DW varies much more spatially. Higher DW values in Lake Ceresole are observed in correspondence with the intake of the Orco Torrent (northwest), and in the portion near the dam (southeast), where the water persists for all the year. Looking at
Figure 4b, it is possible to observe that both lake extent and spatial variability of DW in Lake Ceresole change through the year. LS increases from April to June and, at the same time, DW is spatially variable. From July to September, DW is more homogeneous within the lake, returning to be spatially variable in October. As for Lake Agnel, higher DW values are seen in the south-eastern part of the lake, where the water is shallower.
4.2. Correlation among Lake Parameters and Basin Climatic Variables
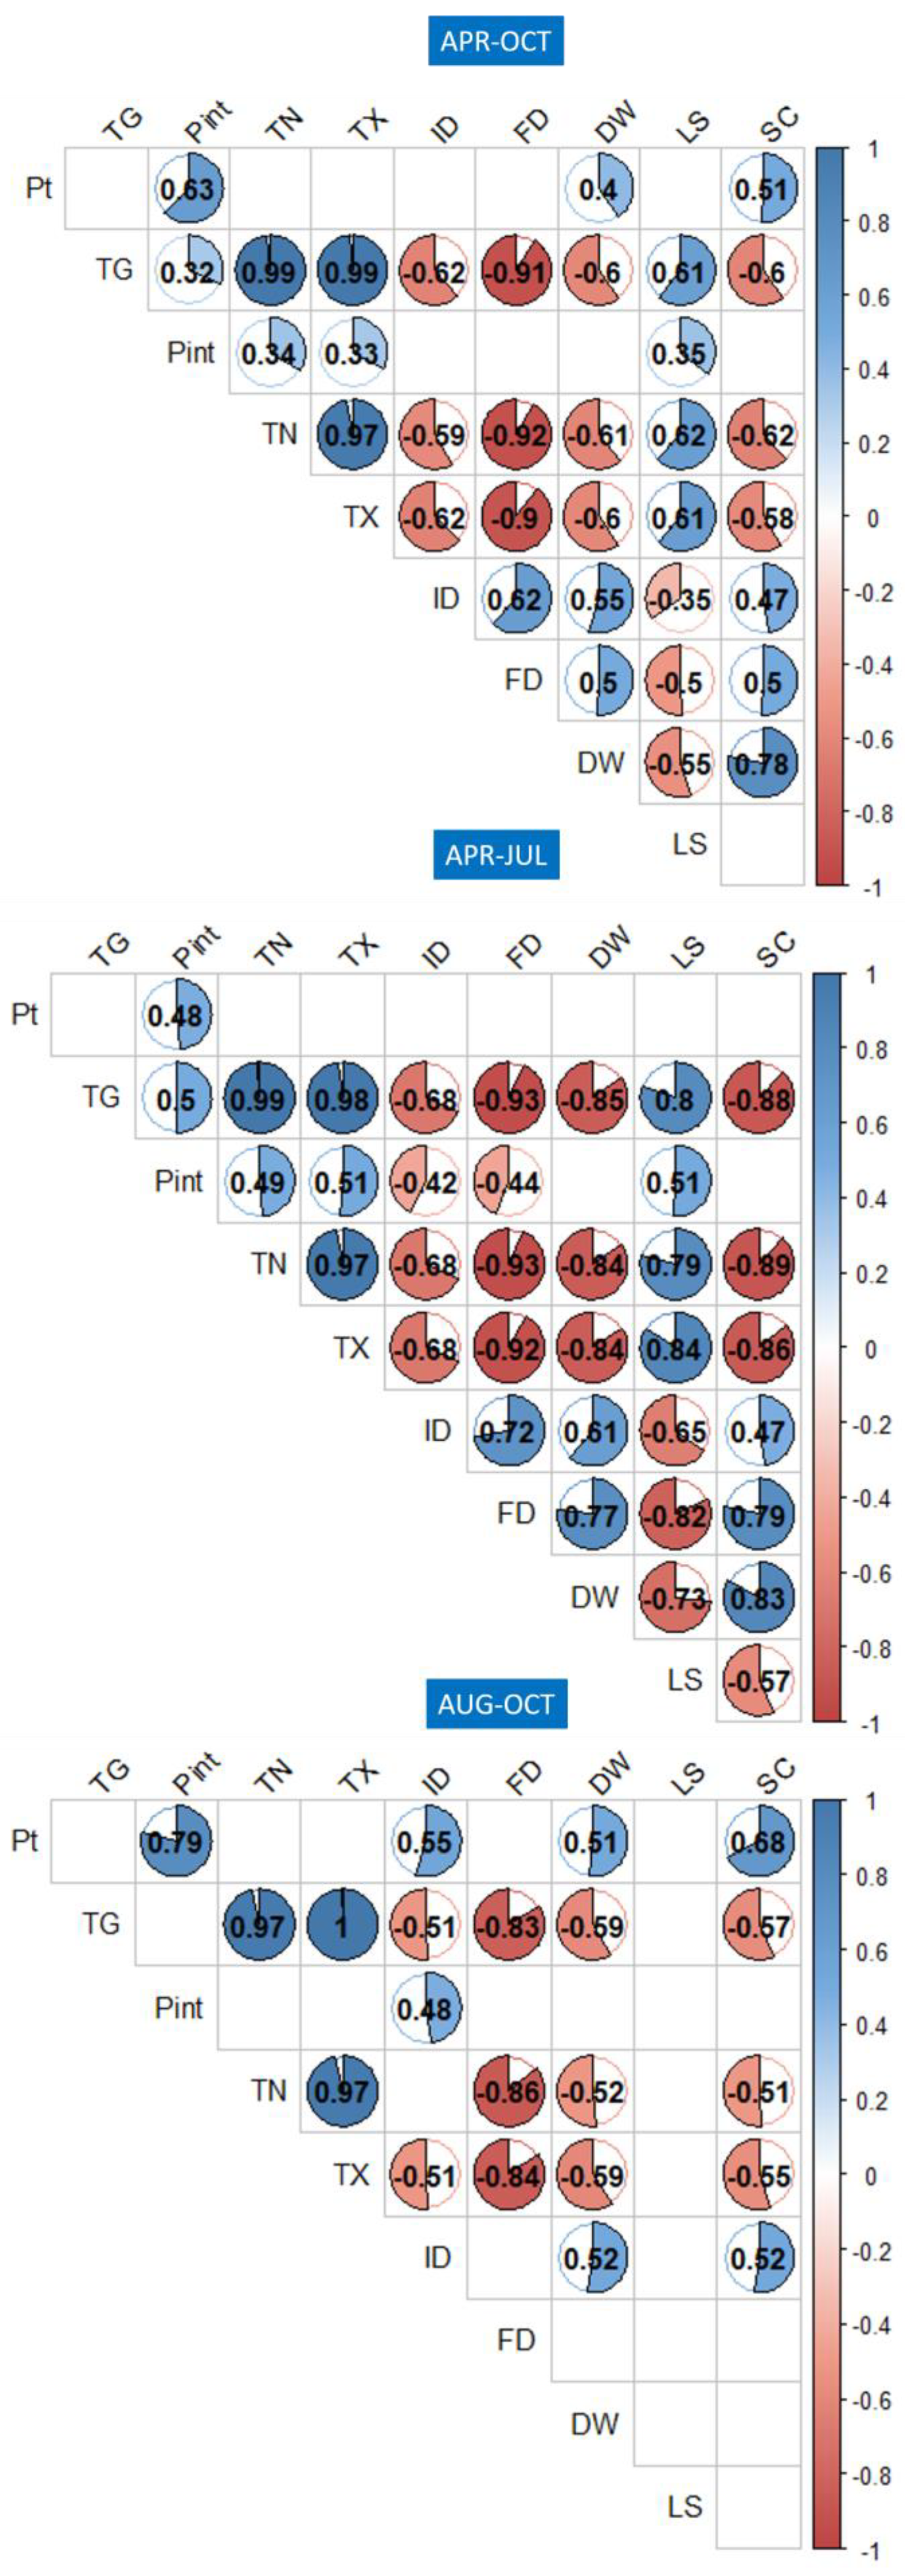
The monthly satellite-derived parameters (DW, LS and SC) and meteorological variables at the monthly scale (Pt, Pint, TG, TX, TN, ID, FD) were correlated with each other to explore the local climate conditions of the basin and to relate them with the temporal variations in water colour of Lake Ceresole.
Figure 5 shows the correlation matrix obtained considering the total snow-free season on the lake (April to October), the period from April to July, and the August–October months.
DW shows significative negative correlations (0.6 of correlation coefficient (cc) for the April–October period), with air temperature parameters and this correlation is straightened in the April–July months (>0.8 cc). LS is also negatively correlated with DW, and this is particularly true for the April-July months (0.55 to 0.73 cc). Weak negative correlations exist between DW and ID, FD and Pt. The correlation between DW and Pt disappears for the April-July period, but it is present again in the August-October months. Finally, SC has a positive correlation with DW in the April-October and April-July periods (0.78 to 0.83 cc).
To further analyse the influence of precipitations on the lake water colour, we examined the most significative rainfall events for the time period considered (2017–2022). We characterized the rainfall events in terms of duration (number of days, n gg), entity (total precipitation, Ptot) and peak intensity (maximum daily precipitation during the event, Pmax). Then, we calculated the difference in DW between the first satellite acquisition before and after the precipitation event. Finally, we also reported the increase in LS between the same acquisitions (
Table 1).
The rainfall events show a similar duration, from 4 to 6 days. Ptot and Pmax are different, ranging between a minimum of 51 mm to a maximum of 231 mm for the flooding event of October 2020. Despite the intensity and duration of rainfall events, almost all cases show an increase in DW.
The rainfall events of 2022 occurred in Summer, with most of the precipitation falling in one day, a total precipitation of about 50 mm and a very small observed increase in DW (0–6 nm). The maximum increase in DW (72 nm) is measured for the rainfall event that occurred in October 2020, when half of the precipitation (>120 mm) fell in one single day. A similar increase in DW (58 nm) is observed for the October 2021 rainfall event, characterised by a more moderate amount of total precipitation (72 mm) most of which fell in one day. Rainfall events occurring in May 2021 and June 2019 have comparable amounts of total precipitation and DW increase.
5. Discussion
The three lakes show blue–green hues, like most high-altitude mountain lakes with cold climatic conditions (i.e., data measured inside the Upper Orco watershed show mean annual air temperatures of about 6 °C and mean summer air temperatures < 15 °C) facing an ice-covered period [
15,
18]. Higher elevations [
30], relative positions within the watershed and the dimension of the respective drainage basins, can explain the difference between more bluish waters of Serrù and Agnel lakes in comparison to those of Lake Ceresole. The different snow conditions between the first four winter seasons and the last two (2020–2021 and 2021–2022) do not have effects in terms of water colour, but rather in terms of water quantity; in fact, DW values do not show particular differences in all the three lakes when compared to previous years, while 2022 is the year with higher LS variation for Serrù and Agnel lakes and 2021 for Lake Ceresole. The exceptional nature of the 2021–2022 hydrological year, especially in the high mountains, is well documented by the record glacial losses measured in summer 2022 in the Italian Alps [
31] and beyond [
32]. The drought phenomena experienced in the past two years (e.g., [
33]) is certainly the reason explaining the shrinkage of lakes during 2021–2022, but the fact that the lakes behave differently is definitely a function of the water resource management carried out by the dam operators to face the drought events and the energy demand.
It was observed that low LS values are, in general, associated with high DW. This is particularly visible in Lake Ceresole during the April–July period, when the cc between DW and LS is −0.73 (see
Figure 5), and it was also observed in summer 2022 in Lake Serrù. Here a 50% LS reduction was concurrent with a strong increase in DW (up to 570 nm), confirmed by a field survey carried out on 8 July 2022. The water turbidity measured in Lake Serrù on the occasion was six to nine times higher than those measured in Agnel and Ceresole lakes, respectively. We think that high lake size variation can cause high suspended sediment concentrations in areas that experience alternated dry and wet periods, because the mechanical action of water can promote the detachment and suspension of particles, generating higher turbidity and consequent higher DW values.
The observations of temporal series of Lake Ceresole (
Figure 3), together with the correlation analysis performed at the basin level (
Figure 5), make us affirm that two main phenomena can influence the temporal water colour variations in Lake Ceresole. During the April–July months, we have a gradual increase in air temperatures, which favours snow melting and transport/erosion phenomena inside the watershed. The more extended the snow cover, the more erosion is driven by its melting, and this can explain the higher DW values at the beginning of the ice-free season of the lake. High DW values in this period can be also related to an organic component in the water; it has been observed that ice cover during the winter period can preserve phytoplanktonic communities that, once good environmental conditions (e.g., penetration of solar radiation, rising temperatures, and terrestrial nutrient supply) have arrived, can give rise to blooms in Arctic and Antarctic sea waters [
34,
35] and even in oligotrophic lakes such as Arctic lakes [
36]. As the season progresses and summer arrives, Lake Ceresole gradually fills, possibly diluting the material carried into it by thaw and runoff processes. During the August–October months, the main factor driving the changes in water colour are precipitations and the consequent runoff along the slopes of the watershed. The bigger precipitation event that occurred during the five years, in October 2020, is an explicative example; it induced a strong and rapid increase in DW in all the lakes observed (
Figure 3).
The analysis of single pluviometric events (
Table 1) also suggests a cause–effect relation between rainfall and DW/LS increase in Lake Ceresole. The magnitude of this increase is a function of the magnitude of the rainfall event (Ptot), the lake extent at the time of the event, the intensity of the rainfall event (Pmax, [
37]), and the number of days between the rainfall event and satellite observations. The autumn rainfall events can have a stronger impact on sediment transport and consequent water colour change, also because of the reduced presence of herbaceous and arboreal vegetation, which may intercept rain drops before they fall to the earth surface. Furthermore, during the late spring and early summer events, the highest parts of the basin are likely still covered by snow, so the arrival of rainfall water in the Orco Torrent is delayed by infiltration of part of the rainfall into the snow cover. Our short analysis cannot fully explain the complex relationship between precipitation and water colour variation, but it at least shows an initial response of lake water quality conditions in relation to heavy precipitation events.
The temporal variability of DW in lake Agnel seems not to be linked to any climatic or seasonal phenomena. In this lake, very low water reflectances have been observed; this situation causes the water of this lake to be prone to adjacency effects, so that lake reflectance also brings information about the reflectance properties of the neighbouring surfaces. This can occur during late Spring and early Autumn, when some residual ice cover on the lake surface or residual/first snow around the lake can increase the water reflectance signal, and provide a DW value “contaminated” by snow. In fact, even if lake water properties have been observed starting from satellite observations subsequent to 0 Sd measured at AWS, some snow patches can still be present nearby them.
The spatial variation in DW inside the three lakes is quite different, and particularly visible in Lake Ceresole (
Figure 4a), the one facing the highest LS variation during the year. The areas which record the highest values of DW on average inside Lake Ceresole are the one corresponding to the intake of the Orco Torrent (northwest), and the portion near the dam (southeast), where the water persists for the whole year. In the first case, the inflow can generate higher particle and substances concentration due to the mechanical action of river transport. Instead, in the second case, it happens that, mainly during spring, a portion of the lake more than 1.5 km long is uncovered by water, and here, the fine sediment that makes up the lake bed is easily transported in the water-covered area by the dual action of melting and flowing of the winter snow cover. The mean monthly maps of DW for Lake Ceresole (
Figure 4b) explicit, and further confirms the seasonal behaviour of LS and DW.


 ,
, 


