Abstract
This study aims to analyse the technical viability and economic feasibility of rainwater-harvesting systems for single- and multifamily residential buildings in the city of Florianópolis, Brazil. Simulations were conducted for representative buildings in the city under different water-usage scenarios and system designs, in a total of 36 simulation scenarios. An economic analysis was performed for four scenarios over a twenty-year period. Both initial and operational costs were considered, and the net present value, internal rate of return, and payback were used as feasibility indicators. For houses, between 60.1% and 74.8% of the cases were economically feasible, achieving a discounted payback period ranging from 6.2 to 8.6 years. For flats, between 57.8% and 64.2% of the cases were economically feasible, achieving a discounted payback period ranging from 4.8 to 5.6 years. As the water tariff in the city underwent changes recently, the former and current tariff formats were compared. The current tariff format provides more economic benefits for saving potable water, and leads to a higher net present value and a shorter discounted payback period. This research stands out from previous studies as it examines a new scenario in the use of rainwater-harvesting systems.
1. Introduction
In recent years, freshwater availability has been decreasing worldwide, a phenomenon driven by population growth and increased demands from the agriculture, industry, and energy sectors. Additionally, the impacts of climate change have led to drier conditions in various regions across continents [1]. In search of alternative sources, some strategies for using the water available within the city, such as greywater reuse, rainwater harvesting and, in the case of coastal cities, seawater desalination, have the potential to supply 15% to 80% of water demand in some locations [2].
Rainwater harvesting has been employed since ancient times and is currently considered an alternative to reduce the consumption of potable water in buildings in many countries [3,4,5,6,7,8]. When compared to other strategies such as water-saving devices and greywater reuse, rainwater harvesting has demonstrated more efficient results [9]. When combined, these three strategies achieve the highest potential for potable-water savings [10] while also contributing to energy savings in the city by reducing the water and sewage treatment needs for the utility company [11]. In addition to potable-water savings, rainwater harvesting also helps reduce flooding in regions with high soil impermeability, as part of the water that would normally be drained is collected and stored [12,13].
The global literature indicates that rainwater-harvesting systems have an average potential for potable-water savings of 53% [14]. In the city of Florianópolis, this potential ranges from 27% in June to 73% in February [15]. Other studies in the region suggest that the potential for single-family residential buildings varies between 28% and 43%, while for multifamily buildings, it ranges from 7% to 42% [4,9,16,17,18,19,20].
In terms of economic feasibility, the results are closely related to each individual situation, as some studies indicate that rainwater-harvesting systems can promote economic savings [8,16,18,20] while others conclude they are unfeasible [17,21,22]. Among the strategies to improve feasibility, studies suggest that government and public financial incentives can make rainwater systems more attractive to users [4,21,22]. In recent years, the tariff format of the water service provided by the company supplying Florianópolis underwent changes to encourage conscious water use. The current tariff format no longer considers a minimum water consumption of 10 m3 per dwelling and determines the water bill based on the actual volume consumed. This changes the way economic analyses of rainwater-harvesting systems are carried out and can impact the final feasibility results, as even dwellings with low consumptions may now achieve monetary savings. Thus, this research stands out from previous studies as it examines a new scenario in the use of rainwater-harvesting systems.
The overall objective of this study is to assess the economic feasibility of rainwater-harvesting systems for representative residential buildings in Florianópolis after the implementation of the current tariff format in the city.
2. Materials and Methods
In order to achieve the objectives of this study, information about the study area was gathered, including rainfall data, water-consumption data, details about dwellings, and population statistics. Subsequently, representative buildings similar to actual residential buildings in the city were conceived. Different scenarios for potable-water and rainwater use were also defined. Simulations were conducted using the Netuno programme, version 4, to estimate the potential for potable-water savings by means of rainwater harvesting in each of the representative buildings in all scenarios. More details on the algorithm of Netuno and its comparison with different methods can be found in references [23,24,25]. Finally, an economic analysis was performed for each case simulated to determine its feasibility, considering different water-tariff formats.
2.1. Study Area
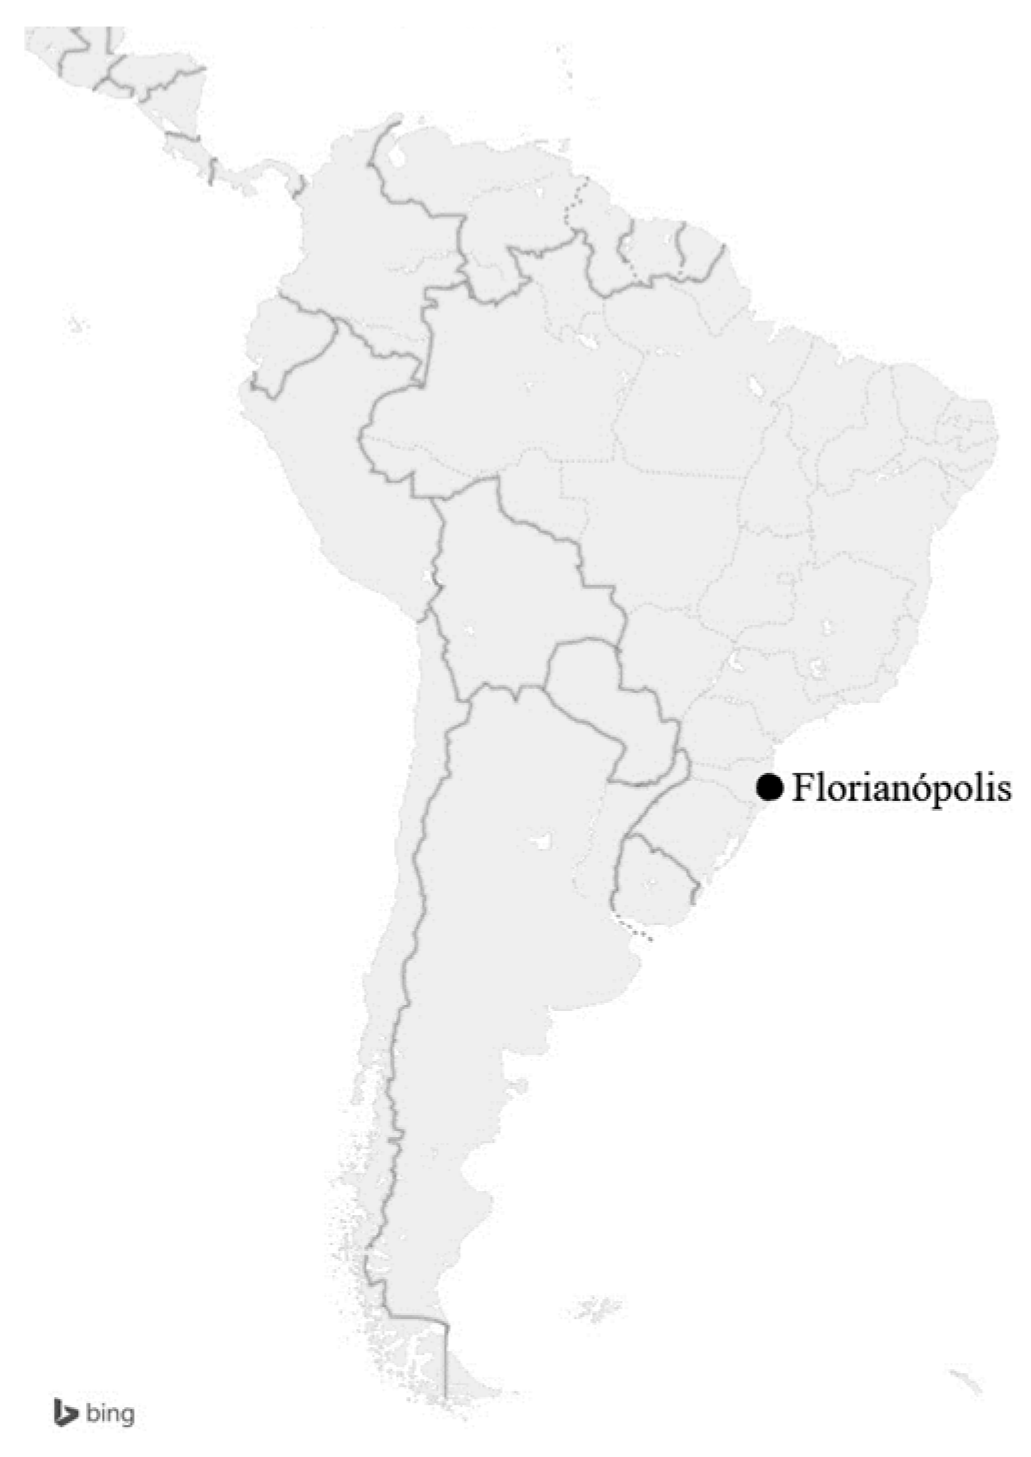
This study focuses on Florianópolis, Santa Catarina. The city has a population of 516,000 inhabitants, 675 square kilometres, and a population density of 623.68 inhabitants per square kilometre [26]. Its location is shown in Figure 1. According to the Köppen–Geiger classification, the city is situated in a subtropical climate region, characterised by hot summers, infrequent frosts, and a tendency for concentrated rainfall in the summer months, with no clearly defined dry season [27].

Figure 1.
Geographic location of Florianópolis.
2.2. Rainfall Data
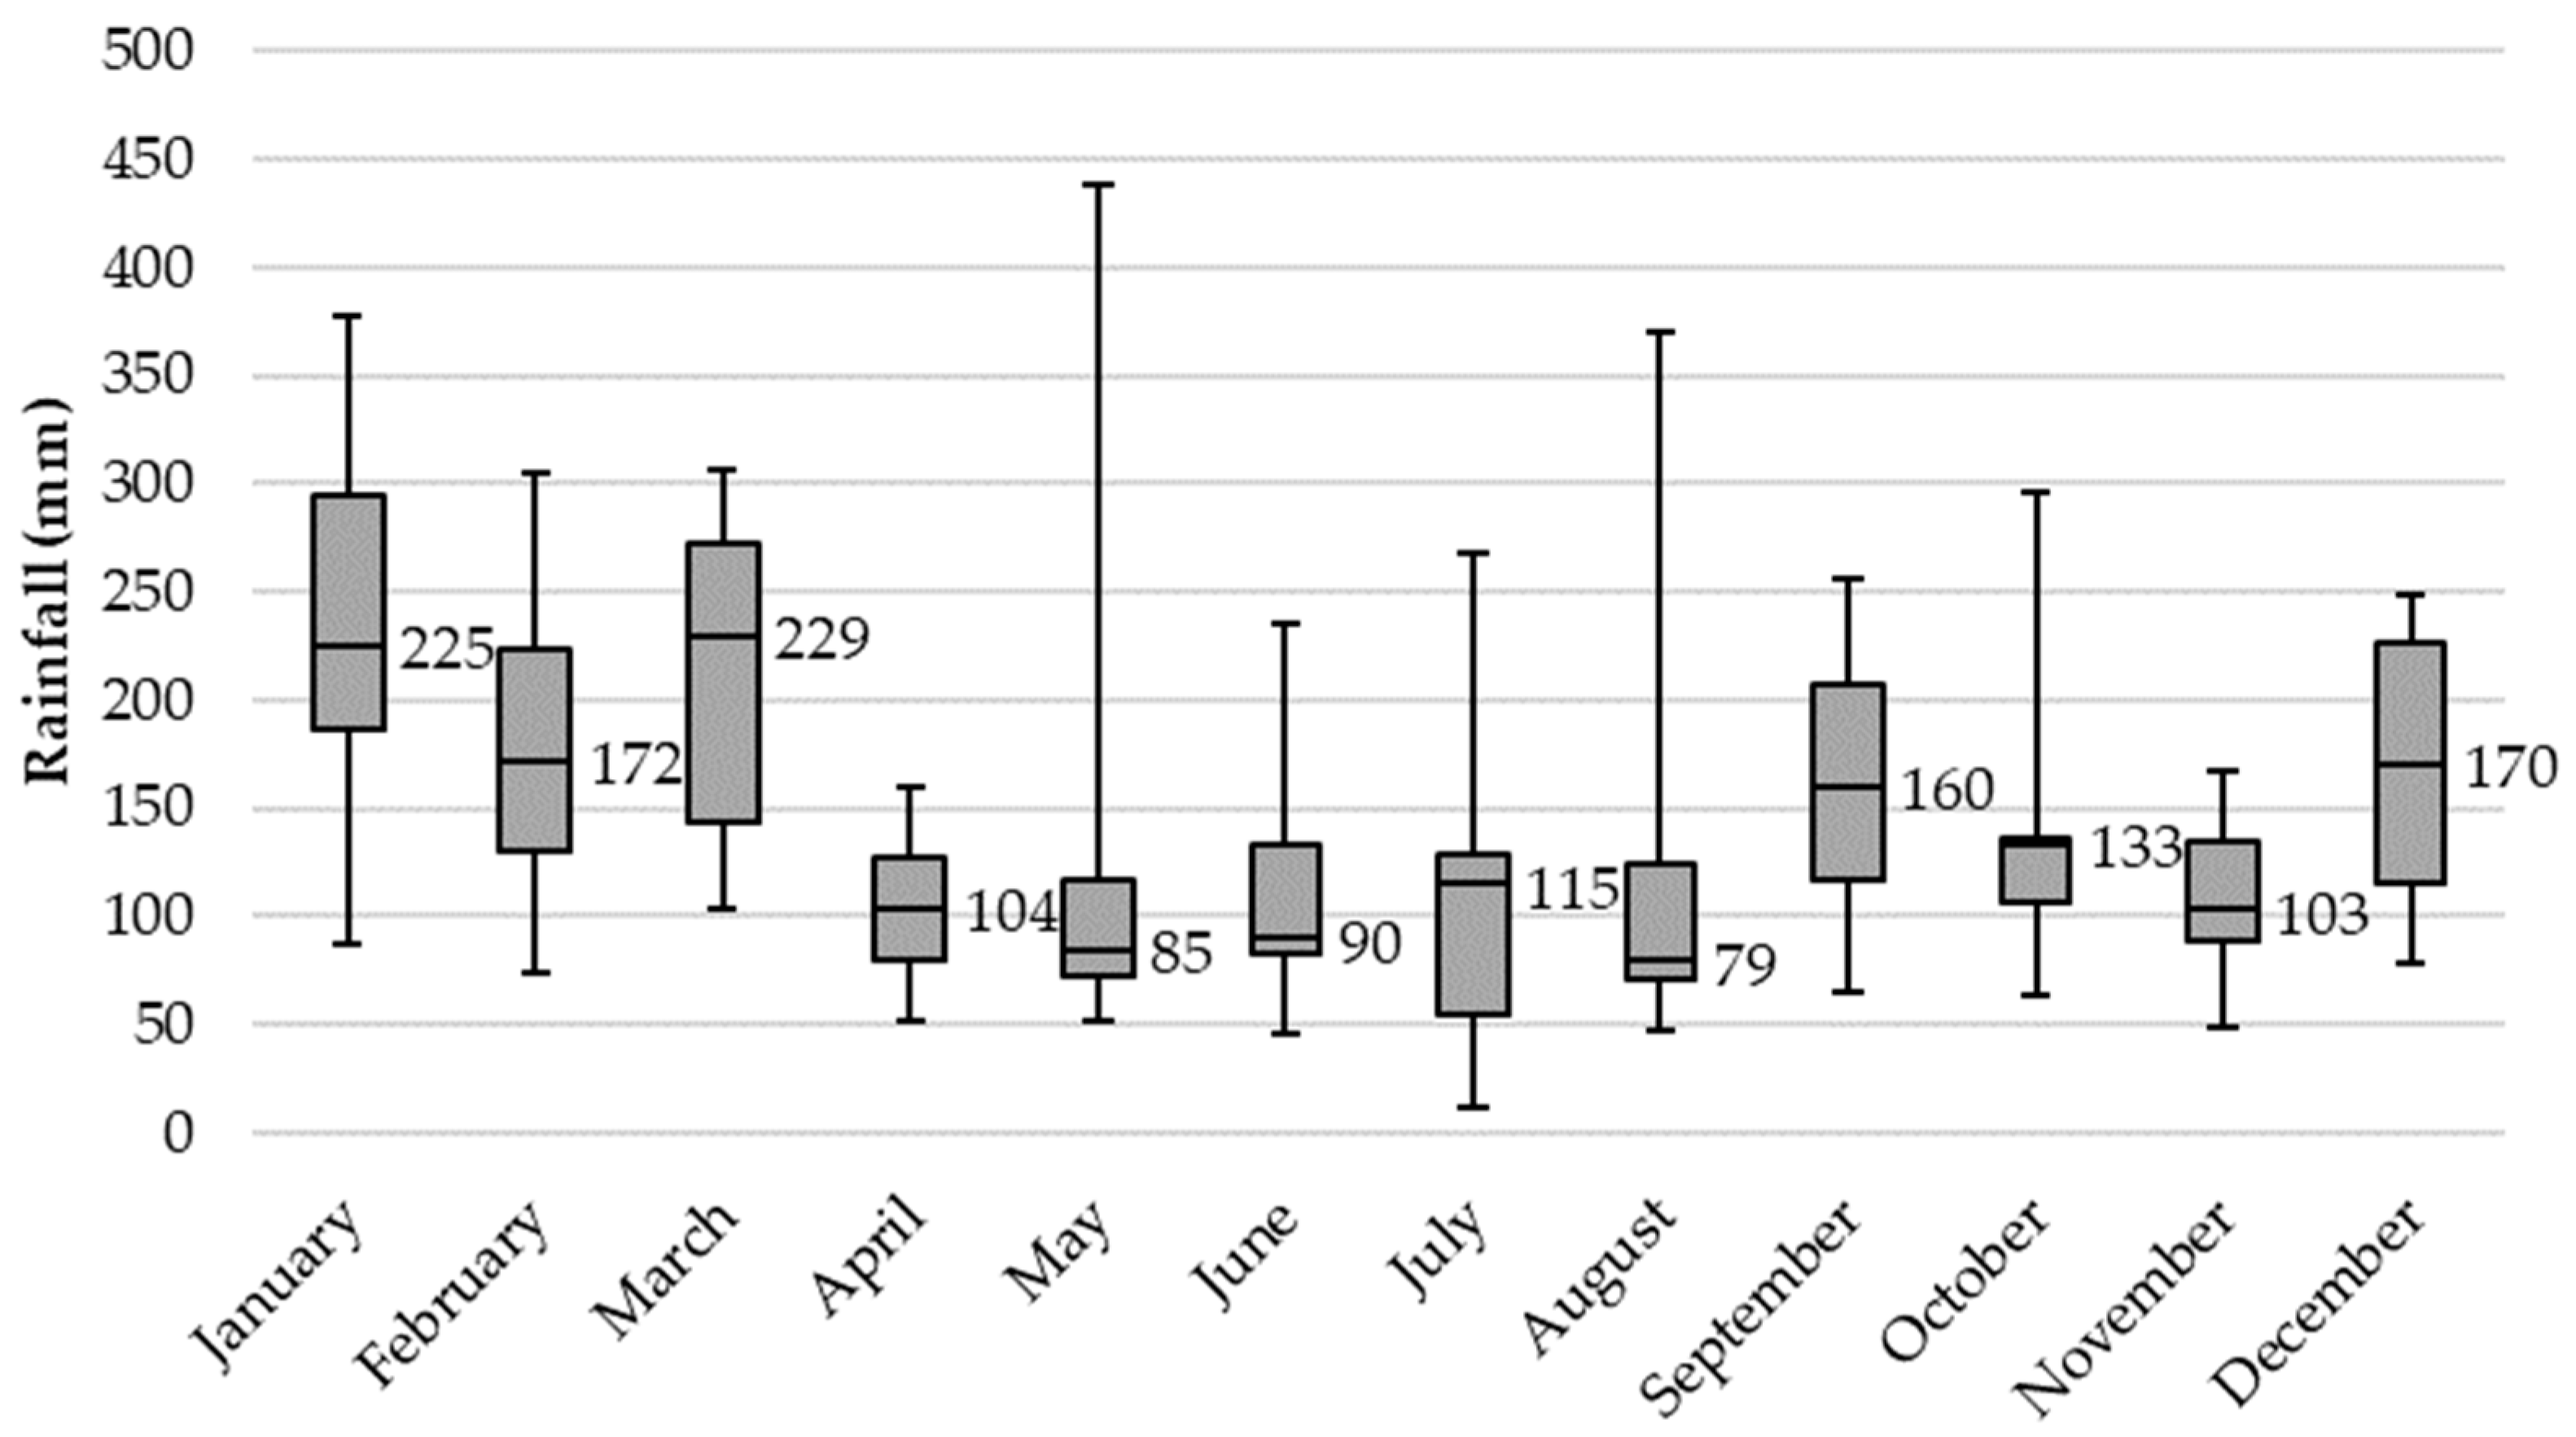
Daily records of rainfall volume in the city were obtained from the website of the National Institute of Meteorology [28]. A historical series spanning ten years, from 2009 to 2018, was used, as this was the most recent period with no significant registration gaps. Studies suggest that this time span is sufficient to obtain results as reliable as longer historical series [29,30,31]. Figure 2 shows the minimum, maximum, median, and upper and lower quartiles for the monthly rainfall for Florianópolis.

Figure 2.
Monthly rainfall in Florianópolis for the period between 2009 and 2018.
2.3. Simulation Scenarios
In order to consider variations in water consumption and in rainwater demand, different simulation scenarios were taken into account. Four different numbers of residents per household were considered based on the average number of residents per household in the city, which was obtained by dividing the city’s total inhabitants by the total number of dwellings in the city according to the study’s database, resulting in an average of 3.72 residents. Thus, simulations were conducted for 2, 3, 4, and 5 residents per dwelling. For flats, in order to simulate the building as a whole, the number of residents per flat was multiplied by the number of units on the lot. Also, three daily per capita water-consumptions were taken into account, i.e., 100, 150, and 200 L, based on the average in the city, according to the data gathered by the water company [32].
To vary the rainwater demand, three rainwater-harvesting system designs were conceived. Design 1 is a system intended to meet the demand for cleaning activities and external uses, representing on average 5% of household consumption. Design 2 is a system intended to meet only the demand for toilet flushing, considered to be 30% of a household consumption. Design 3 aims to meet the demand for all non-potable activities, including toilet flushing, washing machines, cleaning activities, and external uses, resulting in 50% of total household consumption. The rainwater-demand percentages for each activity were based on the literature’s data [9,16,17,18,20,32,33,34].
By combining the daily per capita water consumption, the number of residents per household, and the rainwater demand for each system design, 36 simulation scenarios were created.
2.4. Representative Buildings
The data on the dwellings were obtained through electronic contact with the municipal department responsible for the territorial management of the city. The information was processed and compiled into a database organised by lots. For each lot, information on the typology of the buildings constructed on it, the quantity of registered dwellings, and the sum of the horizontal projection area of all roofs was available. In total, the processed database contains 54,606 lots and 138,685 dwellings.
One of the main parameters for estimating the potable waterpotable-water savings due to rainwater harvestingrainwater-harvesting systems is the catchment area, which in this study was considered determined as using the building roofs. To determine the roof areas inputted in the simulations, representative buildings were conceived from the database.
Initially, the database was divided according to the typology of the buildings registered in the lots, resulting in two groups: houses or flats. For the group of houses, all lots registered according to this typology were considered. When there was only one dwelling registered on it, each lot was considered as a single building with a roof area equal to the total horizontal projection area of the lot. When there was more than one dwelling registered on the lot, it was considered that each dwelling represented a building with an average roof area obtained by dividing the sum of the horizontal projection area of all roofs on the lot by the number of dwellings registered on it.
For the group of flats, all lots registered with this typology were considered a single building with multiple dwellings and a roof area equivalent to the total horizontal projection area of the lot. The group of flats was later divided into subgroups according to the number of flats per building.
Next, a frequency distribution analysis of the group of houses and subgroups of flats according to the building roof area was carried out, establishing roof-size categories. The number of categories was defined through statistic formulas [35], which were based on the number of buildings in each group. For the group of houses, the number of categories into which the group was divided was determined according to Rice’s formula, which is an alternative to Sturges formula, using Equation (1) [36].
where
- is the number of categories;
- is the number of buildings in the group.
The group of houses was then divided into k categories with equal intervals. For each category, a representative building was chosen, corresponding to all buildings within its interval, with its roof area being the average of the roof area of all real buildings in the interval.
For flats, each subgroup was divided into categories according to the square root formula, using Equation (2) [35].
where
- is the number of categories;
- is the number of buildings in the subgroup.
In this case, the categories were divided into non-equal intervals according to the natural breaks method, which seeks to minimise variance within categories and maximise differences between them. For this, the Excel Real Statistics Resource Pack extension was used [37]. A representative building was also chosen for each category, with a roof area equal to the average of all buildings in the interval. The choice of formulas was based on what seemed more suitable for each group given its number of buildings, so it would provide a satisfactory number of categories for use in simulations.
2.5. Rainwater HarvestingRainwater-harvesting Systems’ Simulation
The main components of rainwater harvestingrainwater-harvesting systems are the catchment area, which is usually the roof, water pipes and sometimes pumps, devices for disinfection, and storage tanks [12]. The simulation of rainwater harvestingrainwater-harvesting systems was conducted using the Netuno programme, which presents the results of the potential for potable waterpotable-water savings by using rainwater in relation to the storage- tank capacity. Its methodology is based on behavioural models, and all its equations can be found in [23,24,25]. The input parameters included daily rainfall data, the first flush, the catchment area, daily per capita water consumption, the number of residents, the rainwater demand, and the runoff coefficient. Daily rainfall data were obtained from the INMET website [28]. The first flush was set at 2 mm, following the Brazilian standard for rainwater harvestingrainwater-harvesting systems [38]. The catchment area was considered as to be the roof area of the representative building. The number of residents, daily per capita water consumption, and rainwater demand were considered according to each scenario. The runoff coefficient considered was 0.8, as it is the average value for ceramic- tile or fibre-cement roofs [39].
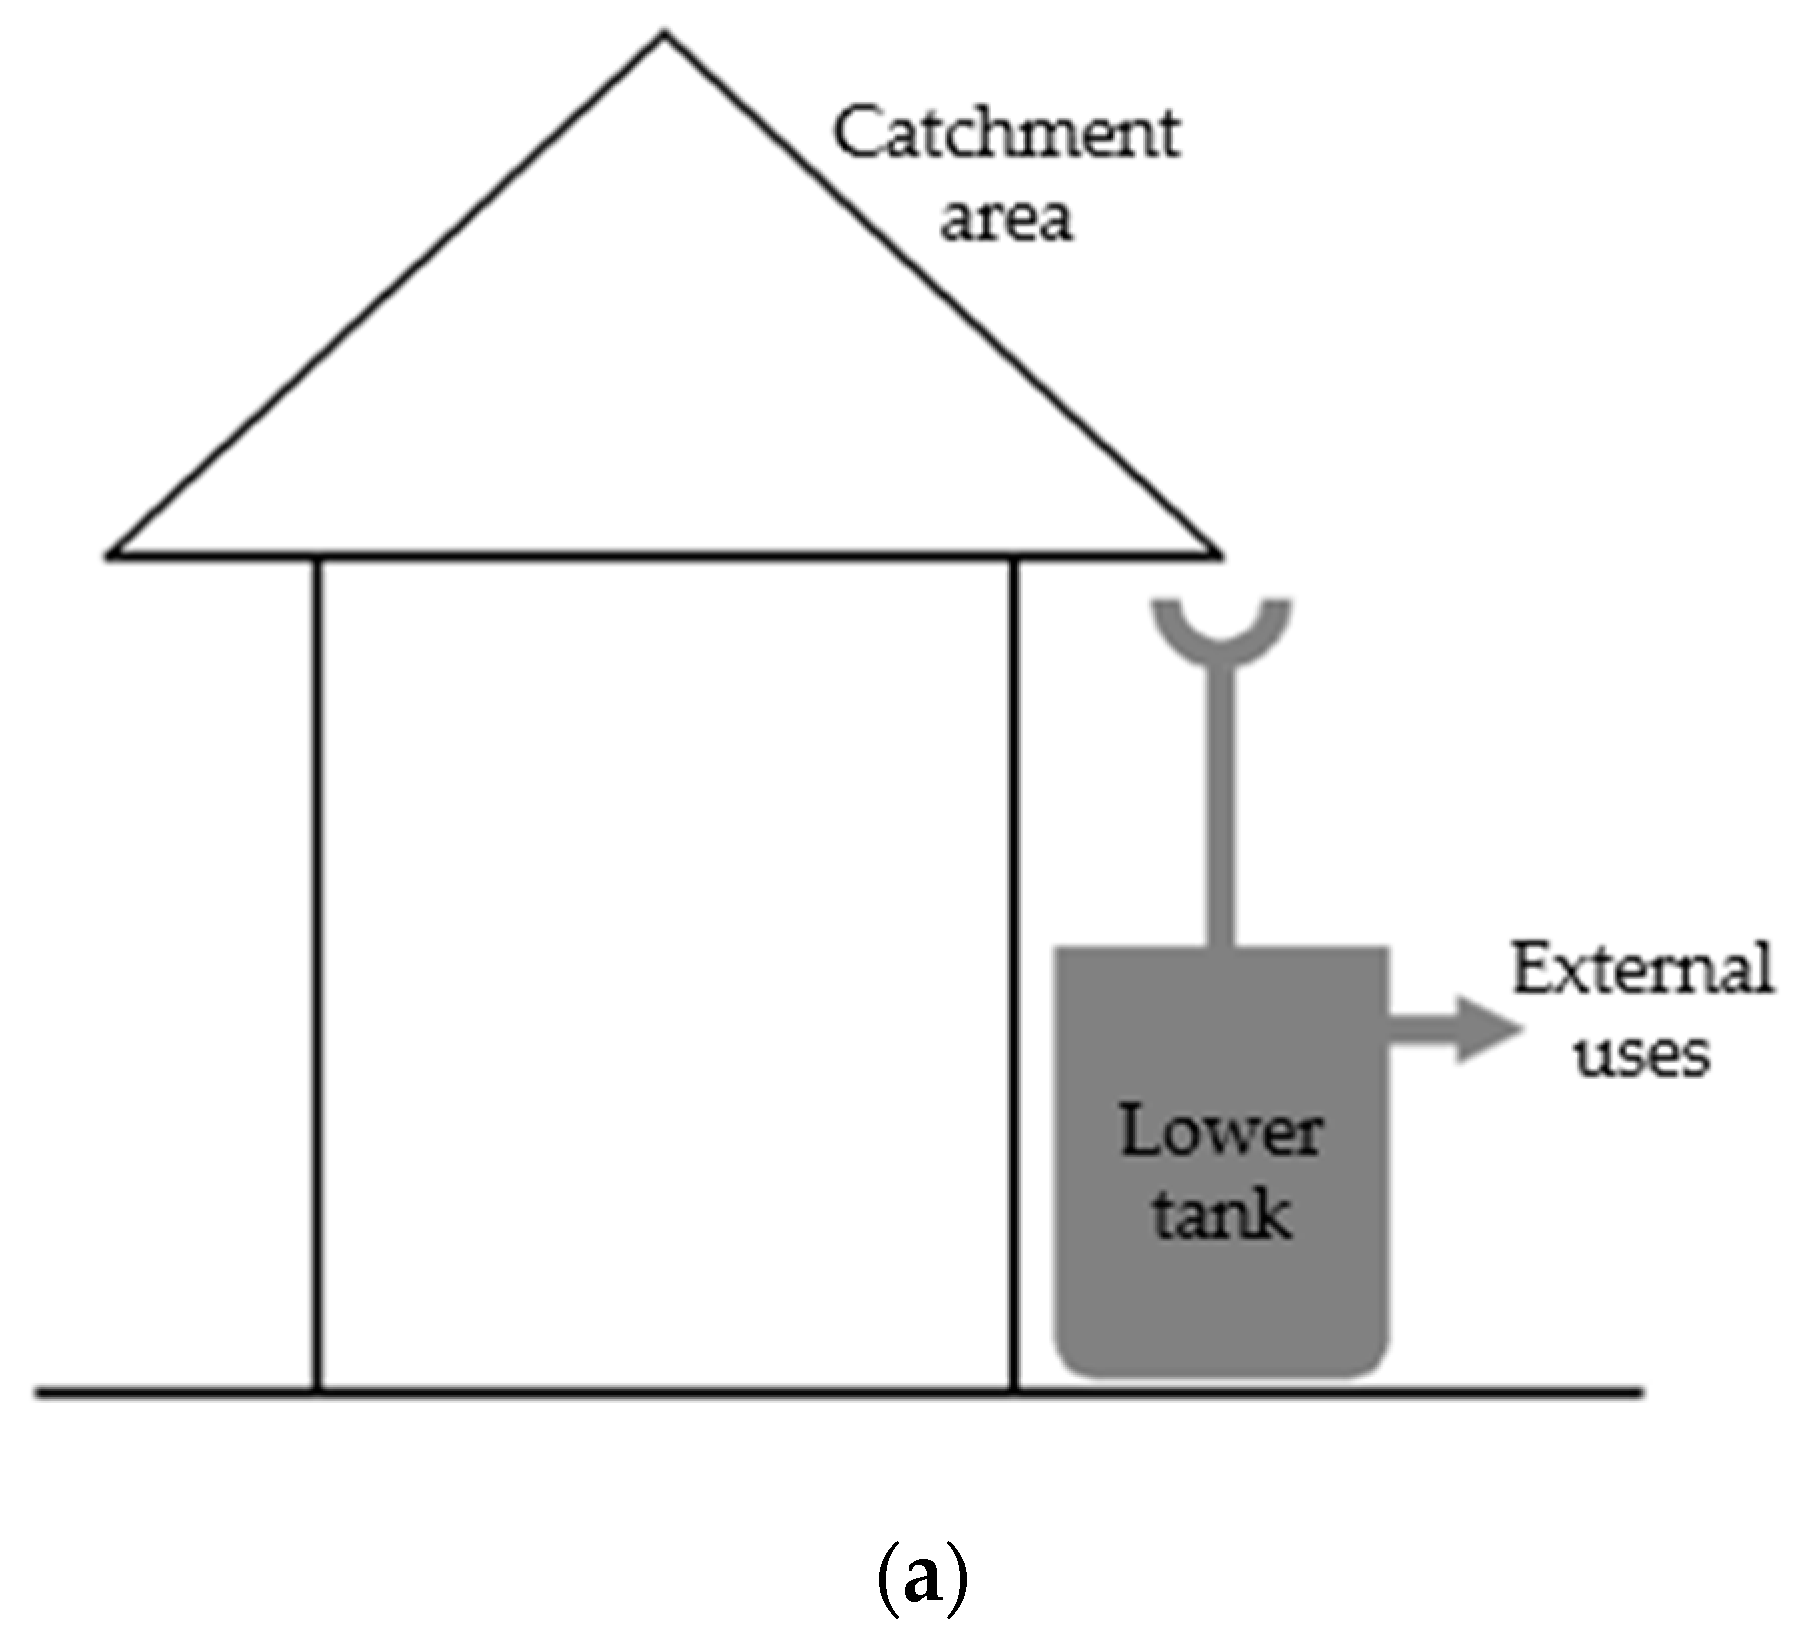
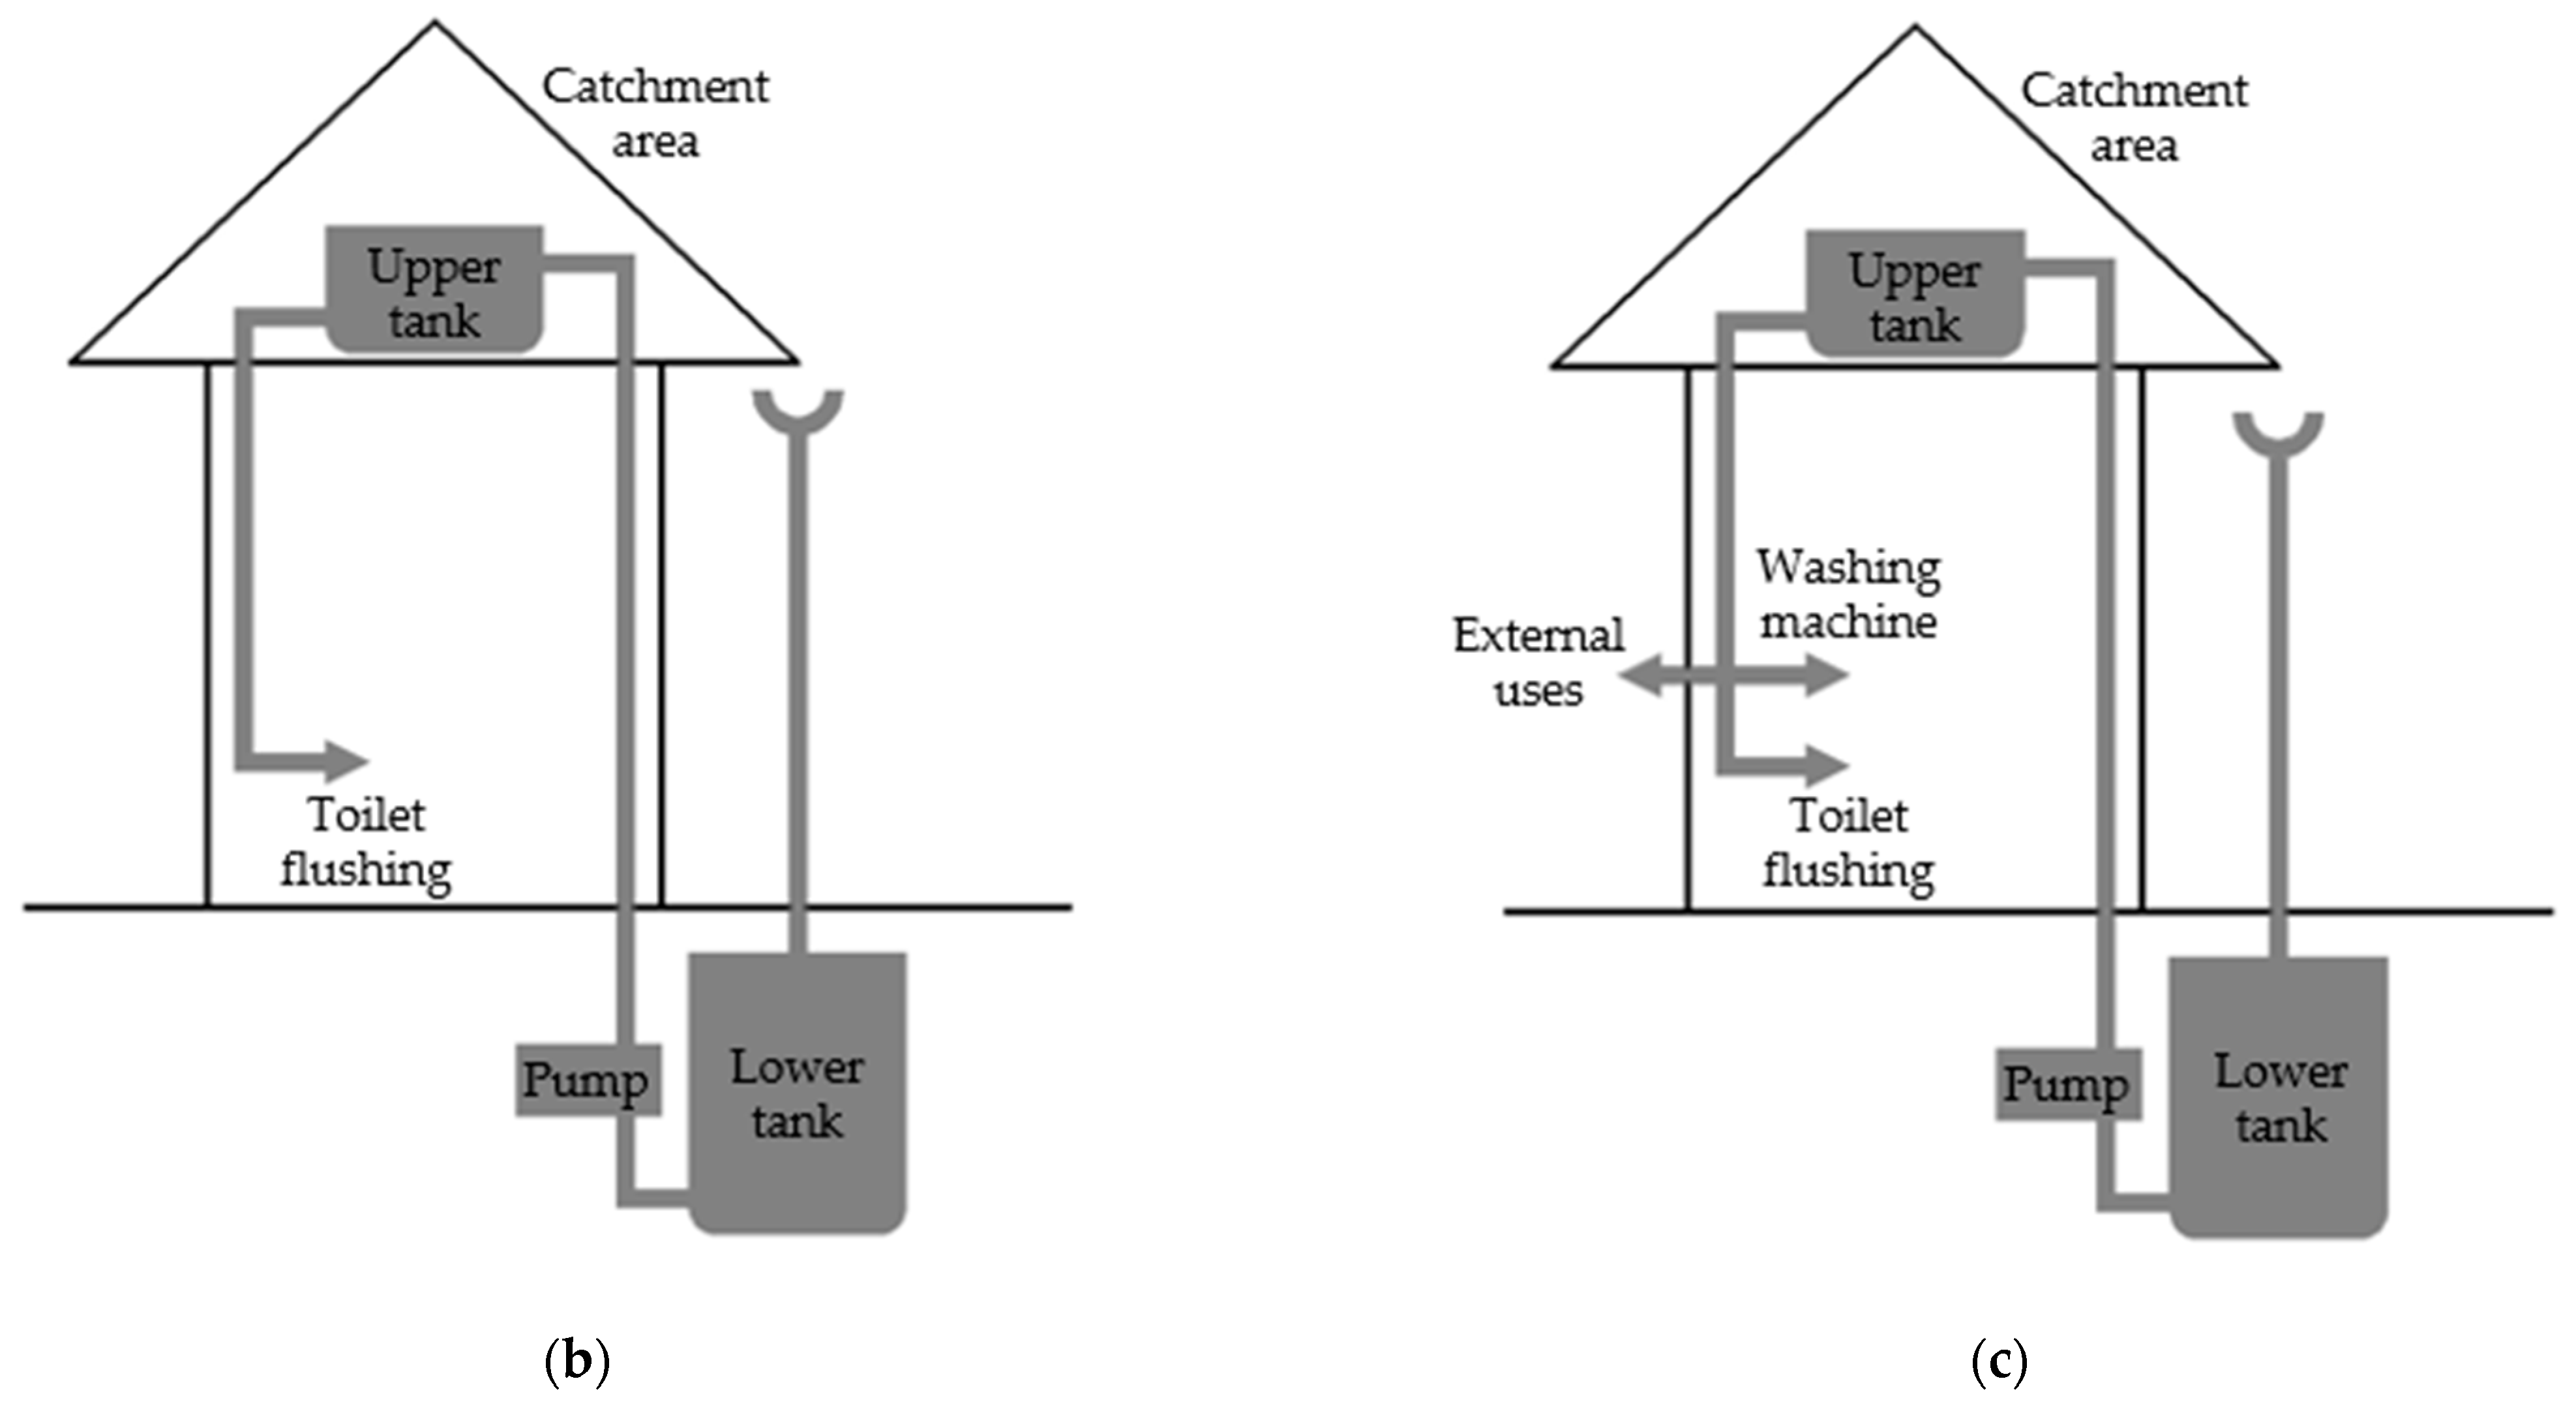
During the simulation, in order to determine the potable waterpotable-water savings, it was necessary to size measure the rainwater- storage tanks. For houses in scenarios with system design 1, only one lower tank defined by the programme was considered. For houses in scenarios with designs 2 and 3, and for flats in all scenarios, two tanks were considered: a larger lower tank that supplies an upper tank by means of a pump. In these cases, the capacity of the upper tank was considered to meet the daily rainwater demand of the building, while the size of the lower tank was defined according to the ideal capacity suggested by the programme. Figure 3 shows the configuration of the system designs. In scenarios with system design 1, the lower tank was simulated for capacities between 100 and 5000 L for houses and 100 and 15,000 L for flats, both varying in intervals of 100 L. For scenarios with designs 2 and 3, capacities between 1000 and 15,000 L were simulated for houses and between 1000 and 60,000 L for flats, both varying in intervals of 1000 L. In all simulations, the ideal tank capacity was indicated when the difference in potable waterpotable-water savings was less than 1%/m3 while varying the tank capacity.

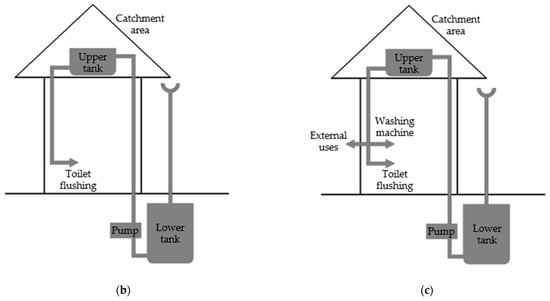
Figure 3.
(a) System design 1; (b) system design 2; and (c) system design 3.
As a result of the simulations, the potential for potable waterpotable-water savings of for each representative building for each scenario was obtained. This represents the percentage of potable water that can be replaced with rainwater. The size of the lower tank was also determined, being the capacity indicated as ideal by the Netuno programme.
2.6. Technical Viability Assessment
From the results of the simulations, the technical viability of different system designs was analysed. The system was deemed technically viable when the potential for potable-water savings reached at least 90% of the rainwater demand of the system design. This was determined because if the system did not reach the designed rainwater demand, then a different design would be more suitable. Thus, cases that achieved the following were considered technically viable: 4.5% potential water savings for design 1, which aims to supply rainwater to meet the demand for cleaning activities and external uses, equivalent to a rainwater demand of 5% of the household water demand; 27% for design 2, to supply the demand for toilet flushing, equivalent to 30% of the household water demand; and 45% for design 3, to supply all non-potable activities in the dwelling, equivalent to 50% of the household water demand. The average potential for potable-water savings of the unviable cases was also assessed by calculating the arithmetic average of the potable-water savings of the cases that did not reach technical viability.
From the technical viability, a new parameter was formulated in order to analyse the catchment area necessary to collect one cubic metre of rainwater per month. Using Equation (3), the catchment area per cubic metre of rainwater was calculated for each simulation deemed technically viable. The roof area, the number of residents, and the total daily per capita water consumption are all input data of the simulation, while the potential for potable-water savings is the result of the simulation and already considers the rainfall, which is also an input parameter of the simulation. Thus, the minimum catchment area necessary to collect one cubic metre of rainwater per month in the city was considered to be the smallest value obtained for this parameter among the technically viable simulations. This parameter is exclusively related to the specific situation of the city and the data used in the simulations.
where
- is the catchment area per cubic metre of rainwater (m2/m3);
- is the roof area of the representative building simulated (m2);
- is the number of residents in the scenario simulated;
- is the total daily per capita water consumption in the scenario simulated (litres);
- is the potential for potable-water savings (%).
2.7. Economic Feasibility Assessment
The economic feasibility analysis was conducted using an Excel spreadsheet. Costs were estimated for both the installation of the rainwater-harvesting system, referred to as initial costs, and the expenses associated with its operation, the operational costs. Both costs were calculated individually for each simulated system, as they differ depending on the model, the tank capacity, and the water-consumption results.
The initial costs included expenses on materials and labour. The materials considered were the lower and upper tanks, which were polyethylene water tanks, the pump, and other accessories such as PVC pipes, excluding gutters. Pumps were not accounted for in the simulations of houses under scenarios with system design 1, as this design does not require water pumping since it only has a lower tank. Material prices were determined through market research from local stores and suppliers, and labour costs were obtained from the National System of Costs and Construction Indexes (SINAPI) for October 2021 in the state of Santa Catarina. As accessories’ costs depend on the system design, it was estimated that these components represent 15% of the initial cost, i.e., the cost of tanks, pump, and labour, as in [8].
Operational costs included energy for the pump operation, supplies for water treatment, and system maintenance. Chlorine tablets were considered to be part of water treatment, with the cost per cubic meter of treated water being obtained through local store research. The annual maintenance cost for the system was estimated at 1% of the initial cost, as in [40], and is meant to account for any repair needed for the system. The operation energy cost was obtained from the pump characteristics, the monthly pumped water volume, and the energy tariff price. The energy tariff price with taxes applied was obtained from the website of the local energy supplier for December 2021 [41]. The water volume pumped is equivalent to the system’s monthly rainwater consumption.
On the other hand, the economic benefit was obtained by means of the reduction in the water and sewage bill resulting from potable-water savings. Based on the daily per capita water consumption and the number of residents per dwelling in each scenario, the total water consumption for the dwelling was calculated over a month by multiplying such values by 30 days. Thus, the water and sewage bill without the rainwater-harvesting system was calculated based on the tariff prices and the monthly total water consumption for the dwelling. Subsequently, the monthly potable-water savings by the system was subtracted from the monthly total water consumption, and the water and sewage bill was recalculated. The difference in the bills with and without the rainwater-harvesting system resulted in the monthly monetary savings.
Analyses were conducted considering both the former water-tariff format and the current one to compare whether the system’s viability is altered and which one brings more benefits to users. The former tariff format charged a minimum fee for consumption up to 10 m3, beyond which the amount was charged per each m3 of water consumed, varying in consumption intervals. The current tariff format, implemented in 2020, no longer has a minimum consumption, charging a fixed fee for infrastructure availability and fees per m3 of water consumed, also varying in intervals. Tariff values for 2019, representing the former tariff format, and 2021, the current one, were used. These values were obtained from the water company’s website [42].
An annual cash flow was formed for a twenty-year period, as in [8], and the discounted payback, internal rate of return (IRR), and net present value (NPV) were used as feasibility indicators. These indicators were calculated using the corresponding functions in the Excel spreadsheet, which are based on Equation (4) [43]. Both the IRR and discounted payback are obtained based on the NPV, i.e., the IRR is the rate of return in which the NPV equation is equal to zero, and the discounted payback is the year of the cashflow in which the NPV becomes positive.
where
- is the net present value (R$);
- is the total period of the investment (years);
- is the year of the cashflow (years);
- is the cash flow for the tth period (R$);
- is the rate of return (%).
For the cash flows, a minimum attractive rate of return (MARR) was considered and the water and electricity tariffs were adjusted every year according to the inflation. The inflation used was the Broad Consumer Price Index (IPCA), which is the official government index, and the MARR considered was the Selic index, on which the interest rates of savings accounts in Brazil are based. Four different economic scenarios were evaluated: one pessimistic, one optimistic, and two averages. The pessimistic scenario considered the highest inflation of the last twenty years, and the optimistic scenario the lowest, alongside the Selic index of the same year. One of the average scenarios, called the 2001–2020 average scenario, considered the average inflation and Selic of the last twenty years, while the other, called the 2019–2020 average scenario, considered the averages only of the last two available years. For this, the IPCA and Selic index were obtained from the Central Bank website [44,45]. As the Selic varies throughout the months, the value considered was the one valid on December 31 of each year. Table 1 shows the scenarios evaluated. The pessimistic scenario occurred in 2002, and the optimistic one in 2017; the 2001–2020 average considered values between 2001 and 2020, and the 2019–2020 average considered values from 2019 and 2020. To compare tariff formats, only the 2019–2020 average scenario was used.

Table 1.
Economic feasibility assessment scenarios.
The economic analysis was conducted for each case simulated. For the flat group, despite simulations being performed as collective systems and considering water consumption for the entire building, the economic analysis was carried out for each flat. Therefore, individual water bills were considered, with the average water consumption for the building, and the initial and operational system costs were divided among the flats in the building. Finally, the economic feasibility of each case was examined. The investment was considered economically feasible when the discounted payback was less than the analysis period, the NPV was positive, and the IRR was greater than the MARR.
3. Results
3.1. Representative Buildings
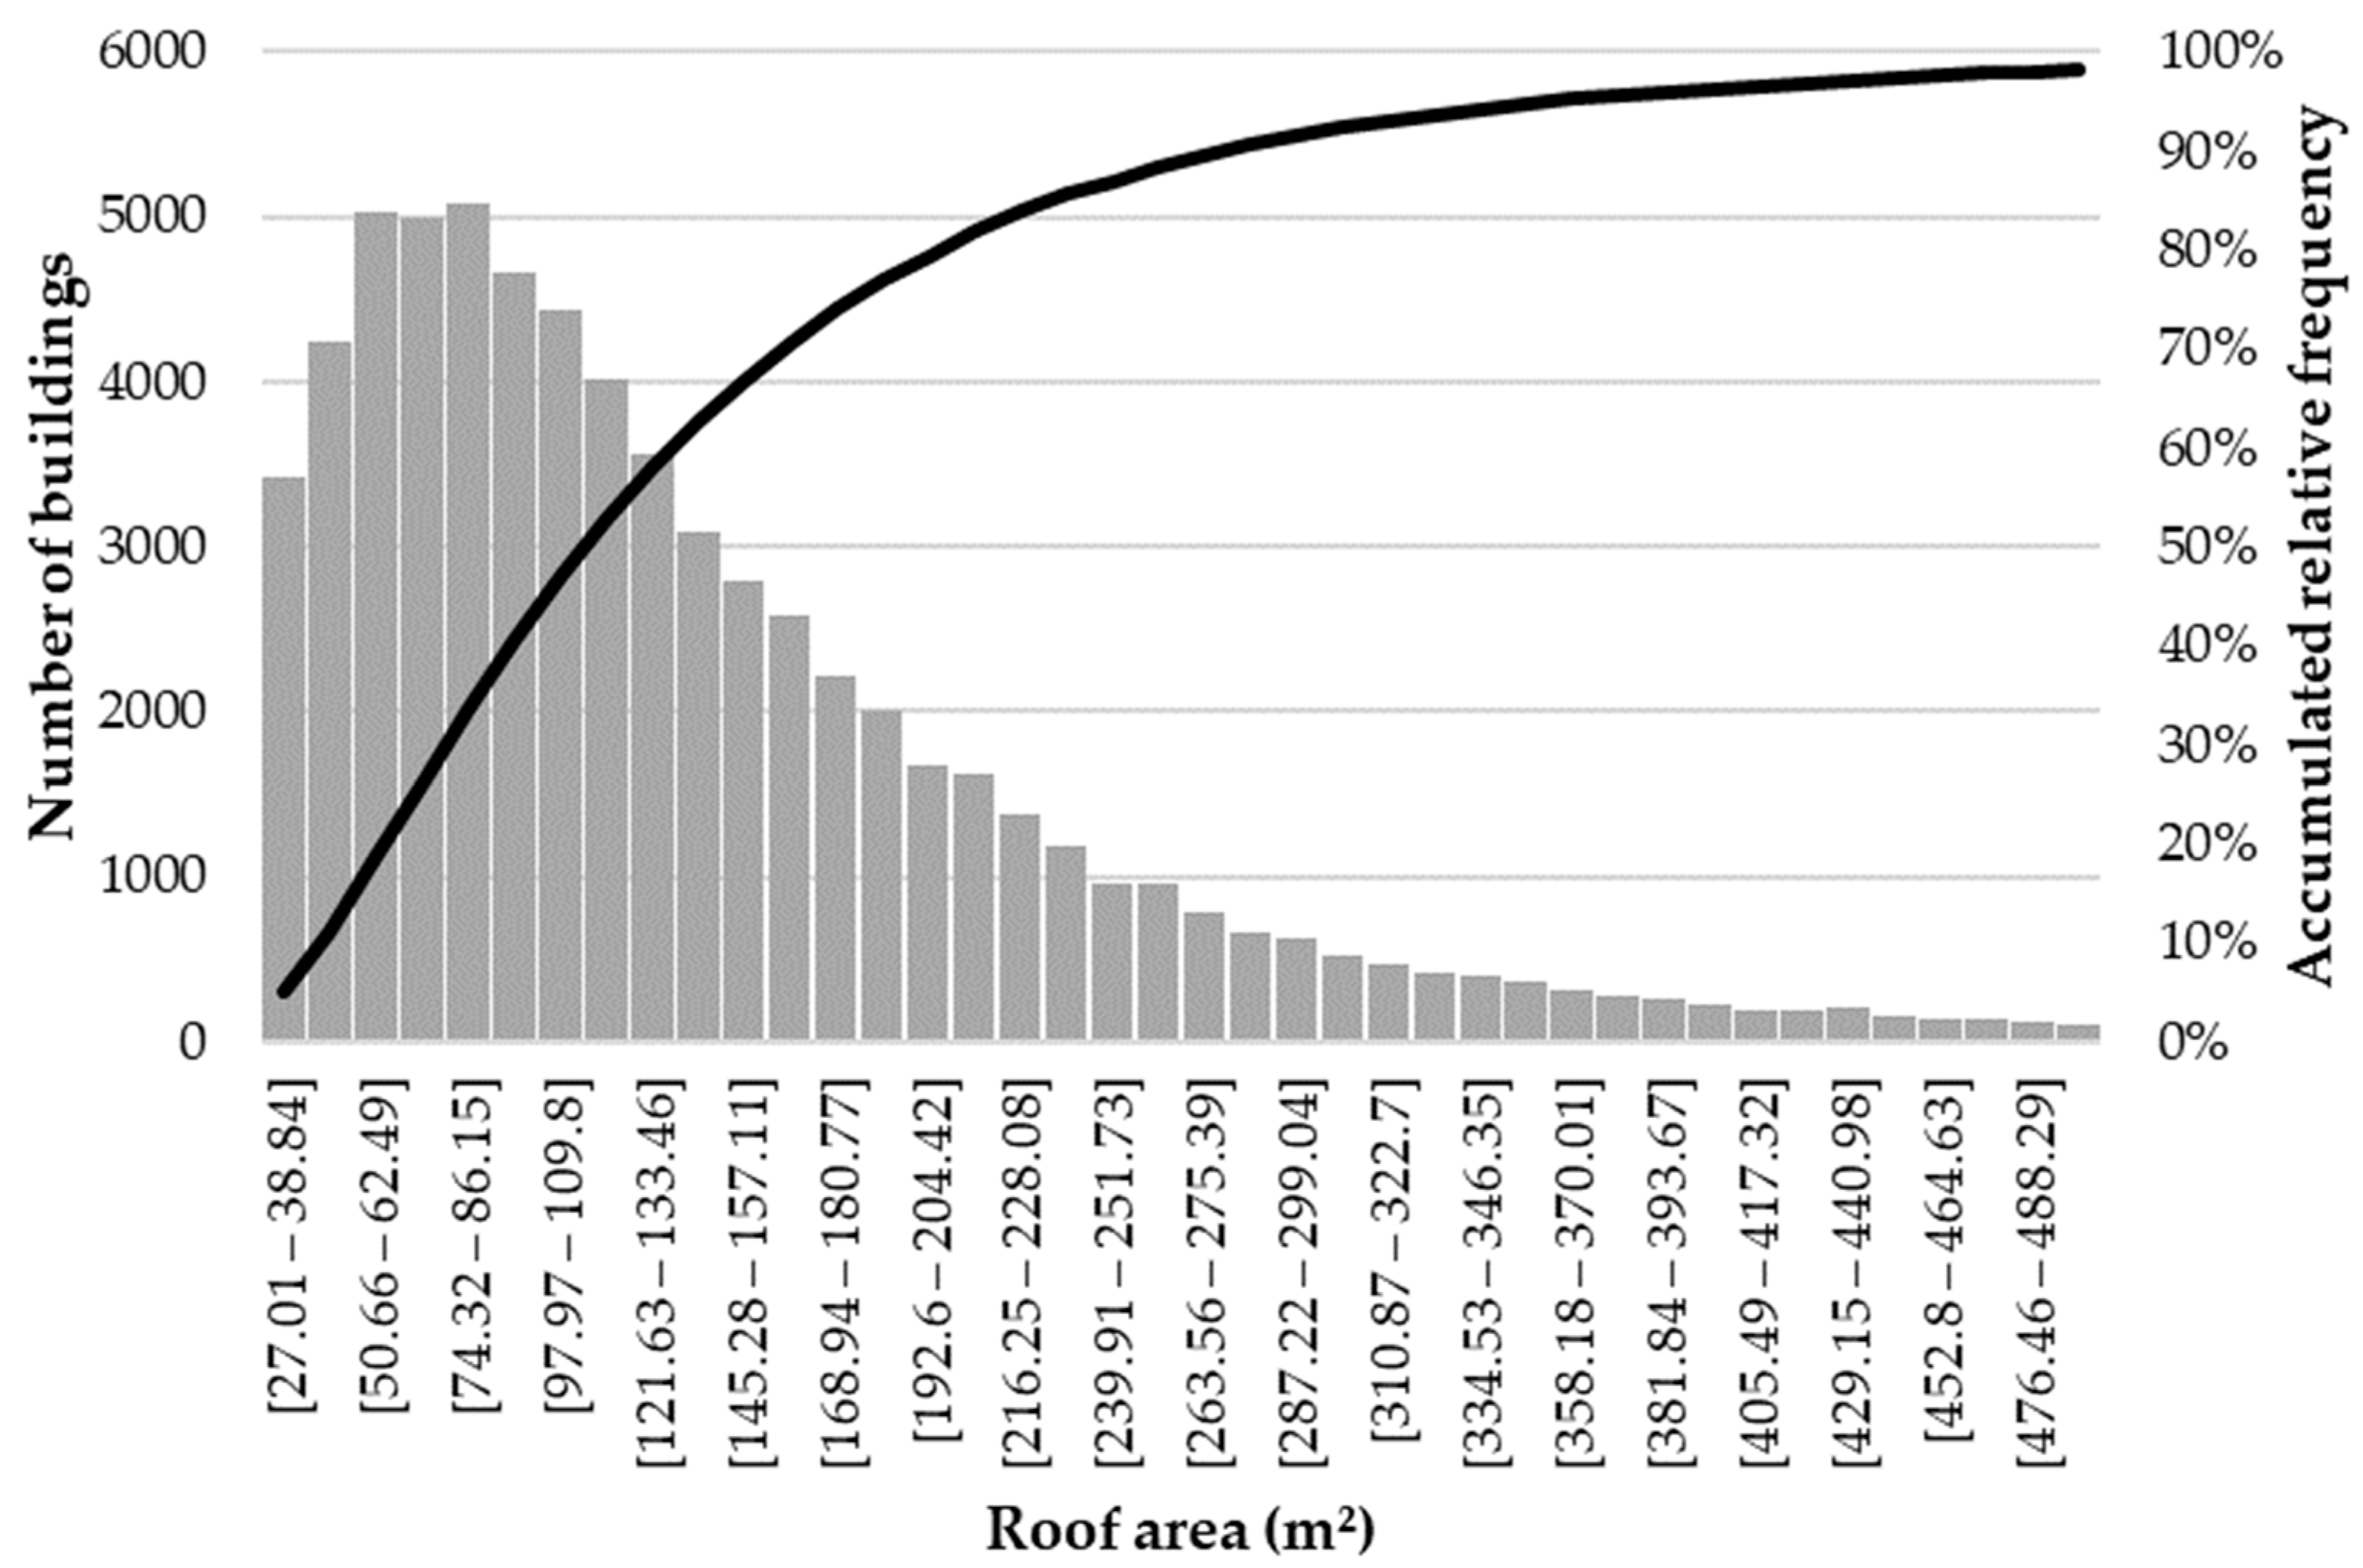
For the group of houses, the database contains 67,784 units, with roof areas ranging from 27.01 m2 to 996.88 m2. Thus, 82 categories were established, arranged into equal intervals of 11.83 m2 each. Therefore, 82 representative buildings were chosen, one for each category, with their roof areas being the averages of the real buildings’ roof areas within the category. Each representative building corresponds to a percentage of real houses in the city. Figure 4 shows the frequency distribution of the first 40 categories, encompassing buildings with a roof area of up to 500 m2. Approximately 47% of the houses have a roof area lower than 110 m2, and less than 2% have an area exceeding 500 m2.

Figure 4.
Frequency distribution of the group of houses based on roof area.
For the group of flats, the database comprises 2248 buildings with varying number of flats, ranging from 2 to 795 flats per building. However, only buildings with up to 110 flats were considered, representing 95% of the multifamily buildings. Thus, 107 subgroups of flats were obtained. For each subgroup, the frequency distribution was conducted based on the roof area of each building. Therefore, 443 representative buildings were chosen, with a roof area equal to the average roof area of the real buildings within the category, and this area was used in the simulations. Each representative building corresponds to a percentage of the flats in its subgroup, which corresponds to a percentage of the total flats in the city. Approximately 70% of the multifamily buildings have up to 30 flats, indicating a predominance of smaller multifamily buildings in the city.
3.2. Potential for Potable-water Savings
From the representative buildings, it was possible to assess the potential for potable-water savings for different scenarios. For the group of houses, 82 representative buildings were simulated in the 36 scenarios, resulting in 2952 simulation cases. Technical viability was analysed for each case to determine if the system simulated achieved a potential for potable-water savings close to the rainwater demand. Table 2 summarises the results: 100% of the cases were viable for using rainwater to meet the demand for cleaning and external uses, i.e., for design 1; 98.6% to supply the demand for toilet flushing, in design 2; and 95.0% for all non-potable activities in the dwelling, in design 3. Of the cases that did not reach technical viability, the average potential for potable-water savings was 21.3% and 33.6% for designs 2 and 3, respectively.
Table 2.
Technical viability for the group of houses.
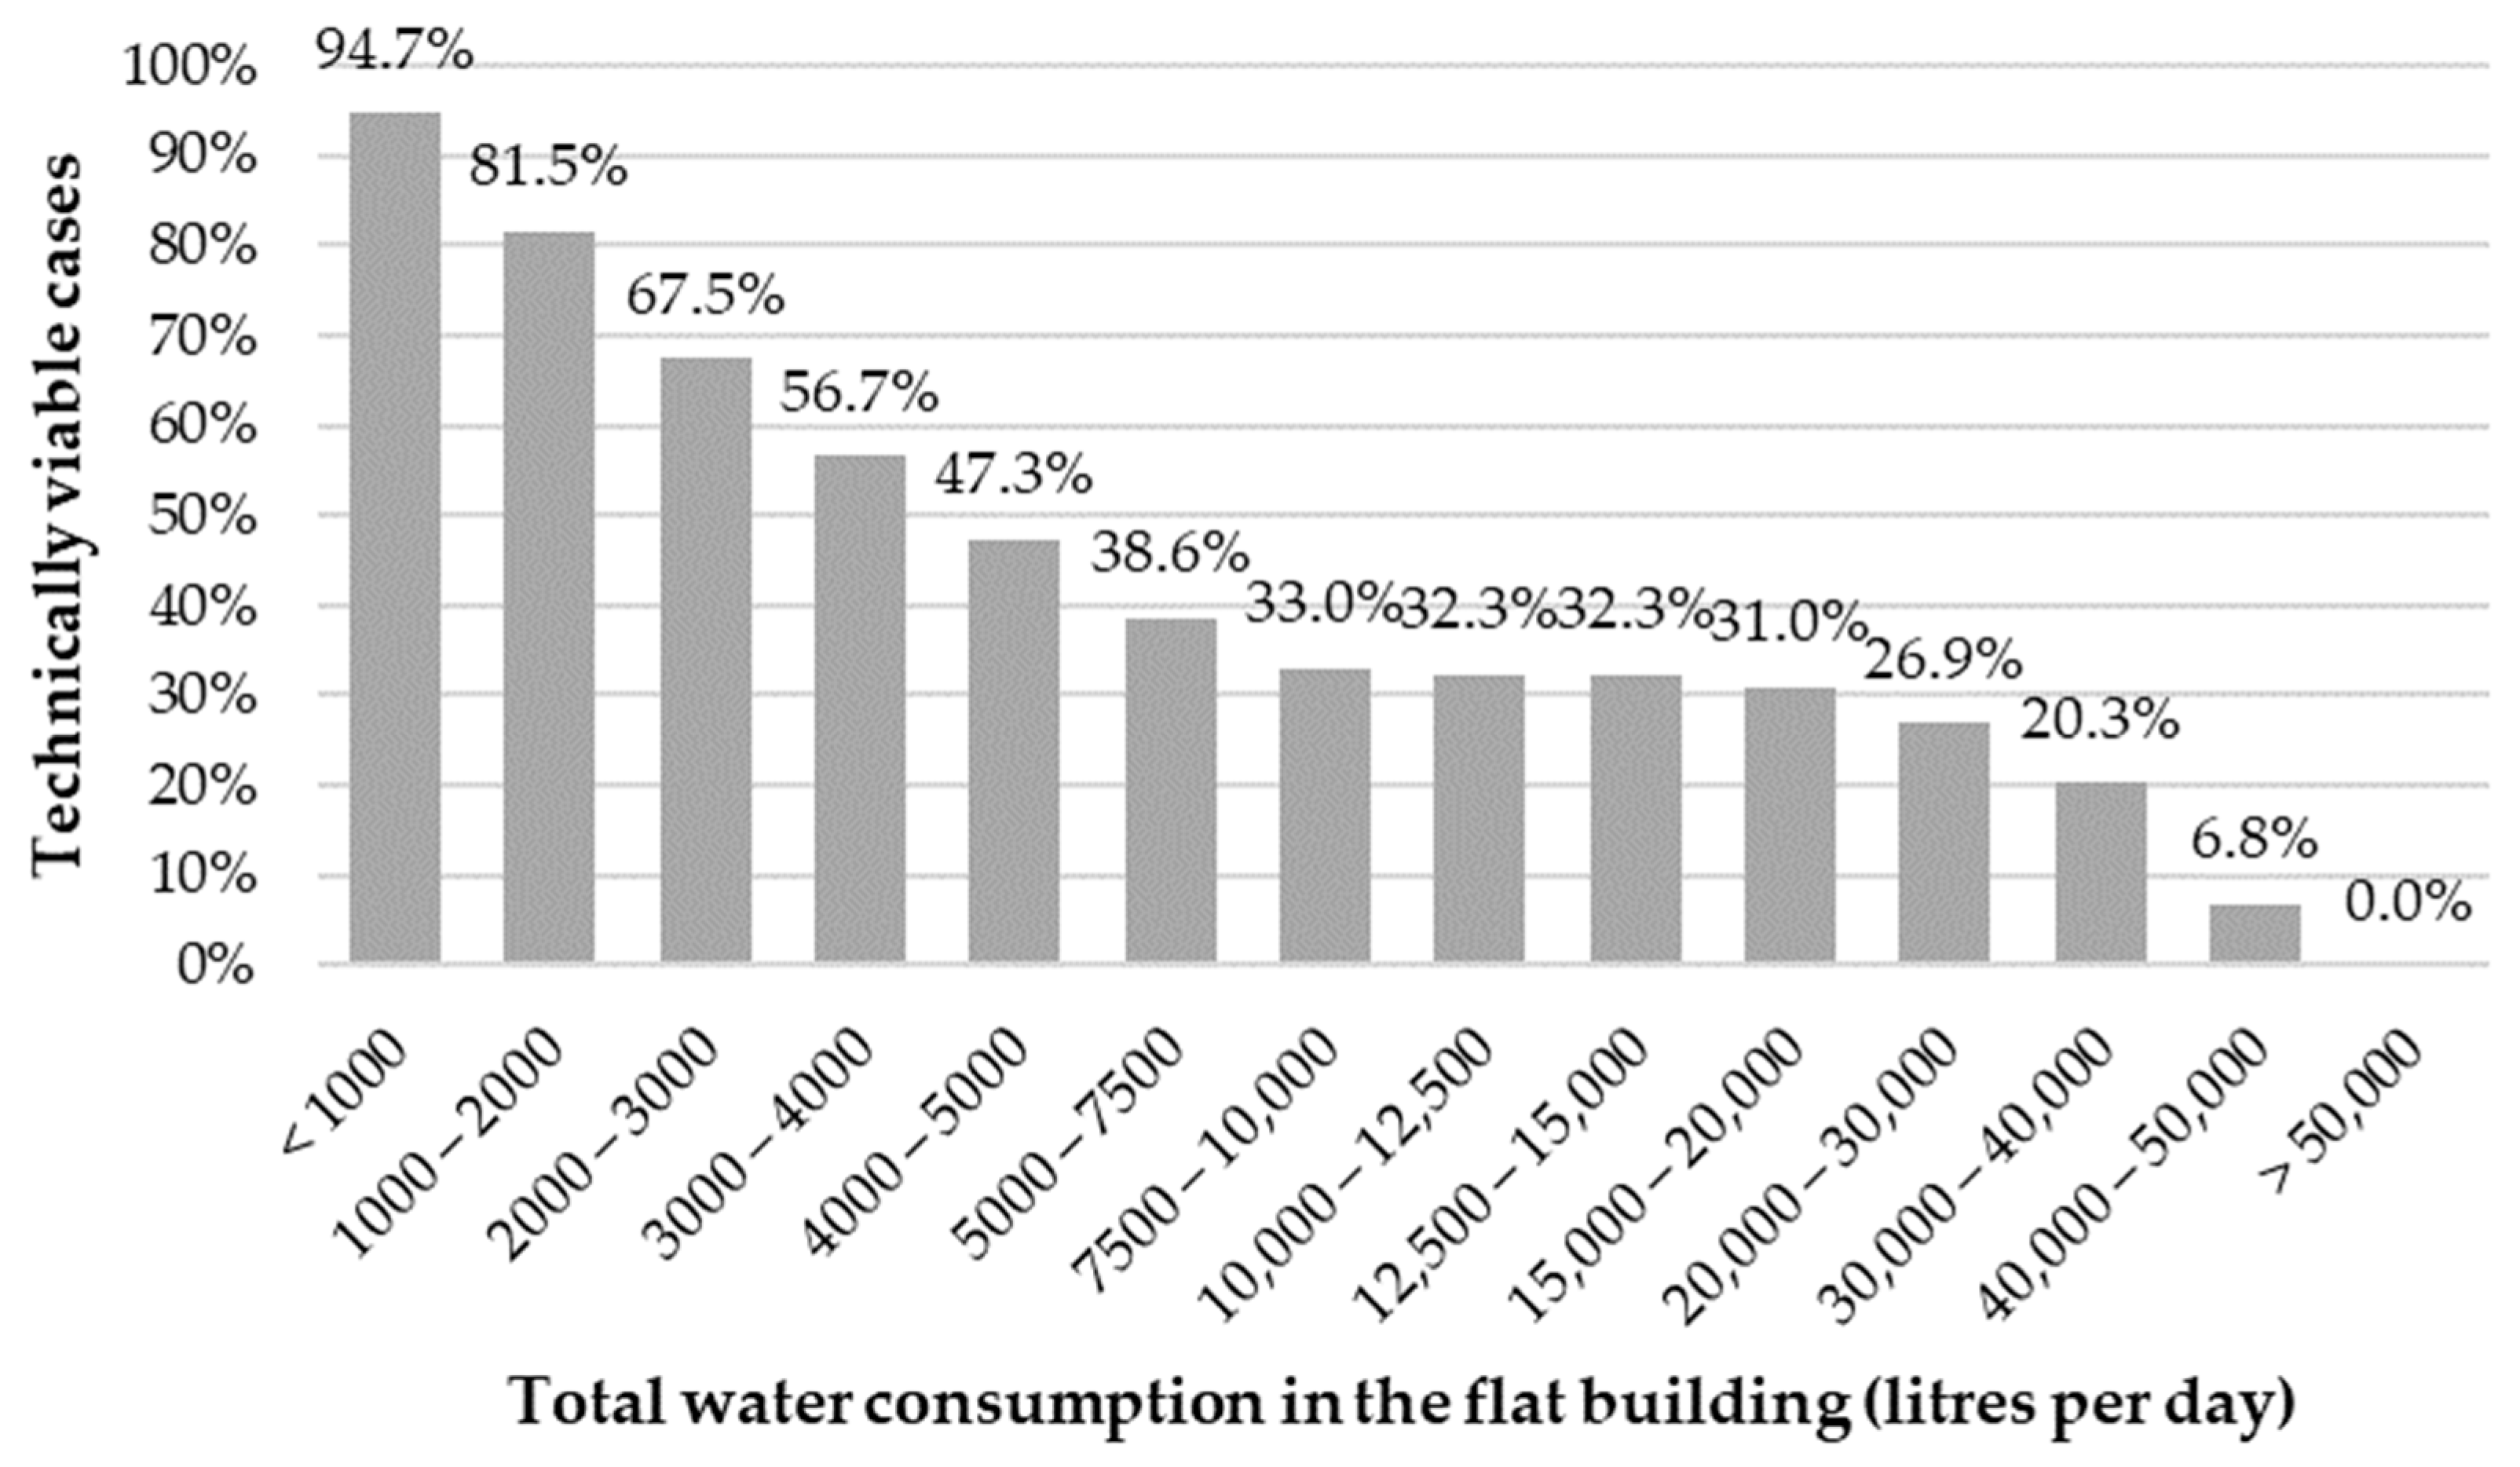
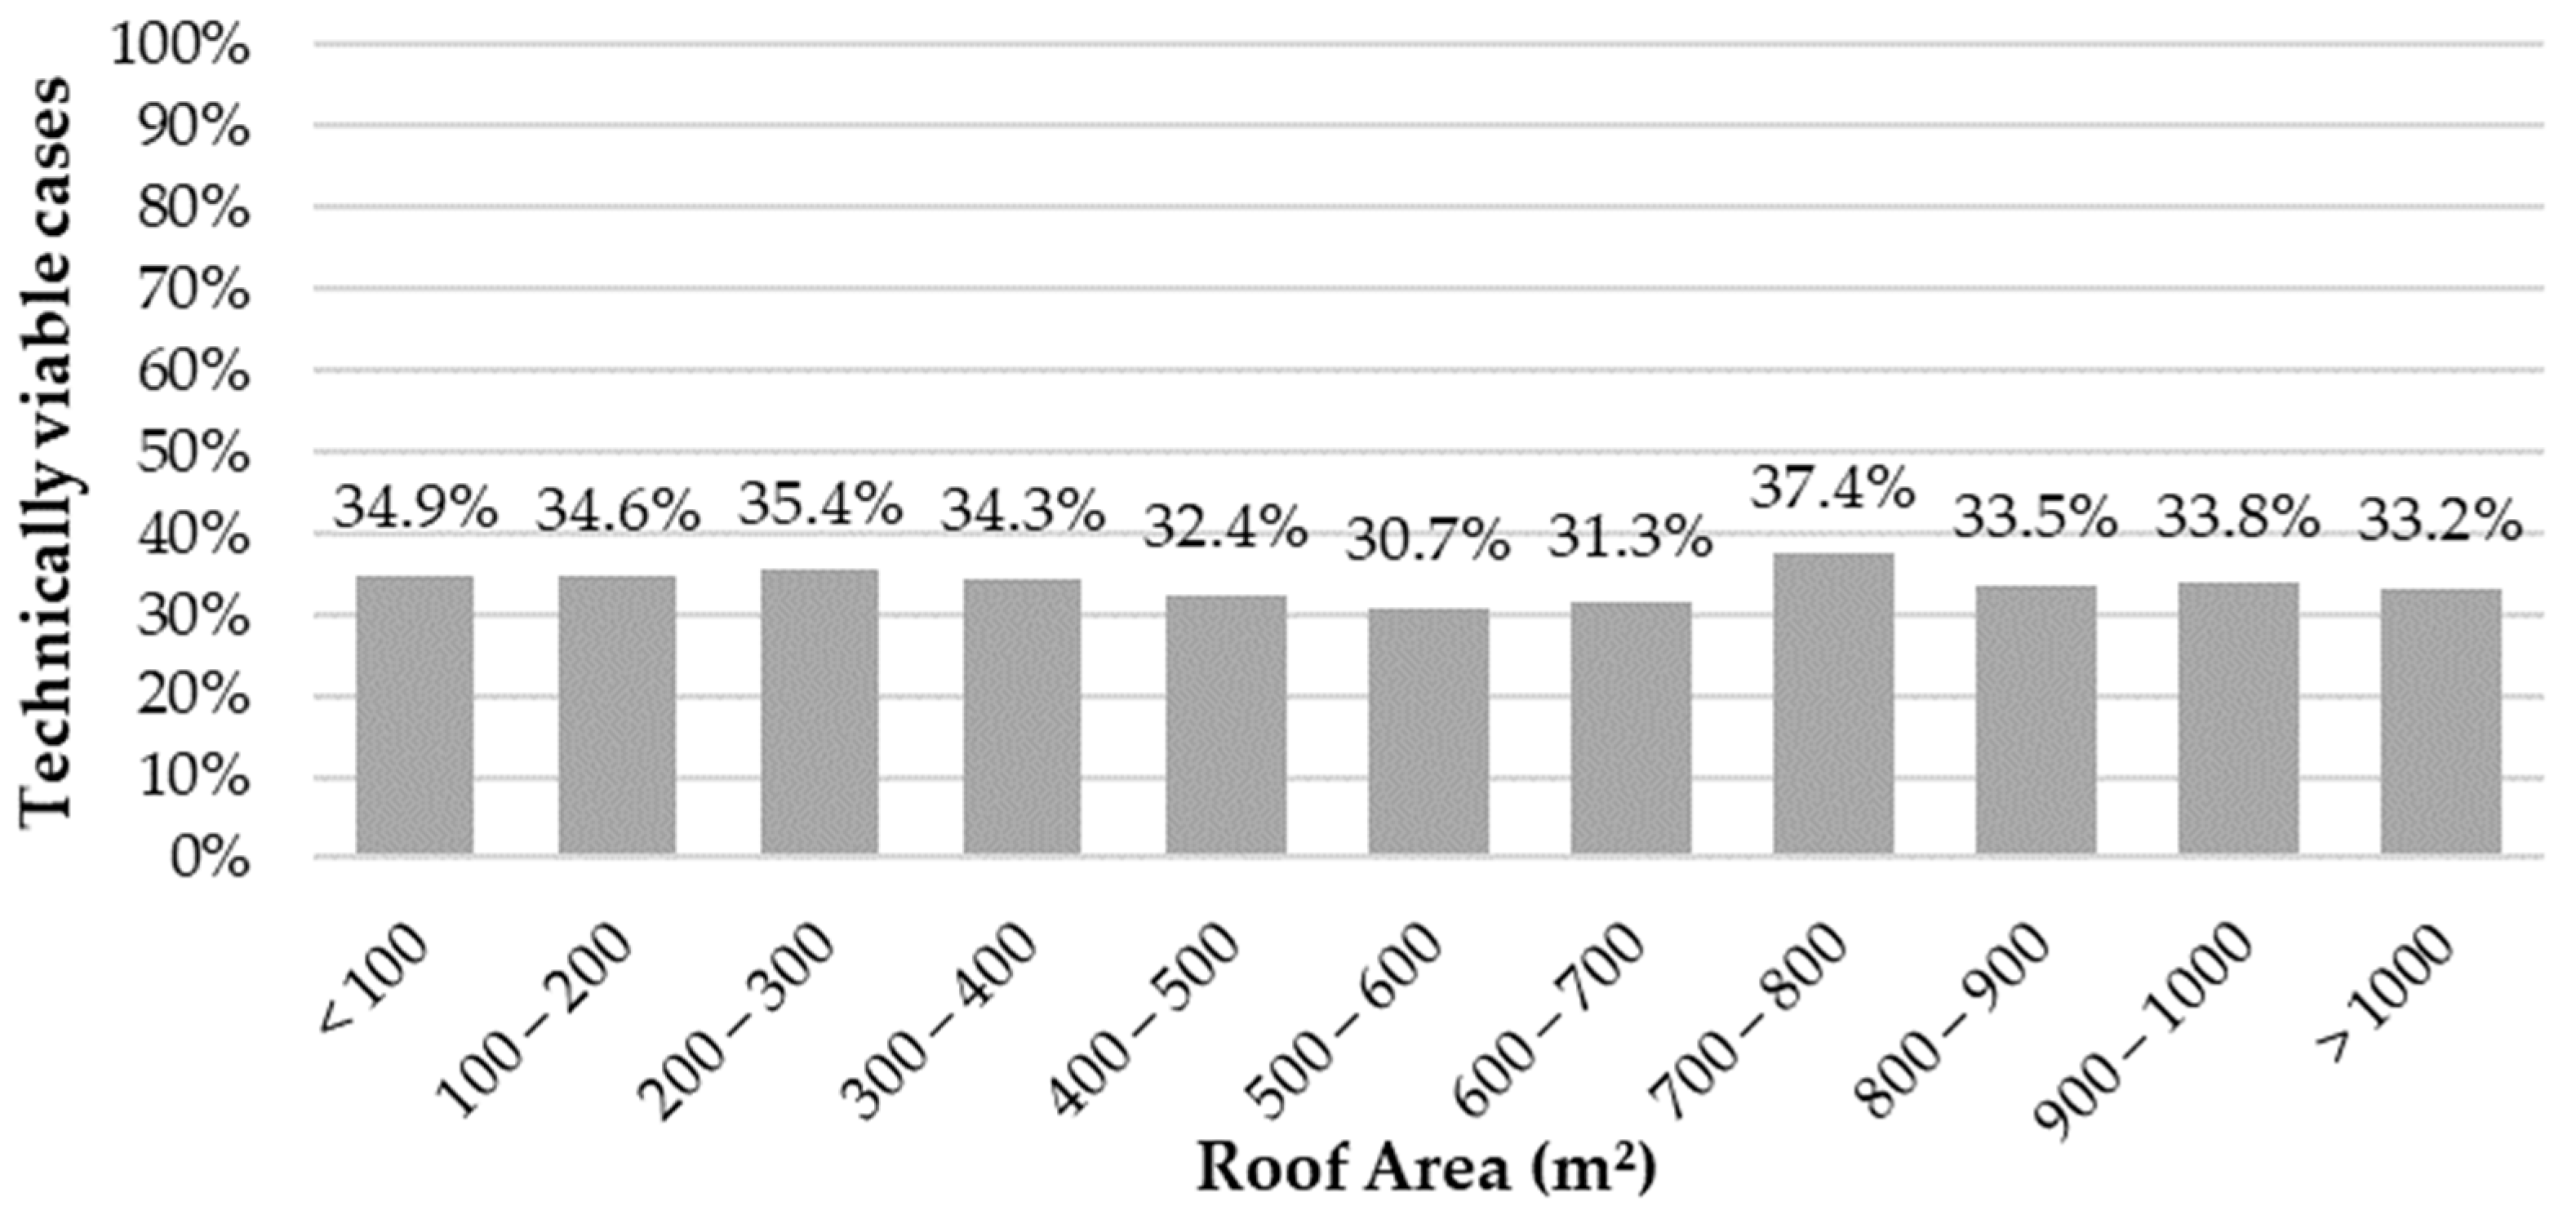
Technical viability was also assessed according to other simulation parameters. Figure 5a shows that the higher the total daily water consumption of the house, the lower the fraction of viable cases. For the catchment area, the smaller the roof area, the lower the fraction of viable cases, as shown in Figure 5b. Amongst the total technically unviable cases, 85.7% are for houses with total water consumptions exceeding 500 L daily, while 87.3% are for houses with roof areas smaller than 100 m2. There were no unviable cases for houses with a catchment area greater than 200 m2. Additionally, considering the parameter of the catchment area necessary to collect one cubic metre of rainwater per month, it was found that at least 8.88 m2 of roof area was required for each m3 of rainwater one wishes to consume.
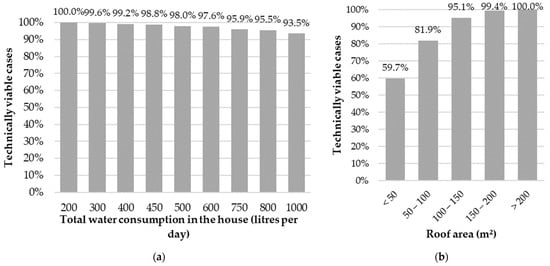
Figure 5.
(a) Technical viability for the group of houses based on the water consumption; (b) technical viability for the group of houses based on the roof area.
For the subgroups of flats, 443 representative buildings were simulated for the same 36 scenarios, resulting in 15,948 simulations. The technical viability of the flats was also verified, with the analysis divided by the number of flats in the building, as shown in Table 3. The more flats the building has, the lower the proportion of viable cases and the potable-water savings for unviable cases. This is expected since more flats mean more residents and thus more water consumption, although the roof area of the building is not necessarily bigger. Considering buildings with up to 30 flats, which are predominant in the city, 97.2% of cases were technically viable for design 1, while 28.9% were for design 2 and 14.5% were for design 3. There were no viable cases for design 2 in buildings with 34 or more flats and for design 3 from 21 flats onwards. Considering all simulations in the group, a total of 78.8% of cases were viable for design 1, 14.4% for design 2, and 7.1% for design 3. For cases that were not viable, the average potential for potable-water savings was 3.8% for the first design, 13.7% for the second, and 16.7% for the third.
Table 3.
Technical viability for the group of flats.
Similar to the group of houses, for flats, the greater the daily total water consumption in the building, the lower the fraction of technically viable cases, as shown in Figure 6. However, regarding the catchment area, the fraction of viable cases remained around 33.8% regardless of the roof area of the building, as shown in Figure 7. Amongst technically unviable cases, 72.3% were for buildings with consumptions exceeding 10,000 L per day. Finally, the minimum catchment area necessary to collect one cubic metre of rainwater per month was found to be 9.97 m2/m3.
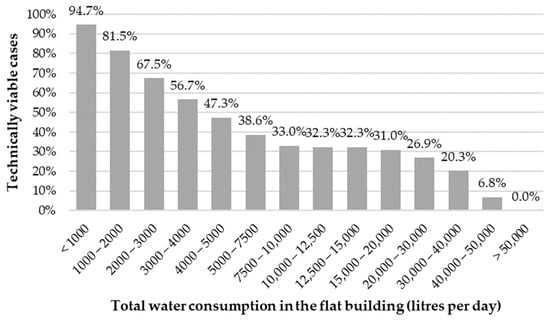
Figure 6.
Technical viability for the group of flats based on the water consumption of the building.

Figure 7.
Technical viability for the group of flats based on the roof area of the building.
The proportion of viable cases is much higher for the group of houses, and the average potential for the potable-water savings of unviable cases is also higher. This is due to the fact that multifamily buildings have a much higher total water consumption than single-family buildings, as they have more families living in them. To meet this demand, the system would need a larger catchment area. However, even though multifamily buildings have a high number of flats, their roof area is not necessarily larger. Another aspect to consider is that, due to limitations in the study’s database, each lot containing flats was considered a single building. Therefore, for lots with many dwellings and possibly more than one building, the simulations were carried out considering only one building and one single rainwater-harvesting system. However, for multifamily buildings with many flats, it would be interesting to design more than one system, so that each would supply part of the household and thus reduce the capacity of the tanks. It is also important to note that technical viability was based on the simulated system application scenarios, so unviable cases may be viable under other system designs with different rainwater demands.
3.3. Economic Feasibility
Based on the results of the simulations, it was possible to perform economic analyses of rainwater-harvesting systems for various scenarios of inflation and MARR, as shown in Table 1, previously presented. Thus, the economic viability of each case was verified based on the discounted payback period, NPV, and IRR. In this step, the current tariff format was considered.
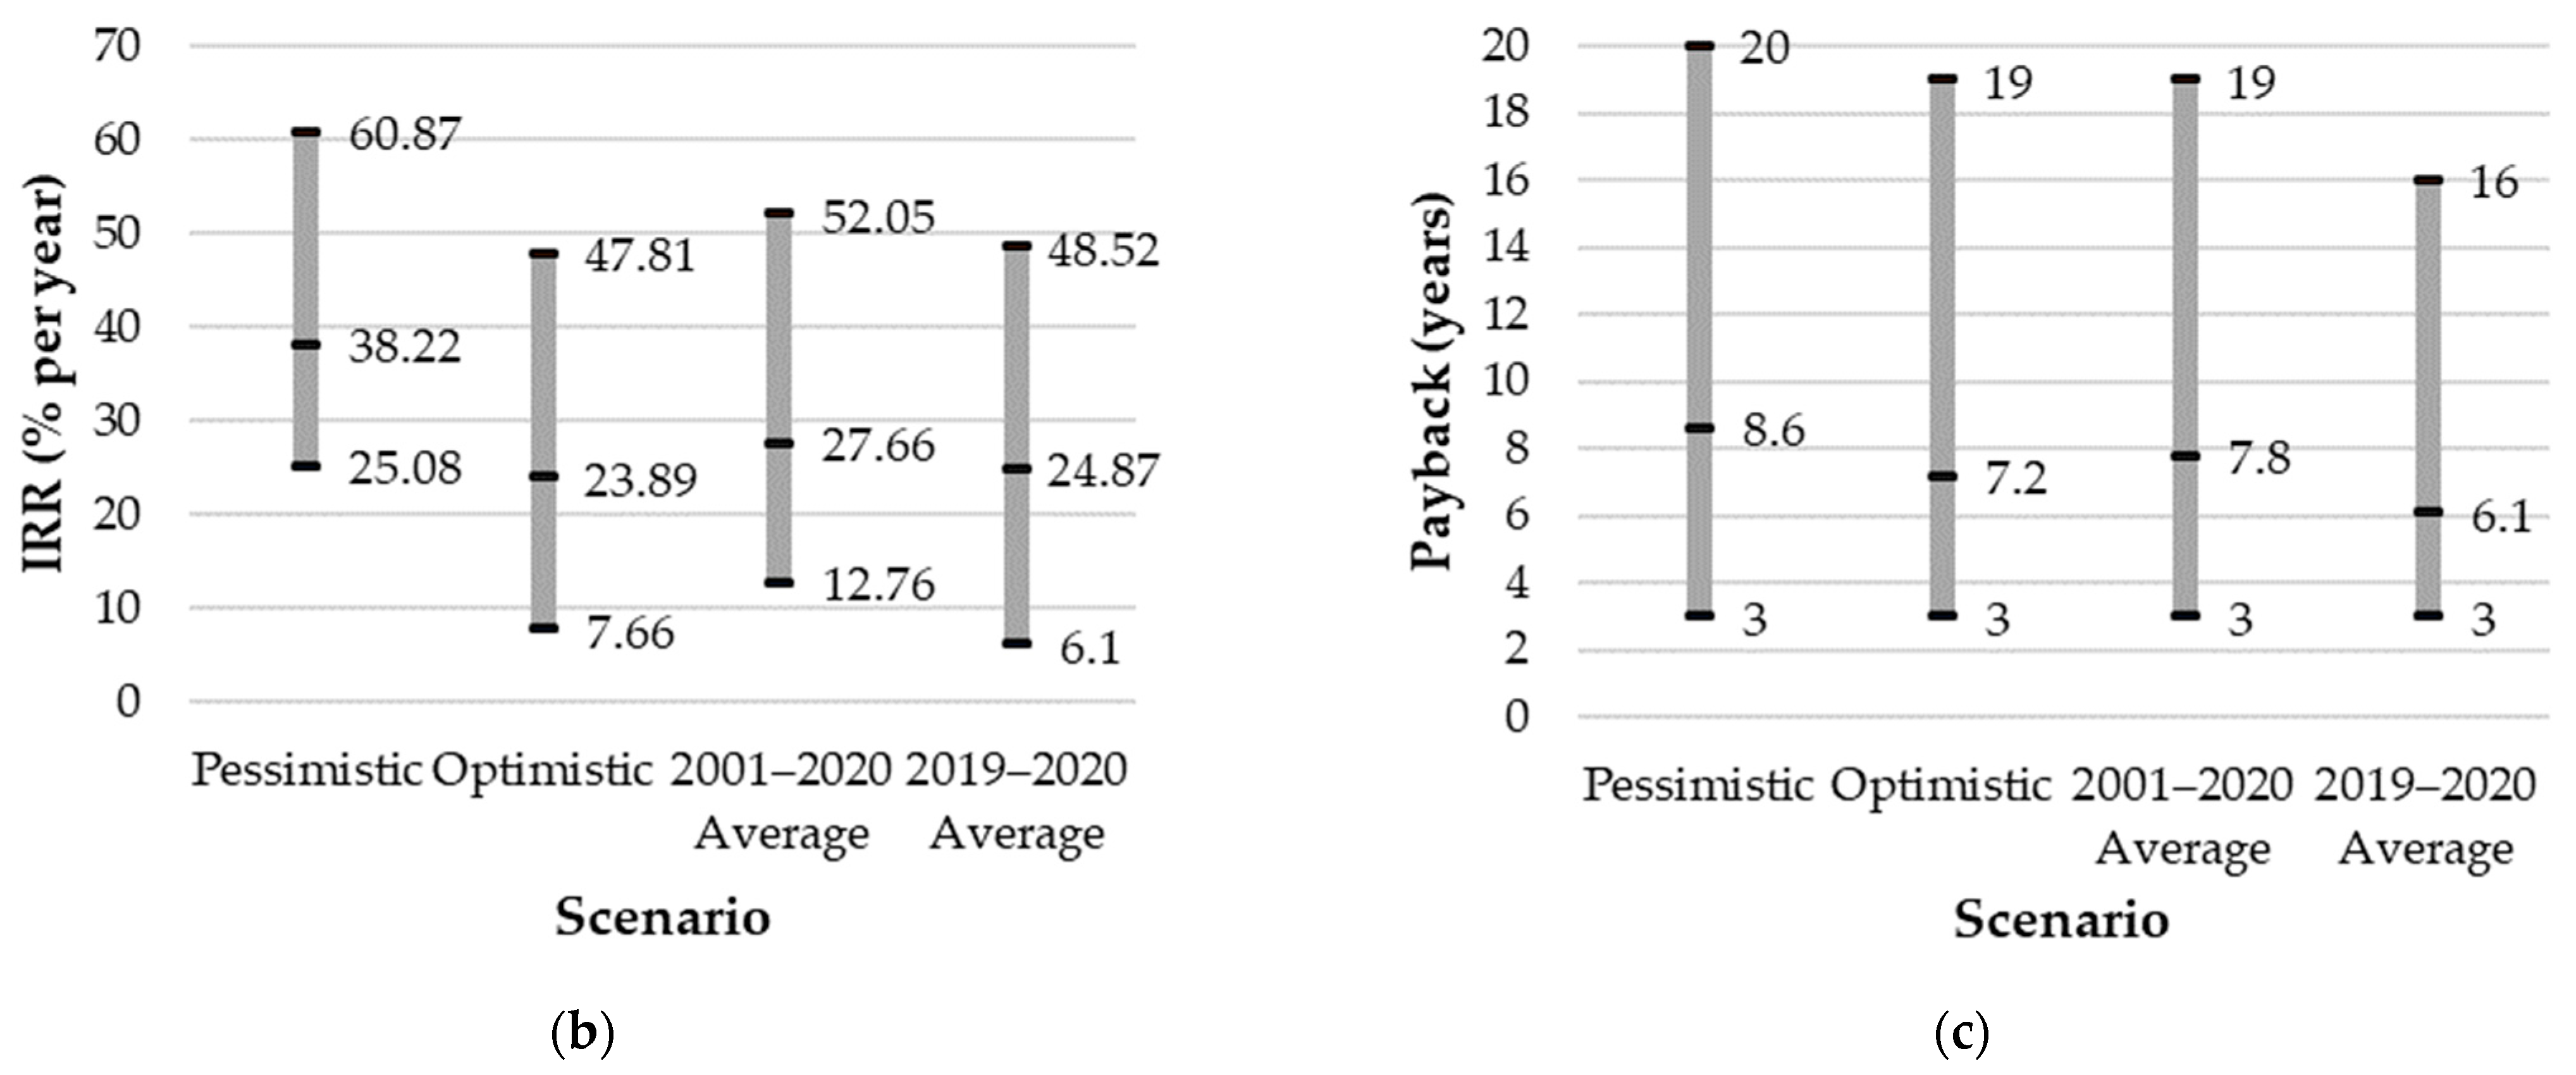
For the group of houses, all 2952 simulations were analysed in the four economic scenarios: pessimistic, optimistic, the 2001–2020 average, and the 2019–2020 average, resulting in 11,808 assessment cases. Table 4 summarises the fraction of economically feasible systems for each scenario and the averages for each feasibility indicator, while Figure 8 shows the minimum, maximum, and average indicators. The scenario that presented the best results was the 2019–2020 average, with a higher number of feasible systems and a shorter payback period. Amongst the unfeasible systems, the parameter with the most impact was the total water consumption in the house. For the pessimistic scenario, 62.7% of the unfeasible cases happened for houses with total water consumptions lower than or equal to 300 L per day, equivalent to 9 m3 per month, while 90.6% happened for consumptions lower than or equal to 400 L per day or 12 m3 per month. In this scenario, the only circumstance that did not present any unfeasible cases was for houses with consumptions of 1000 L per day, that is, 30 m3 per month. For the optimistic, 2001–2020 average, and 2019–2020 average scenarios, on average, 98.3% of the unfeasible cases happened for houses with total water consumptions lower than or equal to 300 L per day. For all scenarios, 100% of houses with total consumptions lower than or equal to 9 m3 per month were unfeasible.
Table 4.
Economic feasibility for the group of houses.
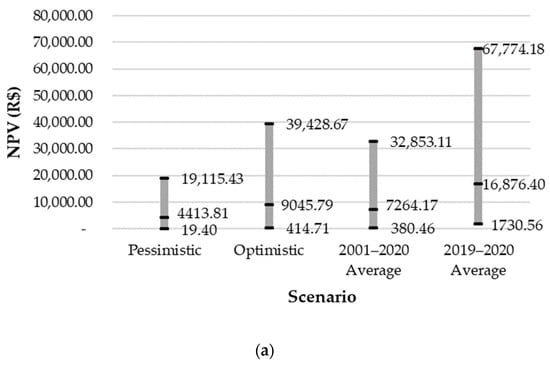
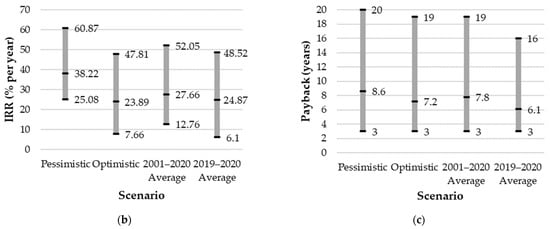
Figure 8.
(a) NPV for the group of houses; (b) IRR for the group of houses; and (c) payback for the group of houses.
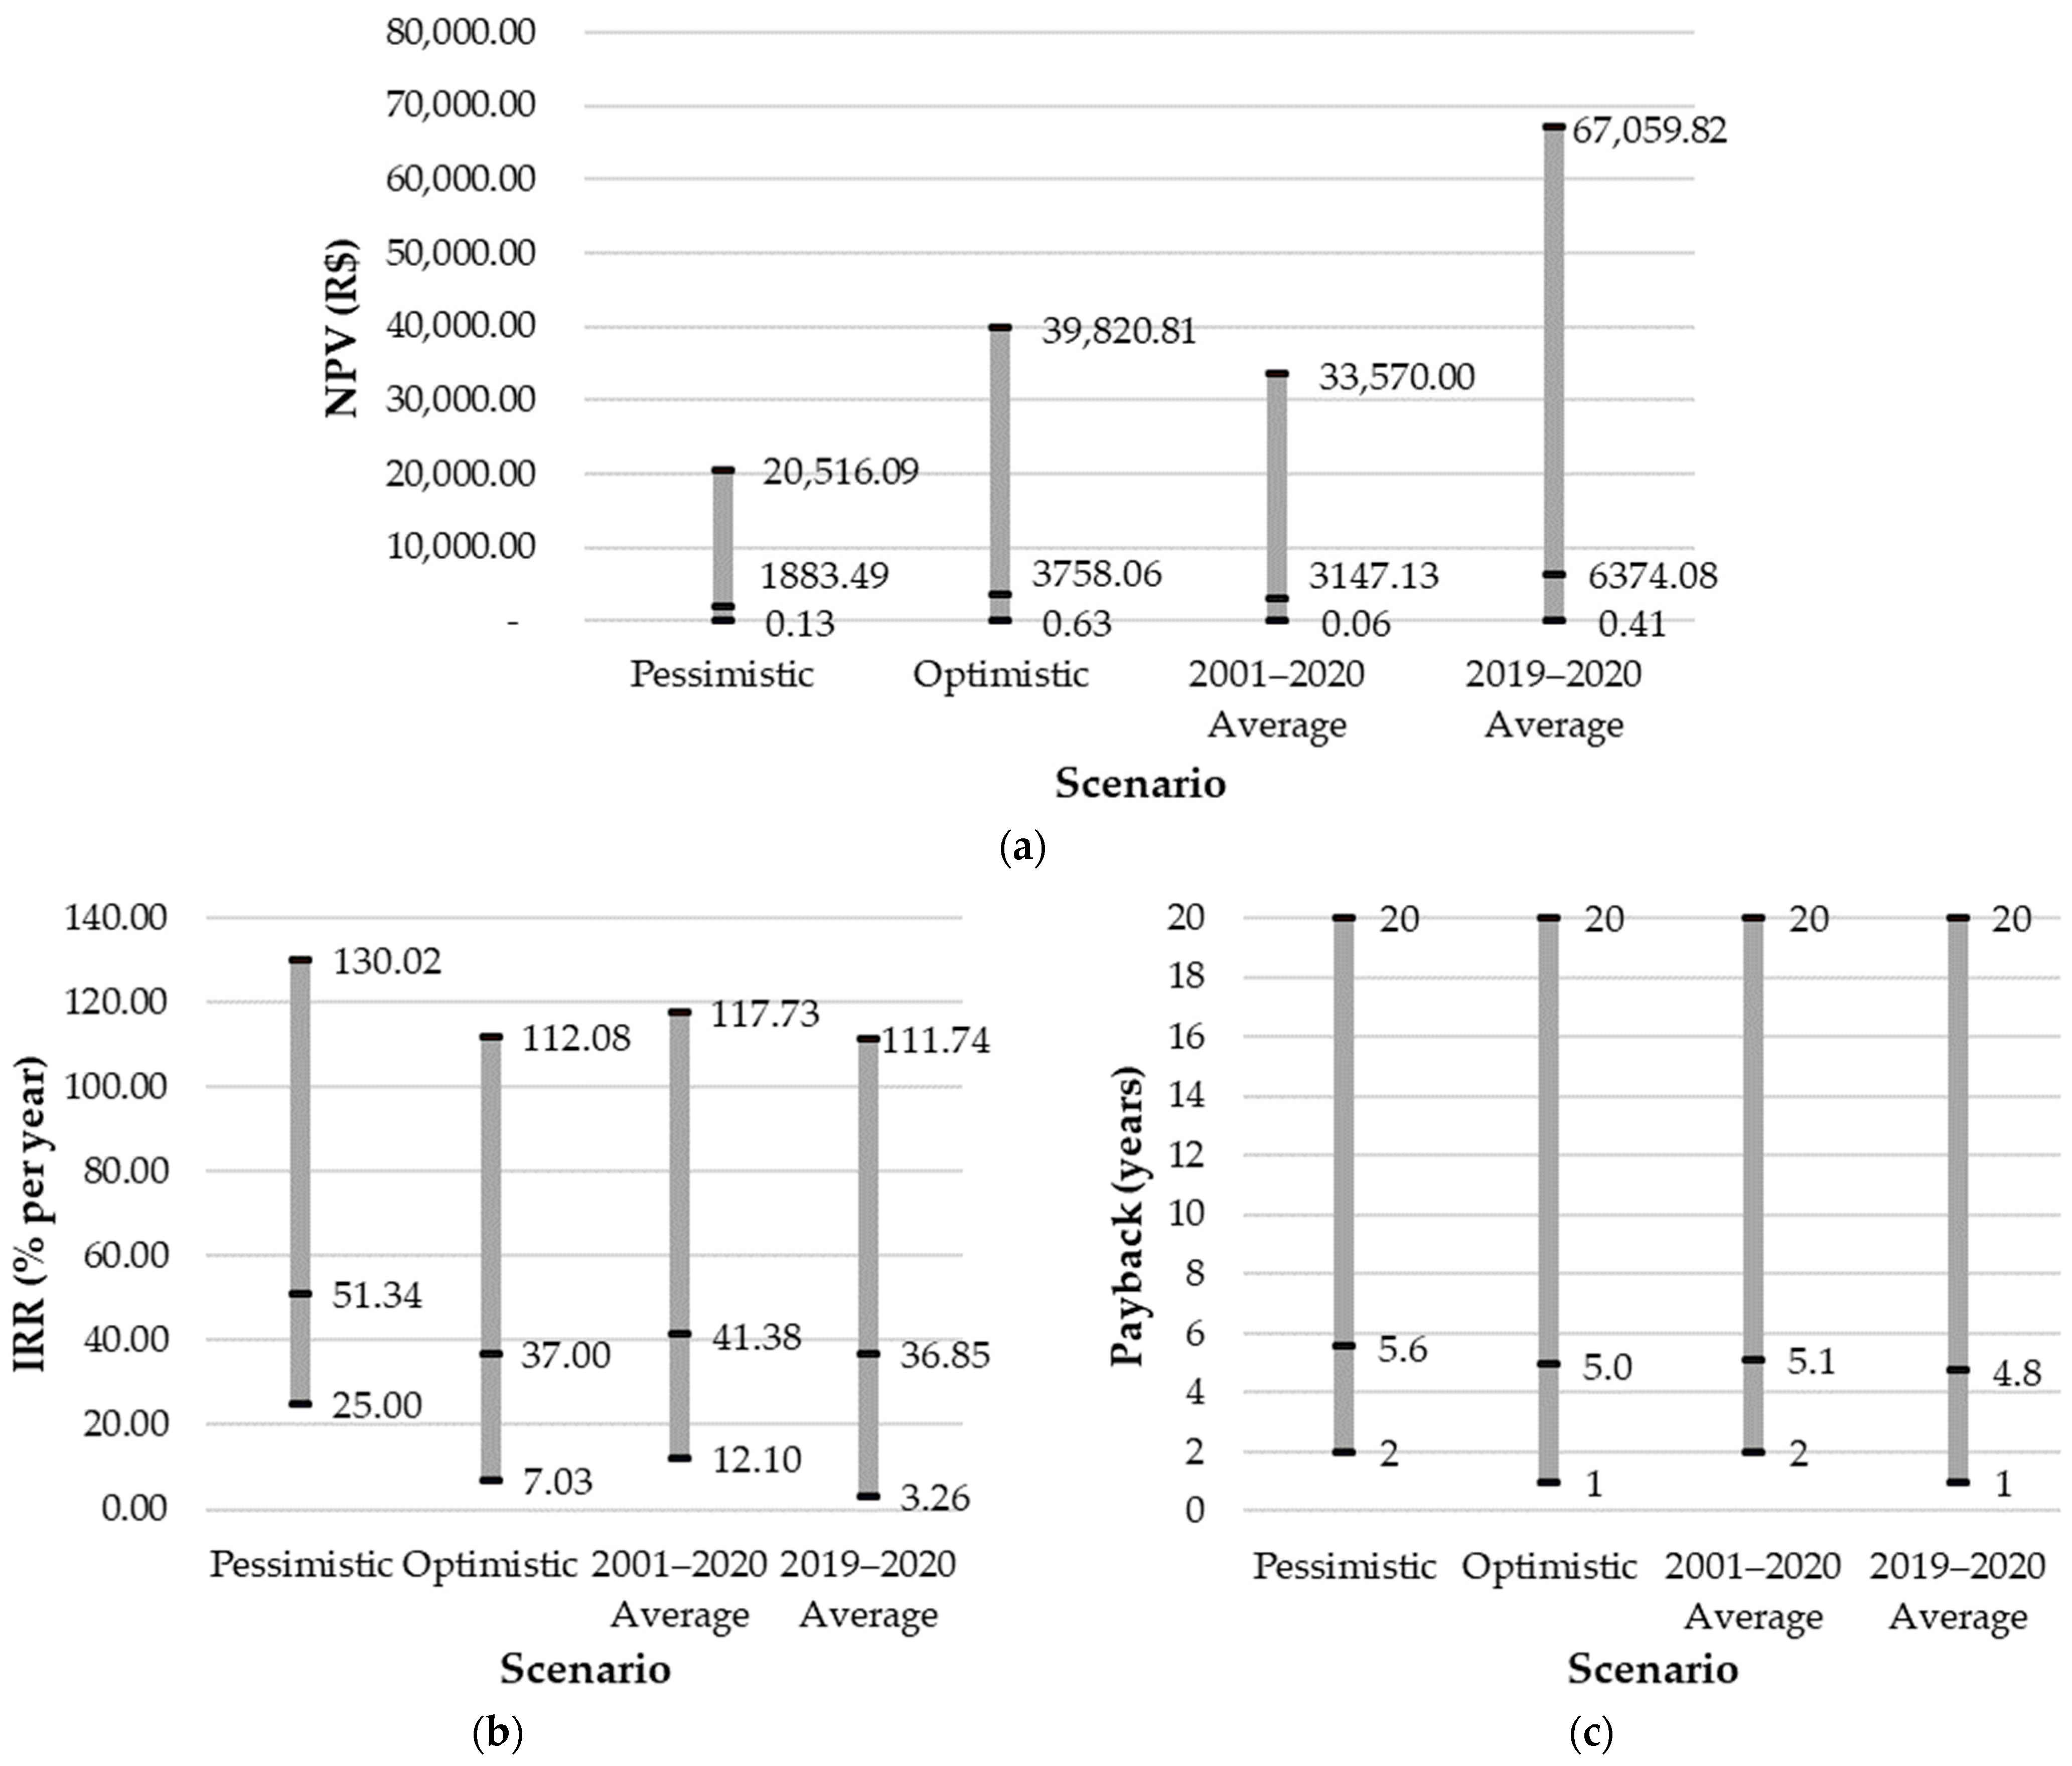
For the group of flats, the 15,948 simulations analysed in the four economic scenarios resulted in 63,792 assessment cases. Table 5 and Table 6 summarise the results of feasible cases for each scenario according to the number of flats in each building, while Figure 9 shows the minimum, maximum, and average indicators for all the buildings. Once again, the 2019–2020 average scenario presented the best results, and total water consumption of the flat was the most impactful parameter. It can be observed that, for all scenarios, the proportion of feasible cases remains almost constant for buildings with up to 50 flats, decreasing thereafter and reaching almost zero for buildings up to 100 flats. Considering the unfeasible cases, 59.3% of cases in the pessimistic scenario happened for buildings with average consumptions per flat lower than or equal to 300 L per day and 69.2% for consumptions lower than or equal to 400 L per day. In the optimistic, 2001–2020 average, and 2019-2020 average scenarios, on average, 66.6% of unfeasible cases happened in flats with consumptions lower than or equal to 300 L per day and 74.2% for consumptions lower than or equal to 400 L per day. Except for the 2019-2020 average scenario, 100% of buildings with consumptions per flat lower than or equal to 300 L per day were unfeasible.
Table 5.
Economic feasibility for the group of flats for pessimistic and optimistic scenarios.
Table 6.
Economic feasibility for the group of flats for both average scenarios.

Figure 9.
(a) NPV for the group of flats; (b) IRR for the group of flats; and (c) payback for the group of flats.
3.4. Tariff-format Comparison
Using the 2019–2020 average economic scenario, both tariff formats were compared, with the results for the group of houses summarised in Table 7 and for the group of flats in Table 8. For the group of houses, the change in the tariff format had almost no difference in the quantity of economically feasible cases, but it had a significant impact on the feasibility indicators. The current tariff format showed a higher NPV and IRR, while the discounted payback was over one year shorter. For the group of flats, the former tariff format had a smaller fraction of feasible cases, as well as worse values for the feasibility indicators. Thus, the current tariff format leads to more benefits and a greater incentive for users seeking to save potable water.
Table 7.
Tariff-format comparison for the group of houses.
Table 8.
Tariff-format comparison for the group of flats.
4. Discussion
Almost all of the cases simulated were technically viable for houses, and up to 78.9% for flats, which indicates that rainwater-harvesting systems are suitable alternatives and have a high potential for potable-water savings. Other studies in the region came to the same conclusion [14,15,46,47].
Between 60.1% and 74.8% of the cases were economically feasible for houses and between 57.8% and 64.2% were for flats, which is similar than the findings of [48]. The average payback found in this study ranged from 6.2 to 8.6 years for houses and from 4.8 to 5.6 for flats and is similar to the paybacks described in [49] but lower than [48]. The IRRs were higher than those found by the authors of [40,48]. However, the IRR’s absolute value is intrinsic to the economic scenario analysed, while the NPV and payback can be directly compared between different cases and scenarios. Thus, it is observed that both for houses and flats, the 2019–2020 average scenario achieved better results, as it had a higher NPV and a shorter payback. Since, for flats, the system costs were divided among all flats in the building, the investment per household was lower, resulting in a higher IRR and a shorter payback for this group when compared to the group of houses.
Overall, it is evident that rainwater-harvesting systems are economically feasible in many cases and provide a good financial return when compared to other investments, such as savings accounts. Most economically unfeasible cases were for buildings with low water consumptions per dwelling, which has also been observed in other studies conducted in Brazil [49,50]. This can be explained by the fact that the water tariff is significantly lower for volumes below 10 m3, so reducing the consumption of potable water does not result in significant monetary savings on the water and sewage bill. Similar conclusions were obtained by the authors of [21,22], even though such studies were performed in different countries. However, the decision to use rainwater-harvesting systems should not be based solely on the economic aspect, as there are other benefits to be considered.
5. Conclusions
Rainwater harvesting is an alternative to reduce the consumption of potable water in buildings [3,4,5,6,7,8]. The global literature indicates that rainwater-harvesting systems have an average potential for potable-water savings of 53% [14]. Some studies indicate that rainwater-harvesting systems can promote economic savings [8,16,18,20], while others conclude they are unfeasible [17,21,22]. In recent years, the tariff format of the water service provided by the water company in Florianópolis underwent changes. This impacts the way economic analyses of rainwater-harvesting systems are carried out. Thus, this research stands out from previous studies, as it examines a new scenario in the use of rainwater-harvesting systems.
This study analysed the technical viability and economic feasibility of rainwater-harvesting systems for residential buildings in Florianópolis, southern Brazil. A total of 18,900 simulations were conducted using the Netuno computer programme, and 94,500 economic analyses were performed using Excel spreadsheets to study various scenarios and cases of system application, including different tariff formats.
Representative buildings for the residential sector of the city were chosen from the database. It was observed that the majority of houses in the city have a roof area smaller than 200 m2, and most flats are in multifamily buildings with up to 30 flats. Simulations of rainwater-harvesting systems were carried out for 36 different application scenarios for each representative building. For houses, almost all of the cases simulated were technically viable, and among the technically unviable cases, the average potable-water savings were 21.3% for design 2 and 33.6% for design 3. For flats, up to 78.9% of the cases simulated were technically viable, and among the unviable cases, the average potable-water savings were 3.8%, 13.7%, and 16.7%, depending on the system design. Thus, the rainwater-harvesting systems demonstrated good performance in terms of potable-water savings for the houses; however, for flats, system designs with high rainwater demands had a lower percentage of viable cases. Therefore, all three system designs seem to be suitable for houses, while design 1, which aims to meet the demand only for cleaning activities and external uses, seems to be more adequate for flats.
The economic feasibility of the rainwater-harvesting systems was also assessed. Twenty-year cash flows were analysed in four economic scenarios using Excel spreadsheets. The fraction of economically feasible cases ranged from 60.1% to 74.8% for houses and from 57.8% to 64.2% for flats. The average discounted payback period varied between 6.2 and 8.6 years for houses and between 4.8 and 5.6 for flats. For both, the majority of economically unfeasible cases were for buildings with monthly water consumptions lower than or equal to 9 m3 per flat. Thus, rainwater-harvesting systems are, in most cases, interesting and economically feasible alternatives for saving potable water in dwellings. To encourage its implementation by more people, it would be interesting to have financial incentives to make these systems economically feasible for low-consumption dwellings.
This study also compared the former tariff format, whose minimum rate is linked to a consumption of 10 m3, with the current one, implemented since 2020, that considers no minimum consumption, to determine which format brings more benefits to users. Through economic analysis, it was found that the change in the tariff did not significantly influence the number of economically viable cases. However, the current tariff brought greater monetary savings for feasible systems, increasing the NPV and reducing the payback period. Thus, it can be stated that the change was positive for users seeking ways to reduce water consumption and save potable water.
Author Contributions
Conceptualization, A.E.B. and E.G.; Methodology, A.E.B.; Software, E.G.; Validation, A.E.B. and E.G.; Formal analysis, A.E.B.; Investigation, A.E.B.; Resources, A.E.B.; Data curation, A.E.B.; Writing—original draft, A.E.B.; Writing—review & editing, A.E.B. and E.G.; Visualization, A.E.B. and E.G.; Supervision, E.G.; Project administration, E.G. All authors have read and agreed to the published version of the manuscript.
Funding
This research received no external funding.
Data Availability Statement
Data are contained within the article.
Acknowledgments
The authors would like to thank CAPES—“Fundação Coordenação de Aperfeiçoamento de Pessoal de Nível Superior”, the Brazilian governmental agency that enabled the development of this research.
Conflicts of Interest
The authors declare no conflicts of interest.
References
- United Nations Environment Programme. Freshwater. In Global Environment Outlook, 6th ed.; United Nations Environment Programme: Cambridge, UK, 2019; pp. 236–269. [Google Scholar]
- Rygaard, M.; Binning, P.J.; Albrechtsen, H.J. Increasing urban water self-sufficiency: New era, new challenges. J. Environ. Manag. 2011, 92, 185–194. [Google Scholar] [CrossRef] [PubMed]
- Abdulla, F.A.; AL-Shareef, A.W. Roof rainwater harvesting systems for household water supply in Jordan. Desalination 2009, 243, 195–207. [Google Scholar] [CrossRef]
- Marinoski, A.K.; Ghisi, E. Environmental performance of hybrid rainwater-greywater systems in residential buildings. Resour. Conserv. Recycl. 2019, 144, 100–114. [Google Scholar] [CrossRef]
- Palla, A.; Gnecco, I.; Lanza, L.G.; Labarbera, P. Performance analysis of domestic rainwater harvesting systems under various European climate zones. Resour. Conserv. Recycl. 2012, 62, 71–80. [Google Scholar] [CrossRef]
- Pavolová, H.; Bakalár, T.; Kudelas, D.; Pułkárová, P. Environmental and economic assessment of rainwater application in households. J. Clean. Prod. 2019, 209, 1119–1125. [Google Scholar] [CrossRef]
- Souza, E.L.; Ghisi, E. Potable Water Savings by Using Rainwater for Non-Potable Uses in Houses. Water 2012, 4, 607–628. [Google Scholar] [CrossRef]
- Freitas, D.A.; Ghisi, E. Economic feasibility analysis of rainwater harvesting: A case study in Imbituba, Brazil. Urban Water J. 2020, 17, 905–911. [Google Scholar] [CrossRef]
- Vieira, A.S. Uso Racional de Água em Habitações de Interesse Social Como Estratégia Para a Conservação de Energia em Florianópolis, Santa Catarina. Masters’s Thesis, Federal University of Santa Catarina, Florianópolis, Brazil, 2012. [Google Scholar]
- Ghisi, E.; Rupp, R.F.; Triska, Y. Comparing indicators to rank strategies to save potable water in buildings. Resour. Conserv. Recycl. 2014, 87, 137–144. [Google Scholar] [CrossRef]
- Proença, L.C.; Ghisi, E.; Tavares, D.F.; Coelho, G.M. Potential for electricity savings by reducing potable water consumption in a city scale. Resour. Conserv. Recycl. 2011, 55, 960–965. [Google Scholar] [CrossRef]
- Gonçalves, R.F. Uso Racional da Água em Edificações; ABES: Rio de Janeiro, Brazil, 2006. [Google Scholar]
- Teston, A.; Teixeira, C.A.; Ghisi, E.; Cardoso, E.B. Impact of rainwater harvesting on the drainage system: Case study of a condominium of houses in Curitiba, Southern Brazil. Water 2018, 10, 1100. [Google Scholar] [CrossRef]
- Teston, A.; Geraldi, M.; Colasio, B.; Ghisi, E. Rainwater Harvesting in Buildings in Brazil: A literature review. Water 2018, 10, 471. [Google Scholar] [CrossRef]
- Ghisi, E.; Montibeller, A.; Schmidt, R.W. Potential for potable water savings by using rainwater: An analysis over 62 cities in southern Brazil. Build. Environ. 2006, 41, 204–210. [Google Scholar] [CrossRef]
- Ghisi, E.; Ferreira, D.F. Potential for potable water savings by using rainwater and greywater in a multi-storey residential building in southern Brazil. Build. Environ. 2007, 42, 2512–2522. [Google Scholar] [CrossRef]
- Ghisi, E.; Oliveira, S.M. Potential for potable water savings by combining the use of rainwater and greywater in houses in southern Brazil. Build. Environ. 2007, 42, 1731–1742. [Google Scholar] [CrossRef]
- Ghisi, E.; Thives, L.P.; Meincheim, D.L. Potential for potable water savings by using rainwater in a house in southern Brazil. In Proceedings of the Iwa Efficient 2017—9th Biennial Specialist Conference on Efficient Use and Management of Water, Bath, UK, 18–20 July 2017. [Google Scholar]
- Marinoski, D.L.; Ghisi, E.; Gómez, L.A. Aproveitamento de água pluvial e dimensionamento de reservatório para fins não potáveis: Estudo de caso em um conjunto residencial localizado em Florianópolis-SC. In Proceedings of the Conferência Latino-Americana de Construção Sustentável, 1, Encontro Nacional de Tecnologia do Ambiente Construído, 10, São Paulo, Brazil, 18–21 July 2004. [Google Scholar]
- Maykot, J.K.; Ghisi, E. Assessment of A Rainwater Harvesting System in A Multi-Storey Residential Building in Brazil. Water 2020, 12, 546. [Google Scholar] [CrossRef]
- Abas, P.G.E.; Mahlia, T.M.I. Techno-Economic and Sensitivity Analysis of Rainwater Harvesting System as Alternative Water Source. Sustainability 2019, 11, 2365. [Google Scholar] [CrossRef]
- Rahman, A.; Keane, J.; Imteaz, M.A. Rainwater harvesting in Greater Sydney: Water savings, reliability and economic benefits. Resour. Conserv. Recycl. 2012, 61, 16–21. [Google Scholar] [CrossRef]
- Ghisi, E.; Cordova, M.M. Netuno 4. Programa computacional. Universidade Federal de Santa Catarina, Departamento de Engenharia Civil. Available online: https://labeee.ufsc.br/downloads/softwares/netuno (accessed on 27 March 2024).
- Ghisi, E. (Universidade Federal de Santa Catarina, Florianópolis, Santa Catarina, Brasil); Cordova, M.M (Universidade Federal de Santa Catarina, Florianópolis, Santa Catarina, Brasil). Personal Communication. 2014. Available online: https://labeee.ufsc.br/sites/default/files/Manual-Netuno-4_Junho2014.pdf (accessed on 27 March 2024).
- Cordova, M.M.; Ghisi, E. Analysis of Potable Water Savings Using Behavioural Models. In Water Conservation, 1st ed.; Jha, M., Ed.; InTech Open: London, UK, 2011; Volume 1, pp. 89–104. Available online: https://www.intechopen.com/chapters/24681 (accessed on 27 March 2024).
- IBGE—Instituto Brasileiro de Geografia e Estatística. Portal Cidades. Available online: https://cidades.ibge.gov.br/brasil/sc/florianopolis/panorama (accessed on 25 October 2021).
- Pandolfo, C.; Braga, H.J.; Silva, V.P., Jr.; Massignam, A.M.; Pereira, E.S.; Thomé, V.M.R.; Valci, F.V. Atlas climatológico do Estado de Santa Catarina. Florianópolis: Epagri. 2002. Available online: https://ciram.epagri.sc.gov.br/ciram_arquivos/atlasClimatologico/atlasClimatologico.pdf (accessed on 25 October 2021).
- INMET—Instituto Nacional de Metereologia. Banco de Dados Meteorológicos. Available online: https://bdmep.inmet.gov.br/# (accessed on 25 February 2021).
- Geraldi, M.S.; Ghisi, E. Influence of the length of rainfall time series on rainwater harvesting systems: A case study in Berlin. Resour. Conserv. Recycl. 2017, 125, 169–180. [Google Scholar] [CrossRef]
- Geraldi, M.S.; Ghisi, E. Assessment of the length of rainfall time series for rainwater harvesting in buildings. Resour. Conserv. Recycl. 2018, 133, 231–241. [Google Scholar] [CrossRef]
- Ghisi, E.; Cardoso, K.A.; Rupp, R.F. Short-term versus long-term rainfall time series in the assessment of potable water savings by using rainwater in houses. J. Environ. Manag. 2012, 100, 109–119. [Google Scholar] [CrossRef]
- SNIS—Sistema Nacional de Informações Sobre Saneamento. In Diagnóstico dos Serviços de Água e Esgotos, 25th ed.; SNS/MDR: Brasília, Brazil, 2020.
- Marinoski, A.K.; Vieira, A.S.; Silva, A.S.; Ghisi, E. Water End-Uses in Low-Income Houses in Southern Brazil. Water 2014, 6, 1985–1999. [Google Scholar] [CrossRef]
- Hammes, G.; Ghisi, E.; Thives, L.P. Water end-uses and rainwater harvesting: A case study in Brazil. Urban Water J. 2020, 17, 177–183. [Google Scholar] [CrossRef]
- Costa, F.M. Estatística, 1st ed.; Universidade do Estado do Pará: Belém-Pará, Brasil, 2011; p. 27. Available online: https://ccse.uepa.br/downloads/material_2010/LIVRO_ESTATISTICA.pdf (accessed on 27 March 2024).
- Basu, A.; Basu, S. A User’s Guide to Analytics, 1st ed.; Taylor & Francis: Boca Raton, FL, USA, 2016; p. 31. [Google Scholar]
- Real Statistics Using Excel. Available online: https://www.real-statistics.com/multivariate-statistics/cluster-analysis/jenks-natural-breaks/ (accessed on 26 November 2021).
- ABNT—Associação Brasileira de Normas Técnicas. NBR 15527: Água de Chuva—Aproveitamento de Coberturas em Áreas Urbanas Para Fins Não Potáveis—Requisitos, 2nd ed.; ABNT—Associação Brasileira de Normas Técnicas: Rio de Janeiro, Brazil, 2019; pp. 1–10. [Google Scholar]
- Plínio Tomáz Engenharia—Aproveitamento de Água de Chuva. Available online: https://www.pliniotomaz.com (accessed on 2 February 2021).
- Severis, R.M.; Silva, F.A.; Wahrlich, J.; Skoronski, E.; Simioni, F.J. Economic analysis and risk-based assessment of the financial losses of domestic rainwater harvesting systems. Resour. Conserv. Recycl. 2019, 146, 206–217. [Google Scholar] [CrossRef]
- CELESC—Centrais Elétricas de Santa Catarina. Tarifas e Taxas de Energia. Available online: https://www.celesc.com.br/tarifas-de-energia#tributos (accessed on 17 December 2021).
- CASAN—Companhia Catarinense de Água e Saneamento. Tarifas. Available online: https://www.casan.com.br/menu-conteudo/index/url/tarifas#0 (accessed on 17 December 2021).
- Casarotto Filho, N.; Kopittke, B.H. Análise de Investimentos, 10th ed.; Atlas: São Paulo, Brazil, 2007; p. 418. [Google Scholar]
- BCB—Banco Central do Brasil. Taxas de Juros Básicas: Histórico. Available online: https://www.bcb.gov.br/controleinflacao/historicotaxasjuros (accessed on 17 December 2021).
- BCB—Banco Central do Brasil. Histórico Das Metas Para a Inflação. Available online: https://www.bcb.gov.br/controleinflacao/historicometas (accessed on 17 December 2021).
- Ghisi, E. Potential for potable water savings by using rainwater in the residential sector of Brazil. Build. Environ. 2006, 41, 1544–1550. [Google Scholar] [CrossRef]
- Lopes, A.C.; Rupp, R.F.; Ghisi, E. Assessment of the potential for potable water savings by using rainwater in houses in southern Brazil. Water Sci. Technol. Water Supply 2016, 16, 533–541. [Google Scholar] [CrossRef]
- Istchuk, R.N.; Ghisi, E. Financial Feasibility Analysis of Residential Rainwater Harvesting in Maringá, Brazil. Sustainability 2022, 14, 12859. [Google Scholar] [CrossRef]
- Ghisi, E.; Schondermark, P.N. Investment Feasibility Analysis of Rainwater Use in Residences. Water Resour. Manag. 2013, 27, 2555–2576. [Google Scholar] [CrossRef]
- Berwanger, H.; Ghisi, E. Investment feasibility analysis of rainwater harvesting in the city of Itapiranga, Brazil. Int. J. Sustain. Hum. Dev. 2014, 2, 104–114. [Google Scholar]


Disclaimer/Publisher’s Note: The statements, opinions and data contained in all publications are solely those of the individual author(s) and contributor(s) and not of MDPI and/or the editor(s). MDPI and/or the editor(s) disclaim responsibility for any injury to people or property resulting from any ideas, methods, instructions or products referred to in the content. |
© 2024 by the authors. Licensee MDPI, Basel, Switzerland. This article is an open access article distributed under the terms and conditions of the Creative Commons Attribution (CC BY) license (https://creativecommons.org/licenses/by/4.0/).