Article

Application and Research of Microseismic Monitoring System and Hydraulic Fracturing Technology in Coal Mines

School of Civil Engineering, Henan Polytechnic University, Jiaozuo 454003, China
*
Author to whom correspondence should be addressed.
Water 2024, 16(7), 1062; https://doi.org/10.3390/w16071062
Submission received: 19 December 2023 / Revised: 3 April 2024 / Accepted: 6 April 2024 / Published: 7 April 2024
(This article belongs to the Special Issue Mine Water Safety and Environment)

Abstract

:
In order to improve the effectiveness of coal mine gas control and enhance the level of coal mine safety production, the application of a microseismic monitoring system and hydraulic fracturing technology in coal mines was studied. Applying hydraulic fracturing technology to coal mine gas treatment, firstly, the geological structure and gas concentration in the mining area are detected using the radio tunnel perspective method and infrared differential absorption method. Then, the relevant parameters of hydraulic fracturing are determined, and finally, hydraulic fracturing technology is implemented. Microseismic monitoring technology is used to monitor the cracks formed during hydraulic fracturing construction and evaluate the fracturing effect. The instantaneous energy envelope is obtained from the microseismic data of each detection channel after stacking and Hilbert transform static correction. A microseismic in-phase inversion positioning objective function based on travel time residuals is constructed, and under the constraints of polarization analysis, the optimal solution is obtained through search iteration to complete microseismic in-phase inversion positioning. Experimental results have shown that after applying this method to coal mine gas control, the gas concentration decreases below the execution standard, achieving good control effects. Under microseismic monitoring in coal mines, the hydraulic fracturing effect can be effectively and reasonably evaluated, and the safety production level of coal mines can be improved.

1. Introduction

As an important energy source, coal plays a very important role in human production and life [1]. With the rapid development of the social economy, all walks of life have made progress to varying degrees. Under this trend, the demand for coal energy has greatly increased, and consumption is increasing day by day. With the increase in coal mining output and the deepening of mining depth, the mining difficulty is also increasing [2]. In this case, safety accidents in coal mines are common. Once a safety accident occurs, it will cause huge economic losses and even casualties, and seriously affect local social stability and economic development. It can be said that safety problems run through the whole process of coal mine production [3]. Among many coal mine accidents, gas disasters are one of the most common accidents. Therefore, in the daily safety protection of coal mines, gas safety management should be strengthened to reduce the probability of coal mine safety accidents [4].
In recent years, many scholars have carried out a lot of research on coal mine management and achieved certain research results. For example, Wamriew D et al. [5] designed a multilayer two-dimensional convolutional neural network in order to locate the coal mine microseismic events in real time, efficiently, and accurately, and transformed the problem into a nonlinear regression problem. Low SNR synthetic microseismic data are used to simulate the field data, and the neural network is trained. The trained neural network is used to predict microseismic events, but the convergence speed of this method is slow, and overfitting is prone to occur. Savvaidis A et al. [6] used microseismic source location imaging technology to monitor the hydraulic fracturing process used in coal mine management. First, they analyzed the microseismic source location imaging conditions, developed monitoring strategies based on the analysis results, and then combined the characteristics of the microseisms generated by hydraulic fracturing, carried out 2D Marmousi-II and 3D SEG advanced modeling. The built model is used to locate the coal mine microseismic source and generate 3D images to realize the location monitoring of the hydraulic fracturing process. However, when this method is implemented, it requires a lot of computing resources and is prone to causing data disasters. Park S et al. [7] proposed a mine production management application program based on Bluetooth beacon technology, which is applied to the underground transportation system. The program sends information to be loaded through Bluetooth beacons and receives the information through the tablet computer installed on the transport vehicle. After receiving the information, the driver can choose the loading point, dumping method, and other information. The relevant data during the whole transportation process are automatically transmitted to the ECS when the transport vehicle arrives at the wireless communication area. This method is limited by the transmission distance and is only suitable for short-distance transportation, and the signal sent is also vulnerable to noise. Deng E F et al. [8] evaluated and experimentally compared the seismic performance of connections, and developed and validated a refined finite element method to reveal the damage and energy dissipation mechanisms of connections.
Microseismic monitoring technology is derived from seismology and acoustic emission. By observing and analyzing microseismic signals generated by hydraulic fracturing and coal mining, the impact of coal mining activities on the geological environment can be monitored [8]. Compared with traditional rock mass stability monitoring technology, microseismic monitoring technology can provide real-time and accurate determination of the spatial location of coal and rock mass fractures or instability and can provide strong data support for staff [9]. Hydraulic fracturing technology is a kind of technology used to increase the permeability of low-permeability coal seams. With the help of high-pressure water injected into coal and rock masses through boreholes at a discharge rate greater than the filtration rate of coal and rock strata, fracturing occurs in various primary weak planes of coal seams, resulting in internal segmentation of the coal seams. During the entire segmentation process, the space volume of weak planes, such as coal and rock fractures, and the connectivity between pores are increased. The formation of an interconnected multifracture connectivity network can improve the permeability of coal seams and enhance the drainage effect of low-permeability coal seams. This technology has been widely applied in coal mine gas control, oil and gas well production increase, and other fields [10]. In this paper, coal mine microseismic monitoring and hydraulic fracturing technology are applied in coal mine safety management, and coal mine gas has been treated, with good results and good applicability.

2. Application of Microseismic Monitoring, Hydraulic Fracturing and Other Technologies in Coal Mine Safety Management

2.1. Coal Mine Gas Control Based on Hydraulic Fracturing Technology

In China, coal mines are usually located tens or even hundreds of meters underground. These areas have poor permeability, and gas cannot be effectively removed [11]. If the gas is not fully discharged and operators enter the mine, the problem of gas poisoning will occur. Moreover, the gas is flammable and explosive, and reaching the ignition point under aerobic conditions will cause an explosion [12]. Therefore, it is critical to effectively discharge mine gas and reduce its concentration. Gas control has always been one of the important contents of coal mine operation safety management [13].
As a gas control technology, hydraulic fracturing technology can effectively deal with gas problems. This technology involves drilling holes in mining areas, injecting a mixture of high-pressure water and sand into the pores, and applying pressure until the borehole wall ruptures. At this point, the sand in the high-pressure water will fill the cracks that flow through. A seam network is formed between the coal seams to improve the permeability of the coal seams and make the gas flow out along the seams, so as to achieve the goal of controlling the coal mine gas.
The use of hydraulic fracturing technology to deal with coal mine gas problems is mainly divided into the following steps:
(1)
Detect the geological conditions and gas concentration of the coal mine;
(2)
Determine hydraulic fracturing technical parameters;
(3)
Formulate a scientific fracturing plan and strictly implement it.

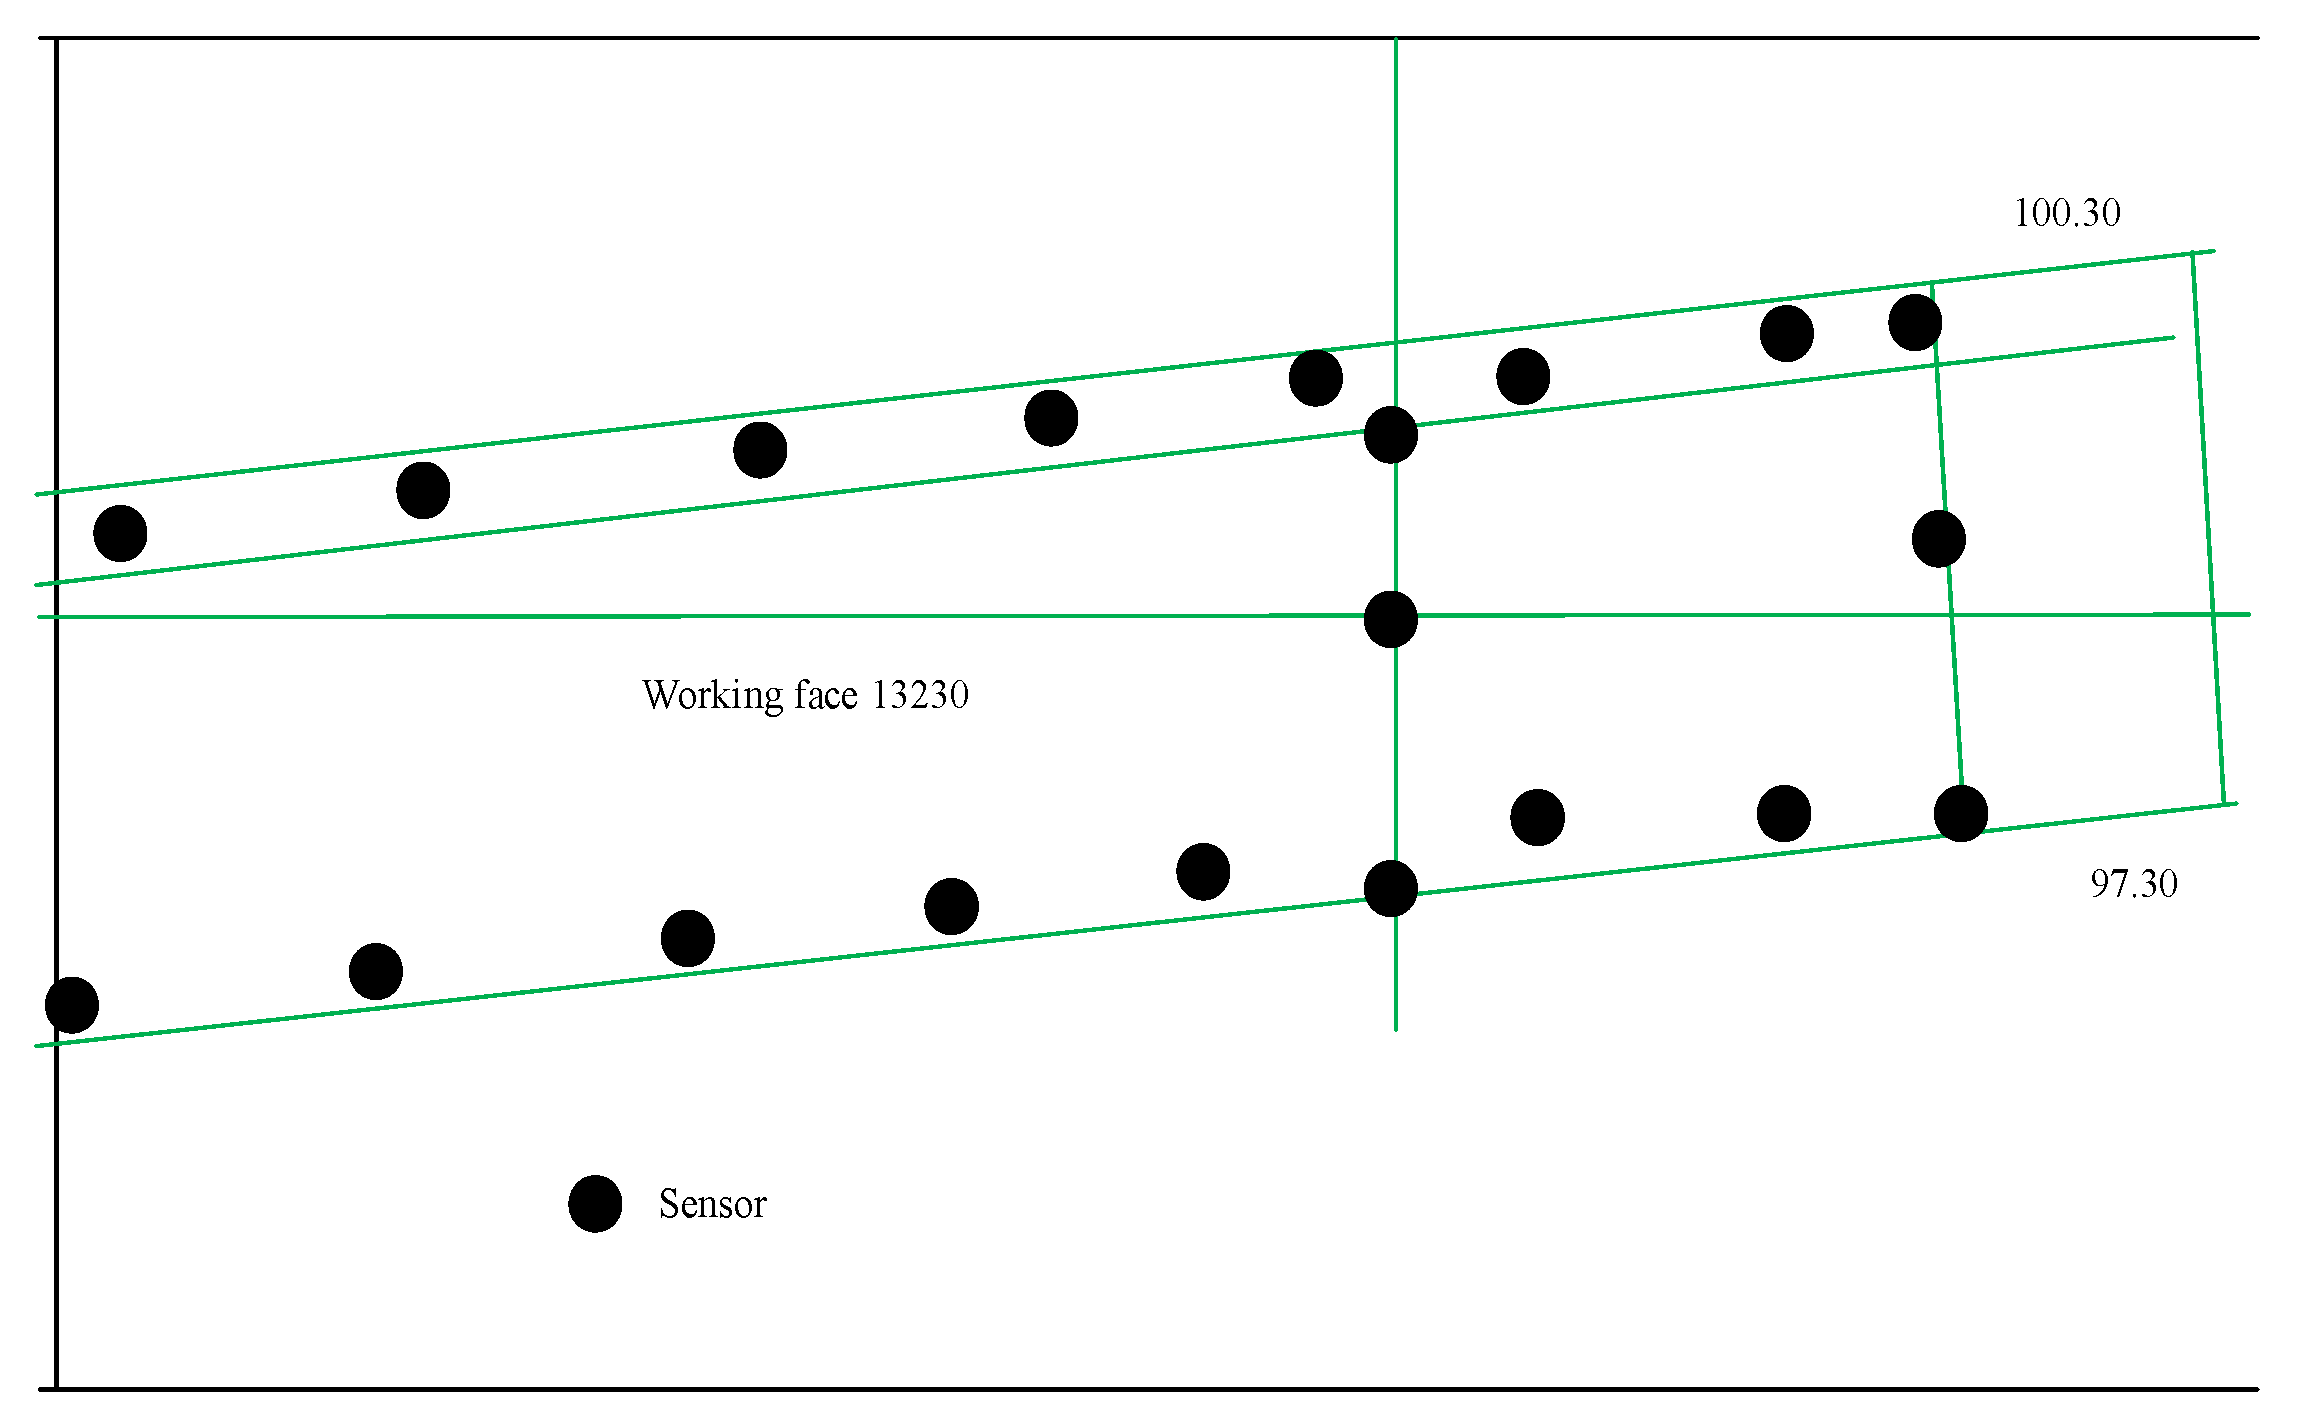
2.1.1. Geological Structure and Gas Concentration Detection in the Coal Mine Area

In order to accurately detect the gas geological structure and hydrogeological structure of the coal seam working face, based on the theory of wireless electromagnetic wave perspective of the coal seam, this paper uses the wireless wave tunnel perspective instrument to detect the geological structure of the coal mine.
The radio wave tunnel perspective device receives electromagnetic waves based on their propagation characteristics. When electromagnetic waves propagate in underground coal mines, because different rocks and ores have different degrees of electrical properties (resistivity and dielectric constant), they will have different absorption effects on electromagnetic wave energy, which will reduce the strength of the received electromagnetic waves. Compared with the theoretical field strength, a “shadow area” will form. According to the “shadow area”, the geological structure of the coal mine can be inferred and interpreted.
When the radio wave tunnel perspective instrument is used to detect the geological structure of a coal mine, the transmitter and receiver are located in different tunnels and simultaneously move at the same time, transmitting and receiving electromagnetic waves point by point. The transmitter can also be fixed at a certain position within a certain time, and the receiver can receive its field strength value point by point within a certain range.
Set the midpoint of the radiation source (antenna axis) of the radio wave tunnel perspective instrument o as the origin point, then the distance between observation point ς to o is L , then ς the electromagnetic wave intensity of point U ς can be described as [14,15]:
U ς = U 0 ( e β L / L ) f ( θ )
where U 0 represents the initial field strength of the coal seam around the antenna at a certain transmission power, β represents the absorption coefficient of the coal seam to electromagnetic wavs, f ( θ ) is the direction factor, where θ is the included angle between the dipole axis and the direction of the observation point, generally used f ( θ ) = s i n θ to calculate.
Coal mine gas is a general term for various flammable and explosive gases. With alkane as the main component, it is stable in nature, insoluble in water and difficult to detect. As different gases have different absorption spectra for infrared light, they will form characteristic absorption peaks in the infrared band. Therefore, coal mine gas can be identified by its absorption spectrum. A gas concentration detection method based on infrared differential spectral absorption is proposed in this paper. The wavelengths of alkanes are usually 1.65 μm and 1.33 μm, and the higher the concentration, the stronger the absorption. The absorption relationship follows the Lambert–Beer law, which is described as:
I = I 0   U ς exp ( c l + l + γ + μ )
where I is the transmitted light intensity, I 0 is the incident light intensity, c is the gas concentration, l represents the length of infrared light passing through the gas, represents the absorption coefficient of gas to infrared light, l is the Rayleigh scattering coefficient, γ is the Mie scattering coefficient, μ refers to the absorption coefficient caused by gas density fluctuation.
Because μ reflects the average, which will change with time and is a random quantity, determining the concentration of the gas to be measured by Formula (1) c is more difficult. In order to solve this problem, two wavelengths with a small difference in values but different absorption coefficients can be selected according to the dual-wavelength detection principle λ 1 and λ 2 , respectively corresponding to the working wavelength and reference wavelength of the gas to be measured. We can get:
I ( λ 1 ) = I λ 1 I 0 ( λ 1 ) U ς exp ( ( λ 1 ) c l + l ( λ 1 ) + γ ( λ 1 ) + μ ( λ 1 ) )
I ( λ 2 ) = I λ 2 I 0 ( λ 2 ) U ς exp ( ( λ 2 ) c l + l ( λ 2 ) + γ ( λ 2 ) + μ ( λ 2 ) )
When the difference between the values of λ 1 and λ 2 is very small, the corresponding l , γ , and μ will be approximately the same, so the error caused by gas density fluctuation can be eliminated. Order λ 1 I 0 ( λ 1 ) = λ 2 I 0 ( λ 2 ) , and Taylor expansion can be used to obtain the gas concentration, which is described as:
c = 1 ( λ 1 ) ( λ 2 ) l × I ( λ 2 ) I ( λ 1 ) I ( λ 2 )
Formula (5) eliminates the interference factors of the light path and the influence of the unstable light output power of the light source, and can accurately detect the gas concentration.

2.1.2. Determination of Main Parameters of Hydraulic Fracturing

Before using hydraulic fracturing technology to deal with the gas problem, it is also necessary to determine the main technical parameters of hydraulic fracturing according to the relevant theories, combined with the detected coal mine geology and coal mine gas concentration, in order to ensure the smooth implementation of hydraulic fracturing technology.
The main parameters of hydraulic fracturing technology are as follows:
(1)
Water injection pressure of the water pump
According to the research on the hydraulic fracturing fracture propagation mechanism, the water injection pressure is mainly affected by the tensile strength of the coal mine rock mass. Due to the uncertainty of rock fracture toughness parameters, the injection pressure of high-pressure water during hydraulic fracturing is determined by the tensile strength limit value of the coal mine rock mass. The high-pressure water pressure of directional fractures P can be described as [16]:
P = 1.3 ( P z + R r )
where, P z refers to the stress of the rock mass at the fracture site, which is determined by geological conditions and mining conditions of coal seams and adjacent coal seams, and can be approximately calculated by dead weight stress, R r indicates the tensile strength limit of the rock.
(2)
Fracturing angle
From the perspective of the fracturing effect, the higher the fracturing height, the higher the affected coal mine strata height. Therefore, the minimum angle should be selected for the fracturing angle. From the perspective of drilling machines and tools, since the drilling position is in the cutting hole and close to the top plate, the elevation angle of the machines and tools is between 30° and 60°. Considering the length of a single section of the water injection pipe, according to the Pythagorean theorem, the expression between the fracturing angle and the length of the water injection pipe is [17]:
cos α = h n g
where α is the fracturing angle, h is the thickness of the coal seam, n represents the number of water injection pipe sections, and g represents the length of a single section of the water injection pipe.
(3)
Borehole spacing
Fracturing hole spacing has a very important impact on the fracturing effect. Too large a spacing may lead to the hydraulic crack propagation distance not reaching the established area, resulting in a poor fracturing effect. If the spacing is too small, the hydraulic crack may contact too early, which will reduce the water pressure and affect the fracturing effect. Therefore, reasonable fracturing spacing is of great significance for field effect. The extension distance of hydraulic fractures is influenced by various factors. The greater the power of the pump, the greater the propagation distance of the hydraulic crack. The larger the tensile strength of the rock mass is, the smaller the crack propagation distance will be. Therefore, the drilling spacing cannot be generalized and should be designed separately according to the site conditions. It should be noted that in areas where it is difficult for the end triangle area to collapse, the spacing of boreholes should be reduced as appropriate, and spare holes should be set up. When the spacing is reduced for fracturing, the spare holes should be fractured.
(4)
Crack initiation pressure
The initiation pressure refers to the minimum pressure when the hydraulic crack begins to expand in hydraulic fracturing engineering. Its size mainly depends on the tensile strength of the coal mine rock mass and the in-situ stress distribution. Combining these factors, the initiation pressure P w can be described as:
P w = 179 ( 88 / ( 0.0051 H 0.7 P ) )
where H indicates the mining depth of the coal mine.

2.1.3. Implementation of Hydraulic Fracturing Technology

According to the determined technical parameters of hydraulic fracturing, combined with the actual situation of the coal mine, a reasonable and scientific hydraulic fracturing scheme is formulated for gas control in the coal mine.
The treatment of coal mine gas by hydraulic fracturing technology mainly includes selecting technical equipment, arranging fracturing holes, preparing fracturing fluid, sealing materials, injecting fracturing fluid, and sealing holes.
(1)
Select technical equipment
Hydraulic fracturing technology mainly involves high-pressure fracturing systems, automatic control water tanks, pipeline systems, electric control cabinets, packers, orifice anchors, and other equipment. The high-pressure fracturing system and pipeline system are the key parts. The high-pressure fracturing system mainly refers to the high-pressure fracturing pump, which is used to press the fracturing fluid and proppant into the coal seam. The pipeline system is mainly composed of seamless steel pipes and pressure-resistant rubber hoses, which are used to transport fracturing fluid.
(2)
Arranging fracturing holes
The layout plan of hydraulic fracturing holes is formulated according to information such as pipe performance, coal seam location, and coal body structure. When formulating the layout plan, the following principles should be followed: first, the drilling depth should refer to the coal seam structure, fracturing location, and gas concentration distribution; second, the layout plan should match the roadway layout and mining progress; third, the drilling location should be close to the location with sufficient materials and an unobstructed power supply.
(3)
Preparation of fracturing fluid and sealing material
Fracturing fluid is a heterogeneous and unstable mixture composed of various additives in a certain proportion. In practice, ceramsite or quartz sand is generally mixed with water in a certain proportion to make a sand carrier as fracturing fluid. When the fracturing fluid is injected into the fracturing hole, it needs to be sealed to prevent slurry loss, channeling, or leakage. Hole sealing is a key operation to determine the success of hydraulic fracturing. Generally, cement is used together with a certain amount of expansion agent and water reducer to make hole sealing materials, while polyurethane and other materials are used for capping.
(4)
Grouting and hole sealing
After the preparation of fracturing fluid and sealing material, grouting can be started. According to the drilling depth, sectional grouting can be adopted. After grouting, polyurethane shall be used for capping. During capping, attention shall be paid not to leave gaps with surrounding rock walls, and seamless bonding shall be achieved.
According to the above operations, the hydraulic fracturing operation for the area to be treated in the coal mine is completed, which can improve the permeability of the coal seam in this area, make the gas flow out along the gap, and effectively reduce the gas concentration.

2.2. Hydraulic Fracturing Fracture Monitoring Based on Microseismic Monitoring Technology

According to the description in the previous section, a complex fracture network will form in the process of gas treatment by hydraulic fracturing technology, and the distribution of these fractures will directly affect the fracturing effect. In order to achieve an ideal fracturing effect, it is necessary to monitor the fractures formed during the whole process of hydraulic fracturing operation.
In the past, hydraulic fracturing monitoring often used indirect methods such as pressure analysis and well testing analysis, but microseismic events often had small energy and weak signals, resulting in limited resolution of monitoring results. For the detection of deep or complex geological structures, it may be difficult to obtain high-precision data. At the same time, the effective range is affected by various factors, such as the attenuation of seismic waves and the complexity of geological structures, which may interfere with microseismic signals. It is not intuitive, the monitoring range is limited, and it is difficult to meet the monitoring requirements of large-scale hydraulic fracturing. Therefore, it is necessary to use more accurate and reliable fracturing monitoring techniques to evaluate the fracturing effect.
Due to the anisotropic distribution of formation stress, the shear stress naturally accumulates on the section, and generally, the section will be in a stable state. However, when the original stress state is disturbed by hydraulic fracturing, the stress concentration and strain energy near the original or new fractures in the rock increase [18]. According to the theory of fracture mechanics, when the external force increases to a certain extent, the stress intensity factor of the formation is greater than the fracture toughness, and microyielding or deformation and fracture expansion will occur in the defect area of the original fracture, which will relax the stress, and part of the strain energy will be released in the form of elastic waves (acoustic waves), that is, microearthquakes will occur, forming microearthquake events [19]. Microseismic monitoring technology monitors the effect of hydraulic fracturing in real time by observing, analyzing, and locating microseismic events generated during fracturing. Because of its technical advantages, microseismic technology is widely used in hydraulic fracturing fracture monitoring at home and abroad. It is currently a fracture monitoring method with high effectiveness and reliability.

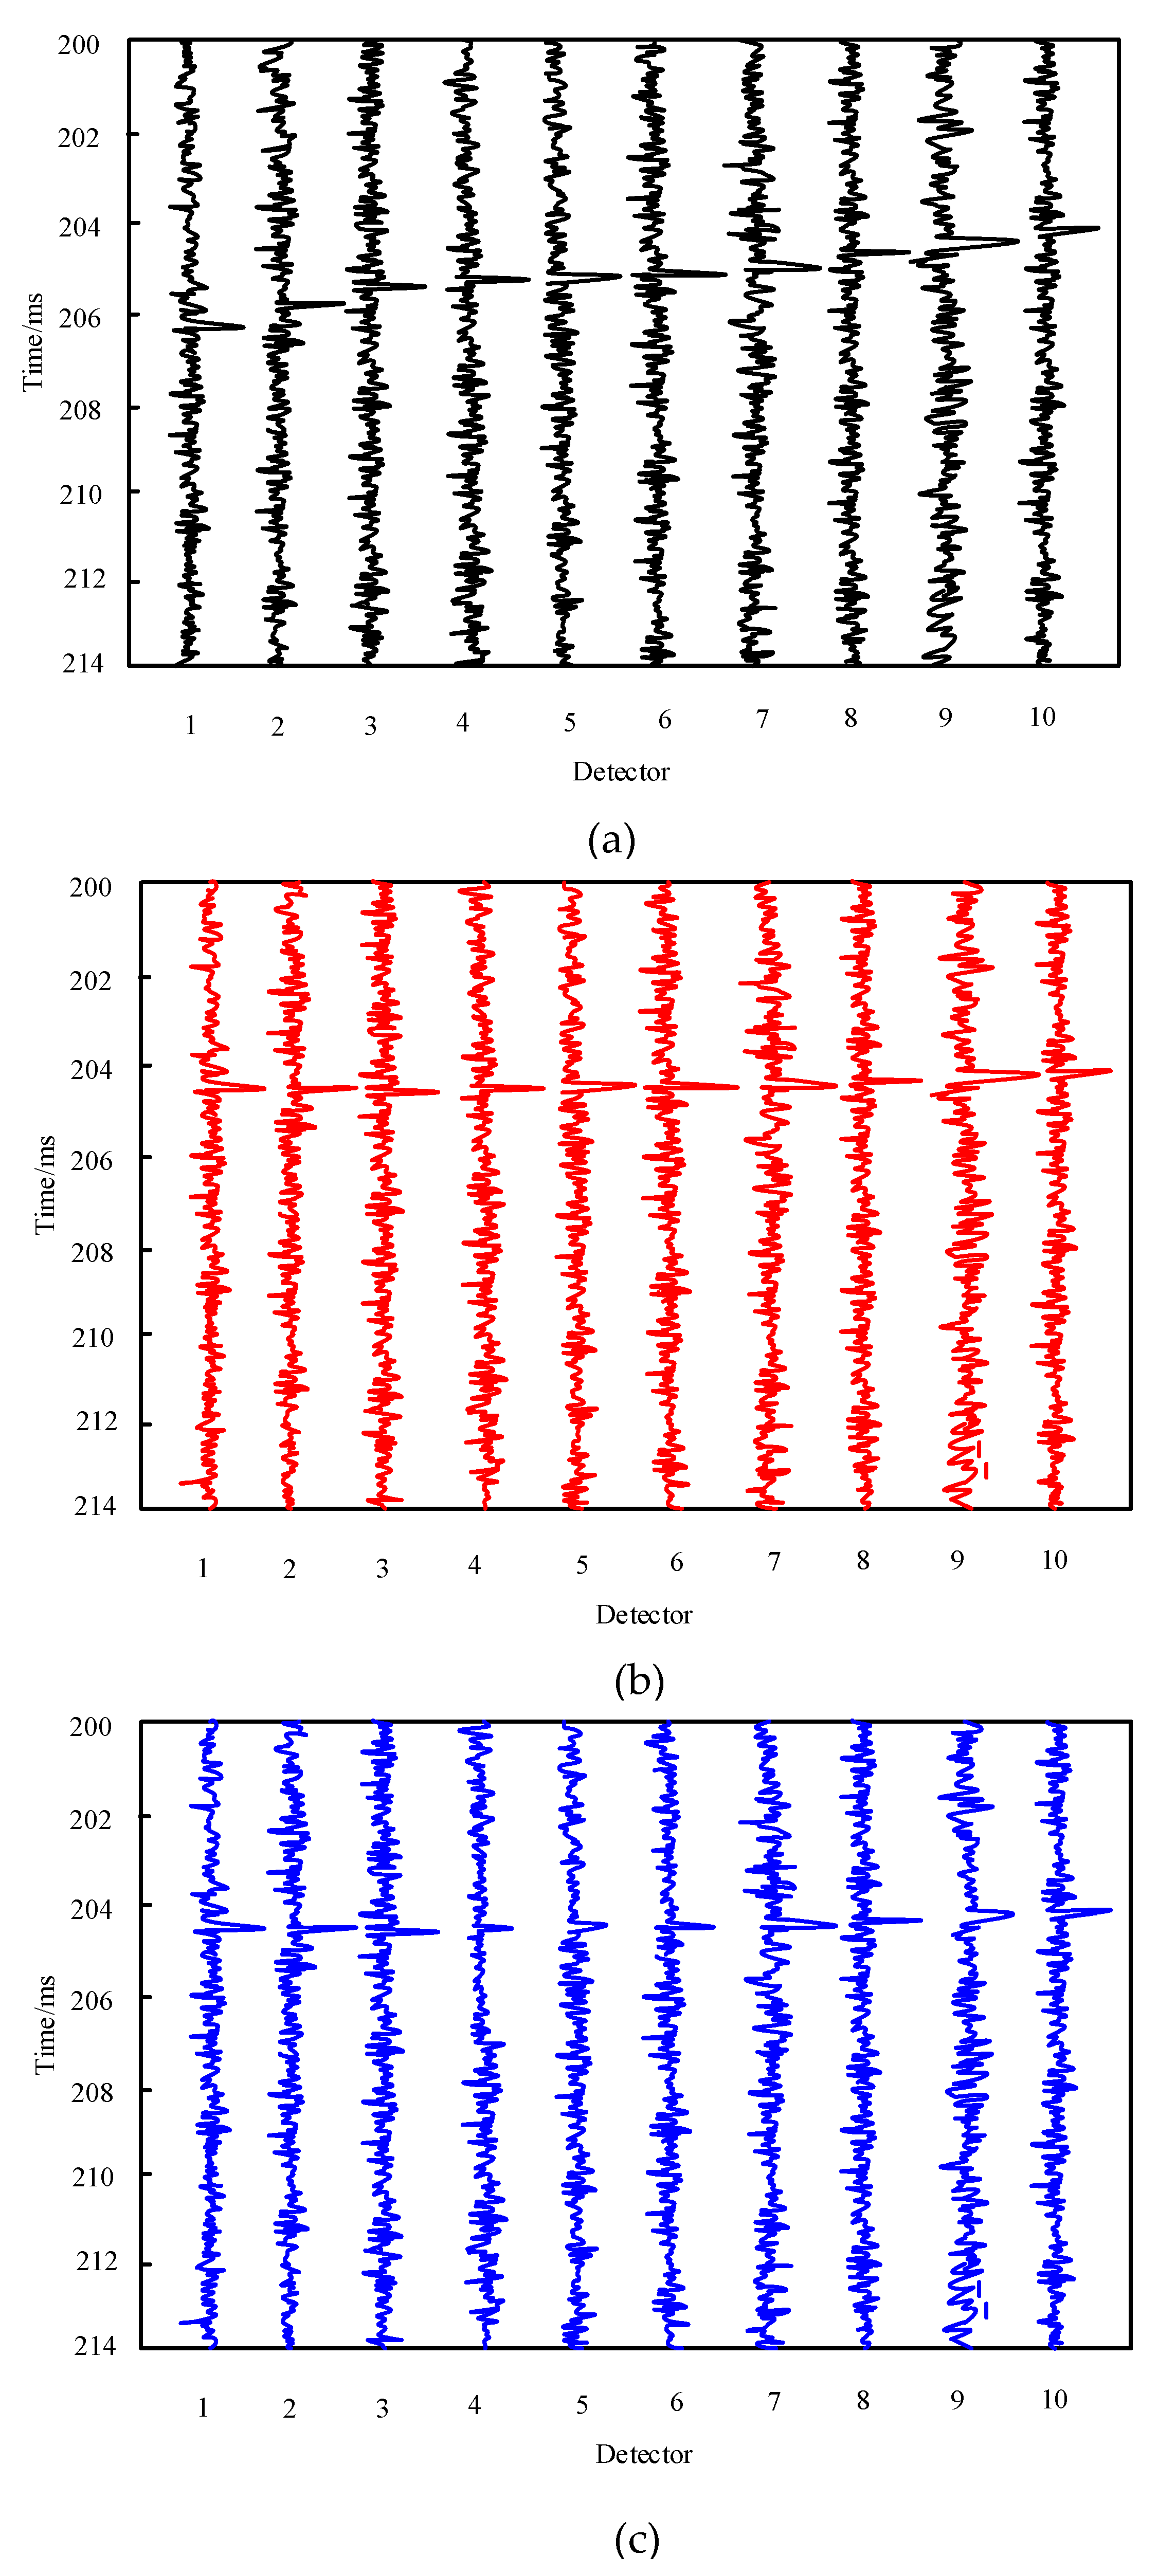
2.2.1. Microseismic Signal Acquisition

Because the microseismic signal is “weak, high, and short”, the microseismic signal must be recorded continuously with a high sampling rate, wide frequency band, and wide dynamic range. The signal acquisition device is mainly a detector (a detector is a device that detects some useful information in the microseismic fluctuation signal and is used to identify the existence or change of waves, oscillations, or signals). The signal transmission is carried out by optical cable, which can ensure that the microseismic signal is free from electromagnetic interference in the transmission process, has a higher transmission bandwidth, and can also support a higher sampling rate, making the transmission distance longer.
In the acquisition process of microseismic signals, the deployment of geophones is very important. A certain number of geophones should be deployed at corresponding points according to the current coal mine construction situation and monitoring requirements, and the geophones should be arranged as close as possible to the depth of the target layer, so as to ensure the acquisition of information data at the depth of the geophones. In addition, on the premise of ensuring good geophone coupling, various background noise interference should be minimized to avoid fracturing vehicles, personnel and vehicles, production and construction wells, etc.

2.2.2. Automatic Identification of Microseismic Events

The identification of microseismic events is an important link in dealing with microseismic problems. Rapid and accurate automatic identification of microseismic events can not only improve the processing efficiency but also effectively improve the accuracy of source inversion and positioning. Therefore, for the identification of microseismic events, this paper performs static correction for the entire data by picking up the representative microseismic event time difference. Then, the data of each detection trace are vertically stacked to obtain a model trace, which can not only highlight the effective signals of microseismic events, but also suppress random interference. Secondly, the data in the model trace are transformed by Hilbert transform, and the instantaneous envelope of energy is obtained to further highlight the signal energy. Finally, given the threshold value, the microseismic events are automatically identified according to the criteria, and the identification results are obtained.
The main purpose of static correction for microseismic record data is to flatten some first breaks into a straight line by using the correction moveout, so that the first breaks of each detection trace have the same arrival time. The so-called high-fidelity static correction is that when the correction moveout is not an integer multiple of the sampling interval, high-precision static time shift is achieved by using the interpolation filtering method. The basic principle is the sampling theorem.
The filter factor of the interpolation filter can be regarded as an ideal filter factor. The output and input of the microseismic signal filtered by the interpolation filter are the same, which can not only maintain the original waveform but also not change the frequency component of the original signal. Instead of resampling the sampling points of encrypted microseismic data, resampling the sampling points of encrypted filter factors by interpolation functions (interpolation filter factors). The convolution operation of the signal and interpolation filter factors is equivalent to encrypting the sampling points of the signal, so that the time shift value of static correction can reach sufficient accuracy.
In practical application, the static correction moveout is divided by the sampling point, and the result can be divided into an integer part and a decimal part. For the integer part, the corresponding points can be moved directly for static correction. For the decimal part x , interpolation method can be used to realize static correction. Selecting s i n c as an interpolation function, the function is described as [20]:
s i n c ( x ) = ( ( sin π x ) / π x )
The sampling rate of the interpolation function can be selected according to the accuracy requirements, and the average value of each detection trace data is used as s i n c , the maximum value of the function. Divide the remainder obtained by the sampling rate to obtain the number of sampling points of the interpolation function during this period k , and then the s i n c function moves forward k points, and the interpolation filter function H ( t ) is obtained. Use H ( t ) data corrected with integer part x ( t ) to perform the convolution operation according to Equation (10), complete the static correction, and obtain the static corrected microseismic record data, which is described as:
x ( t ) = x ( t ) × H ( t ) P w cos α
After static correction processing, the first breaks of microseismic events are flattened or roughly flattened into a straight line, and there is basically no time difference for each first break.
Since the energy of microseismic signals is weak and basically submerged in noise, in order to effectively identify microseismic events, it is necessary to highlight effective signals and suppress random interference. In order to highlight the effective signal, the data of each detector channel detected by the geophone are superimposed into one-channel data, which is called a model channel. The calculation formula is as follows:
X ( j ) = i = 1 M x i ( j ) x ( t ) , j = 1 , 2 , , N
where X ( j ) is the microseismic data after stacking on the model trace, x i ( j ) is the static corrected microseismic data in each detection trace, j is the serial number of the sampling point, i is the detection channel number of the seismic record, M is the number of geophone stages, and N is the total number of sampling points per channel.
In order to better identify microseismic events, it is necessary to further highlight the effective signals. The stacked microseismic data can be transformed by Hilbert transform to obtain its envelope. The Hilbert transform operation can amplify the microseismic signal, that is, a real microseismic signal can be represented as a complex signal (i.e., an analytical signal), so that the relevant information in the microseismic signal can be clearly identified.
Set the microseismic signal after stacking as X ( t ) , and its spectrum is X ( f ) , then there are:
X ( t ) = 0 + X ( f ) e 2 π f d f + 0 + X ( f ) e 2 π f d f
where f represents the spectrum value.
Because X ( t ) is a real signal, the above formula can be converted into:
X ( t ) = Re 0 + 2 X ( f ) e 2 π f d f
At the same time, you can take X ( t ) as a complex signal’s real part, s ( t ) , namely:
s ( t ) = X ( t ) + i X ˜ ( t ) = 0 + 2 X ( f ) e 2 π f d f
where X ˜ ( t ) is the Hilbert transformation of X ( t ) , and s ( t ) is the complex signal of X ( t ) .
According to the Hilbert transform, we can obtain X ( t ) ’s instantaneous envelope, instantaneous phase, and instantaneous frequency, which are described as:
E ( t ) = s ( t ) = X 2 ( t ) + X ˜ 2 ( t )
ϑ ( t ) = arctan X ˜ ( t ) X ( t )
ψ ( t ) = d ϑ ( t ) d t = d d t arctan X ˜ ( t ) X ( t )
where E ( t ) , ϑ ( t ) , and ψ ( t ) are, respectively, the instantaneous envelope, instantaneous phase, and instantaneous frequency of X ( t ) .
After the envelope of the microseismic signal is obtained by superposition and Hilbert transform, a threshold value needs to be set to judge whether there is a microseismic event. It is considered that a microseismic event is greater than the threshold value, and noise is less than the threshold value.
In actual processing, the setting of the envelope threshold is very important. If the set threshold is too large, it will cause missed detection of microseismic events. On the contrary, if the threshold value set is too small, the noise may be regarded as a microseismic event. For different microseismic data, the threshold value is also different. The threshold value should be determined according to the microseismic data. Generally, the threshold value is usually set in the range of 2–6.

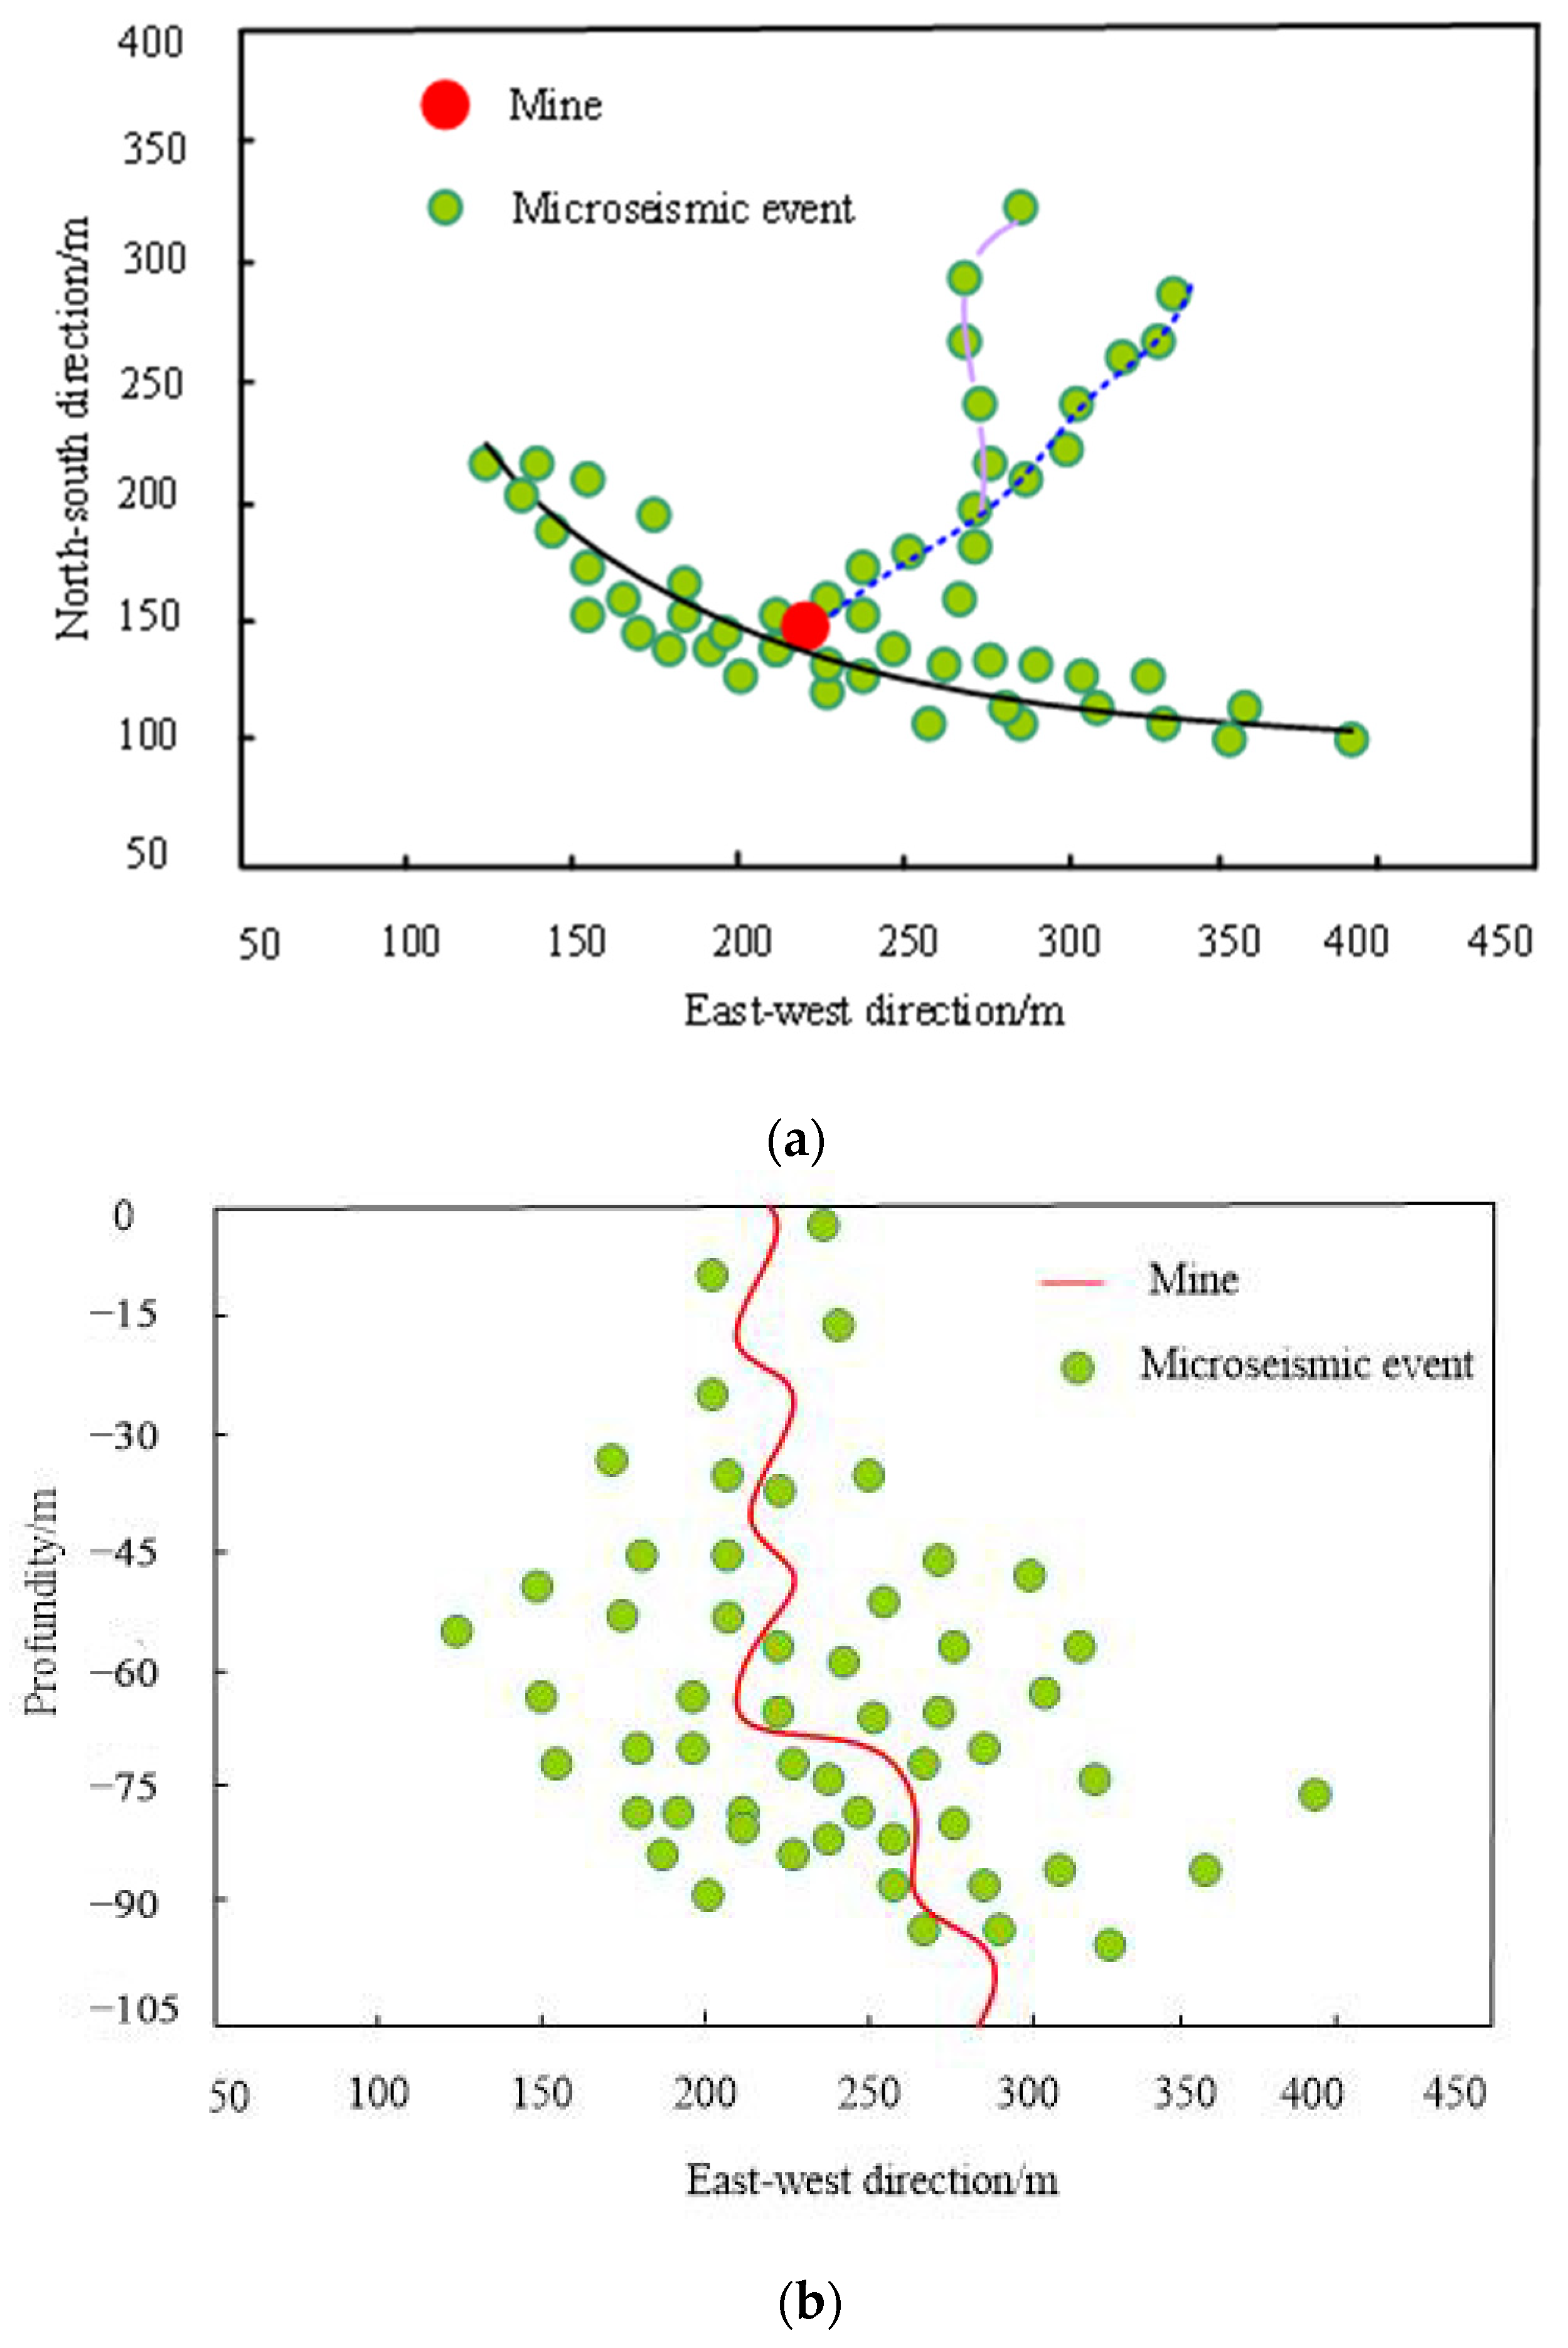
2.2.3. Inversion and Location of Microseismic Events

The ultimate purpose of microseismic event inversion and location is to image the fractures gathered by multiple sources and describe the fracture characteristics according to the spatial distribution of microseismic events, including their spatial location and spatial shape distribution.
When dealing with complex signals that contain multiple frequency components or nonlinear features, improper parameter settings or imprecise operation may lead to unnecessary errors. In the microseismic monitoring of hydraulic fracturing, the positioning method based on time difference is a common microseismic event inversion positioning method. This method can better evaluate the degree of fracturing caused by microseismic hydraulic fracturing and understand the development of fractures, and then accurately evaluate the fracturing effect of hydraulic fracturing technology. Therefore, this paper constructs the objective function of microseismic event inversion and location based on travel time residuals, that is, the square sum of the difference between the actual observation time difference and the theoretical time difference (the difference between the two differences). The grid search method under the constraint of polarization analysis is used to repeatedly search and iterate until the objective function reaches the minimum value. At this time, the corresponding variable value is the optimal solution.
Different time difference functions are constructed according to different actual observation times, which are recorded as Δ T i (of which i = 1 , 2 , , m , where m is the number of geophones), then there are:
Δ T i 1 = T i S T i P
Δ T i 2 = T i P T m P
Δ T i 3 = T i S T m S
where T i S and T i P are the i S-wave arrival time and P-wave arrival time recorded by geophones, respectively, and T m S and T m P are the m S-wave arrival time and P-wave arrival time recorded by geophones, respectively. The construction of the actual observation time difference function is mainly based on the first break picking of P-waves and S-waves in actual microseismic records.
The construction of the theoretical TDOA function is determined by the actual observation TDOA function, and the two should correspond to each other. Construct the theoretical TDOA function corresponding to the actual observed TDOA function Δ T , which can be described as:
Δ T i 1 = T i S T i P
Δ T i 2 = T i P T m P
Δ T i 3 = T i S T m S
where T i S and T i P are calculated according to the ray tracing principle i S-wave time and P-wave time of geophones, and T m S and T m P , respectively, from the source to the m S-wave time and P-wave time of each geophone.
The sum of the squares of the difference between the actual observed time difference function and the theoretical time difference function is recorded as R i 2 , and its cumulative residual sum and W can be described as:
W = i = 1 m R i 2 ψ ( t ) = i = 1 m ( Δ T Δ T ) 2
The steps of microseismic event inversion and location based on the travel time residual method are as follows:
(1)
Set the search range and its step size. Centered on the center point of the fracturing well, set according to the actual situation x , y , z search range of direction (i.e., respectively, setting x the upper and lower limit of direction search are x max and x min , y the upper and lower limit of direction search are y max and y min , z the upper and lower limit of direction search are z max and z min ) and the step size Δ x , Δ y , Δ z ;
(2)
Input the first break, geophone coordinates, velocity model and initial source coordinates of microseismic events ( x , y , z ), order x = x min , y = y min ;
(3)
Build the objective function according to Equation (24) and set the minimum objective function value Q min ;
(4)
Polarization analysis is used to constrain the search direction. Calculate the azimuth between the source coordinate and the geophone, that is, the propagation direction of the source δ ( δ = ar tan ( d y d x ) , d x and d y are the source and geophone located in the x , y coordinate difference in direction). Take δ and the azimuth obtained by polarization analysis of microseismic events β for comparison, if δ β < σ ( σ Indicates the azimuth angle error), then go to the next step z = z min ; otherwise order y = y + Δ y , and on the basis of y + Δ y to judge y . If y < y max , restart the fourth step; otherwise order x = x + Δ x , and on the basis of x = x + Δ x to judge x . If x < x max , then order y = y min , repeat step 4; otherwise, go to step 7;
(5)
When z < z max , the objective function is solved; otherwise, order y = y + Δ y , return to step 3;
(6)
Find the minimum value of the objective function. Solve the objective function to obtain the value of Q , compare the value of Q and the set Q min and assign the smaller of the two to the smallest Q min , and then order z = z + Δ z , return to step 5;
(7)
When x > x max , the output objective function is the minimum value, and the corresponding coordinate (optimal solution) is searched, that is, the location of the microseismic event.
Through the inversion positioning of microseismic events, the source parameters of microseismic events such as time and space can be identified. The inversion results can describe the length, width, and height of the fractures generated by hydraulic fracturing, as well as the swept area of fracturing fluid and other parameters, so as to make an effective and reasonable evaluation of the fracturing effect. At the same time, the fracturing parameters can also be adjusted in real time according to the monitoring results, remove W , improve the construction scheme, and guide the fracturing construction in real time, so as to better control the coal mine gas.

3. Experimental Analysis

Taking a coal mine in a province as the experimental object, the coal mine has an area of about 80 km2, geological resources of 1400 Mt, designed recoverable reserves of 650 Mt, a designed production capacity of 3 million tons/year, a designed shaft and roadway engineering quantity of 25,000 m, a total building area of about 55,000 m2, and a total construction land area of about 42 hectares. The coal types are mainly long flame coal and non-caking coal. The coal quality is good, belonging to high-quality coal with low ash, low sulfur, low phosphorus, high calorific value, and high volatile matter. The coal seam is stable and has the resource conditions to build a modern mine. However, the geological structure of the coal mine is complex, the coal seam permeability is poor, and gas drainage is difficult. Seen from the actual production situation of the coal mine, the outburst of the mine is relatively serious, and the rate of borehole blowout exceeds 1/3. Since the construction of the mine, gas outburst accidents have occurred many times.
In order to verify the effectiveness of the method in this paper, combined with the actual production situation of the coal mine, the method in this paper was used to control the gas in a certain area of the coal mine. Firstly, the radio wave tunnel perspective instrument is used to detect the rock structure in this area, and the hydraulic fracturing plan is formulated according to the detection results. The sand-carrying agent made of a mixture of quartz sand and water is used as the fracturing fluid, and the segmented grouting method is adopted. According to the hole depth, it is divided into three sections, with a segmentation ratio of 1:2:3. Each section has different grouting parameters. The grouting parameters are set as shown in Table 1. After grouting, the hole sealing operation was carried out. The specific process is as follows: After the first section of grouting, the expansion cement was poured to isolate the second section of fracturing fluid; after the second section of grouting, the expansion cement was poured again; Finally, after the third section of grouting, polyurethane was used for capping. The experimental parameters of hydraulic fracturing are shown in Table 2. The detection results of the rock stratum structure in this area using the radio wave tunnel perspective instrument are shown in Table 3, the final test results are shown in Figure 1.
Through the detection of the radio wave tunnel perspective instrument, the coal seam structure in this area can be divided into 9 layers. The coal seams are mainly distributed in the fourth and eighth layers, with thicknesses of 4.5 m and 19.8 m, respectively. The other layers are mostly of various sandstone structures, and the sixth layer is mudstone. It can be seen that the coal seams in this area have many layers, complex structures, and poor permeability.
It can be seen from Figure 1 that before using the method in this paper, the gas concentration at each underground sampling point of the coal mine in this area exceeds the executive standard, so the gas needs to be discharged. After the treatment using this method, the gas concentration value of each sampling point in the coal mine has dropped below the executive standard value, reaching a safe state. It can be seen that the method in this paper has achieved good results in coal mine gas control, indicating that the method in this paper is effective.
When the microseismic monitoring method proposed in this paper is used to monitor the gas control process of hydraulic fracturing technology, the grid monitoring method is adopted in the experiment, which covers the target area evenly in all directions around the surface projection points of the fracturing section. This time, three monitoring lines were deployed, all of which were deployed along the well trajectory, and 20 VM-S112 three-component geophones were buried at each designed layout point, with a sampling interval of 1 ms. The layout of the microseismic wave sensors is shown in Figure 2.
In the experiment, the original microseismic data information was first detected by the geophone, and static correction was carried out. Using the reference [6] method as the comparison method, the comparison maps of the two methods before and after static correction of the microseismic data are shown in Figure 3. After the microseismic events were identified by the method in this paper, the inversion and positioning experiments were carried out for the microseismic events, and the results are shown in Figure 4.
As shown in Figure 3a, using the microseismic data detected by the geophone, the first break of the hydraulic fracturing microseismic event has a certain time difference on each detection trace before static correction. After the static time shift using the method in this paper, as shown in Figure 3b, the first break is flattened, and the time difference between the first breaks of each detection trace is almost the same, which can lay the foundation for subsequent data stacking operation. It can effectively improve the signal-to-noise ratio and vertical resolution of stacked data sections. As shown in Figure 3c, after using the method proposed in reference [6] for static time shifting, the first arrival wave becomes flattened, but it cannot be guaranteed that the time difference between the first arrival waves of each detection channel is equal. The correction effect is worse than that of the method proposed in this paper, indicating that the static correction effect of the method proposed in this paper is better.
It can be seen from Figure 3a that from the change trend of microseismic event points, with the hydraulic fracturing operation, the fractures caused by hydraulic fracturing mainly have three trends: one is the black line part, where the fractures expand in the east–west direction; the second is the blue line part, where the fractures expand in the east–west direction; and the third is the purple line part, where the fractures expand in two directions, first along the north–south direction, then they turn northeast. From the perspective of spatial distribution, the crack length of the black line part is about 275 m, the crack length of the blue line part is about 225 m, and the crack length of the purple line part is about 125 m. It can be seen from Figure 3b that the height distribution range of microseismic event points is about 0 m to −105 m, and the fracture height is about 100 m. Based on the above analysis, this method can clearly describe the spatial location, spatial shape distribution, and fracture development shape of the fracture. According to this result, the actual fracturing effect can be effectively and reasonably evaluated by comparing the expected fracturing effect.

4. Conclusions

(1)
This paper recognizes the importance and necessity of gas control, studies the application of microseismic monitoring, hydraulic fracturing, and other technologies in coal mines, and reviews the problems of high gas content, insufficient permeability of coal seams, and high gas concentration in some coal mines;
(2)
In this paper, hydraulic fracturing technology is used to control gas in coal mines, and the fracturing process is monitored by microseismic monitoring technology to evaluate the effect of fracturing. The assessment results are used to understand the actual construction process, to ensure that gas spreads to other coal seams, to dilute the gas concentration, to improve the efficiency of extraction, and to reduce the hazards of gas;
(3)
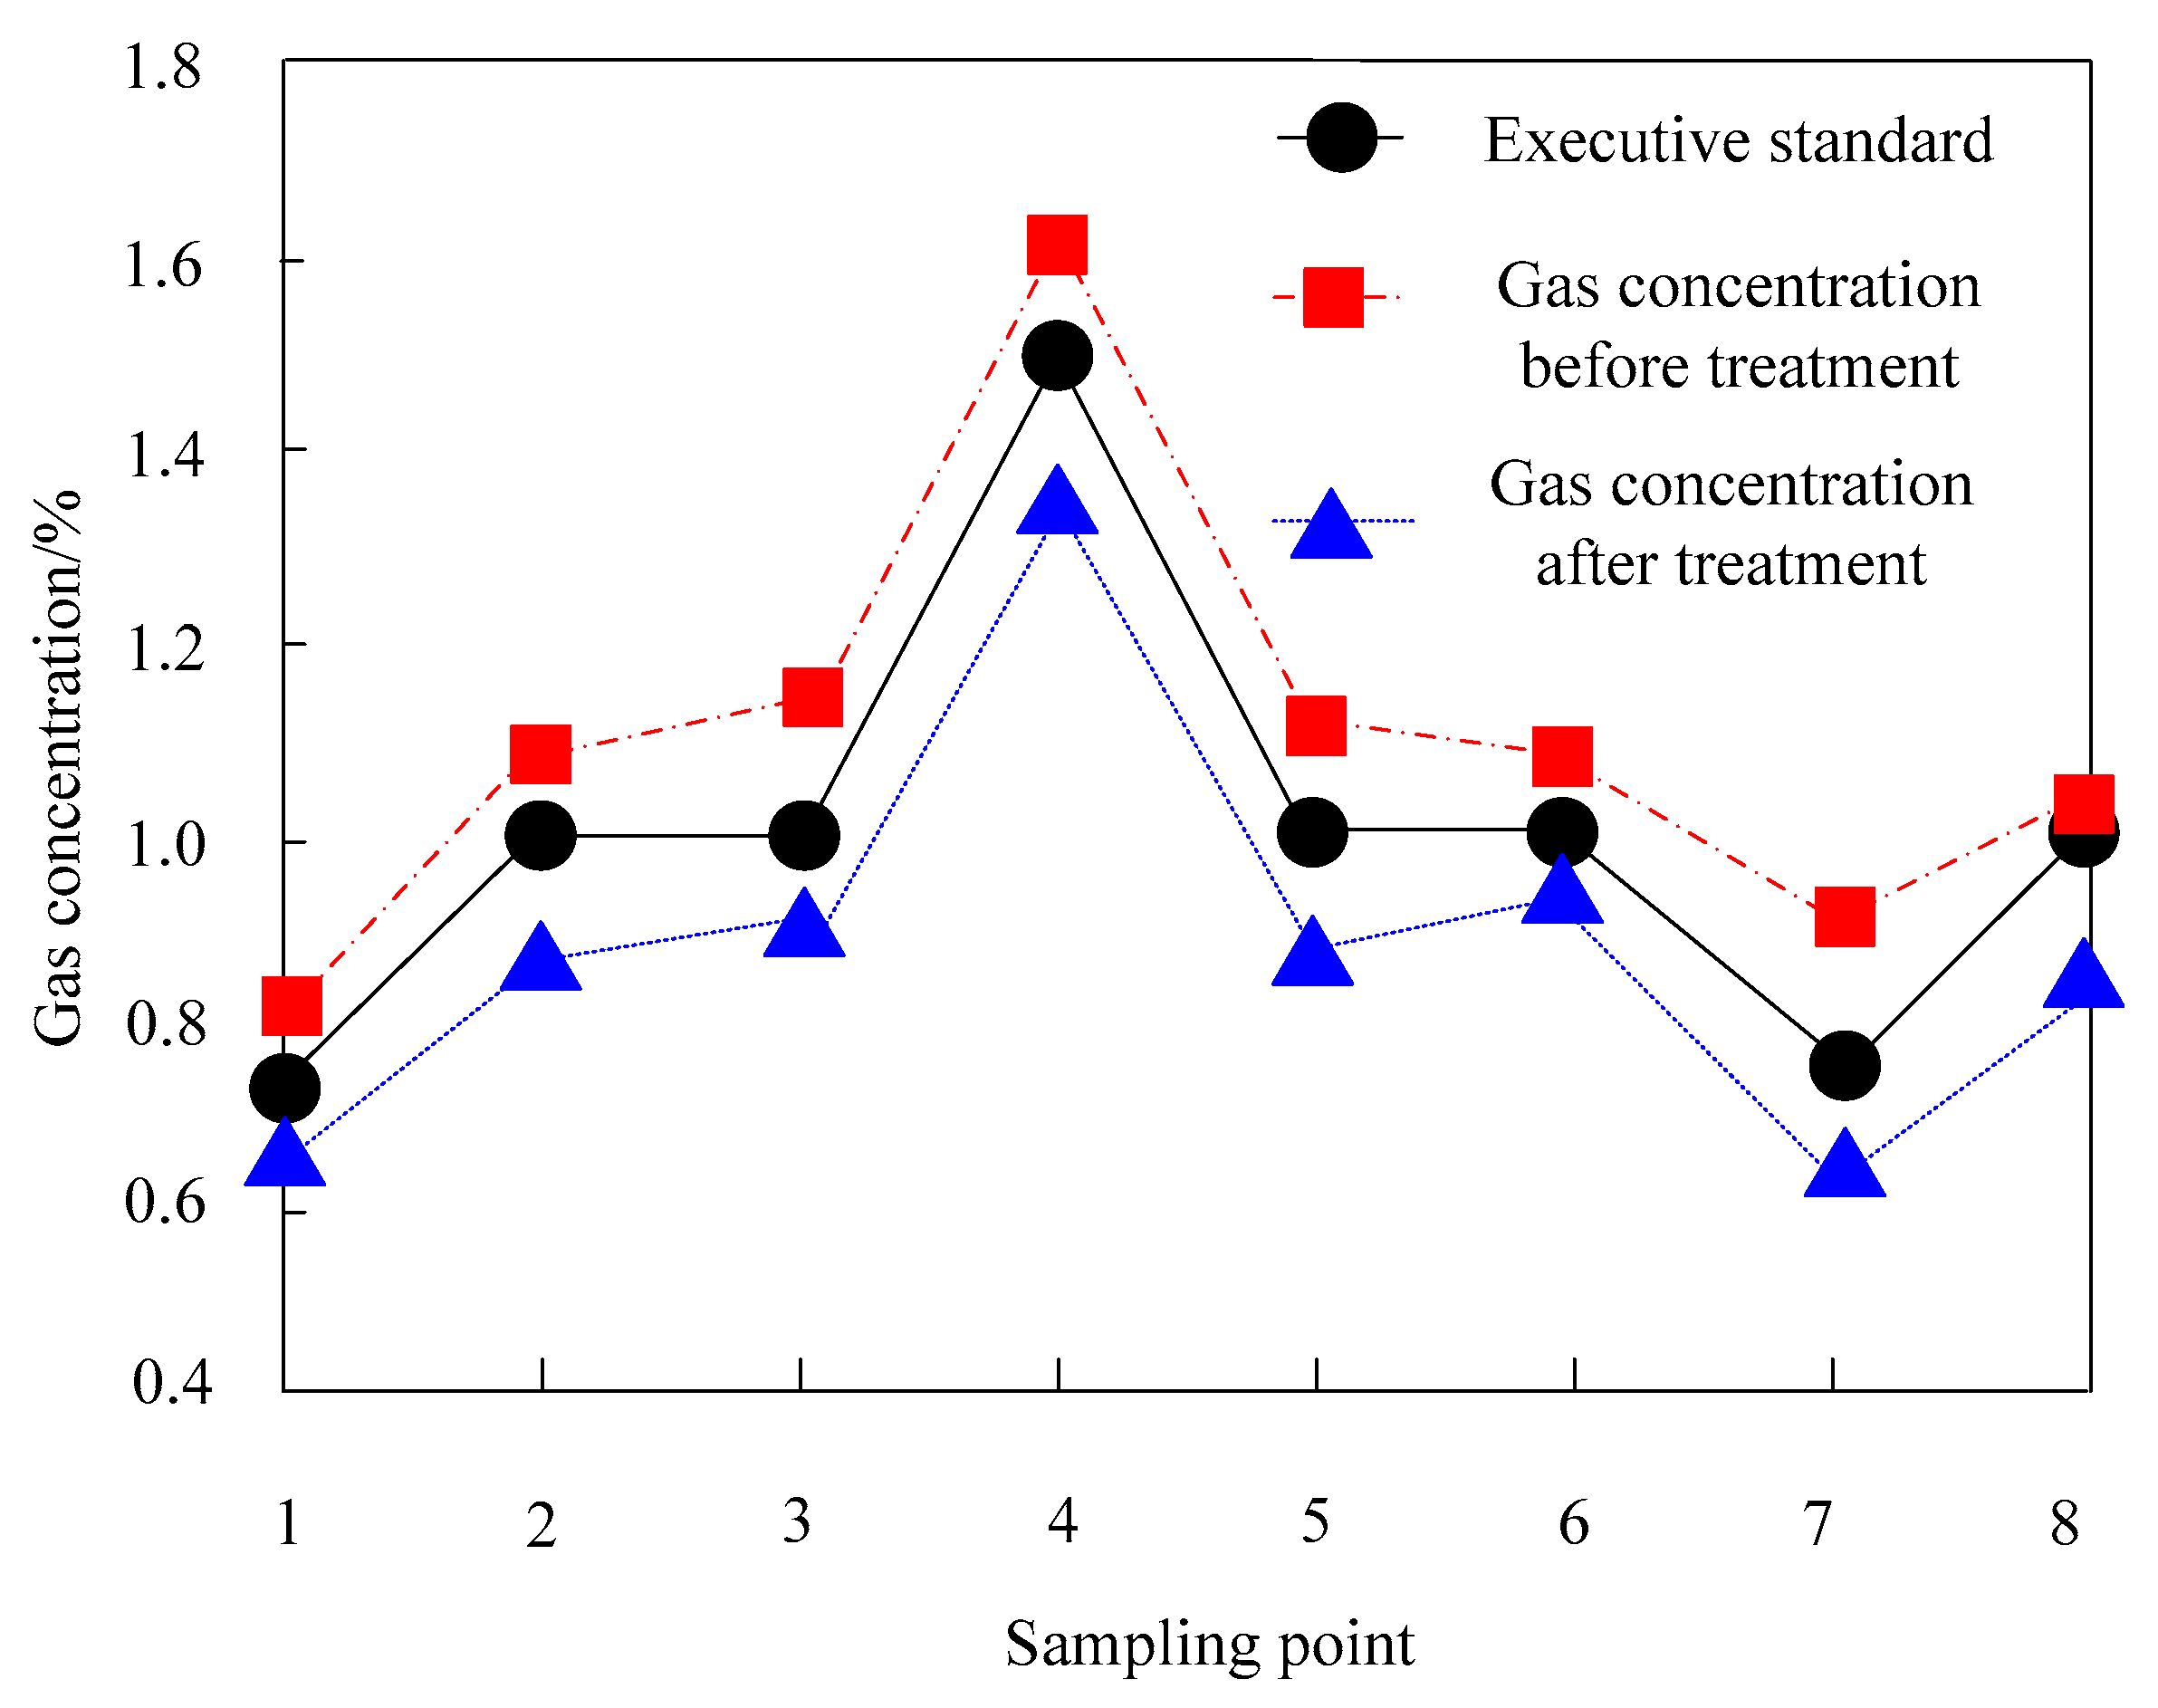
The advantage of this paper is that it is applied to coal mine gas management, which reduces the gas concentration to below the executive standard. Hydraulic fracturing technology can scientifically control the gas and has achieved good management results.

Author Contributions

Methodology, N.H.; Writing—original draft, H.S.; Writing—review & editing, F.G. All authors have read and agreed to the published version of the manuscript.

Funding

This work was supported by the Fundamental Research Funds for the Universities of Henan Province (Grant No. NSFRF240624).

Data Availability Statement

Data is contained within the article.

Conflicts of Interest

The authors declare no conflicts of interest.

References

  1. Yan, Z.; Wang, Y.; Fan, J. Research on safety subregion partition method and characterization for coal mine ventilation system. Math. Probl. Eng. 2021, 2021 Pt 17, 5540178.1–5540178.11. [Google Scholar] [CrossRef]
  2. Wu, D.M.; Zhang, Y.; Zhang, S.Q. Research on Video Smoke Detection in Coal Mine. Comput. Simul. 2021, 38, 446–449+496. [Google Scholar]
  3. Liu, X.G.; Zhou, J.L. Research on method of determination on coal powder content in gear oil for equipment used in coal mine. Ordnance Mater. Sci. Eng. 2022, 45, 114–118. [Google Scholar]
  4. Qin, M.; Zhang, Q.; Yue, J. Development and application of coal mine gas geological intelligent early warning system. Basic Clin. Pharmacol. Toxicol. 2021, 128, 45. [Google Scholar]
  5. Wamriew, D.; Charara, M.; Pissarenko, D. Joint event location and velocity model update in real-time for downhole microseismic monitoring: A deep learning approach. Comput. Geosci. 2022, 158, 104965.1–104965.10. [Google Scholar] [CrossRef]
  6. Huang, G.; Chen, X.; Saad, O.M.; Chen, Y.; Savvaidis, A.; Fomel, S.; Chen, Y. High-resolution and robust microseismic grouped imaging and grouping strategy analysis. Geophys. Prospect. 2022, 70, 980–1002. [Google Scholar] [CrossRef]
  7. Park, S.; Choi, Y. Bluetooth beacon-based mine production management application to support ore haulage operations in underground mines. Sustainability 2021, 13, 2281. [Google Scholar] [CrossRef]
  8. Deng, E.F.; Wang, Y.H.; Liang, Z. Seismic behavior of a novel liftable connection for modular steel buildings: Experimental and numerical studies. Thin-Walled Struct. 2024, 197, 111563. [Google Scholar] [CrossRef]
  9. Verliac, M.; Calvez, J.L. Microseismic monitoring for reliable c02 injection and storage-geophysical modeling challenges and opportunities. Lead. Edge 2021, 40, 418–423. [Google Scholar] [CrossRef]
  10. Ahamed, M.A.A.; Perera, S.; Elsworth, D.; Ranjith, P.G.; Li, D.Y. Effective application of proppants during the hydraulic fracturing of coal seam gas reservoirs: Implications from laboratory testings of propped and unpropped coal fractures. Fuel 2021, 304, 121394.1–121394.16. [Google Scholar] [CrossRef]
  11. Si, L.; Xi, Y.; Wei, J.; Li, B.; Wang, H.; Yao, B.; Liu, Y. Dissolution characteristics of gas in mine water and its application on gas pressure measurement of water-intrusion coal seam. Fuel 2022, 313, 123004.1–123004.11. [Google Scholar] [CrossRef]
  12. Shi, B.; Cao, Y.; Tian, L.; Zhang, J.; Liu, S. Co_2 gas fracturing in high dip angled coal seams for improved gas drainage efficiency at hashatu coal mine. Energy Fuels 2022, 313, 123004.1–123004.11. [Google Scholar]
  13. Shan, K.; Zhang, Y.; Zheng, Y.; Cheng, Y.; Yang, Y. Effect of fault distribution on hydraulic fracturing: Insights from the laboratory. Renew. Energy 2021, 163 Pt 2, 1817–1830. [Google Scholar] [CrossRef]
  14. Zhang, H.; Akram, J.; Innanen, K.A. A physics-guided neural network-based approach to velocity model calibration for microseismic data. Geophys. Prospect. 2022, 70, 737–750. [Google Scholar] [CrossRef]
  15. Han, Y.; Liang, F. Performance evaluation of sdagm-coated microproppants in hydraulic fracturing using the lattice boltzmann method. Can. J. Chem. Eng. 2021, 100, 1253–1264. [Google Scholar] [CrossRef]
  16. Lu, Y.; Zhang, S.; He, F.; Wang, L.; Wang, A.; Wang, M. Experimental and numerical simulation study on the relationship between cutting depth of high-pressure water jet with high traverse speed and disc cutter penetration of TBM in hard rock tunnel. Tunn. Undergr. Space Technol. 2023, 142, 1.1–1.16. [Google Scholar] [CrossRef]
  17. Xiaole, S.U.; Sun, H.; Wang, Y. Pythagorean Theorem & Curvature with Lower or Upper Bound. Chin. Ann. Math. Ser. B 2022, 43, 95–114. [Google Scholar]
  18. Wu, W.J.; Su, C.M.; Wen, S.; Li, Y.H.; Chen, C.H. Microseismic monitoring and stress inversion in northeast taiwan. Seismol. Res. Lett. 2021, 92, 1992–2003. [Google Scholar] [CrossRef]
  19. Si, L.; Zhang, H.; Wei, J.; Li, B.; Han, H. Modeling and experiment for effective diffusion coefficient of gas in water-saturated coal. Fuel 2021, 284, 118887.1–118887.9. [Google Scholar] [CrossRef]
  20. Yang, X.; Wang, G.; Du, F.; Jin, L.; Gong, H. N2 injection to enhance coal seam gas drainage (n2-ecgd): Insights from underground field trial investigation. Energy 2022, 239 Pt C2, 122247.1–122247.14. [Google Scholar] [CrossRef]
Figure 1. Situation before and after gas treatment.
Water 16 01062 g001
Figure 2. Layout of the microseismic wave sensors.
Water 16 01062 g002
Figure 3. Comparison of microseismic data before and after static correction. (a) Raw microseismic data information. (b) The microseismic data information after static correction using the method described in this paper. (c) The microseismic data information after static correction using the method are illustrated in the reference [6].
Water 16 01062 g003
Figure 4. Results of microseismic event inversion positioning. (a) Map of microseismic event inversion location results; (b) Profile of microseismic event inversion location results.
Water 16 01062 g004
Table 1. Grouting Parameter Settings.
NameStage 1Stage 2Stage 3
Grouting rate30 L/min50 L/min100 L/min
Grouting quantity1/6 of the total1/3 of the total1/2 of the total
Grouting pressure3 MPa2.5 MPa2 MPa
Gel time1 min1.5 min3 min
Table 2. Experimental Parameters of Hydraulic Fracturing.
NameMagnitude
Sticality of fracturing fluid50 mPa·s
The density of fracturing fluid1.5 g/cm3
fracturing fluid pH6
Adhesive concentration1.3%
Cracking construction pressure12,000 psi
Broken pressure10,000 psi
Broken steering force5000 psi
The amount of rupture fluid60 bbl/ft
Table 3. Results of Rock Structure Detection.
Strata Structure of Coal MineThickness/m
Medium sandstone15.2
Sandstone12.5
Fine sandstone9.8
Coal seam4.5
Sandstone10.8
Mudstone3.3
Gritstone15.3
Coal seam19.8
Fine sandstone9.5
Disclaimer/Publisher’s Note: The statements, opinions and data contained in all publications are solely those of the individual author(s) and contributor(s) and not of MDPI and/or the editor(s). MDPI and/or the editor(s) disclaim responsibility for any injury to people or property resulting from any ideas, methods, instructions or products referred to in the content.

