
Use of the Gas Emission Site Type Method in the Evaluation of the CO2 Emissions in Raised Bogs


1
Faculty of Oceanography and Geography, University of Gdansk, Bazynskiego St. 4, 80-952 Gdansk, Poland
2
Department of Hydrology and Water Management, Faculty of Earth Sciences and Spatial Management, Nicolaus Copernicus University, Lwowska 1, 87-100 Torun, Poland
*
Author to whom correspondence should be addressed.
Water 2024, 16(7), 1069; https://doi.org/10.3390/w16071069
Submission received: 21 February 2024
/
Revised: 25 March 2024
/
Accepted: 2 April 2024
/
Published: 8 April 2024
(This article belongs to the Special Issue Restoration of Wetlands for Climate Change Mitigation)
Abstract
:Peatbogs are important in global greenhouse gas budget estimates. The main aim of the work was to assess the amount of greenhouse gas emissions based on the Greenhouse Gas Emission Site Type (GEST) method and compare them with actual field measurements. The research was carried out in selected peatbog areas in the coastal zone of northern Poland. The proposed method allowed us to assess whether the restoration treatments carried out in peatbogs contributed to the emission of these gases. The results of this research using the GEST method indicate that, in the studied peatbog areas, the reduction in CO2 emissions was approximately 12%. These results were compared with actual measurements of greenhouse gas emissions made using the chamber method in 2018. The average CO2 emission for the entire peatbog was 16,338.7 t CO2-eq./yr. Comparing this result with the result obtained using the GEST method, it should be stated that it is lower by 2.464.1 t CO2-eq./year, which gives an approximately 13% overestimation of the result by the Gas Emission Site Type method.
1. Introduction
There are about 400 million hectares of peatbog in the world, which is the equivalent of 3% of the Earth’s land surface [1,2,3]. They occur in 169 countries and have, by sequestering carbon, cooled the global climate by 0.6 °C [4]. This is more than twice the amount of carbon stored in all forest biomass and is equivalent to 75% of all carbon in the atmosphere [5]. According to Harris et al. [6], near-boreal latitudes have been accumulating large quantities of soil carbon (85% of the total global peatbog carbon is stored in the northern hemisphere). Carbon in northern peat soil is seasonally or permanently “imprisoned”; for example, it is frozen in permafrost for long periods of time (up to ~10,000 years) [7]. As compared against tropical forests (100–500 years) [8], this is a very long period. The essential “C service” provided by peatbogs (carbon accumulation, reducing greenhouse gas emissions) is lost when these regions are disturbed (disturbances in hydrological conditions), as this causes large amounts of C to be released to the atmosphere in the form of CO2 and CH4 [9,10]. It is expected that the permafrost zone will, in the future, be a substantial source of carbon release to the atmosphere [11]. Maintaining the C sink function of these peatbogs is critical for achieving net-zero global carbon dioxide (CO2) emissions by 2050 [6]. It is estimated that peatbogs are capable of storing about 30% of the world’s supply of soil organic carbon [12]. According to Yu et al. [13] and Kleinen et al. [14], the amount of carbon stored in the world’s peatbogs amounts to 500 to 615 gigatons. More recent studies have shown [15] that the above-listed data are most likely underestimated due to an underestimation of the number of peatbogs in the tropical and subtropical regions of the world. Many authors [16,17,18,19] have noted that the emission and storage of carbon by peatbogs is a critical characteristic that is strongly dependent on the ecohydrology of each individual bog, which should be understood as one of the types of wetlands, habitats so hydrated that specific vegetation occurs there and organic sediment accumulation processes occur. According to studies by Panai et al. [20], carbon accumulation was greater at times of wetter and warmer conditions when Sphagnum was dominant and lower during periods of the growth of mixed Sphagnum and vascular plants (mainly sedges) under drier/unstable hydrological conditions. Currently, there is an increase in the number of dry periods. This is related to climate change and human activity [21]. Peatbogs are considered to function on the basis of an equilibrium that may become easily disturbed by various drainage works and overall changes in water circulation patterns [22,23,24]. Anthropogenic disturbances in land use release this accumulated carbon back into the atmosphere. Without peatbog rewetting, the world’s drained peatbogs will continue to emit CO2 [25]. These effects include a higher risk that tipping points in the global climate system will be reached, possibly triggering cascading effects [26]. In contrast, peatbog rewetting may be an important measure to reduce climate change and attenuate peak global warming [27]. It is also important for the occurrence of different plant communities [28]. In addition, changes are being noted in the amounts of precipitation and evaporation and in the dynamics of their course. Increased heating leads to greater evaporation. This, in turn, leads to increased water vapor in the atmosphere. Hence, rainstorms, supplied with increased moisture, produce more intense and irregular precipitation events [29]. Research conducted by Chen and Buchberger [30] shows that 93% of the study’s weather stations selected for analysis exhibit a negative correlation between precipitation and potential evaporation. The above information is confirmed by Taminskas’ et al.’s [31] research, which claims that cyclic peatbog surface variability is influenced by hydrological conditions that highly depend on climate and/or anthropogenic activities.
When the structure of the bog is disturbed, it becomes degraded and weakened. Drainage may facilitate an increase in oxygen in the peat deposit, which then leads to the oxidation and mineralization of organic matter. Ultimately, this leads to the emission of greenhouse gases [32,33]. A comparison of greenhouse emissions for both natural and degraded peatbogs [34,35] suggests that well-preserved bogs are likely to limit the climatic impact of greenhouse gases, where dried, degraded bogs become major emitters of these gases [36,37,38,39]. Despite significant uncertainty [40], it is likely that the renaturalization of a degraded peatbog—if successful—may facilitate the return of the bog’s role in the greenhouse gas balance and may certainly protect the peatbog’s existing carbon supply from decomposition. However, with an uncertain climate and intensifying land-use changes, the potential for multiple disturbances (by, for example, wildfires or drainage) will increase the degradation of peatbogs and thus further climate warming [41].
The emission of carbon dioxide by peat soils into the atmosphere depends, among others, on land use (meadow or arable land) and fertilizer use [42,43]. However, research by Cillero et al. [44] did not show any significant relationship between hydrochemistry and land use (land cover at the watershed scale). According to Howie and Hebda [45], the oscillation of the peat surface is an important mechanism for hydrological self-regulation in bogs. According to estimates published by Wetlands International [46], the decline of peatbogs in Poland causes the emission of close to 26 million tons of CO2 per year, which puts Poland in the top 10 of emitters of CO2 originating from peatbogs.
Greenhouse gas emissions are usually calculated via changes in the supply of carbon in the soil versus direct measurement data—the chamber method or the centrifuge method [47,48]. The two latter methods are very accurate, but also time-consuming and costly. Therefore, the authors used a different method of measuring greenhouse gas emissions, which may be an alternative solution to costly and time-consuming research. The main aim of this study was to determine the amount of greenhouse gas emissions based on the Greenhouse Gas Emission Site Type (GEST) method [25,49,50,51,52,53] and compare them with actual field measurements. It is a proxy indicator that is rarely used in scientific work but is widely used in carbon credit programs resulting from peatland re-irrigation. It is also used to estimate global greenhouse gas emission reductions in the absence of actual measurements [54]. This method can therefore have global application. The Gas Emission Site Type method estimates gas emissions based on available vegetation and water levels, using greenhouse gas coefficients for each habitat type reported in the research literature [55]. The research was carried out in selected peatbog areas in the coastal zone of Northern Poland that had been subjected to restoration. This allowed for the assessment of whether the renaturalization treatments carried out have contributed to the emission of these gases.
2. Materials and Methods
2.1. Study Area
The study area consisted of three peatbogs: Kluki, Ciemińskie Błoto, and Wielkie Bagno. All three bogs are located in northern Poland, in the coastal zone of the Baltic Sea, in the southern part of Słowiński National Park (SNP) (Figure 1). All studied peatbogs are under strict protection. They are located in close proximity to Lake Łebsko and the Pustynka River and Łeba River. There are no larger cities around the peatbogs, only small villages, including: Kluki, Izbica, and Gać.
The formation of the studied peatbogs is closely related to the geological structure of the area. In the geological past, the peatbog area was a depression (basin) that was created at the end of the Warta glaciation. At a later stage, the depression was filled with sediments of various origins: fluvioglacial formations, river-lake formations, and then river and reservoir silts. They are covered by Holocene formations up to 15 m thick. They are composed of river sediments (sands, silts, and gravels) [56], as well as marine, lake, and organic sediments. The origin of organic sediments (marsh and peat) relates to the climate and vegetation changes in the Holocene period [57]. The formation and deposition of peat mass were favored by the cool and humid climate and the high water table. This, in turn, resulted from the blocking of the free outflow of water from land to the sea through the growing Łebska Spit. The spit contributed to cutting off a part of the bay from the sea and creating the brackish lake Łebsko, on the shores of which the studied objects were formed, along with other wetlands adjacent to them to the south. The dominant element in these objects is peat. There are also peaty and sandy silts here. The research area is not very diverse. These are flat areas with single domes rising several meters above sea level.
Hydrographically, the peatbogs are located in the lower part of the Łeba river basin. In its lower course, the river flows through an alluvial plain, where it receives numerous streams flowing from the surrounding moraine hills. Flat terrain, river and lake waters, and groundwater flowing down from the plateau mean that the groundwater level on the plain is shallow and sometimes stagnates on the surface. For a better illustration of groundwater retention, Figure 2 shows the distribution of hydroisobaths for all peatbogs, i.e., the image of lines connecting points of the groundwater level on the map occurring at the same depths relative to the terrain surface. They concern three periods, i.e., those of the best, average (medium), and worst water conditions. In the case of the Ciemińskie Błoto peatbog, in an average situation, the depth of groundwater was in the range of 15 to 35 cm below ground level. In turn, in the situation of the best hydration (December), the water table was from 2 cm below ground level (b.g.l.) to 3 cm above ground level (a.g.l.). However, in the situation of the worst hydration (September), the range of groundwater fluctuations in Ciemińskie Błoto was from 52 to 60 cm b.g.l. In turn, in the Kluki Peatbog, the average depth of groundwater is from 20 cm to 60 cm b.g.l. In the case of extremely good hydrological conditions, groundwater remained at a depth of 2 cm b.g.l. up to 8 cm a.g.l., and during the period of extremely bad conditions, it ranged from 80 to 92 cm below ground level. The smallest amplitudes of groundwater level fluctuations occur at points on the edge of the peatbog. The reason for the smallest amplitudes and the high level of water table retention at these points is probably their structure. These are mini domes of an open nature that are located close to the border of the peatbog. Interestingly, extreme amplitudes are characteristic of the southern part of the peatbog. This is because the area has been greatly transformed by humans. There are more drainage ditches here, and there are more areas of cut peat. In turn, the northern part is more uniform and covered with dense forest. However, in the Wielkie Bagno peatbog, the range of variability of groundwater fluctuations ranged from 25 to 55 cm b.g.l. In turn, in extreme situations, the obtained values ranged from 9 cm b.g.l. up to 2 cm a.g.l. (maximum hydration) and from 56 to 80 cm b.g.l. (minimal hydration).
Groundwater in the study area is Quaternary water. Holocene–Pleistocene aquifers were found in the Quaternary formations. However, their usefulness is significantly limited due to the high salinity caused by the inflow of salty waters. Throughout the entire area, the aquifer is not isolated from the ground surface. The waters at this level are of poor quality. They are characterized by high hardness and oxidizability and a high concentration of iron and manganese. There are two wells currently in operation in the study area: in Smołdziński Las and in Izbica—supplying drinking water to the local population. Water is supplied via waterworks to other towns from intakes located outside the research area.
The excess water provoked the commencement of drainage works, which consequently disturbed the natural structure and functioning of the resulting peatbogs [58]. The first drainage activities date back to the second half of the 18th century and were related to local peat extraction. The work intensified at the end of the 19th century and the beginning of the 20th century. Its goal was to obtain land for agricultural cultivation, to make possible the manual extraction of peat, and to regulate the Łeba River with the intention of draining flood waters. The drainage process during this period significantly depleted groundwater resources in favor of creating a denser surface water network (numerous canals and drainage ditches). After World War II, drainage works were intensified, and the area was adapted to mechanized agriculture and industrial peat exploitation. The last drainage and operational work on the studied facilities took place in the late 1980s. Nevertheless, on the southern outskirts of the Słowiński National Park (SNP), a peat mine in Krakulice, located in its buffer zone, is still exploited to this day.
All the studied bogs feature a well-developed network of drainage ditches and canals (Figure 3). In addition to circumferential ditches, there are also ditches that cross the bog from east to west and north to south. Some of these channels drain a lot of water (monthly outflow ranges from 10,000 m3 to 700,000 m3)—for example, Canal C9 running across the Kluki bog (Figure 3). Some ditches are becoming overgrown by vegetation or disappearing, as in the case of ditches in the Ciemińskie Błoto.
Parts of the studied bogs are subject to flooding in the wet season, whereby water stagnates across open surfaces. For a certain period of time, water does not infiltrate and does not flow out, stagnating on the surface of peatbogs, creating pools. The water table tends to be low across large parts of the studied bogs due to drainage practices.
The studied bogs are currently substantially degraded and are covered with woodland-type vegetation, but some bog areas are still producing peat. The climate in the study area can be described as temperate. Average precipitation totals for the years 1956–2015 in Łeba (a meteorological station located in northern Poland ~10 km from the research area) were 661.7 mm. Most precipitation occurred in the summer months (July to September) and ranged from 75.9 mm to 79.2 mm [53]. Minimum precipitation was recorded in February, March, and April and ranged from 32.8 to 33.7 mm (precipitation mainly occurs as snow). The average annual air temperature recorded between 1956 and 2015 was 7.8 °C. July was the warmest (16.9 °C), while January was the coolest (0.6 °C) [59].
Total annual precipitation in the period 2018–2021 ranged from 553 mm to 677 mm, while evaporation ranged from 709 mm to 753 mm. The most precipitation occurred in summer and autumn, with a maximum in August (156 mm) and October (125 mm), and the least in the spring months, with a minimum in April (4 mm) (Figure 4). The greatest evaporation occurred in the warm months from April to October, with a maximum in August of 128 mm. The lowest evaporation was recorded in the cold months, i.e., from November to March. The absolute minimum evaporation was reached in December (21 mm). The difference between precipitation and evaporation ranged from 75 mm in 2019 to 163 mm in 2021, which means that a negative climate balance was observed for most months in the analyzed period. Only in the autumn and winter periods was it positive for individual months (Figure 4).
The Kluki peatbog (Figure 1) has a surface area of 530 ha and consists of two basins that are separated by a dune belt—a northern basin and a southern basin. According to Tobolski [60], the southern part of the bog formed about 10,000 years ago, and the peat has an average thickness of about 6.5 m. The northern part of the bog formed about 6000 years ago upon the regression of the Littorina Sea; the peat layer is up to 2.5 m thick. In both parts of the peatbog, the coarse layer of peat is covered with a layer of relatively fine peat. The peat in the study area is almost fully covered with forest—its tree stands exceed 120 years in age. Three former peat domes can be detected in the relief of the study area.
The Ciemińskie Błoto (Figure 1) peatbog has a surface area of about 150 ha, and the thickness of the peat layer ranges from about 4.6 m to 6.5 m. The central part of the bog is occupied by a number of open peat communities of Erico-Sphagnetum, which have survived thanks to active protection measures such as tree removal performed by the SNP. The water content of this part of the bog is still quite high; however, the wooded part, fragmented by ditches (although these are becoming overgrown), exhibits signs of drying and decomposition.
The Wielkie Bagno (Figure 1) peatbog has a surface area of about 630 ha and is located in a series of basins found between dunes. The thickness of the peat layer in this case is about 5 m. This particular bog was subject to significant extraction, and this is observed in the form of a number of post-extraction pits filled with water. Thanks to current, active forms of protection, including the construction of barriers on ditches, the water circulation patterns in this bog have improved significantly, but more work can and should be done in selected parts of the bog. In areas outside of SNP, the bog is still subject to peat extraction at the site in Krakulice.
2.2. Gas Emission Site Type Method
The research work focused on the implementation of Gas Emission Site Type (GEST) method practices, which rely upon the estimation of selected greenhouse gas emissions based on vegetation and water content data as well as greenhouse gas balance coefficients provided in the literature for selected types of habitats [49,50]. The concept was developed by the mire research group at the University of Greifswald [51,52]. According to this approach, it is possible to assess and monitor GHG fluxes from peatbogs by measuring water table levels together with the vegetation forms identified at the sites. In essence, the GEST approach provides estimates of the balance of greenhouse gases based on the forecasts of vegetation dynamics and water conditions. This approach is similar to that employed to estimate greenhouse gas balance values at the national level [53]. However, the Gas Emission Site Type method is more detailed in terms of types of habitats and relies on three basic principles:
- Greenhouse gas emissions are dependent on the average annual groundwater level.
- The groundwater level may be determined by the presence or absence of special groups of plant species.
- Given the similar hydrology of a study area, local vegetation may be classified as a certain collection of specific types of greenhouse gas emissions.
Hence, the Gas Emission Site Type method relies on estimating greenhouse gas balance using change dynamics for plant life and water circulation patterns assessed for a variety of scenarios, such as a basic scenario assuming a lack of action and a scenario assuming “preservation” actions taken to save a bog. In effect, the Gas Emission Site Type method allows one to estimate GHG uptake or emissions in the absence of data at a given site and to determine whether water retention and hydrologic conditions present in various habitats affect the rate of emission and storage of gases.
Work using the Gas Emission Site Type method begins with selecting vegetation that is homogeneous in terms of physiognomy, structure, ecology, and floristics. The next step consists of mapping vegetation using the Braun–Blanquet method in order to select characteristic or dominant groups of species and assign to them certain hydrologic and chemical characteristics associated with their place of occurrence [61]. This includes the groundwater level, trophic state, and pH. Mapping the vegetation at research sites is intended to categorize individual forms of vegetation into specific GEST types. This approach makes it possible to evaluate GHG fluxes by interlinking vegetation types, water table depth, and peat properties and thickness. GHG flux values are assigned to the vegetation types following a standardized protocol and using published emission values from plots with similar vegetation and water level in regions with similar climate and flora [62,63].
Greenhouse gas emission calculations for non-woodland GEST areas were performed using CO2 per hectare data. The result was multiplied by a constant determined for each GEST type (Table 1). For areas where the quantity of greenhouse gas emissions cannot be clearly determined, water level measurements were used instead as an additional set of data designed to help assess greenhouse gas emissions. In forested GEST areas, the estimation of emissions, and in particular of CO2, was performed using a combination of data on gas emissions for open, unused peatbogs with similar hydrologic characteristics and growth rates for wood biomass. The emission of greenhouse gases is also estimated herein for two specific scenarios: (1) with carbon stored in forest biomass, and (2) without carbon stored in forest biomass. The calculation of the solid carbon biomass in living wood was performed using the BEF method [64].
As noted above, greenhouse gas emissions calculations were performed for two distinct scenarios: (1) the basic scenario, with no intervention designed to increase the water content of peatbogs, and (2) the renaturalization scenario, with intervention designed to increase the groundwater content and biotic state of peatbogs. The basic scenario assumes that current emissions in the studied bog will remain relatively constant over a period of 30 years. Time assumptions are based on data from the Intergovernmental Panel on Climate Change (IPCC) reports. Emissions will not be reduced, but emissions calculations with and without forest biomass (known as sequestration from trees) will be performed, given that the area is wooded. It was assumed, according to the Gas Emission Site Type method, that tree stands produce fewer emissions due to unstable hydrologic conditions. In the scenario where peatbogs become renaturalized, current emissions in the study area will change over a period of 30 years due to the employed renaturalization process. This scenario does not assume any major changes in vegetation. A change in vegetation in the direction of peat formation will occur gradually due to the natural processes associated with increased water content driven by the presence of ditch barriers. The new water conditions in the study area will trigger a change in vegetation, which will be used to recalculate emission levels with a new GEST assumption.
The application of GESTs consists of several steps. The first step is to analyze literature, maps, and any other site data about historical land use, reclamation, forestry, and peat mining that may provide an overview of the site and a better understanding of its conditions. This is followed by fieldwork to obtain precise data about vegetation types and abundance, as well as site hydrology, which is used to assign the vegetation to the GESTs. The crucial point in the application and identification of GESTs is the acquisition of detailed data about the vegetation. For the determination of GESTs, an assignment of identified vegetation units to the so-called vegetation forms, according to Koska et al. [62], is required.
First, homogeneous vegetation units should be differentiated. These vegetation units are later assigned to groups, like forested peatbogs or open peatbog areas. The next step includes localization and positioning of the vegetation units using GPS and transferring these units to an appropriate map with quantitative area (in ha) information for every unit at every site. Finally, the presence or absence of ecological-sociological species groups [62] has to be determined. These groups are related to characteristic hydrological and chemical parameters, i.e., water level, trophic level (expressed as the peat C:N ratio), and base richness (pH).
Of all the available parameters, the mean annual ground water level is considered to be the best single explanatory variable for CO2 and CH4 emissions [63]. Next, the aforementioned vegetation forms were assigned to a GEST based on data taken from the literature on the subject. Some of this data is based on actual measurements using the chamber or eddy covariance methods. As a result, we obtain a catalog of the GESTs, corresponding vegetation forms, characteristic plant species, and emission factors. After mapping and obtaining the area of each GEST, the GHG emissions were estimated. To obtain the annual GHG emissions per GEST, its area (in ha) was multiplied by the respective emission factor (in carbon dioxide equivalents, CO2-eq’s). This allows for the total GHG emissions (in CO2-eq’s) of all GESTs to be estimated.
2.3. Field Measurements and Equipment Used
While calculations were important, so was fieldwork. The purpose of fieldwork was to collect representative soil samples in order to determine the C to N ratio, pH of the upper layer of peat (depth: 0–30 cm), and any fluctuations in groundwater levels. The representativeness of soil samples was obtained by collecting them from 15 to 20 points per hectare. Samples were collected using an Instorf container to a depth of 30 cm (if vegetation was present, the top 5 cm layer was removed). The samples were described immediately after removing the drill and transferring them to ready-prepared polyvinyl chloride (PVC) troughs, which were then tightly wrapped with foil to prevent moisture loss. Thus prepared, the material was transported in a horizontal position to a cold store for further laboratory tests. The pH of the soil was determined by suspension analysis. This involves taking homogeneous samples and adding distilled water in a 1:1 ratio (we add 25 mL of water to 25 g of soil), mixing the sample for 5 s and waiting 15 min, then mixing the sample again and measuring it using a Hach Lange HQ30/40. In turn, C and N were determined using the Vario El Cube CHNS elemental analyzer. Soil samples were packed in 10 g capsules. The most advantageous method was to administer 5 mg of oxygen, and the combustion time was 90 s. A monitoring network was established in order to monitor groundwater levels via the use of 63 piezometers and automated gauges, as well as 17 water level gauges to measure the water level in canals and ditches—25 devices in the Kluki peatbog, 20 in Ciemińskie Błoto, and 35 in Wielkie Bagno (Figure 5). The above devices were used to generate data to yield a complete picture of fluctuations in groundwater levels in all the studied peatbogs. An example of such an image is Figure 6, which shows a period of high groundwater level, a period of rapid decline, and a period of low groundwater level. They pertained to the daily, monthly, and annual fluctuations of surface and groundwater. This allowed us to assess the degree of hydration in the peatbogs. A detailed description of groundwater fluctuations is provided in the study area characteristics and results.
In this study, apart from determining CO2 emissions using the Gas Emission Site Type method, CO2 emissions were also measured in the field using the chamber method at three measurement points, with one for each peatbog, from April to October at monthly intervals. This method involves recording the increase in CO2 concentration per unit of time in air in a sealed chamber. Measurements were made using a portable Vaisala MI70 AC carbon dioxide meter. Changes in CO2 concentration in the chamber using the meter were determined by placing the meter inside the chamber. A plexiglass chamber with dimensions of 45 × 45 × 45 cm was used for measurements. The chamber was made of transparent acrylic glass with a hole in which the meter probe was placed. At each measurement point, the chamber was placed successively on three square frames, which were permanently attached to the surface of the peatbog at the beginning of the research. The distance between the frames was 30 cm. CO2 exchange measurements were carried out during the day from 12:00 to 14:00 in conditions of solar energy, thus determining the value of net ecosystem exchange (NNE), and in conditions of complete darkness, after covering the chamber with a light-impermeable cover, in order to determine the overall respiratory activity (TER). The CO2 concentration was recorded automatically. The measurement time was ~2 min (the increase in CO2 concentration is linear), and the data was recorded every 5 s.
3. Limitations and Utility of the Study
Currently, many methods are used to measure greenhouse gas emissions in peatlands. Most of them are labor-intensive and expensive methods. Unlike them, the Gas Emission Site Type method presented in this paper seems to be a much simpler, cheaper, and less time-consuming method. The most important thing in the GEST method is to determine the vegetation occurring in the research area in connection with, above all, groundwater fluctuations in the peatbog. This requires knowledge of a given research area in terms of its biology and hydrology. Lack of this knowledge makes the use of the GEST method much more difficult. However, having basic environmental knowledge of the study area allows us to determine GEST types. Each GEST type can be assigned a specific greenhouse gas emission value based on literature data established for other peatlands around the world. This element seems to be the weakest point of the method at the moment. This is due to the fact that there is still far too little of this type of research. The results are based on different measurement methods used by different people, making it difficult to actually assess greenhouse gas emissions. Also, transferring results from other areas (different climatic zones) to the analyzed one may not always be a good solution. Additionally, there are new GEST units for which greenhouse gas emissions have not yet been determined but which need to be determined for the research area. However, this does not require many months of field measurements and large financial outlays. Based on the GEST types (knowing their area) and the assigned greenhouse gas emission amounts given in the literature on the subject, the total CO2 and CH4 emissions can be determined, which is extremely simple. Despite the effective use of the GEST method, it is worth using actual measurements of greenhouse gas emissions in the field in the initial phase. This will allow for an estimation of CO2 and NH4 emissions from peatbogs currently used in the GEST method, which is based solely on literature data. Despite the above reservations, the use of the GEST method to estimate greenhouse gas emissions seems to be a good direction for the future. This method is effective, easy to perform, cheap, and quite precise. The differences between the actual measurements of greenhouse gas emissions and those obtained using the GEST method are small and within 10% of the difference.
The Gas Emission Site Type method has numerous advantages, although it does not take into account some abiotic parameters that affect CO2 emission and/or sequestration, such as soil carbon density [67], cation exchange capacity [68], soil phosphate [69], soil microbiota [70], soil nitrate [71], etc. It seems that although these parameters are not included in the GEST method, it is necessary to access them in order to obtain a clear picture of CO2 dynamics.
4. Results
One of the elements used in the Gas Emission Site Type method to assess greenhouse gas emissions is groundwater fluctuations. The results obtained for groundwater indicate high dynamics of variability considered in annual, monthly, and daily distribution. At the same time, there is variability in the results related to the spatial distribution of individual measurement points, which in turn is related to biotic diversity, different human impacts (proximity of drainage ditches), the proximity of Lake Łebsko, the distance from the peatbog dome, or the proximity of perimeter ditches. However, for all three peatbogs, there is some consistency in the water levels. Fluctuations over time are generally similar to each other. Minimum water levels occur each year in late summer and early fall. From May, sometimes as early as April, the groundwater level begins to fall, with the most significant decline being recorded in July, August, and September (most often the minimum is reached in this month). In turn, since October, the groundwater level has been slowly rising again. During the entire measurement period, two clear minimums were also observed: in September 2019 and August 2021. The absolute minimum was recorded at most measurement points in August 2020. This applies especially to Kluki and Wielkie Bagno. The main reason for this was the very dry winter period in the first half of 2020, which did not allow water supplies to be rebuilt. To this, the extremely dry months of June, July and September should be added. The very high rainfall in August, due to the deficit in the previous period, did not compensate for these losses. In turn, in the Ciemińskie Błoto, the water level reached absolute minimums in a small majority of cases in September 2019 (56%), and the rest in 2020. One of the reasons for this state of affairs may be the potential impact of Lake Łebsko. However, in the months from November to April, water levels stabilize significantly, resulting from a significant inflow of rainwater at that time and the spring thaw period. The period from November to April 2018 was especially characterized by high levels of groundwater. This is the result of the exceptionally humid and rain-rich summer and autumn periods preceding this measurement period. Interestingly, throughout the entire measurement period, there are times when underground water stagnates on the surface (above ground level), at a level from 1 to just over 30 cm. Figure 6 shows exemplary distributions of the daily variability in groundwater levels in the analyzed peatbogs in 2018–2021.
An extremely important problem for the proper functioning of peatbogs is the amount of water supplied and discharged to them through the horizontal hydrographic system. The routes of water escape from peatbogs are especially important because, in situations of significant water loss through this route, it is possible for the peatbogs to dry out and, as a consequence, certain habitats may malfunction. In the case of raised bogs, which have been degraded to a greater or lesser extent in the past, this is a big problem. Water outflow from the studied peatbogs is determined primarily by the amount of atmospheric recharge. Additionally, the amount of runoff increases with increased retention in autumn and winter. For the entire measurement period, in the case of the Ciemińskie Błoto, the total annual inflow was 348,000 m3, and the outflow was 820,000 m3. As a result, through horizontal exchange, the peatbog lost 472,000 m3 of water throughout the entire research period. Water outflows from the peatbog in five places and flows in only at one (point CQ4). The sizes for individual outflows are varied and range from 87,000 m3 (point CQ3) to 350,000 m3 (point CQ1). In turn, Kluki had an inflow of 5,137,000 m3 during the measurement period, and the outflow was 7,539,000 m3, which gives a difference of 2,401,000 m3 in net outflow. The inflow takes place in one place (point KQ1), and the outflow takes place in two places (points KQ2 and KQ3). In the case of the last of the studied peatbogs—Wielkie Bagno—only an outflow of 2,919,000 m3 of water was recorded for the entire measurement period, i.e., 2018–2021. It took place in eight places, on the northern, eastern, and western sides of the peatbog. The variation in runoff for individual points was significant and ranged from 63,000 m3 (point ZQ7) to 801,000 m3 (point ZQ1) (Figure 7). Importantly, considering the obtained results only in terms of size, the largest inflows and outflows are observed in the Kluki peatbog and the smallest in the Ciemińskie Błoto peatbog.
All analyzed peatbogs are located in the close vicinity of Lake Łebsko, which is the largest coastal lake on the Polish coast. There is a large variability in water level fluctuations in the lake resulting from the influence of the Baltic Sea. Higher average water levels occur in the winter half-year (frequent storms), while low levels occur in the summer (increased evaporation). This, in turn, affects the hydrological conditions in neighboring peatbogs. The variability in the water levels in Lake Łebsko is strongly correlated with changes in the groundwater level in the peatbogs, although the response of the peatbogs to changes in lake water is delayed by 2 to 4 months. The inflow of lake waters, characterized by increased salinity, causes increased chloride concentrations to be observed at the points closest to the lake. This applies to both surface and groundwater. For example, in Ciemińskie Błoto, the highest chloride concentrations in surface waters were recorded at point CL2, which is located closest to Lake Łebsko. The absolute maximum ranged from 219 mg·dm−3 (November 2019) to 521 mg·dm−3 (October 2018). They were observed during a storm in the Baltic Sea. In the remaining period, chloride values at this point ranged from 6 to 91 mg·dm−3. No such high concentrations were recorded at the other points. Most often, their values ranged from a few milligrams to 30 mg·dm−3 (Figure 8). A similar situation was recorded for the other two peatbogs (Kluki and Wielkie Bagno), where the highest chloride concentrations were observed during storm periods at points located closest to Lake Łebsko. The same trend was also visible in the case of groundwater. For example, in Ciemińskie Błoto, at points C8, C17, C4, and C5, much higher chloride concentrations were recorded (several hundred mg·dm−3) than at other measurement points (several mg·dm−3) (Figure 9). These are points located along the shore of Lake Łebsko. The same situation occurred for the other two peatbogs.
Initial research results indicate that the studied peatbogs are home to a variable number of Gas Emission Site Types, as determined on the basis of habitat information and water circulation patterns. In the Kluki peatbog, a total of 11 different GESTs were identified—six were open bogs, four were woodland-type bogs, and one was mixed-type. On the other hand, in the Ciemińskie Błoto bog, a total of 10 different GESTs were identified—six were open bogs and four were woodland-type bogs. Finally, in the Wielkie Bagno peatbog, a total of 20 different GESTs were identified—16 were open bogs and four were woodland-type bogs.
These results were then used to calculate CO2 emissions. Table 2 summarizes greenhouse gas emissions estimates produced using the Gas Emission Site Type method in both studied scenarios (the non-action scenario and the scenario with various types of efforts designed to improve the condition of the peatbog) and illustrates the potential for reduction.
Initial research results show that once renaturalization work was completed in the study area, a reduction in CO2 emissions occurred, from a value of 18,802.8 t CO2-eq./yr to a value of 16,507.23 t CO2-eq./yr—for a reduction of 12.21%. Renaturalization works included tree felling across the studied peatbogs, raising the groundwater level, and changing habitats. A total of 214 locations were selected where gates/dams were installed on the ditches, and their task was to block the water flow, raise the water level, and stabilize the fluctuations of the water table. As a result, after the installation of dams in the ditches, there was an increase in the amount of standing water on the surface of the peatbogs. An example may be an extremely dry period (2021), when in the Ciemińskie Błoto, in a situation without damming, the flooded area of the peatbog was only 2%, while in a situation with dams installed (actual measurements), the flooded area was 8% (Figure 10). The CO2 emission values obtained above were calculated on the basis of the GEST method before and after the restoration works. Differences in the obtained values result primarily from changes in forest areas, changes in the depth of groundwater, and changes in the GEST types designated at the beginning of the research.
In order to determine whether the results obtained using the GEST method are close to the actual values obtained directly in the field, it was decided to compare them. This was done using our own measurements taken by the chamber method in 2018. After converting the results for the year for the entire bog, the average CO2 emission was 16,338.7 t CO2-eq./yr. Comparing this result with the Gas Emission Site Type method results, it should be stated that it is lower by 2.464.1 t CO2-eq./yr., which gives an overstatement of the result of about 13% using the GEST method. It should be remembered that these were annual (estimated) measurements that should be continued in order to compare them with the Gas Emission Site Type method.
This confirms the observations of Evans et al. [72], who find that the mean annual effective water table depth (the average depth of the aerated peat layer) overrides all other ecosystem- and management-related controls on greenhouse gas fluxes. They estimated that every 10 cm of reduction in annual effective water table depth could reduce the net warming impact of CO2 emissions by the equivalent of at least 3 tons of CO2 per hectare per year.
The average reduction for all of the bogs studied in the project (German, Polish, Lithuanian, Estonian, and Latvian bogs) was about 25%. Hence, the 12.21% value obtained herein was much smaller than the average for the five European countries taking part in the research project. This is primarily because Polish peatbogs are more degraded than others, as well as having slightly different and more complicated hydrological conditions (poorer hydration, constant interference from peat mines, poor management).
5. Discussion
Peatbogs have high biological value. They are one of the most productive ecosystems in the world and constitute the living environment for rare species of flora and fauna [73]. This is closely related to water conditions [38,74]. They store significant amounts of carbon dioxide and have a direct impact on the concentration of greenhouse gases in the atmosphere [75]. According to Krohn et al. [76], there are two micro-relief forms (microforms)—hummocks and hollows—that differ in hydrological characteristics (water table level) and vegetation communities. Such diversity occurs in the studied peatbogs. These peat microforms—dry hummocks and wet hollows—play an important role for CH4 production but not for CO2 production when the effects of living vegetation are excluded. However, a study by Leroy et al. [77] highlights the role of vegetation composition on C fluxes in peatbogs.
In connection with the functions they perform for the environment, it is very important to protect peatbogs, especially since they are one of the fastest-disappearing ecosystems in our climate zone. They are subject to progressive degradation due to changes in hydrological conditions, mainly as a result of numerous drainage and land use changes [78,79]. This statement is supported by the research of Xiao et al. [80] on the eutrophic Lake Taihu. The analyzed peatbogs are the best example of this type of change. They were strongly degraded in the 19th and 20th centuries.
Climate change has an adverse effect on peatbogs. Tarnocai [81] reports that accelerated climate change causes severe degradation of peatbogs. As a result of these changes, large amounts of carbon dioxide will be released into the atmosphere. This, in turn, will continue to generate global warming [82]. Air temperature can be the only significant contemporaneous driver of monthly anomalies in CO2 fluxes on peatbogs [83]. Therefore, research on greenhouse gas emissions, including carbon dioxide and methane, is increasingly being carried out. Currently, many measurement methods are being used, e.g., the chamber method or the eddy covariance method [84,85]. Unfortunately, they are quite expensive and labor-intensive. There are also less popular methods, but they are definitely cheaper and easier to use than the above methods. An example is the Gas Emission Site Type method presented in this work. The Gas Emission Site Type method relies on estimating selected greenhouse gas emissions based on vegetation and water content data as well as greenhouse gas balance coefficients provided in the literature for selected types of habitats [50,51,52,86,87,88,89,90,91,92,93,94,95]. According to this approach, it is possible to assess and monitor greenhouse gas emission fluxes from peatbogs by measuring water table levels together with the vegetation forms identified on the sites. The most important element of this method is the designation of GEST types based on characteristic plants and water conditions (groundwater fluctuations). For each type of GEST, it is possible to determine the amount of greenhouse gas emissions that have been described in the literature so far.
The surface area of peatbogs in Poland is estimated to be 1,211,000 hectares. According to Joosten [46], the estimated annual emissions total from all degraded peatbogs in Poland is 25.8 million tons of CO2, or 7.5% of the emissions produced by the burning of fossil fuels. This places Poland in the top 10 of the worldwide emitters of CO2 from degraded peatbogs. This is a substantial contribution to the global balance of greenhouse gas emissions. Unfortunately, there are still no local and regional measurements that would allow us to precisely determine the amount of greenhouse gas emissions in individual peatbogs and, consequently, to determine global values. The Gas Emission Site Type method may be the solution to this problem. It would allow, with some knowledge of biotic and hydrological conditions, to quickly assess the volume of CO2 and CH4 emissions from Polish and other peatbogs.
Calculations of CO2 emissions from the studied peatbogs by the Gas Emission Site Type method performed before recultivation works were carried out amounted to 18,802.8 t CO2-eq./yr. Once renaturalization work was completed in the study area, there was a reduction in CO2 emissions of 16,507.23 t CO2-eq./yr. This indicates a reduction of 12.21%. Despite the decrease in CO2 emissions, this value is high. Table 3 presents several examples of CO2 emissions or accumulation for other raised bogs in Europe.
Renaturalization works on the analyzed peatbogs included tree felling across the peatbogs, raising the groundwater level, and changes in habitats. Damage to ditches was particularly important, as it raised the groundwater level. After the installation of dams in individual ditches, an increase in the water level in the peatbogs was recorded. As a result, there was an increase in the amount of stagnant water on the surface of the peatbogs. An example of this can be the extremely dry period (2021), when in the Ciemińskie Błoto, the flooded area of the bog was only 2%, while the flooded area of the dammed bog was 8%. Differences in these values result primarily from changes in forest areas, changes in the depth of groundwater, and changes in the Gas Emission Site Types designated at the beginning of the research.
In order to determine whether the GEST results are close to the actual values obtained directly in the field, it was decided to compare them. This was possible using our own measurements by the chamber method in 2018. After converting the results for the year for the entire bog, the average CO2 emission was 16,338.7 t CO2-eq./yr. Comparing this result with the result obtained by the GEST method, it should be stated that it is lower by 2.464.1 t CO2-eq./yr., which gives an overstatement of the result of ~13% using the Gas Emission Site Type method.
The post-extraction recultivation of bogs is important for their greenhouse gas emissions balance. Existing methods of recultivation in Europe rely on “adjusting” bodies of water, which is not favored due to the net gas balance, where post-peat bodies of water serve as major emitters of greenhouse gases [108], as well as recultivation in the direction of creating woodland or agricultural areas, which means continued emission of greenhouse gases from the marshy layers of peat [6,15]. That is why it is important to use a bog recultivation method that leads to a cessation of gas emissions in such areas and the return of carbon storage as part of the peat-formation process. Attempts to introduce peat vegetation in exposed bog areas following milling-type extraction have been made in recent years.
However, this method cannot be used in permanently inundated areas. In terms of the carbon balance, large post-extraction pits filled with water are not desirable due to their large emissions of methane [108]. This suggests that innovative methods of returning peat-forming vegetation to bogs would improve the greenhouse gas balance and increase the environmental value of post-extraction pits. One means of bringing back peat is hydrotechnical work designed to increase the groundwater level in the bog. Peatbog chemical, physical, and biological properties change over time in response to alterations in long-term water table position. Such changes complicate predictions of the response of peatbog carbon stocks to sustained drying. According to Premrov et al. [109], the ability of peatbogs to remove and store atmospheric carbon depends on their drainage characteristics.
The point is not to flood the bog but to establish an appropriate base level of groundwater. Good conditions for peat formation consist of a groundwater level at 1 to 22 cm below the surface of the bog [110], and according to Taminskas et al. [31], for Lithuanian peatbogs, this value is 25–30 cm. Shallow water tables protect peatbogs and their important carbon stocks from aerobic decomposition. On the other hand, Lamentowicz et al. [111] found a critical point for proper bog functioning at 11.7 cm below the bog surface—below which a bog stops accumulating carbon and begins to emit it. Importantly, water in peatbogs is characterized by a small exchange with groundwater [112]. It must be noted that the return of peatbogs for the purpose of preserving their supply of carbon and bringing back the process of carbon accumulation is consistent with the protection and renaturalization of bogs in terms of their environmental and ecosystem value as well as their value as redoubts of biodiversity [113,114]. Unfortunately, groundwater fluctuations were very high for the analyzed bogs. For most points, the observed maximum water level did not reach this value. For the Wielkie Bagno peatbog, the fluctuations ranged from 43 to 113 cm b.g.l. For the Kluki peatbog, the observed fluctuations ranged from 26 cm a.g.l. to 126 cm below ground level, and for the Ciemińskie Błoto peatbog, the fluctuations ranged from 5 cm a.g.l. to 80 cm below ground level. As a result, we observe amplitudes of 70–100 cm. These are large values compared to those from Estonian peatbogs, where the groundwater level amplitudes range from 3 to 22 cm in the bog domes and from 3 to 14 cm in the forested lag zones [115]. The analyzed bogs are strongly overdried and are therefore in poor condition. Some of them have irreversibly degraded. This is especially true in the summer, when peatbogs dry out significantly, mainly due to the negative climatic balance. This situation may be exacerbated by the increase in the average annual air temperature. Between 1956 and 2016, the rate of change in Łeba was 0.3 °C per decade [64]. It should be remembered that degradation of groundwater-dependent ecosystems has raised the need for their restoration, but ecological responses to restoration are largely unknown [116].
In summary, ecosystem restoration—and, especially, peatbog restoration is considered a promising greenhouse gas mitigation strategy to move towards net zero emissions [117]. This is confirmed by many other studies, including: those regarding urban lakes [118]. According to Martens et al. [119], the restoration of peatbogs should be based on the use of rewetted peatbogs, because of their potential to reduce GHG emissions by stopping soil decomposition. Currently, hydrological models are most often used to assess possible changes in peatbogs [120,121]. They are used to determine the impact of changes in water relations on CO2 emissions. In addition, they make it possible to determine the effects of recultivation carried out on peatbogs in the context of CO2 emissions. However, in order to use models to assess changes in greenhouse gas emissions in the context of changes in hydrological conditions in peatbogs, the emission values of these gases are needed. It seems that a very good method for this is the Gas Emission Site Type method.
6. Conclusions
The use of the Gas Emission Site Type method for estimating greenhouse gas emissions appears to be an effective method, although it does require familiarity with a given study area in terms of its biology and hydrology. The calculations performed showed that this method is much simpler and cheaper compared to real measurements in the field, e.g., compared to the chamber method, which was also used in this work. The most important thing in the Gas Emission Site Type method is to determine the vegetation occurring in the research area in connection with selected hydrological conditions, e.g., groundwater fluctuations, water reactions, and trophicity, which will then allow the GESTs to be determined. Each GEST can be assigned a specific greenhouse gas emission value based on literature data determined for other peatbogs around the world. Based on the GESTs (knowing their surface areas) and the assigned greenhouse gas emission amounts, it is possible to determine the total CO2 and CH4 emissions. The purpose of using the Gas Emission Site Type method in this study was to determine the amount of greenhouse gas emissions in selected peatbogs in Poland and to compare them against actual field measurements. The second important issue was to check whether the implementation of renaturalization treatments would result in a reduction in emissions of these gases.
The studied peatbogs are home to a variable number of Gas Emission Site Types. In Kluki, a total of 11 different GESTs were identified; in the Ciemińskie Błoto peatbog, a total of 10 different GESTs were identified; and in Wielkie Bagno, a total of 20 different Gas Emission Site Types were identified.
The first calculations for Polish peatbogs show that increases in water content (renaturalization activities) have yielded results—a. ~12% decrease in CO2 emissions, from 18,802.8 to 16,507.23 t CO2-eq./yr. This is a low value compared with the average for all of the peatbogs participating in the peat research project [64,65]. However, even this smaller reduction yields hope for the future.
Despite the effective use of the Gas Emission Site Type method, it is worth using actual measurements of greenhouse gas emissions in the initial phase. In particular, this applies to research on actual greenhouse gas emissions, e.g., using the chamber method and comparing them with the results obtained using the Gas Emission Site Type method. This will allow the values of CO2 and NH4 emissions from peatbogs currently used in the GEST method (which are based on literature data) to be improved. The preliminary results obtained indicate a fairly positive trend of CO2 emission reduction on the studied peatbogs. Importantly, the Gas Emission Site Type method used in this work is quite effective in calculating greenhouse gas emissions and differs only slightly from the emission values obtained in field studies. The difference is ~10%. Comparing the result obtained using the chamber method with the result obtained by the GEST method, the empirical results were 2.464.1 t CO2-eq./yr. lower.
In sum, the Gas Emission Site Type method appears to have potential, and it is sensible to continue to implement and improve this research approach.
Author Contributions
Conceptualization, R.C.; methodology, R.C.; software, R.C. and K.K.-W.; validation, R.C.; formal analysis, R.C. and K.K.-W.; investigation, R.C.; resources, R.C.; data curation, R.C.; writing—original draft preparation, R.C.; writing—review and editing, R.C. and K.K.-W.; visualization, R.C.; supervision, K.K.-W.; project administration, K.K.-W.; funding acquisition, K.K.-W. All authors have read and agreed to the published version of the manuscript.
Funding
This research received no external funding.
Data Availability Statement
The raw data supporting the conclusions of this article will be made available by the authors on request.
Conflicts of Interest
The authors declare no conflicts of interest.
References
- Page, S.E.; Rieley, J.O.; Banks, C.J. Global and regional importance of the tropical peatland carbon pool. Glob. Chang. Biol. 2011, 17, 798–818. [Google Scholar] [CrossRef]
- Xu, J.; Morris, P.J.; Liu, J.; Holden, J. PEATMAP: Refining estimates of global peatland distribution based on a meta-analysis. Catena 2018, 160, 134–140. [Google Scholar] [CrossRef]
- Strack, M.; Davidson, S.J.; Hirano, T.; Dunn, C. The Potential of Peatlands as Nature-Based Climate Solutions. Curr. Clim. Chang. Rep. 2022, 8, 71–82. [Google Scholar] [CrossRef]
- Kirpotin, S.N.; Antoshkina, O.A.; Berezin, A.E.; Elshehawi, S.; Feurdean, A.; Lapshina, E.D.; Pokrovsky, O.S.; Peregon, A.M.; Semenova, N.M.; Tanneberger, F.; et al. Great Vasyugan Mire: How the world’s largest peatland helps addressing the world’s largest problems. Ambio 2021, 50, 2038–2049. [Google Scholar] [CrossRef] [PubMed]
- de la Haye, A.; Devereux, C.; van Herk, S. Peatlands across Europe: Innovation & Inspiration; Bax & Company: Barcelona, Spain, 2021; Available online: https://baxcompany.com/wp-content/uploads/2018/08/peatlands-booklet.pdf (accessed on 15 May 2023).
- Harris, L.I.; Richardson, K.; Bona, K.A.; Davidson, S.J.; Finkelstein, S.A.; Garneau, M.; McLaughlin, J.; Nwaishi, F.; Olefeldt, D.; Packalen, M.; et al. The essential carbon service provided by northern peatlands. Front. Ecol. Environ. 2021, 20, 222–230. [Google Scholar] [CrossRef]
- Loisel, J.; Yu, Z.; Beilman, D.W.; Camill, P.; Alm, J.; Amesbury, M.J.; Anderson, D.; Andersson, S.; Bochicchio, C.; Barber, K.; et al. A database and synthesis of northern peatland soil properties and Holocene carbon and nitrogen accumulation. Holocene 2014, 24, 1028–1042. [Google Scholar] [CrossRef]
- Wang, J.; Sun, J.; Xia, J.; He, N.; Li, M.; Niu, S. Soil and vegetation carbon turnover times from tropical to boreal forests. Funct. Ecol. 2017, 32, 71–82. [Google Scholar] [CrossRef]
- Turetsky, M.R.; Benscoter, B.; Page, S.; Rein, G.; van der Werf, G.R.; Watts, A. Global vulnerability of peatlands to fire and carbon loss. Nat. Geosci. 2015, 8, 11–16. [Google Scholar] [CrossRef]
- Hugelius, G.; Loisel, J.; Chadburn, S.; Yu, Z. Large stocks of peatland carbon and nitrogen are vulnerable to permafrost thaw. Proc. Natl. Acad. Sci. USA 2020, 117, 20438–20446. [Google Scholar] [CrossRef]
- Turetsky, M.R.; Abbott, B.W.; Jones, M.C.; Anthony, K.W.; Olefeldt, D.; Schuur, E.A.G.; Grosse, G.; Kuhry, P.; Hugelius, G.; Koven, C.; et al. Carbon release through abrupt permafrost thaw. Nat. Geosci. 2020, 13, 138–143. [Google Scholar] [CrossRef]
- Ilnicki, P.; Iwaniszyniec, P. Emissions of greenhouse gases (GHG) from peatland. In Restoration of Carbon Sequestration Capacity and Biodiversity in Abandoned Grassland on Peatland in Poland; Ilnicki, P., Ed.; Publishing House of the Agricultural University in Poznań: Poznań, Poland, 2002; pp. 19–57. [Google Scholar]
- Yu, Z.; Loisel, J.; Brosseau, D.P.; Beilman, D.W.; Hunts, J. Global peatland dynamics since the Last Glacial Maximum. Geophys. Res. Lett. 2010, 37, L13402. [Google Scholar] [CrossRef]
- Kleinen, T.; Brovkin, V.; Munhoven, G. Modelled interglacial carbon cycle dynamics during the Holocene, the Eemian and Marine Isotope Stage (MIS) 11. Clim. Past 2016, 12, 2145–2160. [Google Scholar] [CrossRef]
- Gumbricht, T.; Roman-Cuesta, R.M.; Verchot, L.; Herold, M.; Wittmann, F.; Householder, E.; Herold, N.; Murdiyarso, D. An expert system model for mapping tropical wetlands and peatlands reveals South America as the largest contributor. Glob. Chang. Biol. 2017, 2017, 3581–3599. [Google Scholar] [CrossRef] [PubMed]
- Gorham, E. Northern peatlands: Role in the carbon cycle and probable responses to climatic warming. Ecol. Appl. 1991, 1, 182–195. [Google Scholar] [CrossRef] [PubMed]
- Turunen, J.; Tomppo, E.; Tolonen, K.; Reinikainen, A. Estimating carbon accumulation rates of undrained mires in Finland—application to boreal and subarctic regions. Holocene 2002, 12, 69–80. [Google Scholar] [CrossRef]
- Yu, Z.C. Northern peatland carbon stocks and dynamics: A review. Biogeosciences 2012, 9, 4071–4085. [Google Scholar] [CrossRef]
- Qi, J.; Zhang, X.; Lee, S.; Moglen, G.E.; Sadeghi, A.M.; McCarty, G.W. A coupled surface water storage and subsurface water dynamics model in SWAT for characterizing hydroperiod of geographically isolated wetlands. Adv. Water Resour. 2019, 131, 103380. [Google Scholar] [CrossRef]
- Panai, A.; Diaconu, A.; Galka, M.; Grindean, R.; Hutchinson, S.M.; Hickler, T.; Lamentowicz, M.; Mulch, A.; Tanţău, I.; Werner, C.; et al. Hydrological conditions and carbon accumulation rates reconstructed from a mountain raised bog in the Carpathians: A multi-proxy approach. Catena 2017, 152, 57–68. [Google Scholar] [CrossRef]
- Uri, V.; Kukumägi, M.; Aosaar, J.; Varik, M.; Becker, H.; Soosaar, K.; Morozov, G.; Ligi, K.; Padari, A.; Ostonen, I.; et al. Carbon budgets in fertile grey alder (Alnus incaba (L.) Moench.) stands of different ages. For. Ecol. Manag. 2017, 396, 55–67. [Google Scholar] [CrossRef]
- Haapalehto, T.O.; Vasander, H.; Jauhiainen, S.; Tahvanainen, T.; Kotiaho, J.S. The effects of peatland restoration on water-table depth, elemental concentrations, and vegetation: 10 years of changes. Restor. Ecol. 2011, 19, 587–598. [Google Scholar] [CrossRef]
- Price, J.S.; Ketcheson, S.J. Water relations in cutover peatlands. In Carbon Cycling in Northern Peatlands; American Geophysical Union: Washington, DC, USA, 2009; Volume 184, pp. 277–288. [Google Scholar] [CrossRef]
- Holden, J.; Evans, M.G.; Burt, T.P.; Horton, M. Impact of land drainage on peatland hydrology. J. Environ. Qual. 2006, 35, 1764–1778. [Google Scholar] [CrossRef] [PubMed]
- Jarašius, L.; Etzold, J.; Truus, L.; Purre, A.H.; Sendžikaitė, J.; Strazdiņa, L.; Zableckis, N.; Pakalne, M.; Bociąg, K.; Ilomets, M.; et al. Handbook for Assessment of Greenhouse Gas Emissions from Peatlands; Lithuanian Fund for Nature: Vilnius, Lithuania, 2021; 201p. [Google Scholar]
- Steffen, W.; Rockström, J.; Richardson, K.; Lenton, T.M.; Folke, C.; Liverman, D.; Summerhayes, C.P.; Barnosky, A.D.; Cornel, S.E.; Crucifix, M.; et al. Trajectories of the Earth system in the anthropocene. Proc. Natl. Acad. Sci. USA 2018, 115, 8252–8259. [Google Scholar] [CrossRef] [PubMed]
- Günther, A.; Barthelmes, A.; Huth, V.; Joosten, H.; Jurasinski, G.; Koebsch, F.; Couwenberg, J. Prompt rewetting of drained peatlands reduces climate warming despite methane emissions. Nat. Commun. 2020, 11, 1644. [Google Scholar] [CrossRef] [PubMed]
- Purre, A.H.; Pajula, R.; Ilomets, M. Carbon dioxide sink fun ction in restored milled peatlands—The significance of weather and vegetation. Geoderma 2019, 346, 30–42. [Google Scholar] [CrossRef]
- Trenberth, K.E. Changes in precipitation with climate change. Clim. Res. 2011, 47, 123–138. [Google Scholar] [CrossRef]
- Chen, X.; Buchberger, S.G. Exploring the relationships between warm-season precipitation, potential evaporation, and “apparent” potential evaporation at site scale. Hydrol. Earth Syst. Sci. 2018, 22, 4535–4545. [Google Scholar] [CrossRef]
- Taminskas, J.; Linkevičienė, R.; Šimanauskienė, R.; Jukna, L.; Kibirkštis, G.; Tamkevičiūtė, M. Climate change and water table fluctuation: Implications for raised bog surface variability. Geomorphology 2018, 304, 40–49. [Google Scholar] [CrossRef]
- Morris, P.J.; Baird, A.J.; Eades, P.A.; Surridge, B.W.J. Controls on Near-Surface Hydraulic Conductivity in a Raised Bog. Water Resour. Res. 2019, 55, 1531–1543. [Google Scholar] [CrossRef]
- Tiemeyer, B.; Heller, S.; Oehmke, W.; Gatersleben, P.; Bräuer, M.; Dettmann, U. Effects of water management and grassland renewal on the greenhouse gas emissions from intensively used grassland on bog peat. Agric. For. Meteorol. 2024, 345, 109858. [Google Scholar] [CrossRef]
- Lindroth, A.; Lund, M.; Nilsson, M.; Aurela, M.; Christensen, T.R.; Laurila, T.; Rinne, J.; Riutta, T.; Sagerfors, J.; Ström, L.; et al. Environmental controls on the CO2 exchange in north European mires. Tellus B Chem. Phys. Meteorol. 2007, 59, 812–825. [Google Scholar] [CrossRef]
- Janssens, I.A.; Freibauer, A.; Schlamadinger, B.; Ceulemans, R.; Ciais, P.; Dolman, A.J.; Joosten, H. The Global Peatland CO2 Picture. Peatland status and emissions in all countries of the world. Wetl. Int. 2009, 2009, 1–35. [Google Scholar]
- Oestmann, J.; Tiemeyer, B.; Düvel, D.; Grobe, A.; Dettmann, U. Greenhouse Gas Balance of Sphagnum Farming on Highly Decomposed Peat at Former Peat Extraction Sites. Ecosystems 2022, 25, 350–371. [Google Scholar] [CrossRef]
- Bianchi, A.; Larmola, T.; Kekkonen, H.; Saarnio, S.; Lång, K. Review of Greenhouse Gas Emissions from Rewetted Agricultural Soils. Wetlands 2021, 41, 108. [Google Scholar] [CrossRef]
- Aitova, E.; Morley, T.; Wilson, D.; Renou-Wilson, F. A review of greenhouse gas emissions and removals from Irish peatlands. Mires Peat 2023, 29, 1–17. [Google Scholar] [CrossRef]
- Tanneberger, F.; Birr, F.; Couwenberg, J.; Kaiser, M.; Luthardt, V.; Nerger, M.; Pfister, S.; Oppermann, R.; Zeitz, J.; Beyer, C.; et al. Saving soil carbon, greenhouse gas emissions, biodiversity and the economy: Paludiculture as sustainable land use option in German fen peatlands. Reg. Environ. Chang. 2022, 22, 69. [Google Scholar] [CrossRef]
- Beyer, C.; Höper, H. Greenhouse gas emissions from rewetted bog peat extraction sites and a Sphagnum cultivation site in Northwest Germany. Biogeosci. Discuss. 2014, 11, 4493–4530. [Google Scholar] [CrossRef]
- McCarter, C.; Wilkinson, S.; Moore, P.; Waddington, J. Ecohydrological trade-offs from multiple peatland disturbances: The interactive effects of drainage, harvesting, restoration and wildfire in a southern Ontario bog. J. Hydrol. 2021, 601, 126793. [Google Scholar] [CrossRef]
- Okruszko, H. Wirkung der Bodennutzung auf die Niedermoorentwicklung. Ergebnisse eines längjährigen Feldversuches. Z. F. Kult. Landentwickl. 1989, 30, 167–176. [Google Scholar]
- Oleszczuk, R.; Regina, K.; Szajdak, L.; Höper, H.; Maryganova, V. Impact of agricultural utilization of peat soils on the greenhouse gas balance. In Peatlands and Climate Change; Strack, M., Ed.; International Peat Society: Jyväskylä, Finland, 2008; pp. 70–97. [Google Scholar]
- Cillero, C.; Díaz-Varela, R.A.; Rubinos, M.; Ramil-Rego, P. Assessment of anthropogenic pressures on South European Atlantic bogs (NW Spain) based on hydrochemical data. Hydrobiologia 2016, 774, 37–154. [Google Scholar] [CrossRef]
- Howie, S.A.; Hebda, R.J. Bog surface oscillation (mire breathing): A useful measure in raised bog restoration. Hydrol. Process. 2018, 32, 1518–1530. [Google Scholar] [CrossRef]
- Joosten, H.; Tapio-Biström, M.L.; Tol, S. Peatlands—Guidance for Climate Change Mitigation through Conservation, Rehabilitation and Sustainable Use; FAO & Wetlands International: Ede, The Netherlands, 2012. [Google Scholar]
- Grønlund, A.; Hauge, A.; Hovde, A.; Rasse, D.P. Carbon loss estimates from cultivated peat soils in Norway: A comparision of three methods. Nutr. Cycl. Agroecosys. 2008, 81, 157–167. [Google Scholar] [CrossRef]
- Swenson, M.M.; Regan, S.; Bremmers, D.T.H.; Lawless, J.; Saunders, M.; Gill, L.W. Carbon balance of a restored and cutover raised bog: Implications for restoration and comparison to global trends. Biogeosciences 2019, 16, 713–731. [Google Scholar] [CrossRef]
- Schwill, S.; Haberl, A.; Strauss, A. Greenhouse Gas Emissions of Peatlands. Methodology for the Assessment of Climate Relevance—Case Study Zehlau Peatland; Michael Succow Foundation for Protection of Nature: Greifswald, Germany, 2010. [Google Scholar]
- Borówka, R.K.; Rotnicki, K. Explanations to the Detailed geological map of Poland 1, 50,000, Sheet Główczyce (11); Ministry of the Environment and the Polish Geological Institute: Warsaw, Poland, 2000. (In Polish)
- Tobolski, K. Climatic and ecological changes in the Quaternary period and the problem of changes in flora. Phytocenosis 1976, 5, 187–197. (In Polish) [Google Scholar]
- Chlost, I.; Sikora, M. The impact of anthropogenic pressure on the change of water relations in Gardno-Łeba lowland. Quaest. Geogr. 2015, 34, 17–31. [Google Scholar] [CrossRef]
- Kubiak-Wójcicka, K.; Owczarek, M.; Chlost, I.; Olszewska, A.; Nagy, P. Assessment of Meteorological Drought Trends in a Selected Coastal Basin Area in Poland—A Case Study. Water 2023, 15, 2836. [Google Scholar] [CrossRef]
- Tobolski, K. Holocene vegetational development based on the Kluki Reference Site in the Gardno–Łeba Plain. Acta Paleobot. 1987, 27, 179–222. [Google Scholar]
- Silvestrum. Baseline and Monitoring Methodology for the Rewetting of Drained Peatlands Used for Peat Extraction, Forestry or Agriculture Based on GESTs; Verified Carbon Standard Methodology, Version 3; Silvestrum: San Francisco, CA, USA, 2011. [Google Scholar]
- Couwenberg, J.; Thiele, A.; Tanneberger, F.; Augustin, J.; Bärisch, S.; Dubovik, D.; Liashchynskaya, N.; Michaelis, D.; Minke, M.; Skuratovich, A.; et al. Assessing greenhouse gas emissions from peatlands using vegetation as a proxy. Hydrobiologia 2011, 674, 67–89. [Google Scholar] [CrossRef]
- Couwenberg, J. Emission Factors for Managed Peat Soils (Organic Soils, Histosols). An Analysis of IPCC Default Values; Wetlands International: Ede, The Netherlands, 2009; 14p, Available online: https://www.wetlands.org/publication/emission-factors-for-managed-peat-soils-an-analysis-of-ipcc-default-values/ (accessed on 15 May 2023).
- Couwenberg, J. Vegetation as proxy for greenhouse gas fluxes—the GEST approach. In Carbon Credits from Peatland Rewetting. Climate—Biodiversity—Land Use; Tanneberger, F., Wichtmann, W., Eds.; Science, Policy, Implementation and Recommendations of a Pilot Project in Belarus; Schweizerbart: Stuttgart, Germany, 2011; pp. 37–52. [Google Scholar]
- Hiraishi, T.; Krug, T.; Tanabe, K.; Srivastava, N.; Jamsranjav, B.; Fukuda, M.; Troxler, T. Supplement to the 2006 IPCC Guidelines for National Greenhouse Gas Inventories: Wetlands, Methodological Guidance on Lands with Wet and Drained Soils, and Constructed Wetlands for Wastewater Treatment; IPPC: Geneva, Switzerland, 2013. [Google Scholar]
- Westhoff, V.; Van Der Maarel, E. The Braun-Blanquet Approach. In Classification of Plant Communities; Whittaker, R.H., Ed.; Springer: Dordrecht, The Netherlands, 1978; Volume 5-1. [Google Scholar] [CrossRef]
- Koska, I.; Succow, M.; Clausnitzer, U.; Timmermann, T.; Roth, S. Vegetationskundliche Kennzeichnung von Mooren (topische Betrachtung). In Landschaftsökologische Moorkunde; Succow, M., Joosten, H., Eds.; Schweizerbart: Stuttgart, Germany, 2001; pp. 112–184. [Google Scholar]
- Joosten, H.; Brust, K.; Couwenberg, J.; Gerner, A.; Holsten, B.; Permien, T.; Schäfer, A.; Tanneberger, F.; Trepel, M.; Wahren, A. MoorFutures®. Integration of Additional Ecosystem Services (Including Biodiversity) into Carbon Credits—Standard, Methodology and Transferability to Other Regions; MoorFutures: Integration of Additional Ecosystem Services (bfn.de); BfN-Skripten: Bonn, Germany, 2015; 120p. [Google Scholar]
- Cieśliński, R. The use of the GEST method to estimate greenhouse gases uptake or emissions in the absence of data for a raised bog. J. Water Land Dev. 2024, 60, 59–64. [Google Scholar] [CrossRef]
- Intergovernmental Panel on Climate Change (IPCC). Good Practice Guidance for Land Use, Land-Use Change and Forestry; IPPC: Geneva, Switzerland, 2003. [Google Scholar]
- Herrmann, A.; Bociag, K.; Ilomets, S.; Jarasius, L.; Makowska, M.; Pajula, R.; Pakalne, M.; Pawlaczyk, P.; Priede, A.; Sendzikaite, J.; et al. Report of LIFE Peat Restore, LIFE15 CCM/DE/000138. First Gest GHG Balance Scenarios “Reduction of CO2 Emissions by Restoring Degraded Peatlands in Northern European Lowland”; EU Commision: Brussels, Belgium, 2018. [Google Scholar]
- Pakalne, M.; Etzold, J.; Llomets, M.; Jarašius, L.; Pawlaczyk, P.; Bociang, K.; Chlost, R.; Gos, K.; Libaures, K.; Pajula, R.; et al. Best Practice Book for Peatland Restoration and Climate Change Mitigation. Experiences from LIFE Peat Restore Project; University of Latvia: Riga, Latvia, 2021; 184p. [Google Scholar]
- Chowdhury, A.; Naz, A.; Bhattacharyya, S.; Sanyal, P. Cost–benefit analysis of ‘Blue Carbon’ sequestration by plantation of few key mangrove species at Sundarban Biosphere Reserve, India. Carbon Manag. 2018, 9, 575–586. [Google Scholar] [CrossRef]
- Thomas, P.A.; Pearce, D.M.E. Role of cation exchange in preventing the decay of anoxic deep bog peat. Soil. Biol. Biochem. 2004, 36, 23–32. [Google Scholar] [CrossRef]
- Bobuľská, L.; Fazekašová, D.; Angelovičová, L. Vertical Profiles of Soil Properties and Microbial Activities in Peatbog Soils in Slovakia. Environ. Process. 2015, 2, 411–418. [Google Scholar] [CrossRef]
- Li, J.; Li, M.; Zhao, L.; Sun, X.; Gao, M.; Sheng, L.; Bian, H. Characteristics of soil carbon emissions and bacterial community composition in peatlands at different stages of vegetation succession. Sci. Total Environ. 2022, 839, 156242. [Google Scholar] [CrossRef] [PubMed]
- Sheppard, L.J.; Leith, I.D.; Leeson, S.R.; van Dijk, N.; Field, C.; Levy, P. Fate of N in a peatland, Whim bog: Immobilisation in the vegetation and peat, leakage into pore water and losses as N2O depend on the form of N. Biogeosciences 2013, 10, 149–160. [Google Scholar] [CrossRef]
- Evans, C.D.; Peacock, M.; Baird, A.J.; Artz, R.R.E.; Burden, A.; Callaghan, N.; Chapman, P.J.; Cooper, H.M.; Coyle, M.; Craig, E.; et al. Overriding water table control on managed peatland greenhouse gas emissions. Nature 2021, 593, 548–552. [Google Scholar] [CrossRef]
- Mcleod, E.; Chmura, G.L.; Bouillon, S.; Salm, R.; Björk, M.; Duarte, C.M.; Lovelock, C.E.; Schlesinger, W.H.; Sillima, B.R. A blueprint for blue carbon: Toward an improved understanding of the role of vegetated coastal habitats in sequestering CO2. Front. Ecol. Environ. 2011, 9, 552–560. [Google Scholar] [CrossRef]
- Ingram, H.A.P. Hydrology, in Ecosystems of the World 4A. In Mires: Swamp, Bog, Fen and Moor; Gore, A.J.P., Ed.; Elsevier: Amsterdam, The Netherlands, 1983; pp. 67–158. [Google Scholar]
- Bragg, O.M. Hydrology of peat-forming wetlands in Scotland. Sci. Total Environ. 2001, 294, 111–129. [Google Scholar] [CrossRef]
- Krohn, J.; Lozanovska, I.; Kuzyakov, Y.; Parvin, S.; Dorodnikov, M. CH4 and CO2 production below two contrasting peatland micro-relief forms: An inhibitor and δ13C study. Sci. Total Environ. 2017, 586, 142–151. [Google Scholar] [CrossRef] [PubMed]
- Leroy, F.; Gogo, S.; Guimbaud, C.; Francez, A.J.; Zocatelli, R.; Défarge, C.; Jannin, L.B.; Hu, Z.; Laggoun-Défarge, F. Response of C and N cycles to N fertilization in Sphagnum and Molinia-dominated peat mesocosms. J. Environ. Sci. 2019, 77, 264–272. [Google Scholar] [CrossRef]
- Yang, P.; Lai, D.; Huang, J.F.; Tong, C. Effect of drainage on CO2, CH4, and N2O fluxes from aquaculture ponds during winter in a subtropical estuary of China. J. Environ. Sci. 2018, 65, 72–82. [Google Scholar] [CrossRef] [PubMed]
- Lipińska, Z.; Cieśliński, R.; Pawłowska, M.; Chlost, I.; Pietruszyński, Ł. Human Impact on Water Circulation Patterns in Raised Bogs of the Baltic Type, Northern Poland. Sustainability 2023, 15, 12277. [Google Scholar] [CrossRef]
- Xiao, Q.; Xu, X.; Duan, H.; Qi, T.; Qin, B.; Lee, X.; Hu, Z.; Wang, W.; Xiao, W.; Zhang, M. Eutrophic Lake Taihu as a significant CO2 source during 2000–2015. Water Res. 2020, 170, 115331. [Google Scholar] [CrossRef] [PubMed]
- Tarnocai, C. The impact of climate change on Canadian peatlands. Can. Water Resour. J. 2009, 34, 453–466. [Google Scholar] [CrossRef]
- Hopple, A.M.; Wilson, R.M.; Kolton, M.; Zalman, C.A.; Chanton, J.P.; Kostka, J.; Bridgham, S.D. Massive peatland carbon banks vulnerable to rising temperatures. Nat. Commun. 2020, 11, 2373. [Google Scholar] [CrossRef] [PubMed]
- Ratcliffe, J.L.; Campbell, D.I.; Schipper, L.A.; Wall, A.M.; Clarkson, B.R. Recovery of the CO2 sink in a remnant peatland following water table lowering. Sci. Total Environ. 2020, 718, 134613. [Google Scholar] [CrossRef] [PubMed]
- Aubinet, M.; Vesala, T.; Papale, D. (Eds.) Eddy Covariance: A Practical Guide to Measurement and Data Analysis; Springer Science & Business Media: Berlin/Heidelberg, Germany, 2012; 438p. [Google Scholar]
- Collier, S.M.; Ruark, M.D.; Oates, L.G.; Jokela, W.E.; Dell, C.J. Measurement of greenhouse gas flux from agricultural soils using static chambers. J. Vis. Exp. 2014, 90, e52110. Available online: https://www.jove.com/pdf/52110/jove-protocol-52110-measurement-greenhouse-gas-flux-from-agricultural-soils-using-static (accessed on 20 May 2023). [CrossRef]
- Couwenberg, J.; Augustin, J.; Michaelis, D.; Joosten, H. Emission Reductions from Rewetting of Peatlands. Towards a Field Guide for the Assessment of Greenhouse Gas Emissions from Central European Peatlands; DUENE: Greifswald, Germany; RSPB: Sandy, UK, 2008; 28p. [Google Scholar]
- Reichelt, K.F. Evaluierung des GEST-Modells zur Abschätzung der Treibhausgasemissionen aus Mooren. Master’s Thesis, University of Greifswald, Greifswald, Germany, 2015; 55p. [Google Scholar]
- Audet, J.; Johansen, J.R.; Andersen, P.M.; Baattrup-Pedersen, A.; Brask-Jensena, K.M.; Elsgaard, L.; Kjaergaard, C.; Larsen, S.E.; Hoffmann, C.C. Methane emissions in Danish riparian wetlands: Ecosystem comparison and pursuit of vegetation indexes as predictive tools. Ecol. Indic. 2013, 34, 548–559. [Google Scholar] [CrossRef]
- Juszczak, R.; Augustin, J. Exchange of the greenhouse gases methane and nitrous oxide at a temperate pristine fen mire in Central Europe. Wetlands 2013, 33, 895–907. [Google Scholar] [CrossRef]
- Ojanen, P.; Minkkinen, K.; Penttilä, T. The current greenhou se gas impact of forestry-drained boreal peatlands. For. Ecol. Manag. 2013, 289, 201–208. [Google Scholar] [CrossRef]
- Günther, A.; Huth, V.; Jurasinski, G.; Glatzel, S. The effect of biomass harvesting on greenhouse gas emissions from a rewetted temperate fen. Glob. Chang. Biol. Bioenergy 2015, 7, 1092–1106. [Google Scholar] [CrossRef]
- Koch, S.; Jurasinski, G.; Koebsch, F.; Koch, M.; Glatzel, S. Spatial variability of annual estimates of methane emissions in a Phragmites australis (Cav.) Trin. Ex Steud. Dominated restored coastal brackish fen. Wetlands 2014, 34, 593–602. [Google Scholar] [CrossRef]
- Minke, M.; Augustin, J.; Burlo, A.; Yarmashuk, T.; Chuvashova, H.; Thiele, A.; Freibauer, A.; Tikhonov, V.; Hoffmann, M. Water level, vegetation composition, and plant productivity explain greenhouse gas fluxes in temperate cutover fens after inundation. Biogeosciences 2016, 13, 3945–3970. [Google Scholar] [CrossRef]
- Vanselow-Algan, M.; Schmidt, S.R.; Greven, M.; Fiencke, C.; Kutzbach, L.; Pfeiffer, E.-M. High methane emissions dominated annual greenhouse gas balances 30 years after bog rewetting. Biogeosciences 2015, 12, 4361–4371. [Google Scholar] [CrossRef]
- Wilson, D.; Farrell, C.A.; Fallon, D.; Moser, G.; Müller, C.; Renou-Wilson, F. Multiyear greenhouse gas balances at a rewetted temperate peatland. Glob. Chang. Biol. 2016, 22, 4080–4095. [Google Scholar] [CrossRef] [PubMed]
- Turbiak, J.; Ćwiklińska, P. Carbon dioxide exchange in a raised bog after natural regeneration of peat bog vegetation. Woda Sr. Obsz. Wiej. 2018, 18, 49–63. (In Polish) [Google Scholar]
- Turbiak, J.; Ćwiklińska, P. Assessment of the size of the carbon sequence in a transitional peatbog based on measurements of carbon dioxide fluxes. Woda Sr. Obsz. Wiej. 2018, 18, 44–53. (In Polish) [Google Scholar]
- Turbiak, J. Carbon balance in a meadow ecosystem on moderately decayed peat-muck soil. Woda Sr. Obsz. Wiej. 2012, 12, 281–294. (In Polish) [Google Scholar]
- Turbiak, J.; Ćwiklińska, P.; Duda, F. Carbon dioxide emission from raised bog surface after peat extraction. J. Water Land. Dev. 2017, 35, 237–242. [Google Scholar] [CrossRef]
- Renou-Wilson, F.; Moser, G.; Fallon, D.; Farrell, C.A.; Müller, C.; Wilson, D. Rewetting degraded peatlands for climate and biodiversity benefits: Results from two raised bogs. Ecol. Eng. 2019, 127, 547–560. [Google Scholar] [CrossRef]
- Rigney, C.; Wilson, D.; Renou-Wilson, F.; Müller, C.; Moser, G.; Byrne, K.A. Greenhouse gas emissions from two rewetted peatlands previously managed for forestry. Mires Peat 2018, 21, 1–23. [Google Scholar]
- Kiely, G.; Leahy, P.; McVeigh, P.; Lewis, C.; Sottocornola, M.; Laine, A.; Koehler, A.K. PeatGHG-Survey of GHG Emission and Sink Potential of Blanket Peatlands; Environmental Protection Agency: Wexford, Ireland, 2018; pp. 1–35.
- Wilson, D.; Mackin, F.; Tuovinen, J.P.; Moser, G.; Farrell, C.; Renou-Wilson, F. Carbon and climate implications of rewetting a raised bog in Ireland. Glob. Chang. Biol. 2022, 28, 6349–6365. [Google Scholar] [CrossRef]
- Beetz, S.; Liebersbach, H.; Glatzel, S.; Jurasinski, G.; Buczko, U.; Höper, H. Effects of land use intensity on the full greenhouse gas balance in an Atlantic peat bog. Biogeosciences 2013, 10, 1067–1082. [Google Scholar] [CrossRef]
- Salm, J.O.; Maddison, M.; Tammik, S.; Soosaar, K.; Truu, J.; Mander, Ü. Emissions of CO2, CH4 and N2O from undisturbed, drained and mined peatlands in Estonia. Hydrobiologia 2012, 692, 41–55. [Google Scholar] [CrossRef]
- Maljanen, M.; Komulainen, V.M.; Hytonen, J.; Martikainen, P.J.; Laine, J. Carbon dioxide, nitrous oxide and methane dynamics in boreal organic agricultural soils with different soil characteristics. Soil Biol. Biochem. 2004, 36, 1801–1808. [Google Scholar] [CrossRef]
- Tye, A.M.; Williamson, J.L.; Jarvie, H.P.; Dise, N.B.; Lapworth, D.J.; Monteith, D.; Sanders, R.; Mayor, D.J.; Bowes, M.J.; Bowes, M.; et al. Dissolved inorganic carbon export from rivers of Great Britain: Spatial distribution and potential catchment-scale controls. J. Hydrol. 2022, 615, 128677. [Google Scholar] [CrossRef]
- Bociąg, K.; Chlost, I.; Cieśliński, R.; Gos, K.; Kujawa-Pawlaczyk, J.; Makles, M.; Pawlaczyk, P. Peat bogs as coal reservoirs—intention to renaturize peat bogs in the Słowiński National Park. CEPL Stud. Mater. Rogów 2017, 19, 62–76. (In Polish) [Google Scholar]
- Premrov, A.; Wilson, D.; Saunders, M.; Yeluripati, J.; Renou-Wilson, F. CO2 fluxes from drained and rewetted peatlands using a new ECOSSE model water table simulation approach. Sci. Total Environ. 2021, 754, 14243. [Google Scholar] [CrossRef] [PubMed]
- Tuittila, E.S.; Vasander, H.; Laine, J. Sensitivity of C sequestration in reintroduced Sphagnum to water-level variation in a cutaway peatland restoration. Restor. Ecol. 2004, 12, 483–493. [Google Scholar] [CrossRef]
- Lamentowicz, M.; Gałka, M.; Marcisz, K.; Słowiński, M.; Kajukało-Drygalska, K.; Dayras, M.D.; Jassey, V.E. Unveiling tipping points in long-term ecological records from Sphagnum-dominated peatlands. Biol. Lett. 2019, 15, 20190043. [Google Scholar] [CrossRef]
- Kadlec, R.H.; Wallace, S.D. Treatment Wetlands; CRC Press: Boca Raton, FL, USA; Taylor & Francis Group: London, UK; New York, NY, USA, 2009. [Google Scholar]
- Schumann, M.; Joosten, H. Global Peatland Restoration Manual; Institute of Botany and Landscape Ecology, Greifswald University, Germany & International Mire Conservation Group: Greifswald Germany, 2018; Available online: http://www.imcg.net/pages/topics/projects/global-peatland-restoration-manual.php (accessed on 20 May 2023).
- Hartje, V.; Wüstemann, H.; Bonn, A. Naturkapital und Klimapolitik: Synergien und Konflikte; Technische Universität Berlin, Helmholtz-Zentrum für Umweltforschung—UFZ: Berlin, Germany; Leipzig, Germany, 2014. [Google Scholar]
- Lode, E.; Küttim, M.; Kiivit, I.K. Indicative effects of climate change on groundwater levels in Estonian raised bogs over 50 years. Mires Peat 2017, 19, 1–21. [Google Scholar] [CrossRef]
- Lehosmaa, K.; Jyväsjärvi, J.; Virtanen, R.; Rossi, P.M.; Rados, D.; Chuzhekova, T.; Markkola, A.; Ilmonen, J.; Muotka, T. Does habitat restoration enhance spring biodiversity and ecosystem functions? Hydrobiologia 2017, 793, 161–173. [Google Scholar] [CrossRef]
- Fortuniak, K.; Pawlak, W.; Bednorz, L.; Grygoruk, M.; Siedlecki, M.; Zieliński, M. Methane and carbon dioxide fluxes of a temperate mire in Central Europe. Agric. For. Meteorol. 2017, 232, 306–318. [Google Scholar] [CrossRef]
- Xiao, Q.; Xiao, W.; Luo, J.; Qiu, Y.; Hu, C.; Zhang, M.; Qi, T.; Duan, H. Management actions mitigate the risk of carbon dioxide emissions from urban lakes. J. Environ. Manag. 2023, 344, 118626. [Google Scholar] [CrossRef] [PubMed]
- Martens, M.; Karlsson, N.P.E.; Ehde, P.M.; Mattsson, M.; Weisner, S.E.B. The greenhouse gas emission effects of rewetting drained peatlands and growing wetland plants for biogas fuel production. J. Environ. Manag. 2021, 277, 111391. [Google Scholar] [CrossRef] [PubMed]
- Okruszko, T.; Duel, H.; Acreman, M.; Grygoruk, M.; Flörke, M.; Schneider, C. Broad-scale ecosystem services of European wetlands—Overview of the current situation and future perspectives under different climate and water management scenarios. Hydrol. Sci. J. 2011, 56, 1501–1517. [Google Scholar] [CrossRef]
- Mirosław-Świątek, D.; Kiczko, A.; Szporak-Wasilewska, S.; Grygoruk, M. Too wet and too dry? Uncertainty of DEM as a potential source of significant errors in a model-based water level assessment in riparian and mire ecosystems. Wetl. Ecol. Manag. 2017, 25, 547–562. [Google Scholar] [CrossRef]
Figure 1.
Study area.

Figure 2.
Distribution of hydroisobaths for situations of maximum (A), average (B), and minimum (C) hydration in the area of Ciemińskie Błoto, Kluki Peatbog, and Wielkie Bagno.
Figure 2.
Distribution of hydroisobaths for situations of maximum (A), average (B), and minimum (C) hydration in the area of Ciemińskie Błoto, Kluki Peatbog, and Wielkie Bagno.

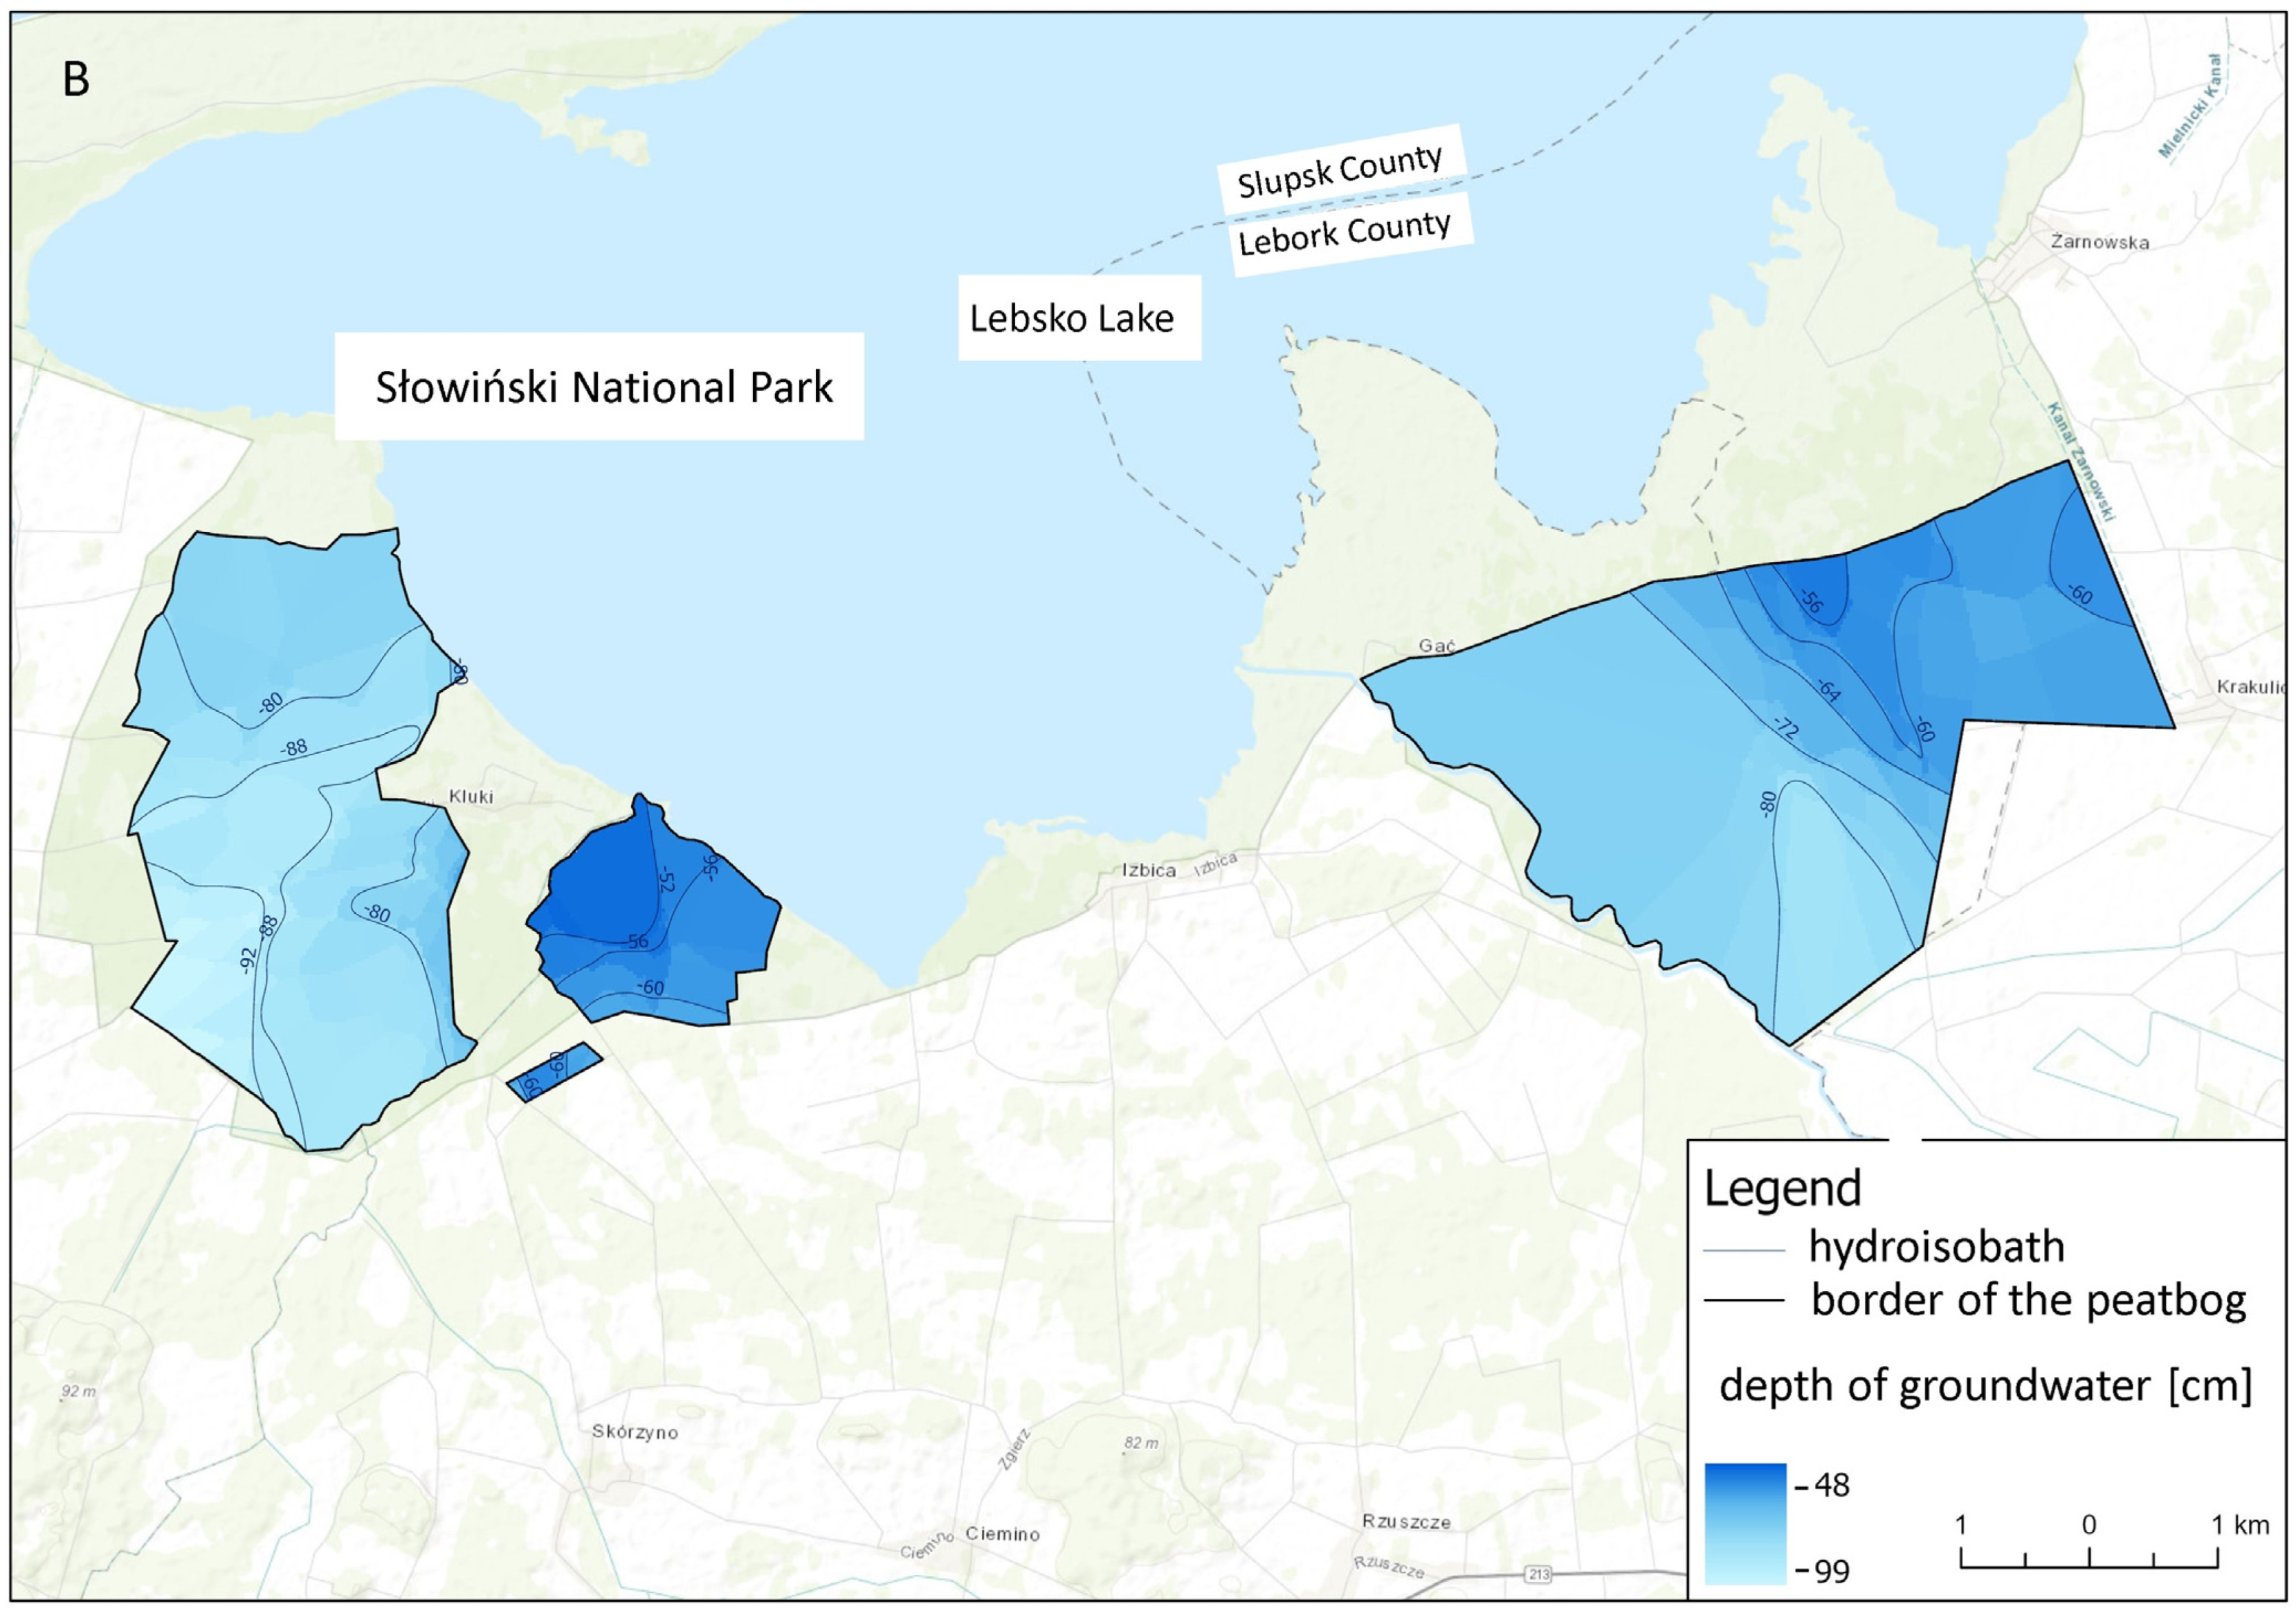

Figure 3.
Amount of monthly outflow from the C9 Canal in 2018–2021.
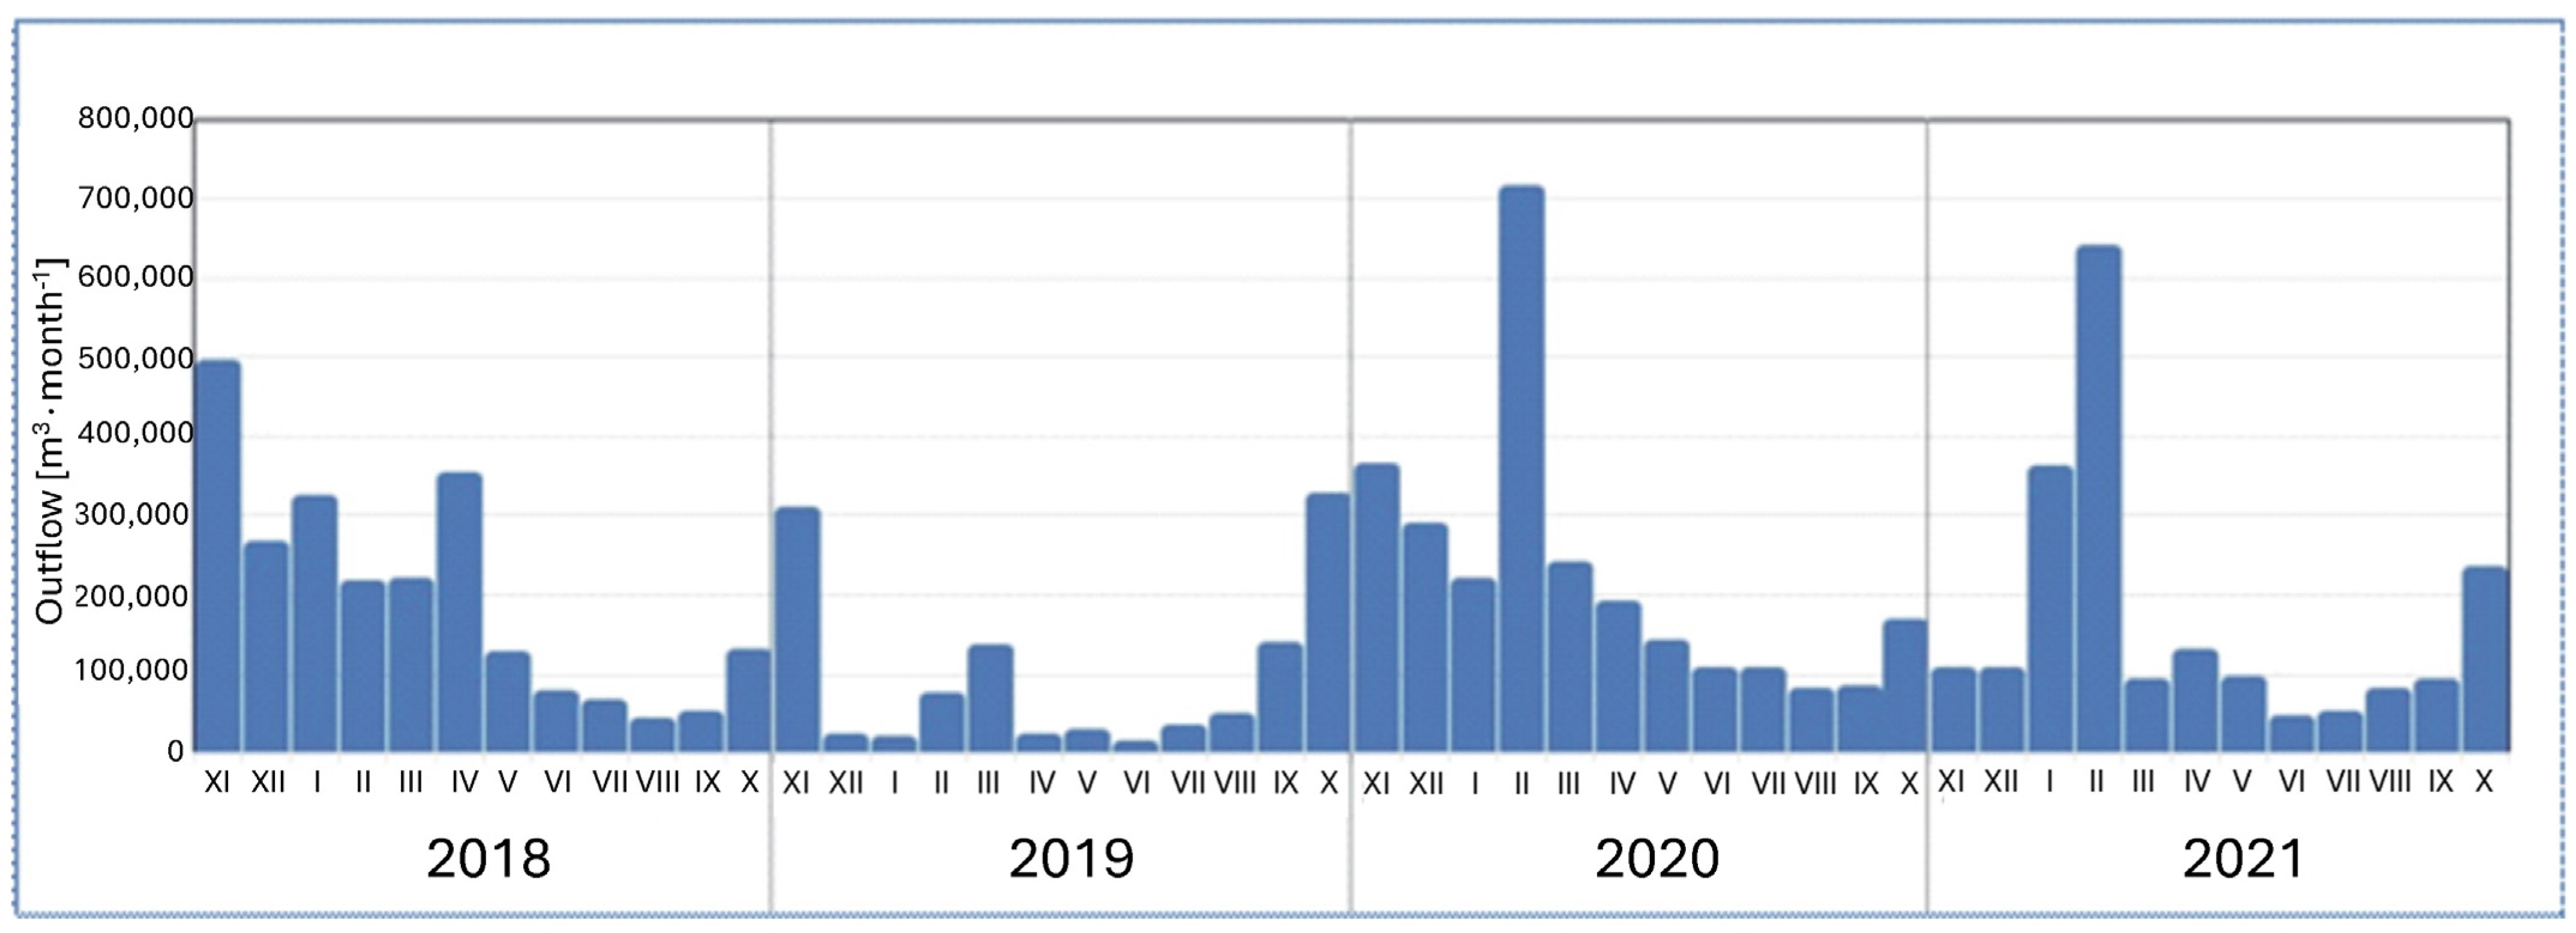
Figure 4.
Monthly evaporation and precipitation at the Łeba station, 2018–2021 (explanations: blue—precipitation, yellow—evaporation).
Figure 4.
Monthly evaporation and precipitation at the Łeba station, 2018–2021 (explanations: blue—precipitation, yellow—evaporation).

Figure 5.
Location of water level and discharge gauging sites across the studied peatbogs (A–C).


Figure 6.
Distribution of water table variability at selected measurement points C6 (Ciemińskie Błoto), K7 (Kluki), and Z5 (Wielkie Bagno), 2018–2021.
Figure 6.
Distribution of water table variability at selected measurement points C6 (Ciemińskie Błoto), K7 (Kluki), and Z5 (Wielkie Bagno), 2018–2021.

Figure 7.
Total of water inflow and outflow in the studied peatbogs, 2018–2021.

Figure 8.
Spatial variation in chloride concentrations (mg·dm−3) in the surface waters of the Ciemińskie Błoto peatbog in 2018–2021.
Figure 8.
Spatial variation in chloride concentrations (mg·dm−3) in the surface waters of the Ciemińskie Błoto peatbog in 2018–2021.
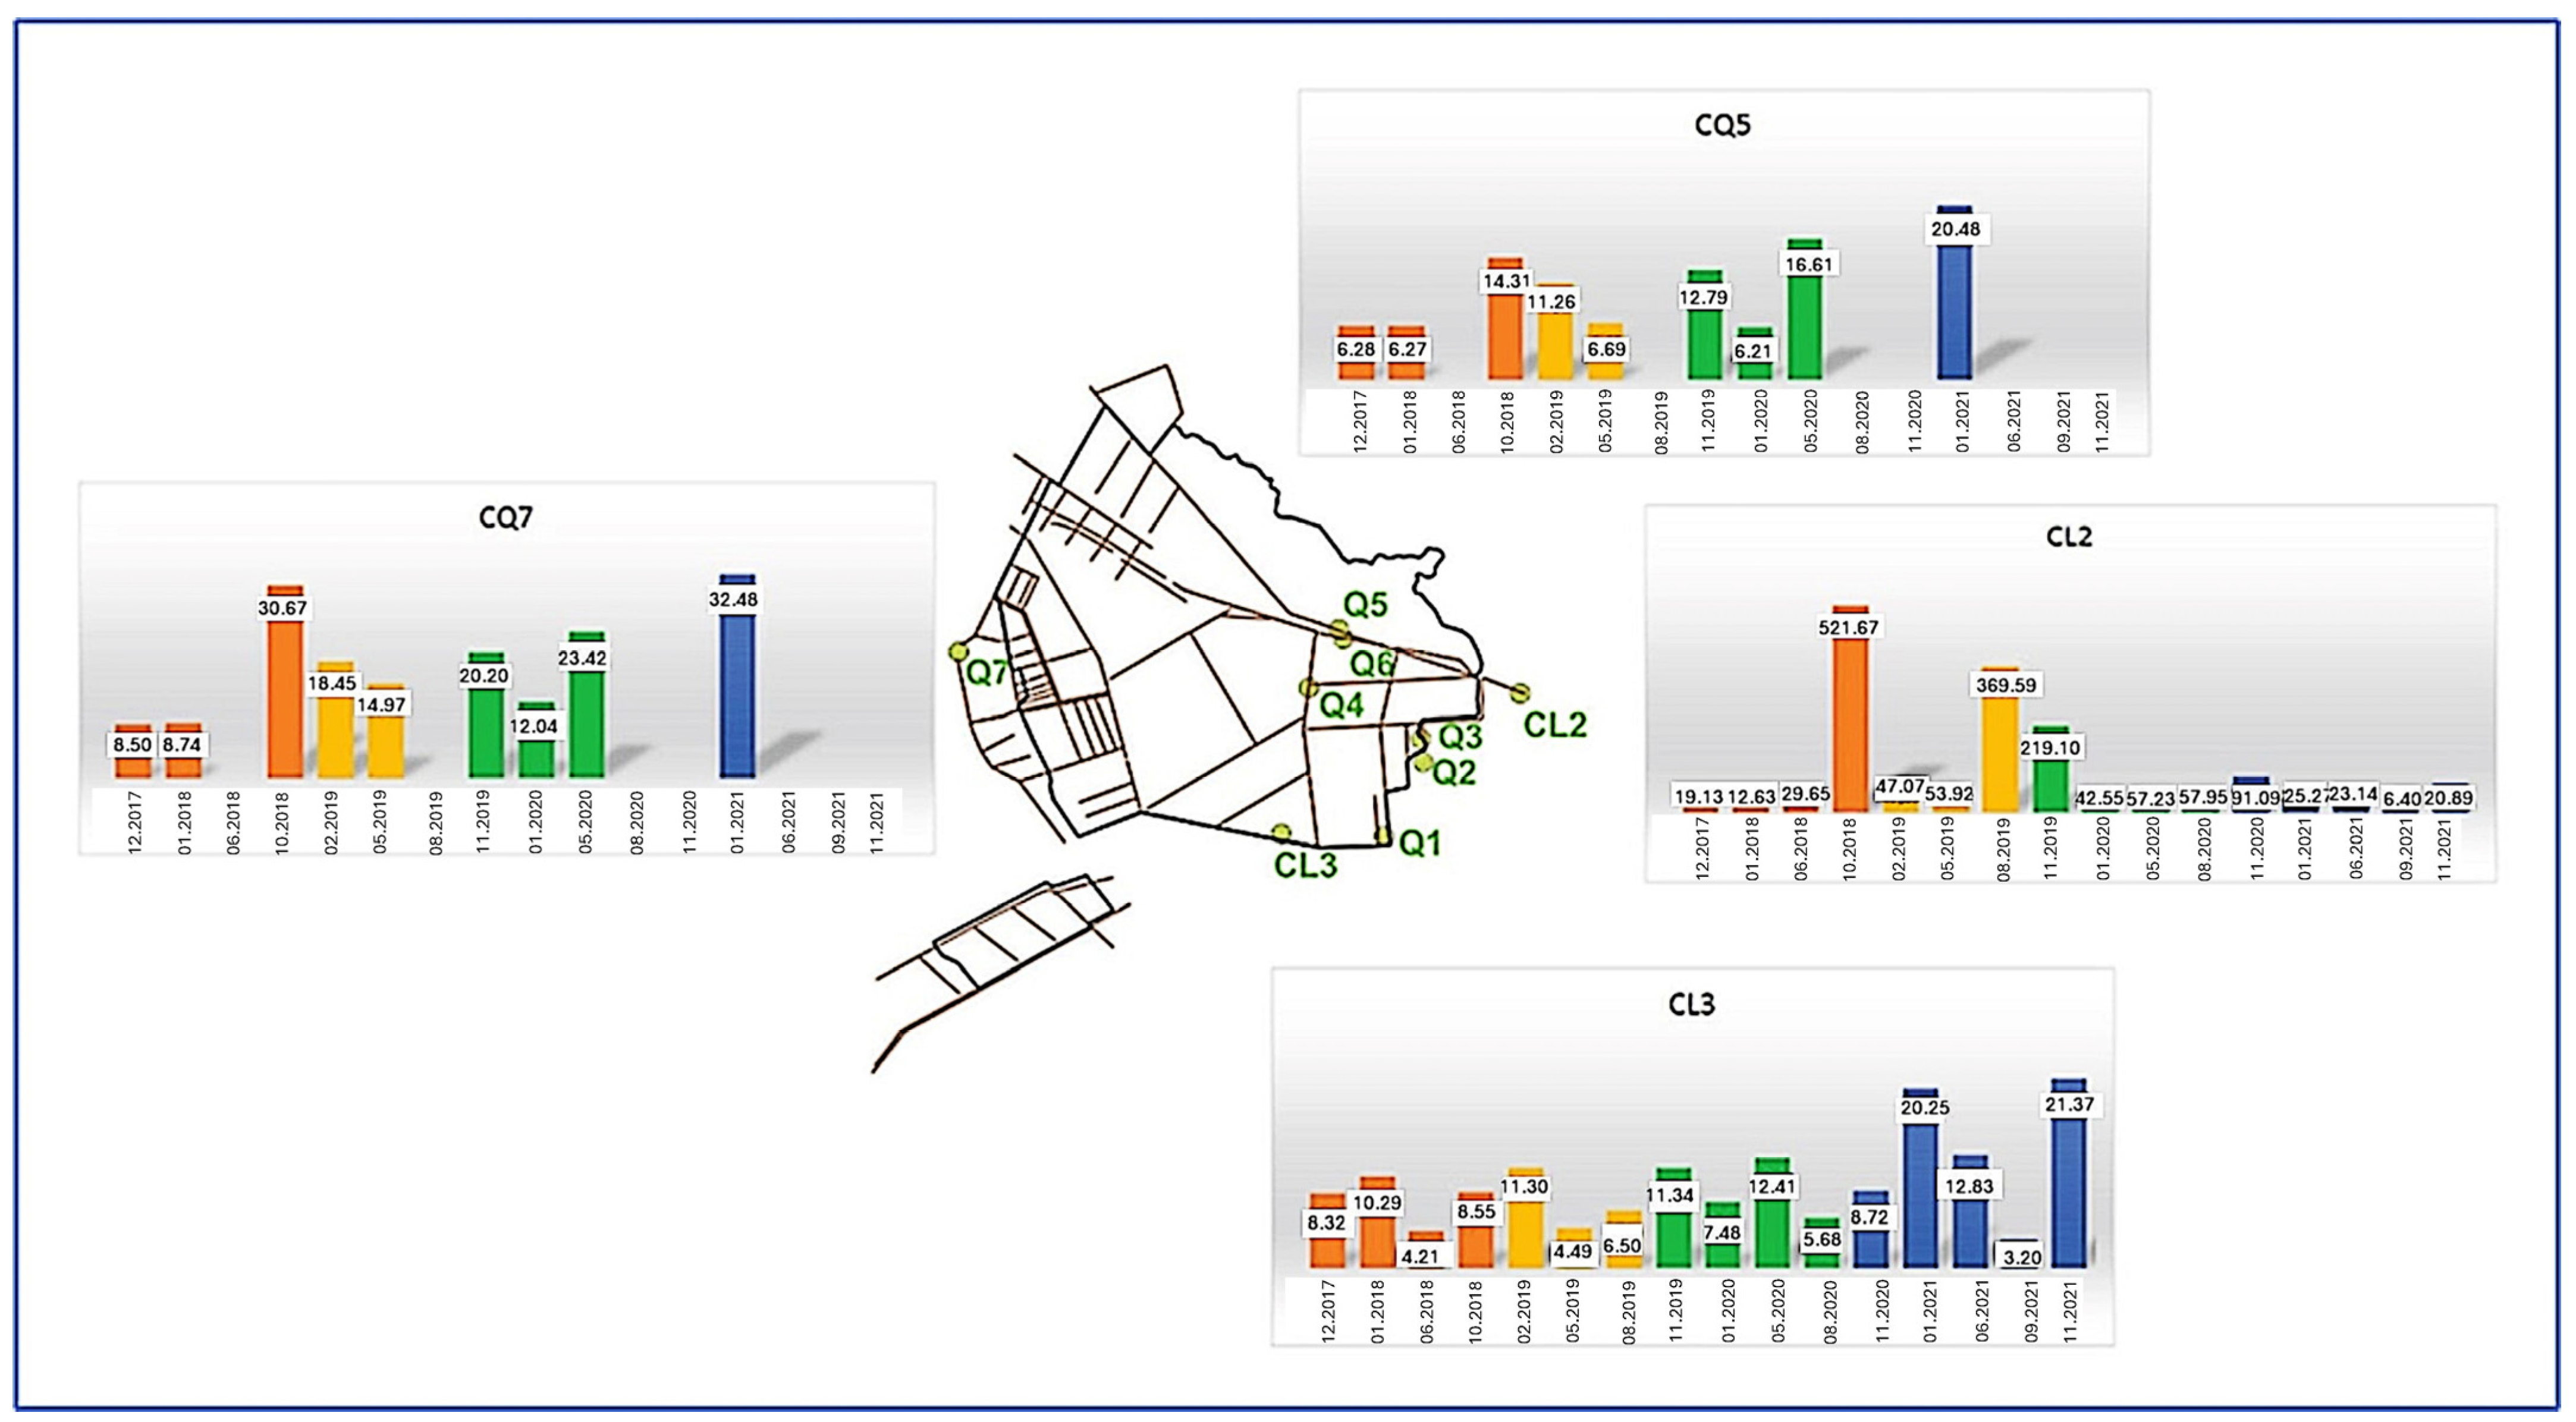
Figure 9.
Spatial variation in chloride concentrations (mg·dm−3) in groundwater of the Ciemińskie Błota peatbogs in 2018–2021.
Figure 9.
Spatial variation in chloride concentrations (mg·dm−3) in groundwater of the Ciemińskie Błota peatbogs in 2018–2021.

Figure 10.
Places of water stagnation in the peatbog in an extremely dry year (2021) with dams installed (A) and without dams installed (B).
Figure 10.
Places of water stagnation in the peatbog in an extremely dry year (2021) with dams installed (A) and without dams installed (B).


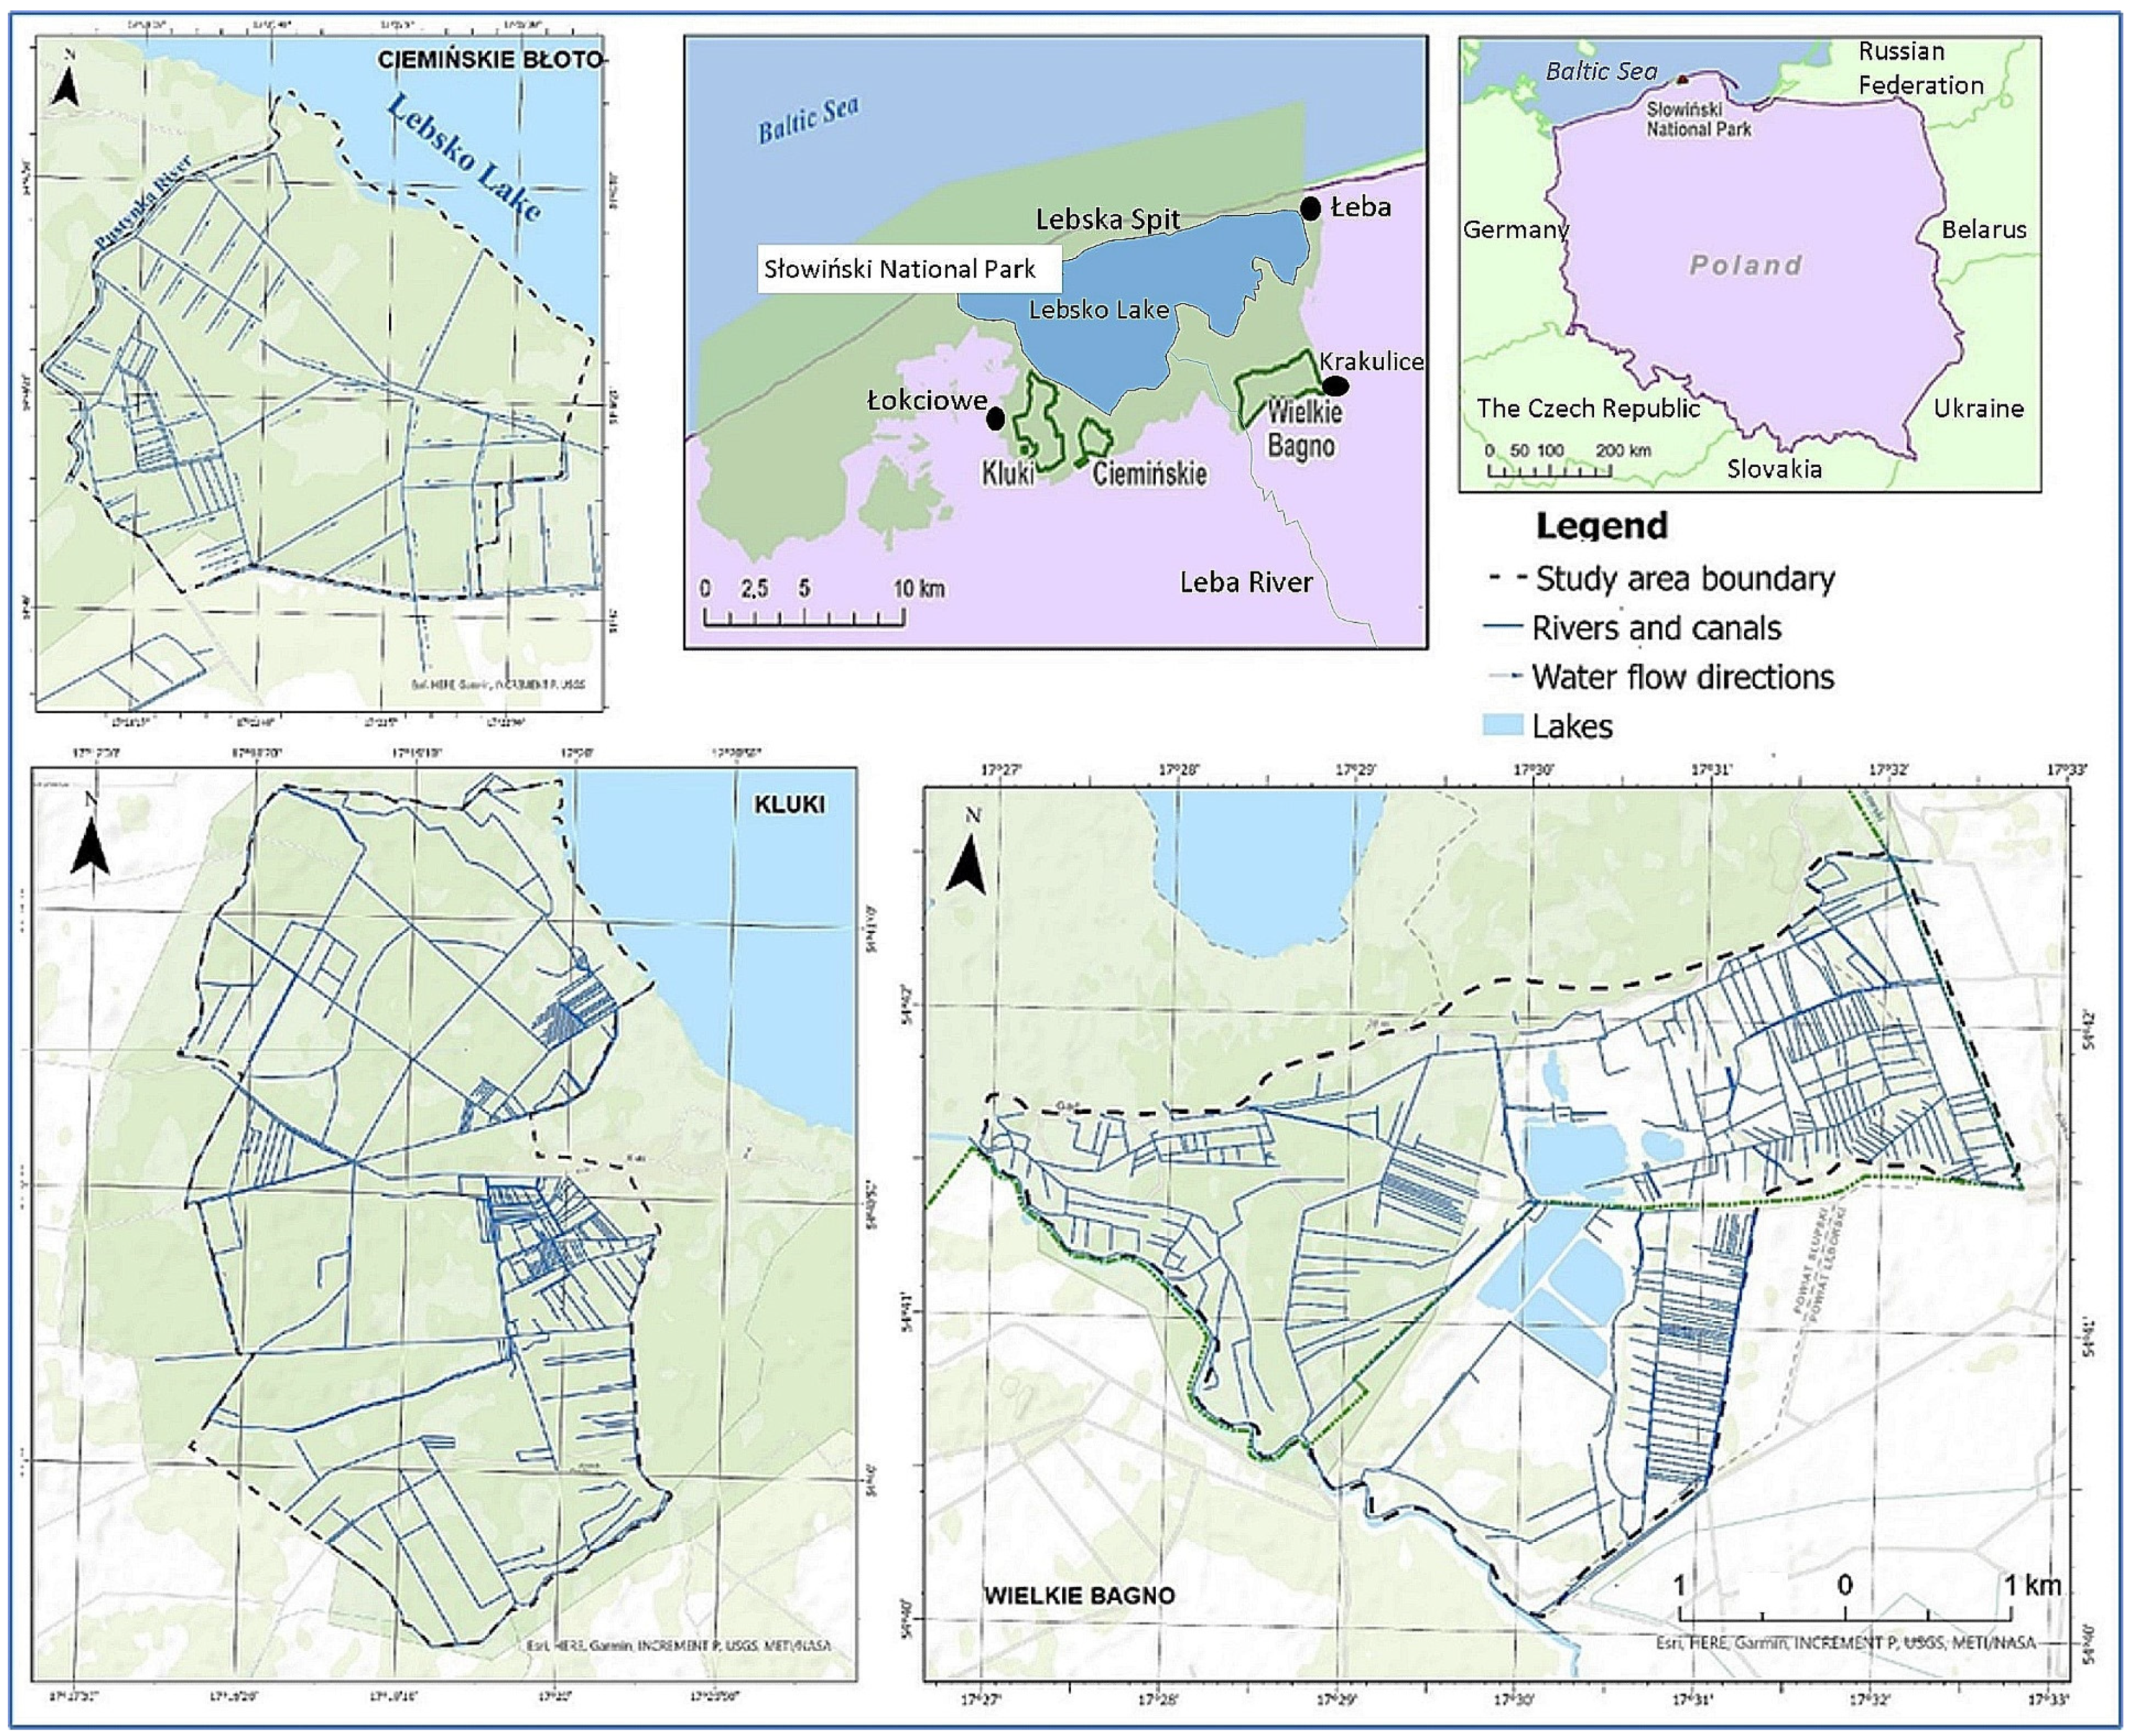
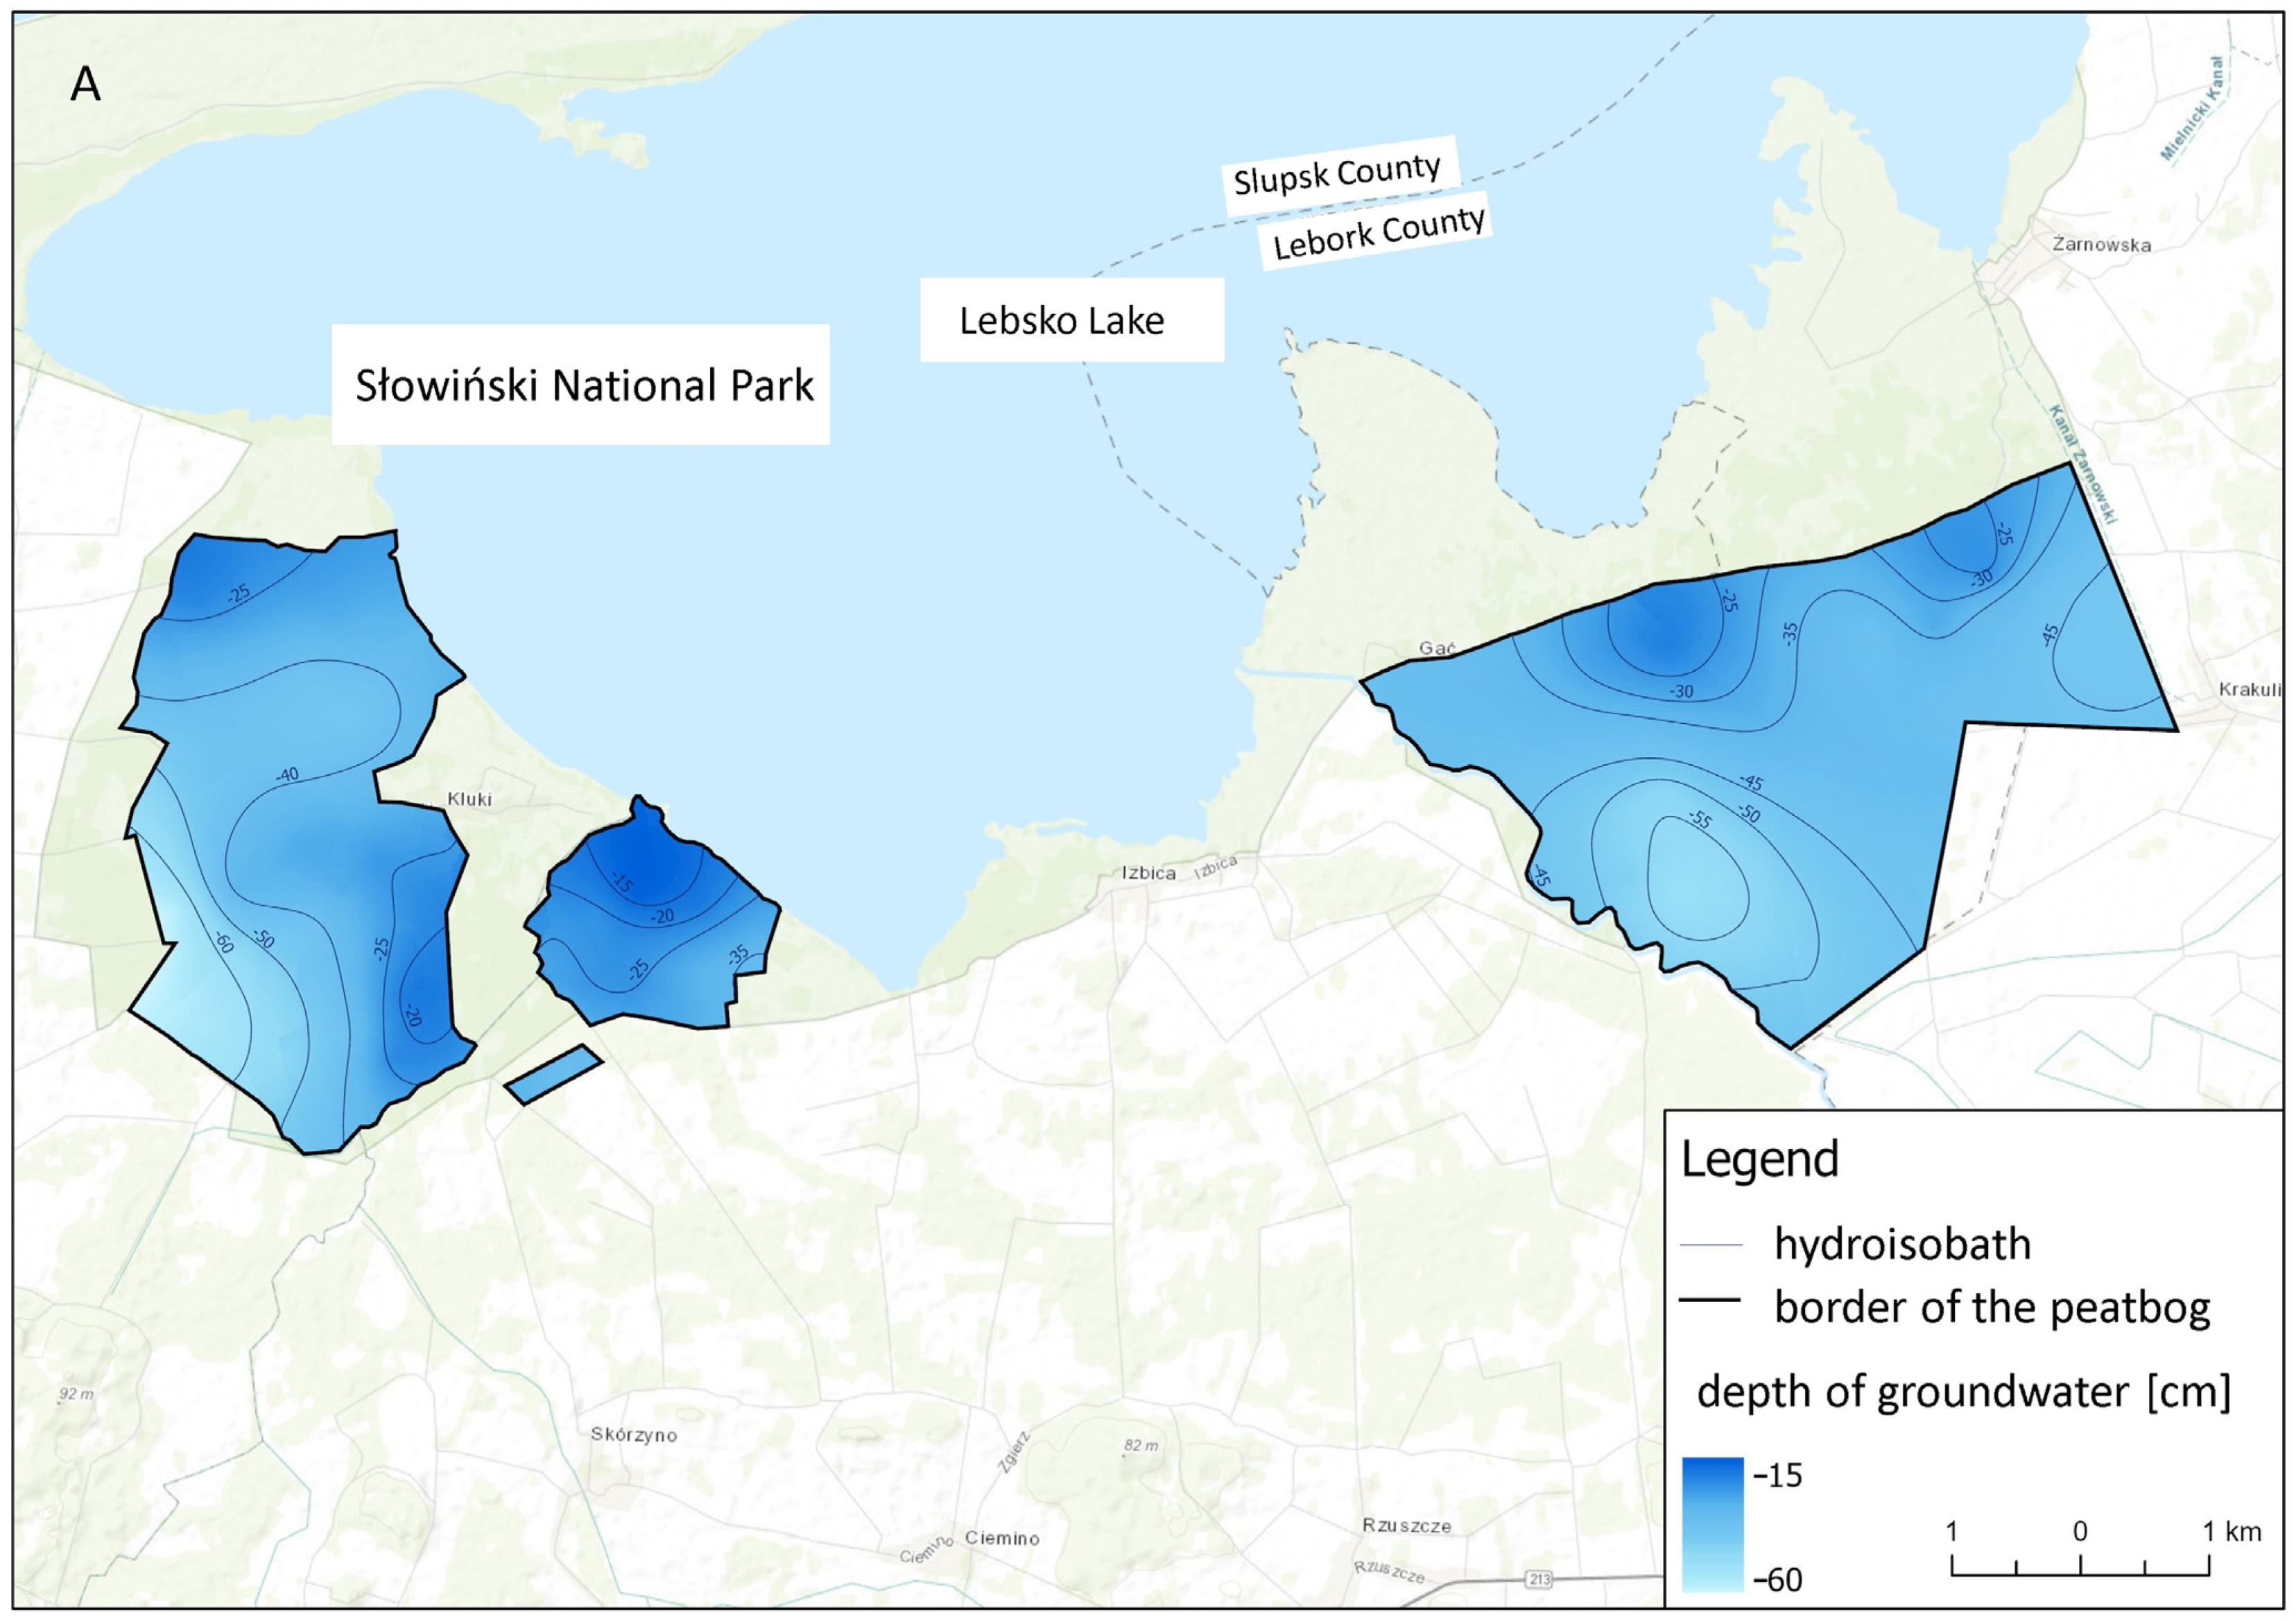
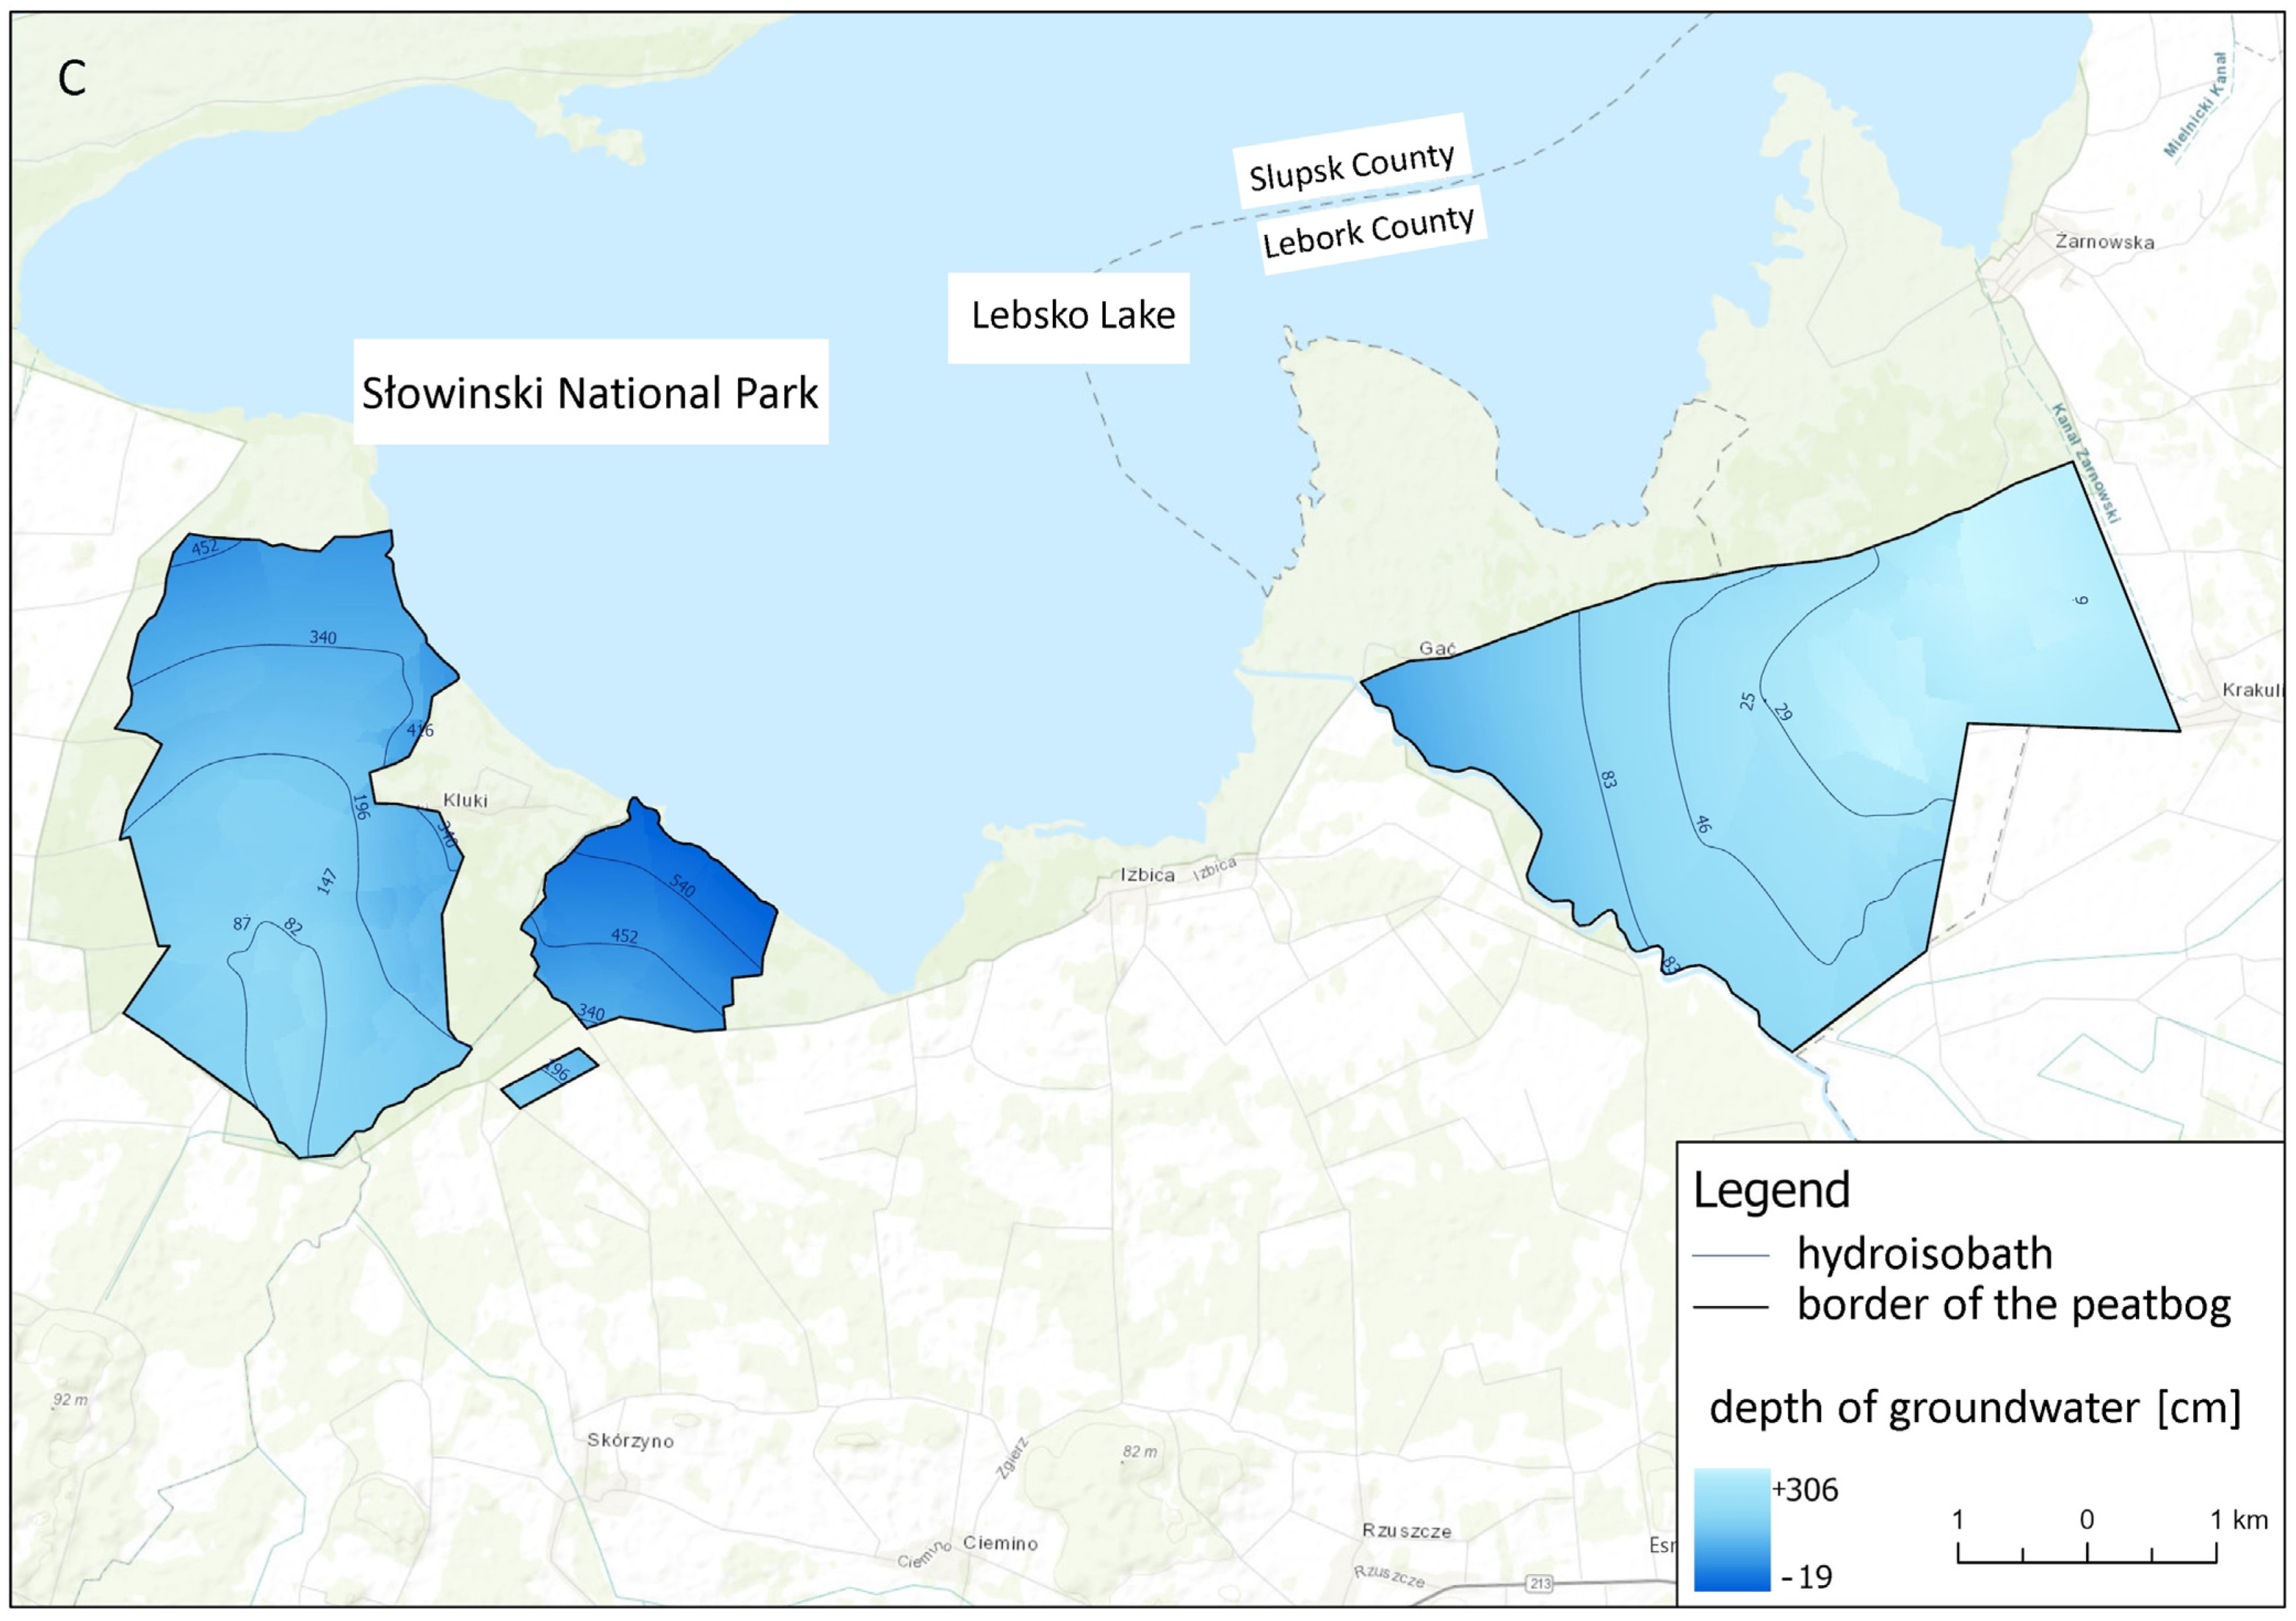
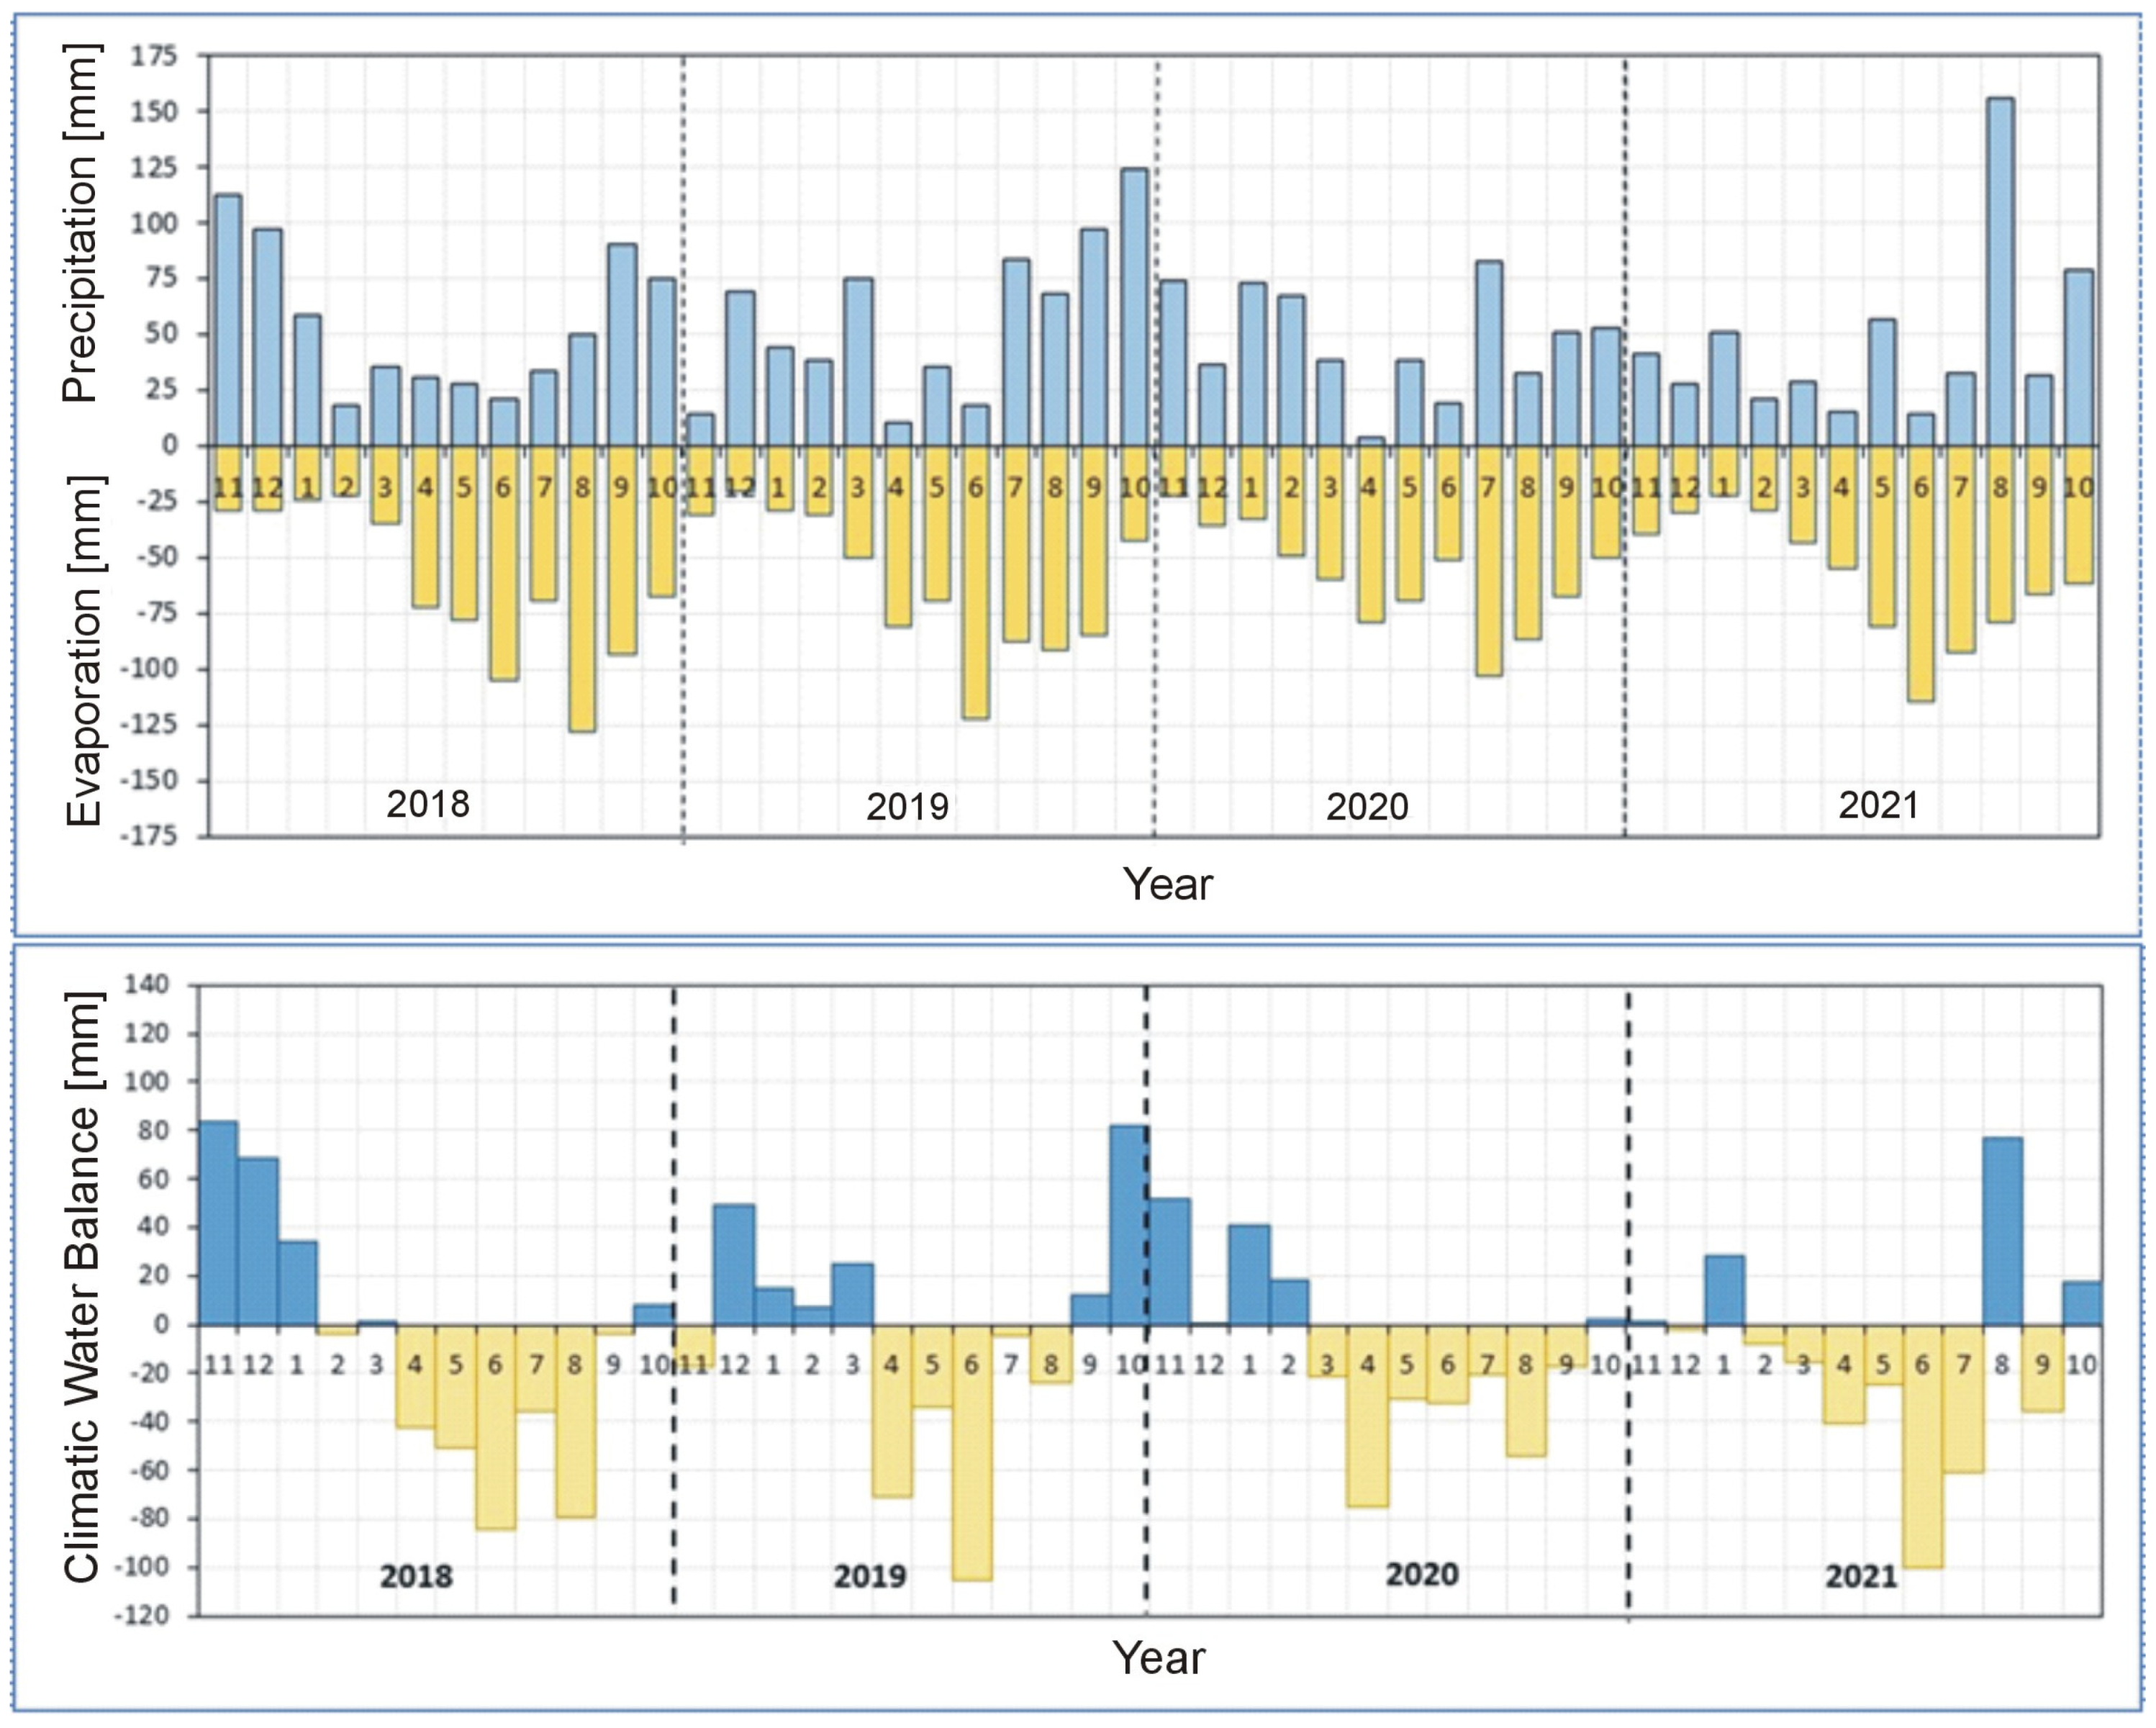
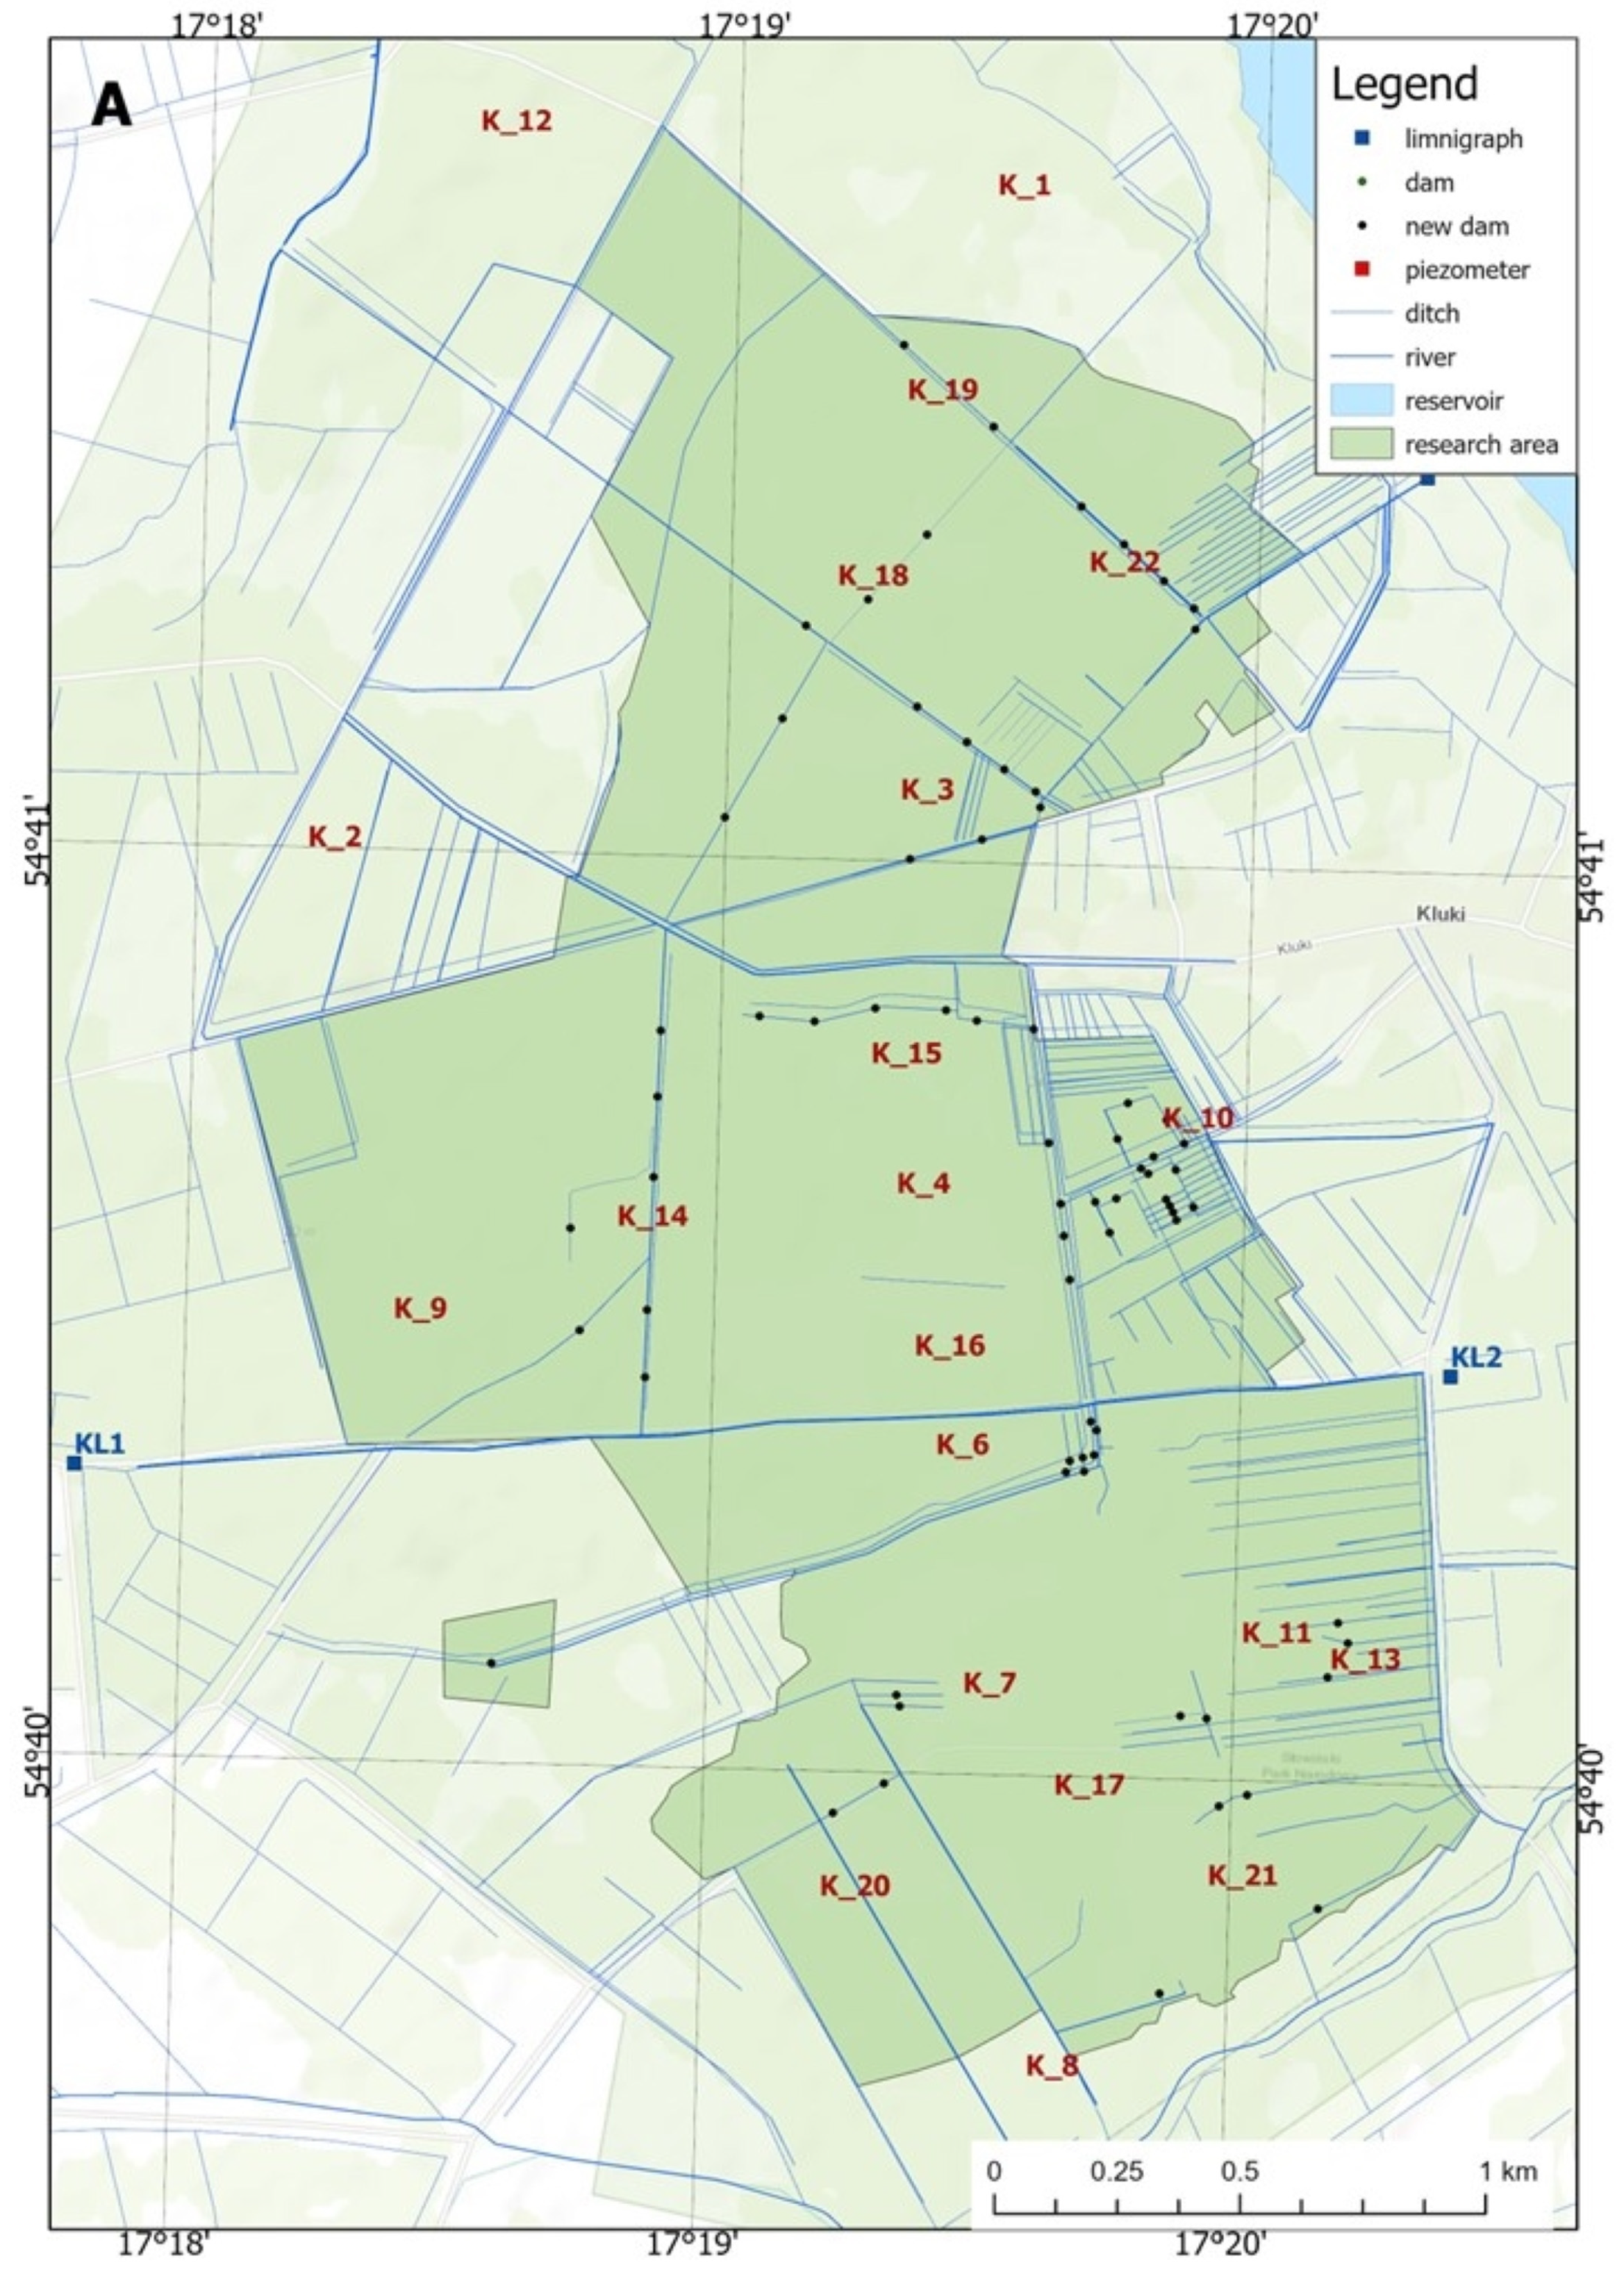
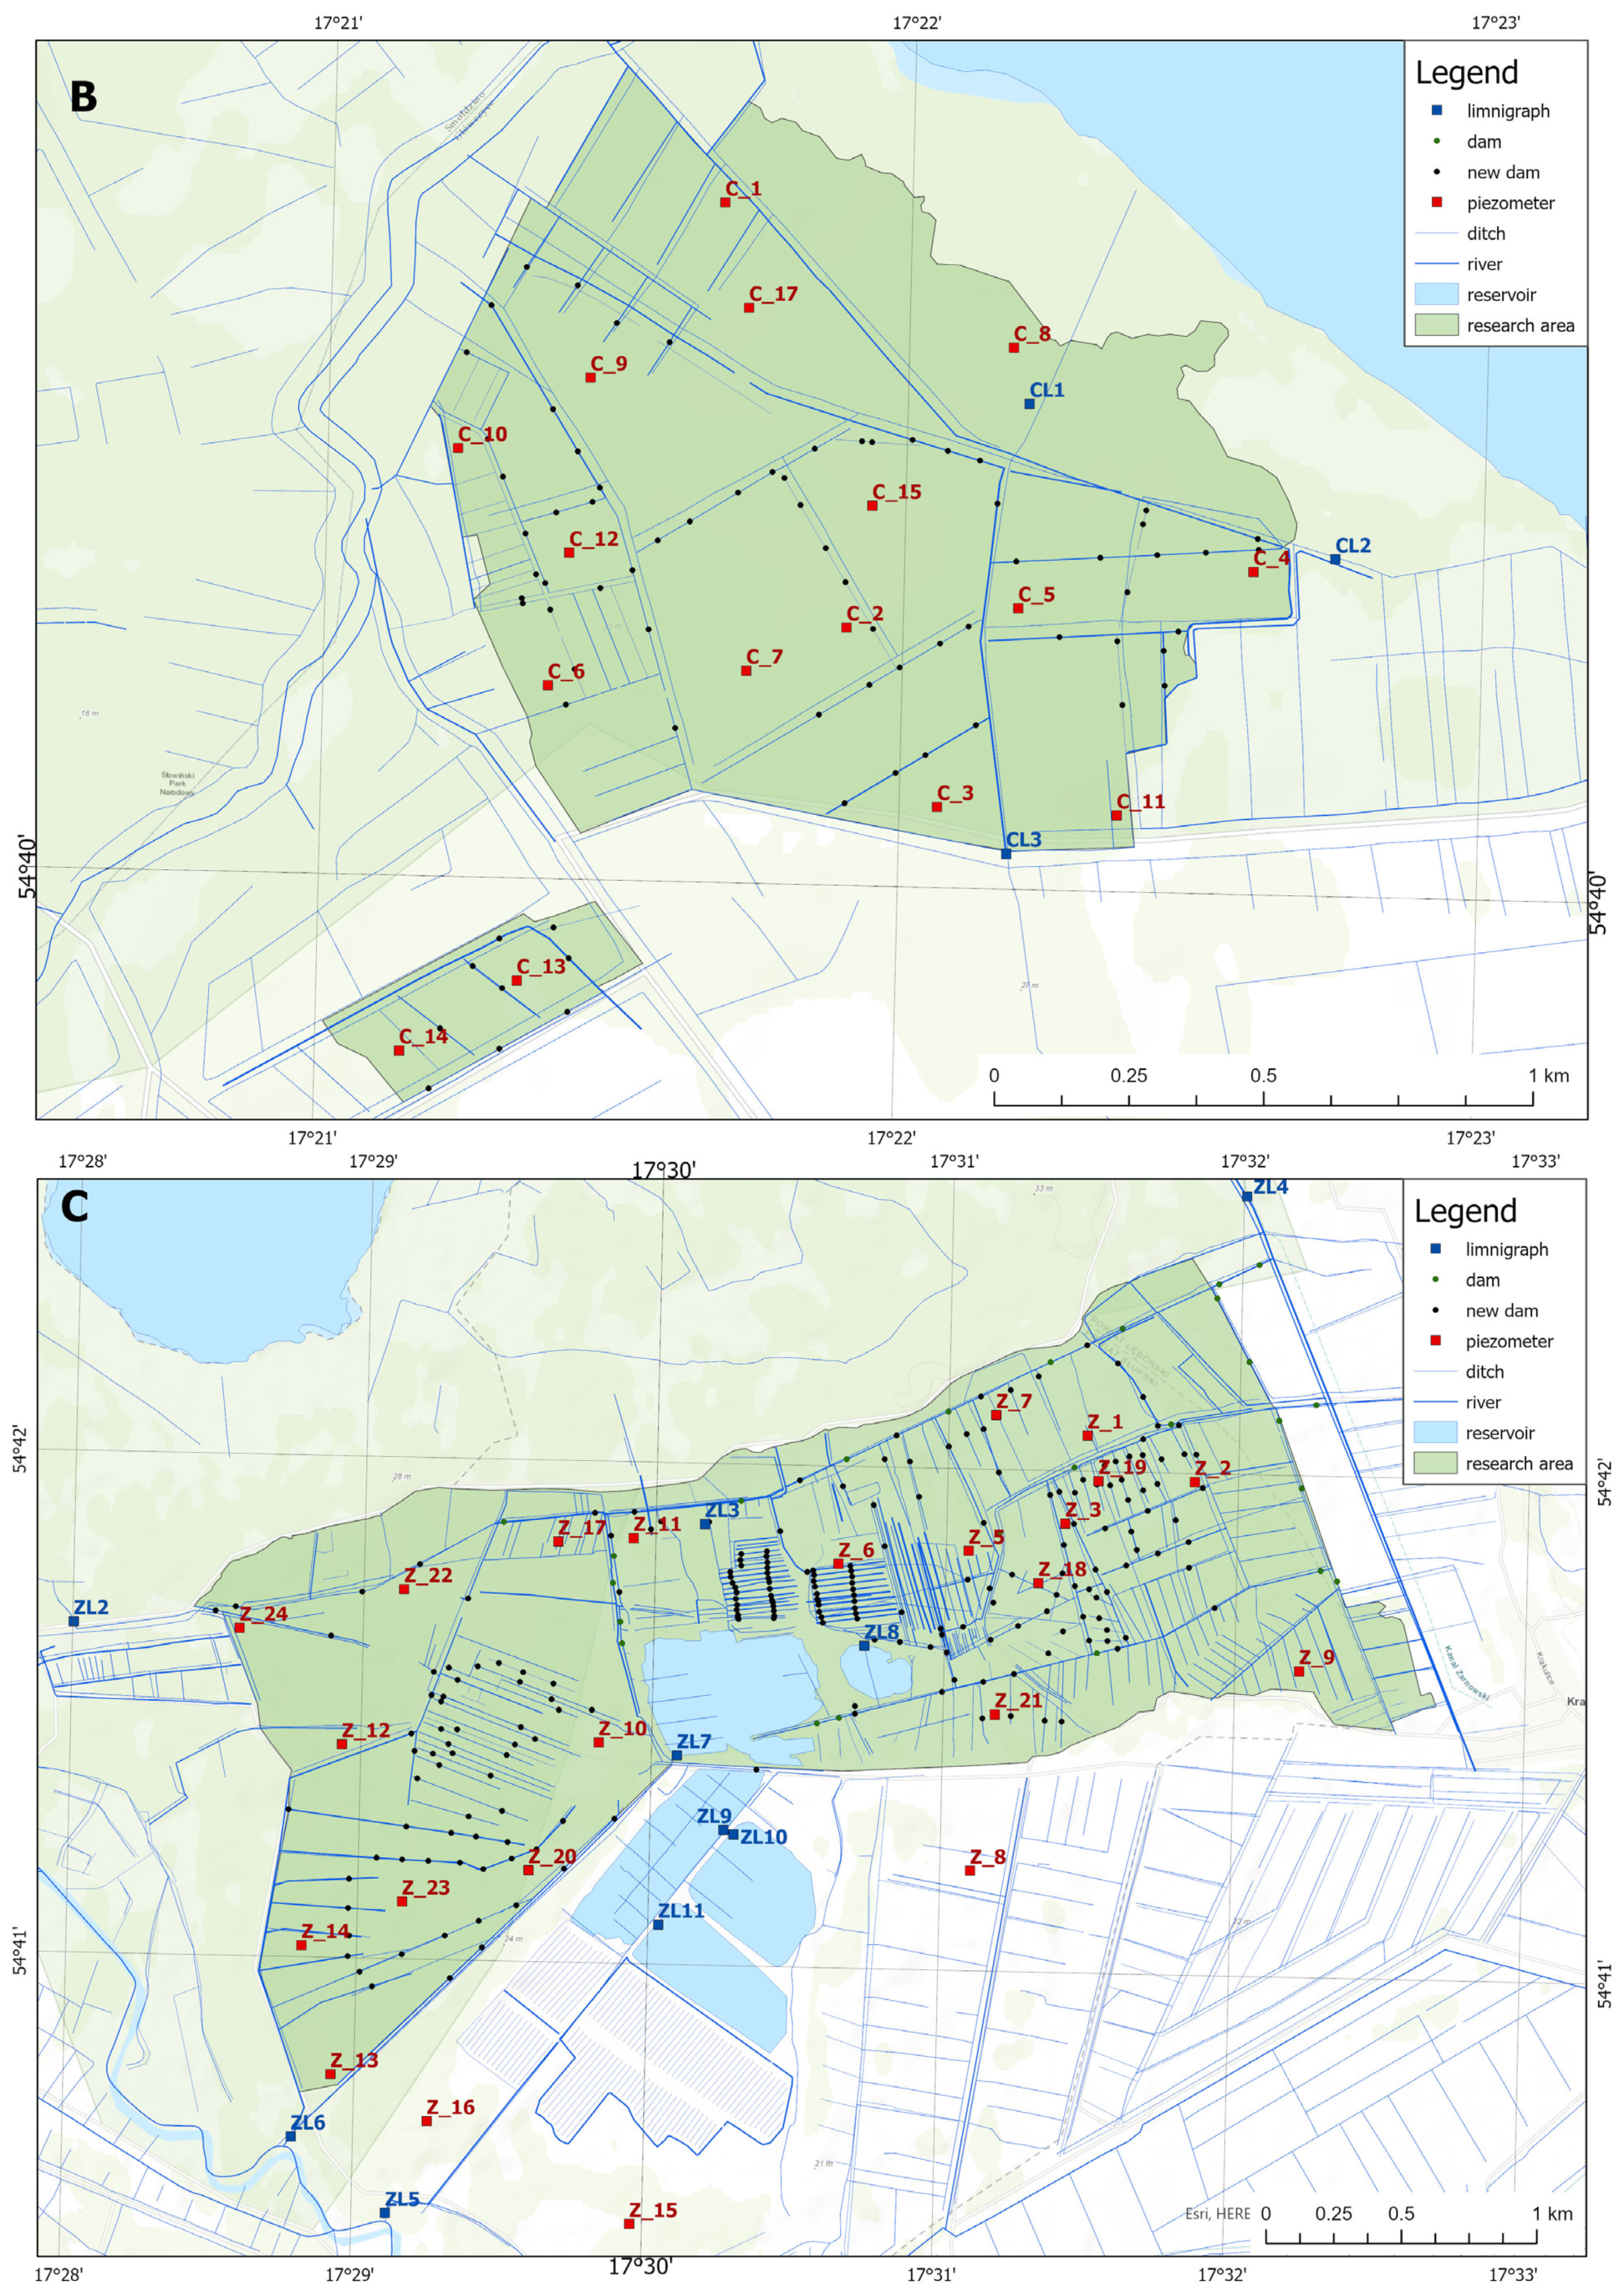
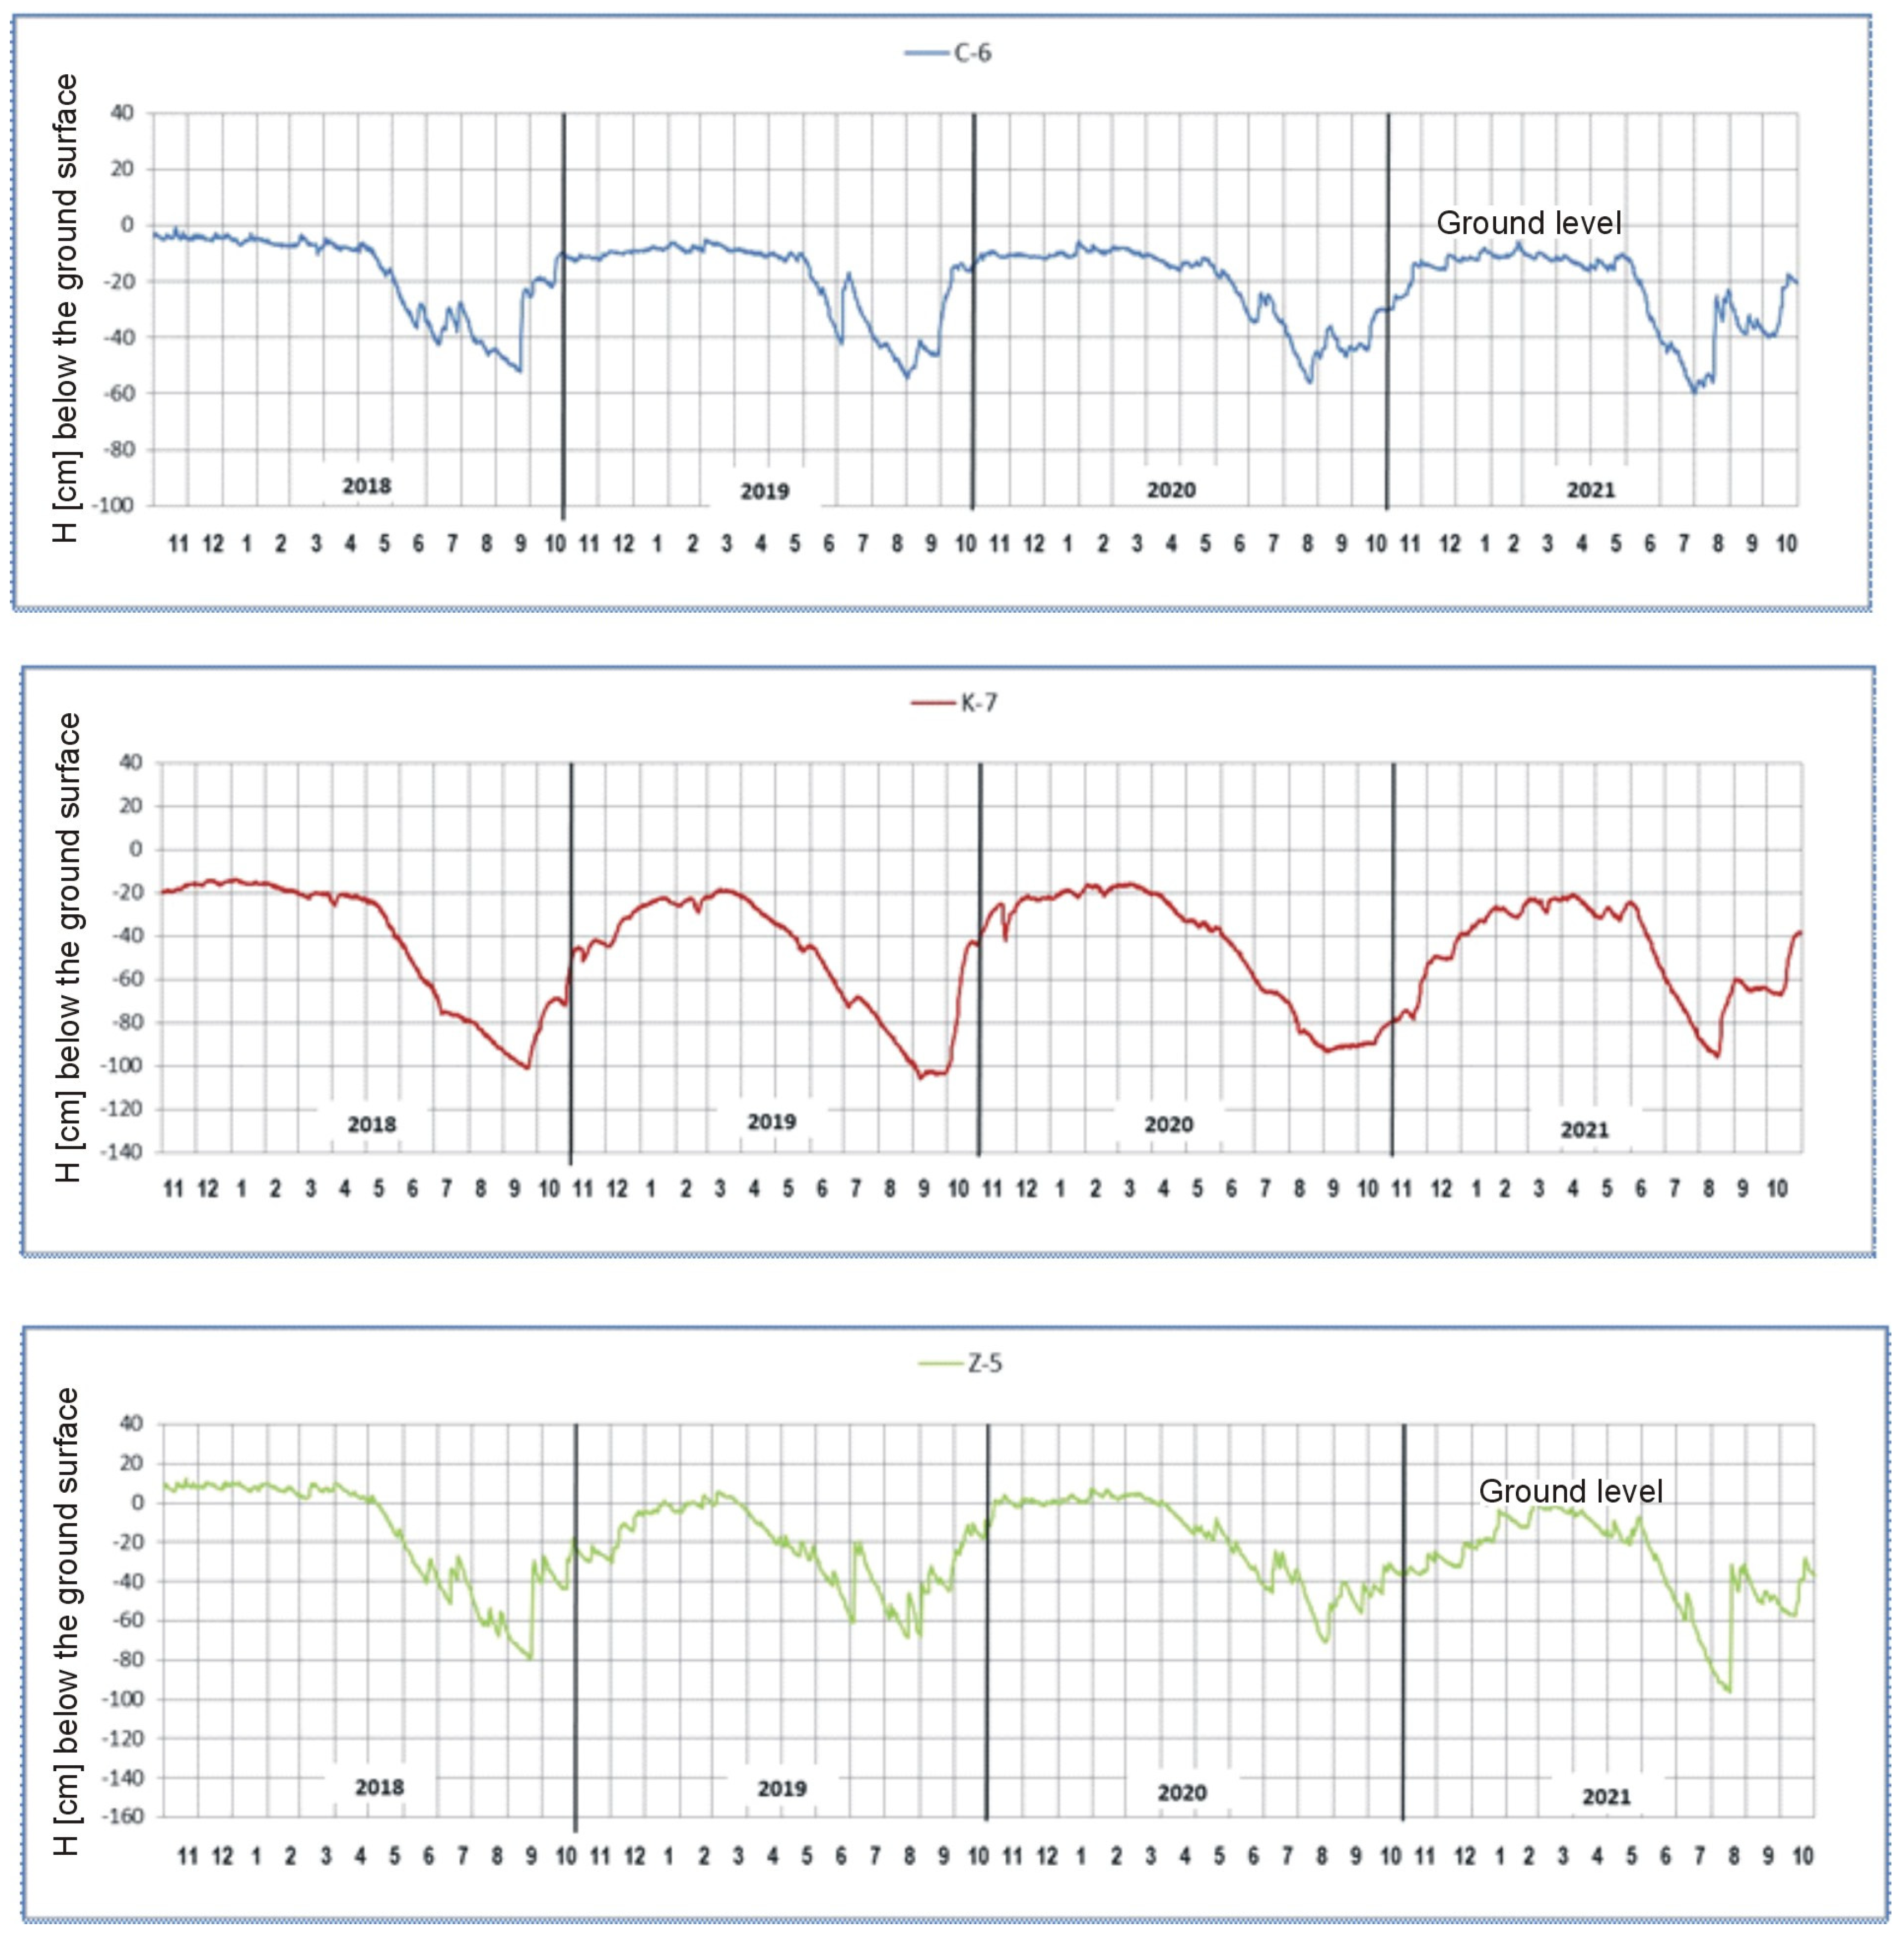
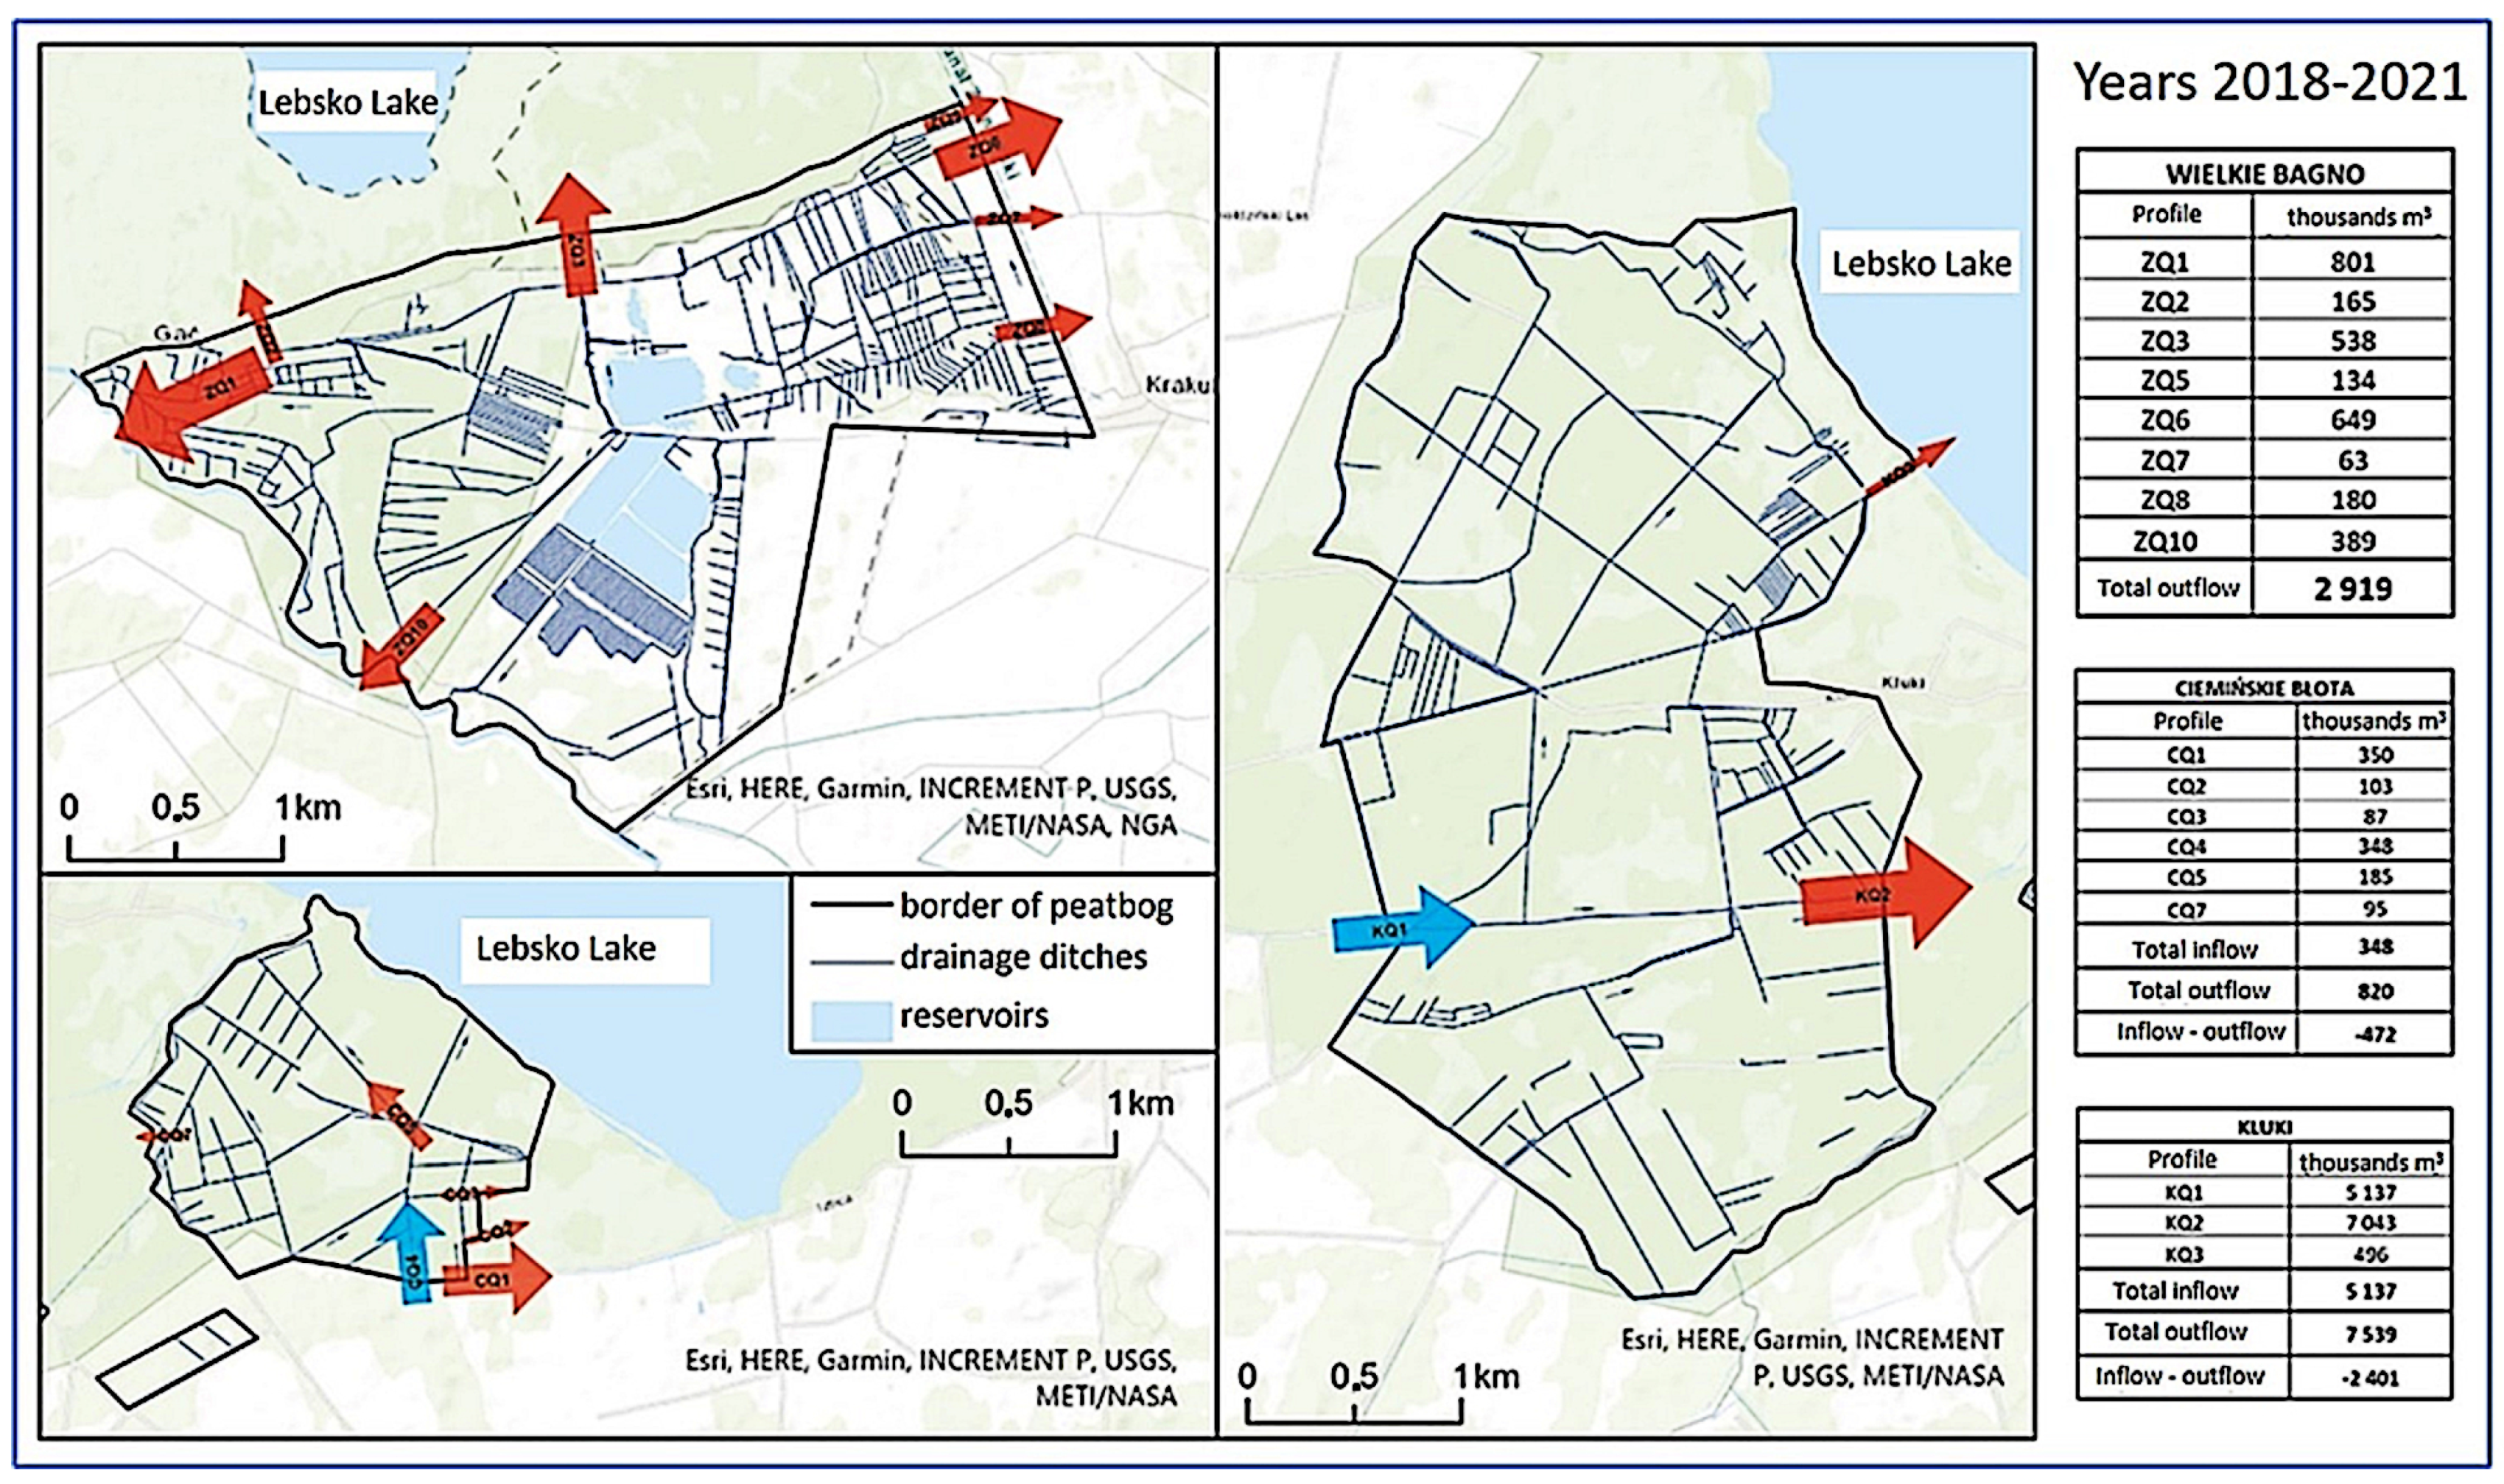
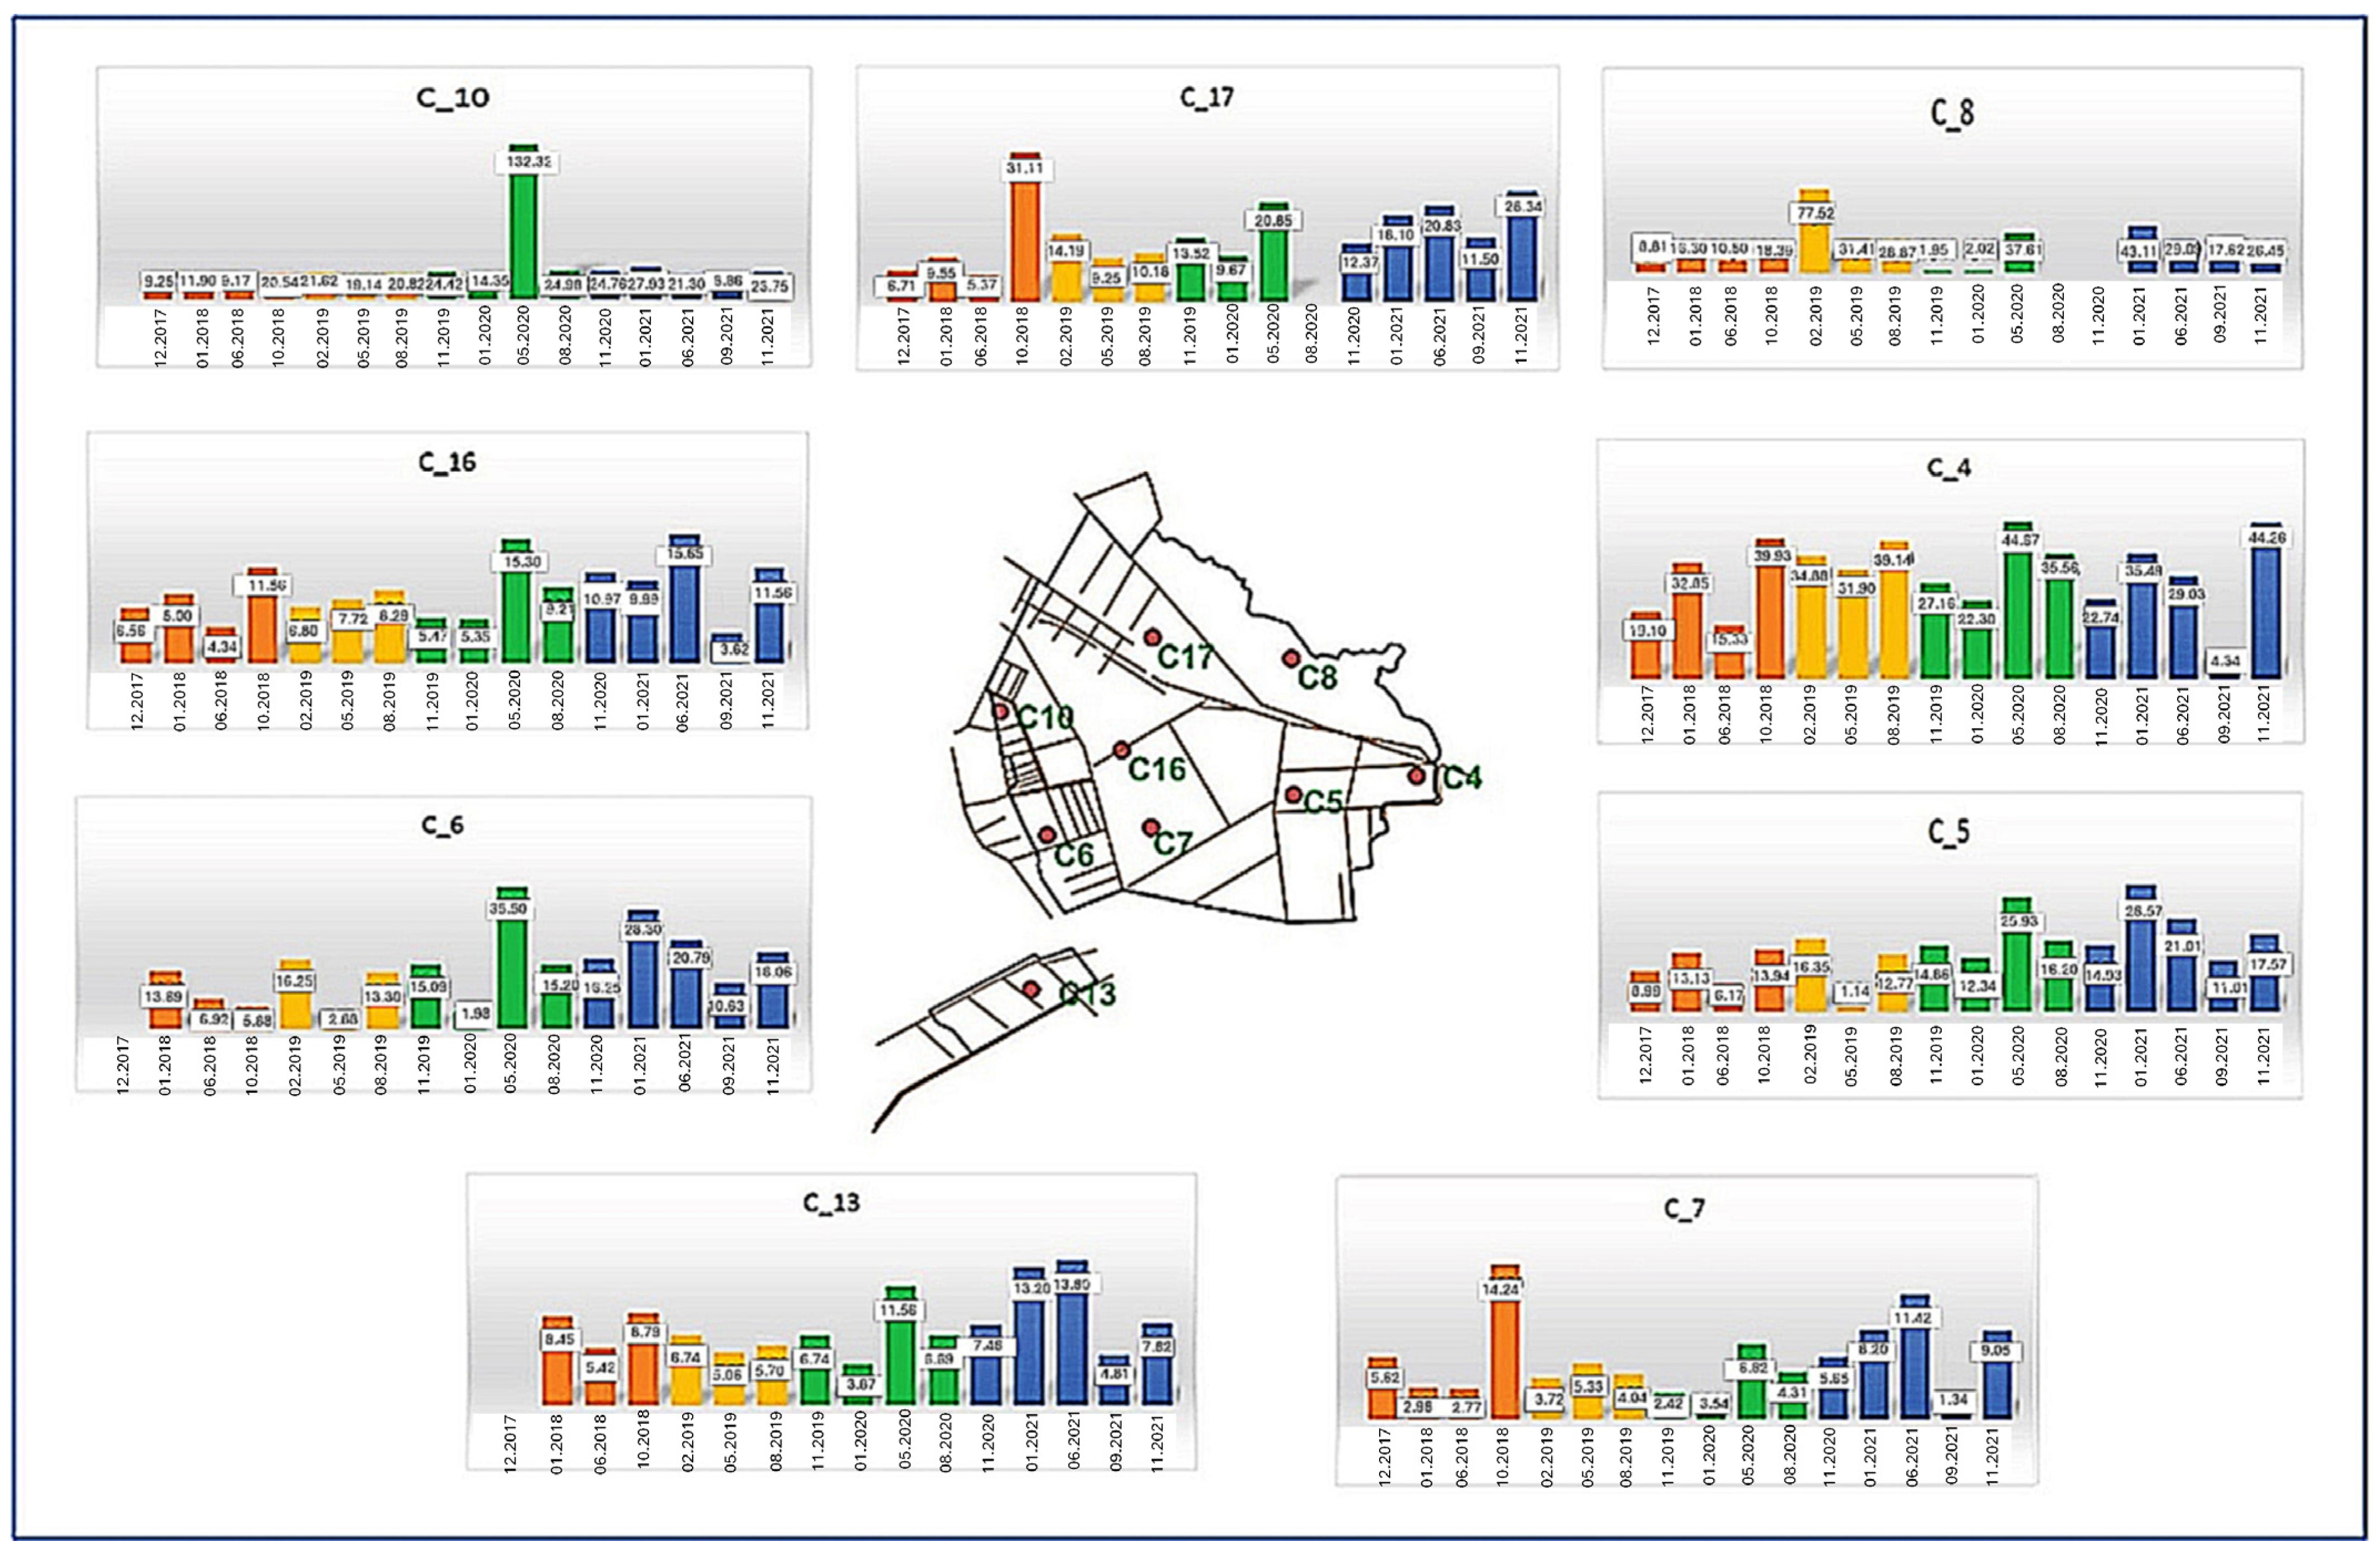
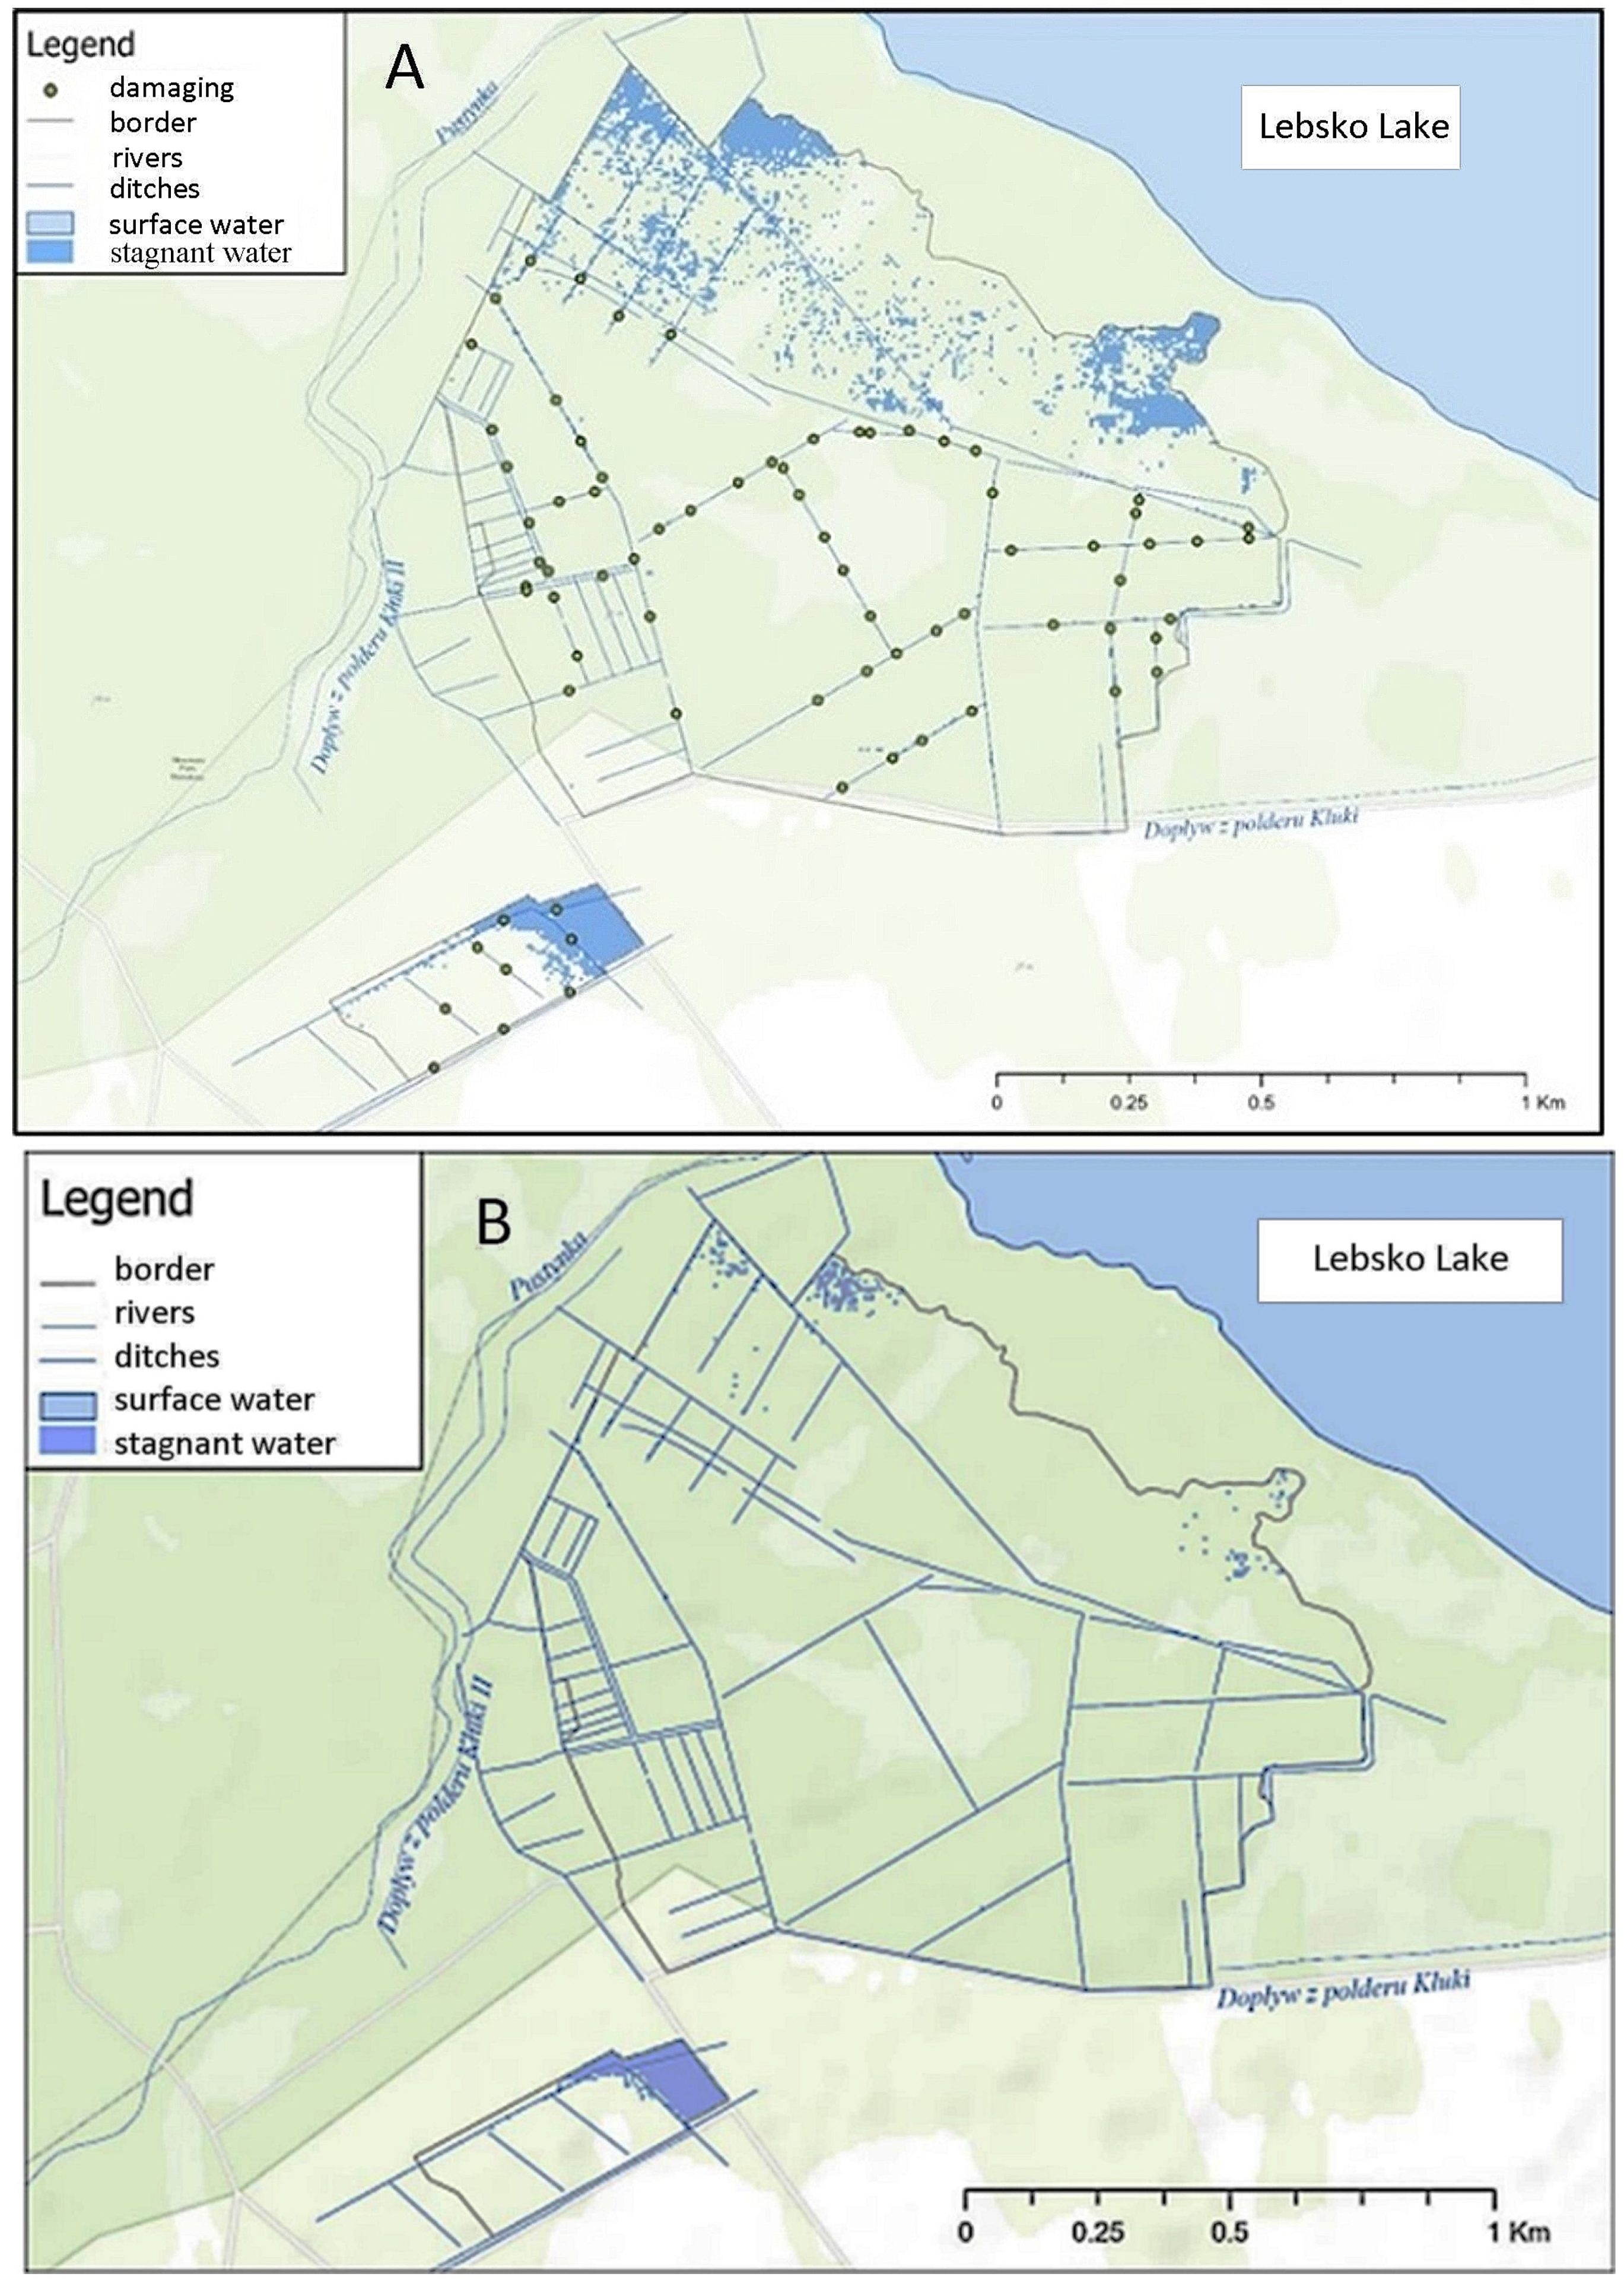
| GEST-Type | Kluki Area [ha] | Ciemińskie Błoto Area [ha] | Wielkie Błoto Area [ha] |
|---|---|---|---|
| Moderately Moist (Forb) Meadow | 14.29 | 1.08 | 6.80 |
| Moderately Moist/Dry Bog Heath | - | - | 8.63 |
| Moist Bog Heath | 0.43 | - | 0.03 |
| Bare Peat (Wet) | - | - | 1.71 |
| Bare Peat (Moist) | - | - | 0.57 |
| Very Moist Bog Heath | - | 1.21 | 12.95 |
| Very Moist Peat Moss Lawn | 1.36 | 5.61 | 23.02 |
| Wet Tall Sedges Reeds | - | 3.47 | 0.55 |
| Wet Small Sedges Reeds mostly with Moss Layer | 0.01 | 1.68 | 1.93 |
| Wet Tall Reeds | - | - | 0.04 |
| Wet Peat Moss Lawn | - | - | 0.67 |
| Peat Moss Lawn on Former Peat-Cut-Off Areas | 14.91/0.75 | 2.36 | 86.46 |
| Wet Peat Moss Lawn with Pine Trees | - | - | 14.07 |
| Wet Peat Moss Hollows resp. Flooded Peat Moss Lawn | - | - | 0.25 |
| Open Water/Ditches | 1.11 | - | 21.38 |
| Dry Oligotrophic Forests and Shrubberies | 9.82 | - | 4.95 |
| Moderately Moist Oligotrophic Forests and Shrubberies | 432.63 | 80.37 | 265.90 |
| Moist Oligotrophic Forests and Shrubberies | 29.93/0.75 | 23.34 | 98.59 |
| Very Moist Oligotrophic Forests and Shrubberies | 1.5 | 7.48 | 0.55 |
| Moderately Moist Mesotrophic/Eutrophic Forests and Shrubberies | 432.63 | - | - |
| Very Moist Mesotrophic/Eutrophic Forests and Shrubberies | 1.5 | 7.48 | - |
| Wet Mesotrophic/Eutrophic Forests and Shrubberies | - | 36.77 | - |
Table 2.
Summary of estimated greenhouse gas emissions given using the GEST method for both scenarios and their potential for reduction (all emissions given as CO2/ha/year) [37].
Table 2.
Summary of estimated greenhouse gas emissions given using the GEST method for both scenarios and their potential for reduction (all emissions given as CO2/ha/year) [37].
| GEST-Type | CO2 | CH4 | CO2 | CH4 | ||||
|---|---|---|---|---|---|---|---|---|
| Without Woods | With Woods | |||||||
| Base | Post | Base | Post | Base | Post | Base | Post | |
| Open Peatbogs | ||||||||
| Moderately Moist (Forb) Meadows | 443.40 | 104.40 | 0.00 | 0.00 | 443.40 | 104.40 | 0.00 | 0.00 |
| Peat Moss Lawn on former Peat-Cut-Off Areas | 159.9 | 210.90 | 38.53 | 50.81 | 159.90 | 210.90 | 38.53 | 50.81 |
| Very Moist Peat Moss Lawn | −32.8 | −45.10 | 103.29 | 141.95 | −32.80 | −45.10 | 103.29 | 141.95 |
| Very Moist Bog Heath | 25.3 | 1.80 | 64.66 | 12.32 | 25.30 | 1.80 | 64.66 | 12.32 |
| Wet Small Sedges Reeds Mostly with Moss Layer | −12.70 | −8.20 | 24.59 | 15.90 | −12.70 | −8.20 | 24.59 | 15.90 |
| Wet Tall Sedges Reeds | −0.40 | −0.50 | 34.18 | 36.22 | −0.40 | −0.50 | 34.18 | 36.22 |
| Moist Bog Heath | 4.34 | 4.04 | 0.00 | 0.00 | 4.34 | 4.04 | 0.00 | 0.00 |
| Open Water/Ditches | N/D | N/D | 63.73 | 79.82 | N/D | N/D | 63.73 | 79.82 |
| Moderately Moist Bog Heath | N/D | - | N/D | - | N/D | - | N/D | - |
| Wet Peat Moss Lawn with Pine Trees | 54.20 | - | 3.10 | - | 54.20 | - | 3.10 | - |
| Wet Peat Moss Lawn | −0.40 | −17.4 | 0.17 | 8.11 | −0.40 | −17.40 | 0.17 | 8.11 |
| Bare Peat (Moist | 3.50 | - | −0.01 | - | 3.50 | - | −0.01 | - |
| Bare Peat (Wet) | 2.50 | - | 0.14 | - | 2.50 | - | 0.14 | - |
| Wet Peat Moss Hollows resp. Flooded Peat Moss Lawn | −0.80 | −0.80 | 3.01 | 3.01 | −0.80 | −0.80 | 3.01 | 3.01 |
| Wet Tall Reeds | −0.10 | −0.10 | 0.25 | 0.25 | −0.10 | −0.10 | 0.25 | 0.25 |
| Moist Reeds and Meadows | - | 26.0 | - | 42.28 | - | 26.0 | - | 42.28 |
| Forested Peatbogs | ||||||||
| Moderately Moist Forests and Shrubberies | 15,578 | 12,081.00 | 0.00 | 0.00 | 1555.20 | 12,008.40 | 0.00 | 0.00 |
| Moist Forests and Shrubberies | 701.2 | 1199.80 | 1143.51 | 1956.85 | 689.80 | 1190.40 | 1143.51 | 1956.85 |
| Very Moist Forests and Shrubberies | 16.20 | 100.40 | 28.59 | 177.54 | 16.00 | 100.30 | 28.51 | 177.54 |
| Wet Forests and Shrubberies | 129.70 | −129.70 | 249.83 | 249.83 | −131.00 | −131.00 | 249.83 | 249.83 |
| Moderately Dry Forests and Shrubberies | 384.30 | 370.60 | 0.00 | 0.00 | 382.40 | 369.00 | 0.00 | 0.00 |
| Reduction Potentials | −3298.80 | +1017.32 | −3296.20 | +1017.32 | ||||
Note: N/D—no data.
Table 3.
Comparison of CO2 emission values and carbon accumulation from selected raised peatbogs in Europe.
Table 3.
Comparison of CO2 emission values and carbon accumulation from selected raised peatbogs in Europe.
| Peatbog/Country | Results |
|---|---|
| Black swamp raised peatbog/Poland [96] | CO2 emission: 0.5 Mg·ha−1·year−1 |
| Raised peatbog where natural regeneration of peatbog vegetation has occurred/Poland [97] | C accumulation: 0.9 Mg·ha−1·year−1 |
| Raised peatbog in Noteć River Valley/Poland [98] | CO2 emission: 11.9 Mg·ha−1 |
| Raised peatbog after peat extraction/Poland [99] | CO2 emission: 19.7 Mg·h−1·year−1 |
| Raised peatbog/Ireland [100] | CO2 emission: 137 ± 24 g·m−2·year−1 |
| Blanked bog (1) and a high re-wetted peatbog (2)/Ireland [101] | 1. CO2 emission: 131 ± 298.3 g·m−2·year−1 |
| 2. CO2 emission: 585.3 ± 241.5 g·m−2·year−1 | |
| Atlantic type raised peatbog/Ireland [102] | CO2 emission: 220.8 g·m−2 to 244.8 g·m−2 |
| Re-wetted peatbog (1) and drained peatbog (2)/Ireland [103] | 1. C accumulation: 78.0 ± 37.6 g·m−2·year−1 2. CO2 emission: 157 ± 25.5 g·m−2·year−1 |
| Degraded peatbog (1) and natural peatbog (2)/Germany [104] | 1. CO2 emission: 470 ± 247 g·m−2·year−1 2. C accumulation: −68 ± 104 g·m−2·year−1 |
| Drained peatbog/Estonia [105] | Emission 0 to 138 mg·m−2·h−1 |
| Soils under barley had higher (1) and soils under grass (2)/Finland [106] | 1. CO2 emission: 830 g·m−2·year−1 2. CO2 emission: 395 g m−2·year−1 |
| Catchment/Great Britain [107] | CO2 emission: 0.56 t·km−2·year−1 |
Disclaimer/Publisher’s Note: The statements, opinions and data contained in all publications are solely those of the individual author(s) and contributor(s) and not of MDPI and/or the editor(s). MDPI and/or the editor(s) disclaim responsibility for any injury to people or property resulting from any ideas, methods, instructions or products referred to in the content. |
© 2024 by the authors. Licensee MDPI, Basel, Switzerland. This article is an open access article distributed under the terms and conditions of the Creative Commons Attribution (CC BY) license (https://creativecommons.org/licenses/by/4.0/).
Share and Cite
MDPI and ACS Style
Cieśliński, R.; Kubiak-Wójcicka, K. Use of the Gas Emission Site Type Method in the Evaluation of the CO2 Emissions in Raised Bogs. Water 2024, 16, 1069. https://doi.org/10.3390/w16071069
AMA Style
Cieśliński R, Kubiak-Wójcicka K. Use of the Gas Emission Site Type Method in the Evaluation of the CO2 Emissions in Raised Bogs. Water. 2024; 16(7):1069. https://doi.org/10.3390/w16071069
Chicago/Turabian StyleCieśliński, Roman, and Katarzyna Kubiak-Wójcicka. 2024. "Use of the Gas Emission Site Type Method in the Evaluation of the CO2 Emissions in Raised Bogs" Water 16, no. 7: 1069. https://doi.org/10.3390/w16071069
Note that from the first issue of 2016, this journal uses article numbers instead of page numbers. See further details here.