Abstract
As an important hydrological ecosystem component, the glacier basin has great significance for climate and environment, and it is also linked to regional water sustainability. In this paper, the sampling and isotope analysis of glacial ice, ice-melt water, river water (river midstream and river downstream), groundwater (spring), and precipitation were carried out in a hydrological year of the Mingyong Glacier basin, which is located at the Meili Snow Mountains, Southeastern Tibetan Plateau. At the same time, the hydrograph separation of the recharge sources of the lower mountain pass is studied. The results show that the range of δD, δ18O, and d-excess (deuterium excess) in natural water bodies are significantly different, and the precipitation is the most obvious. The high values of δD and δ18O in the water samples all appeared in spring and summer, and the low values appeared in autumn and winter, while glacial ice showed opposite trends. Meanwhile, the local meteoric water line (LMWL) of the Mingyong Glacier basin is δD = 8.04δ18O + 13.06. The End-Member Mixing Analysis (EMMA) was adopted to determine the sources proportion of river water (river downstream) according to the δD, δ18O, and d-excess ratio relationships. The results showed that the proportion of ice-melt water, groundwater, and precipitation in the ablation period was 80.6%, 17.2%, and 2.2% as well as 19.2%, 73.1%, and 7.7% in the accumulation period, respectively. Ice-melt water has a higher conversion recharge rate to groundwater and indirectly recharges river water, especially in nonmonsoon seasons. In other words, the main recharge source of river water in the lower reaches of the Mingyong Glacier basin during the ablation period is ice-melt water. In the accumulation period, the main recharge source of river water in the lower reaches of the Mingyong Glacier basin is groundwater, while nearly half of the recharge of groundwater comes from ice-melt water. Therefore, regardless of the ablation period or the accumulation period, ice-melt water is sustainable and important to this region.
1. Introduction
The Sixth Assessment Report of IPCC indicates that the continuous rise of global temperature will accelerate the renewal rate of the earth’s water cycle, the instability of precipitation in the globally affected monsoon climate regions will be greatly increased, and the intensity of drought and flood events will be increased [1]. Global warming reduces the extent of snow cover and ice, and the global average sea level rises. Precipitation has increased globally in the middle and high latitudes, while precipitation uncertainty has also increased in some regions [2]. Under the background of increasing climate change in the future, the interaction and relationship between multiple types of droughts will become more complex, and the resulting enhanced instability and complexity of global climate system will further affect the water cycle process [3].
Being the link between atmospheric precipitation, surface water, groundwater, and ecological water, the change of water cycle profoundly affects the structure and evolution of global water resources and ecological environment system. The interaction between the water cycle and the atmosphere of the spatial-temporal scale evolution affects the community development and production activities [4]. The terrestrial water cycle is particularly responsive to climate change [5]. With the intensification of global warming, the study of water cycle has become an important part of the feedback chain of ecological environment. The land water cycle is a giant system with complex mechanisms, which has a wide range of development and evolution processes [6]. The climate system is a nonlinear system, which is affected by other subsystems at the same time, thus forming its important evolutionary process. Climate change and water cycle affect the spatial-temporal distribution of water vapor’s transportation and migration through the global scale atmospheric circulation movement of long time series, thus affecting human production and life. Under the intensification of the greenhouse effect the forms of ice caps and glaciers in the Arctic and Antarctic are undergoing drastic phase changes at an extremely fast rate. As a result, the return period of extreme weather events such as sea level rise, droughts, and floods has been shortened. With the deepening of research, people have realized that climate change is affecting the global water resources and that it has a huge impact on ecological and economic and social development and human destiny.
The cryosphere is an important component of the climate system, which consists of continental ice sheets, mountain glaciers, snow, frozen soil, sea ice, river ice, lake ice, and so on [7]. Glaciers, as a vital part of the cryosphere, not only affect the alternating evolution of global glacial periods and interglacial periods, but also play an important role in recording the atmospheric deposition under the background of climate warming [8]. The alpine glacier is one of the important river recharge sources, and plays a crucial role in indicating climate change and water resources distribution in arid areas and even global [9]. The world’s major glacier resources are developed in the Arctic and Antarctic continents and the alpine region, such as the Tibetan Plateau, while the continent internal climate is generally arid. In these arid areas, meltwater from glaciers and snow cover is also used as local agricultural production and living water resources, and its importance is self-evident.
Hydrograph separation is an important method to study the different water component sources and their corresponding proportions in river basins, and it is of great significance for understanding the runoff production process and global climate change in alpine basins [10]. Different water bodies in the water circulation system have their own characteristic isotopic composition due to different origin, that is, the enrichment of different heavy isotopes of hydrogen (D) and oxygen (18O). In nature, the concentrations of deuterium and heavy oxygen are measured as a deviation from the standard, set equal to zero, and estimated as a ratio of (δ) in ‰ [11]. In the meantime, Klaus et al. critically reviewed the contributions to new field knowledge gained by isotope hydrograph separation applications [12]. The isotopic characteristics and hydrograph separation of different water bodies have been studied extensively in China, but there are relatively few studies in the cryosphere. Therefore, the study of hydrograph separation and tracing in glacier basins is of great significance for climate change and hydrological security.
Southwest China is a core region under the dual influence of South Asian/Indian monsoons and East Asian monsoons. The water vapor source of precipitation and its influencing factors are quite complicated. Some empirical studies have been carried out on the water vapor sources and different characteristics of hydrogen and oxygen stable isotopes in the southwest monsoon region, and relatively rich research results have been obtained [13]. The Meili Snow Mountains are located in the Hengduan Mountains, the southeast margin of the Tibetan Plateau, which has the largest topographic fluctuation in China. The vertical climate zone of dry and hot valley in this area develops, with complex ecological conditions and obvious climate spatial differentiation. The study of this region is conducive to revealing the glacier change characteristics and the hydrological cycle significance in the southeast of the Tibetan Plateau. The glacier water resources in the Meili Snow Mountains area will continue to shrink under the background of global warming and the general decrease of precipitation [14]. Compared with other regions of the Asian continent, the elevation change of the glacier surface in the Meili Snow Mountains is the most obvious [15]. The Mingyong River is an important tributary of the upper reaches of Lancang River. The ice-melt water of the Mingyong Glacier in the upper reaches plays an important role in groundwater recharge [16]. At the time of the first glacier inventory, the terminal elevation of the Mingyong Glacier was as low as about 2700 m, which is the lowest glacier in the Hengduan Mountains, and also the largest and longest temperate glacier in Yunnan Province [17]. According to the survey and measurement in July 2022, the glacier retreated strongly with the terminus about 2830 m under the influence of climate warming. It can be seen that the Mingyong Glacier changes in the Meili Snow Mountains have a significant response to climate warming. At present, there are more qualitative descriptions of surface observations and climate changes in this area, but there are relatively few studies on the quantitative characteristics of runoff components in glacier basins in this area. Therefore, it is very important to carry out research on hydrograph separation in this area. At the same time, ice-melt water, as an important climate feature, reflects not only the change of climate characteristics on a single scale, but also the multi-scale environmental coupling effect, and its research significance is even far greater than that of large and medium-sized rivers in common inland basins. So, what are the scientific questions researchers are trying to figure out? (i) Under the background of global warming, how does the content of stable isotopes of hydrogen and oxygen in the natural water body of the Mingyong Glacier basin in the Meili Snow Mountains change? (ii) What is the relationship between the recharge sources of the runoff from the lower reaches of the Mingyong Glacier basin in the Meili Snow Mountains? These questions are worthy of an in-depth study.
2. Study Area
The Meili Snow Mountains (Figure 1) have a location of 98.30°–98.52° E, 28.16°–28.53° N, a north–south transverse length of 30 km, a width of 500 m, and an area of 960 km2. Their main mountain range is located in the northwest of Deqin County, Diqing Tibetan Autonomous Prefecture, Yunnan Province. The main peak, Mount Kawakarpo, with an altitude of 6740 m, is the highest peak in Yunnan Province and is an important part of the Hengduan Mountains on the southeast margin of the Tibetan Plateau. The Meili Snow Mountains are located in the transition zone between the western alpine mountains and the subtropical monsoon regions. Due to the development of vertical climate height difference, the climate characteristics are both continental and subtropical, but the influence of latitude is not obvious in general, and the temperature changes relatively large with the increase of altitude. The climate in this region is inclined to the cold temperate zone and the alpine monsoon climate. From 1993 to 2010, under the influence of global warming, the Mingyong Glacier in the Meili Snow Mountains retreated by about 262.26 m [18].
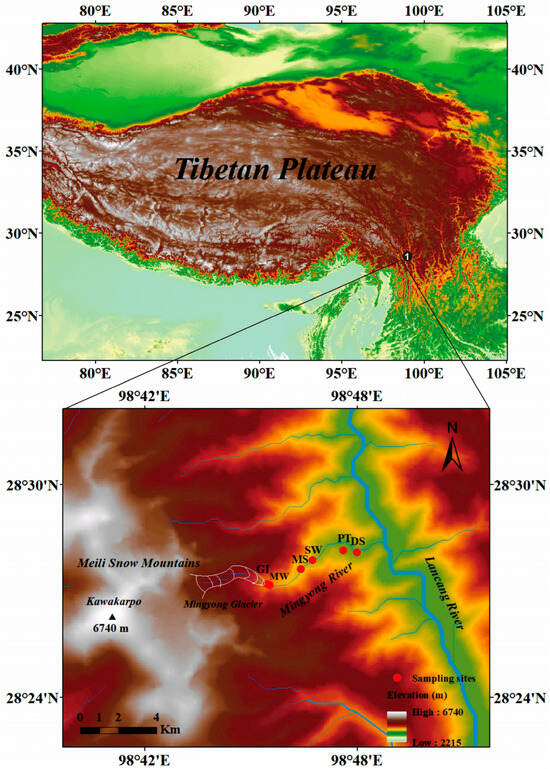
Figure 1.
Location of the sampling sites and the geographical feature of the Mingyong Glacier basin (data from the geospatial data cloud: http://www.gscloud.cn (accessed on 3 August 2023)). The number with black solid circle refers to meteorological station: ❶ = Deqin Meteorological Station. GI (glacial ice); MW (ice-melt water); MS (river midstream); DS (river downstream); SW (spring water); PT (precipitation).
The Meili Snow Mountains are one of the most biodiversity-rich mountain ranges in Yunnan and China, and temperate regions of the world, and it is one of the key biodiversity reserves in China [19]. In the 1990s, when a joint Chinese and Japanese mountaineering team was climbing Kawakarpo, the highest peak of the Meili Snow Mountains, 17 members of the team were killed in an avalanche halfway up the mountain. Local authorities have since banned climbing this mountain. The most recent avalanche occurred in 2019, and the phenological camera near the end of the Mingyong Glacier captured another avalanche event near the Mingyong Glacier in the Meili Snow Mountains, which showed instability of the structure and avalanche accumulation of the temperate glacier [20].
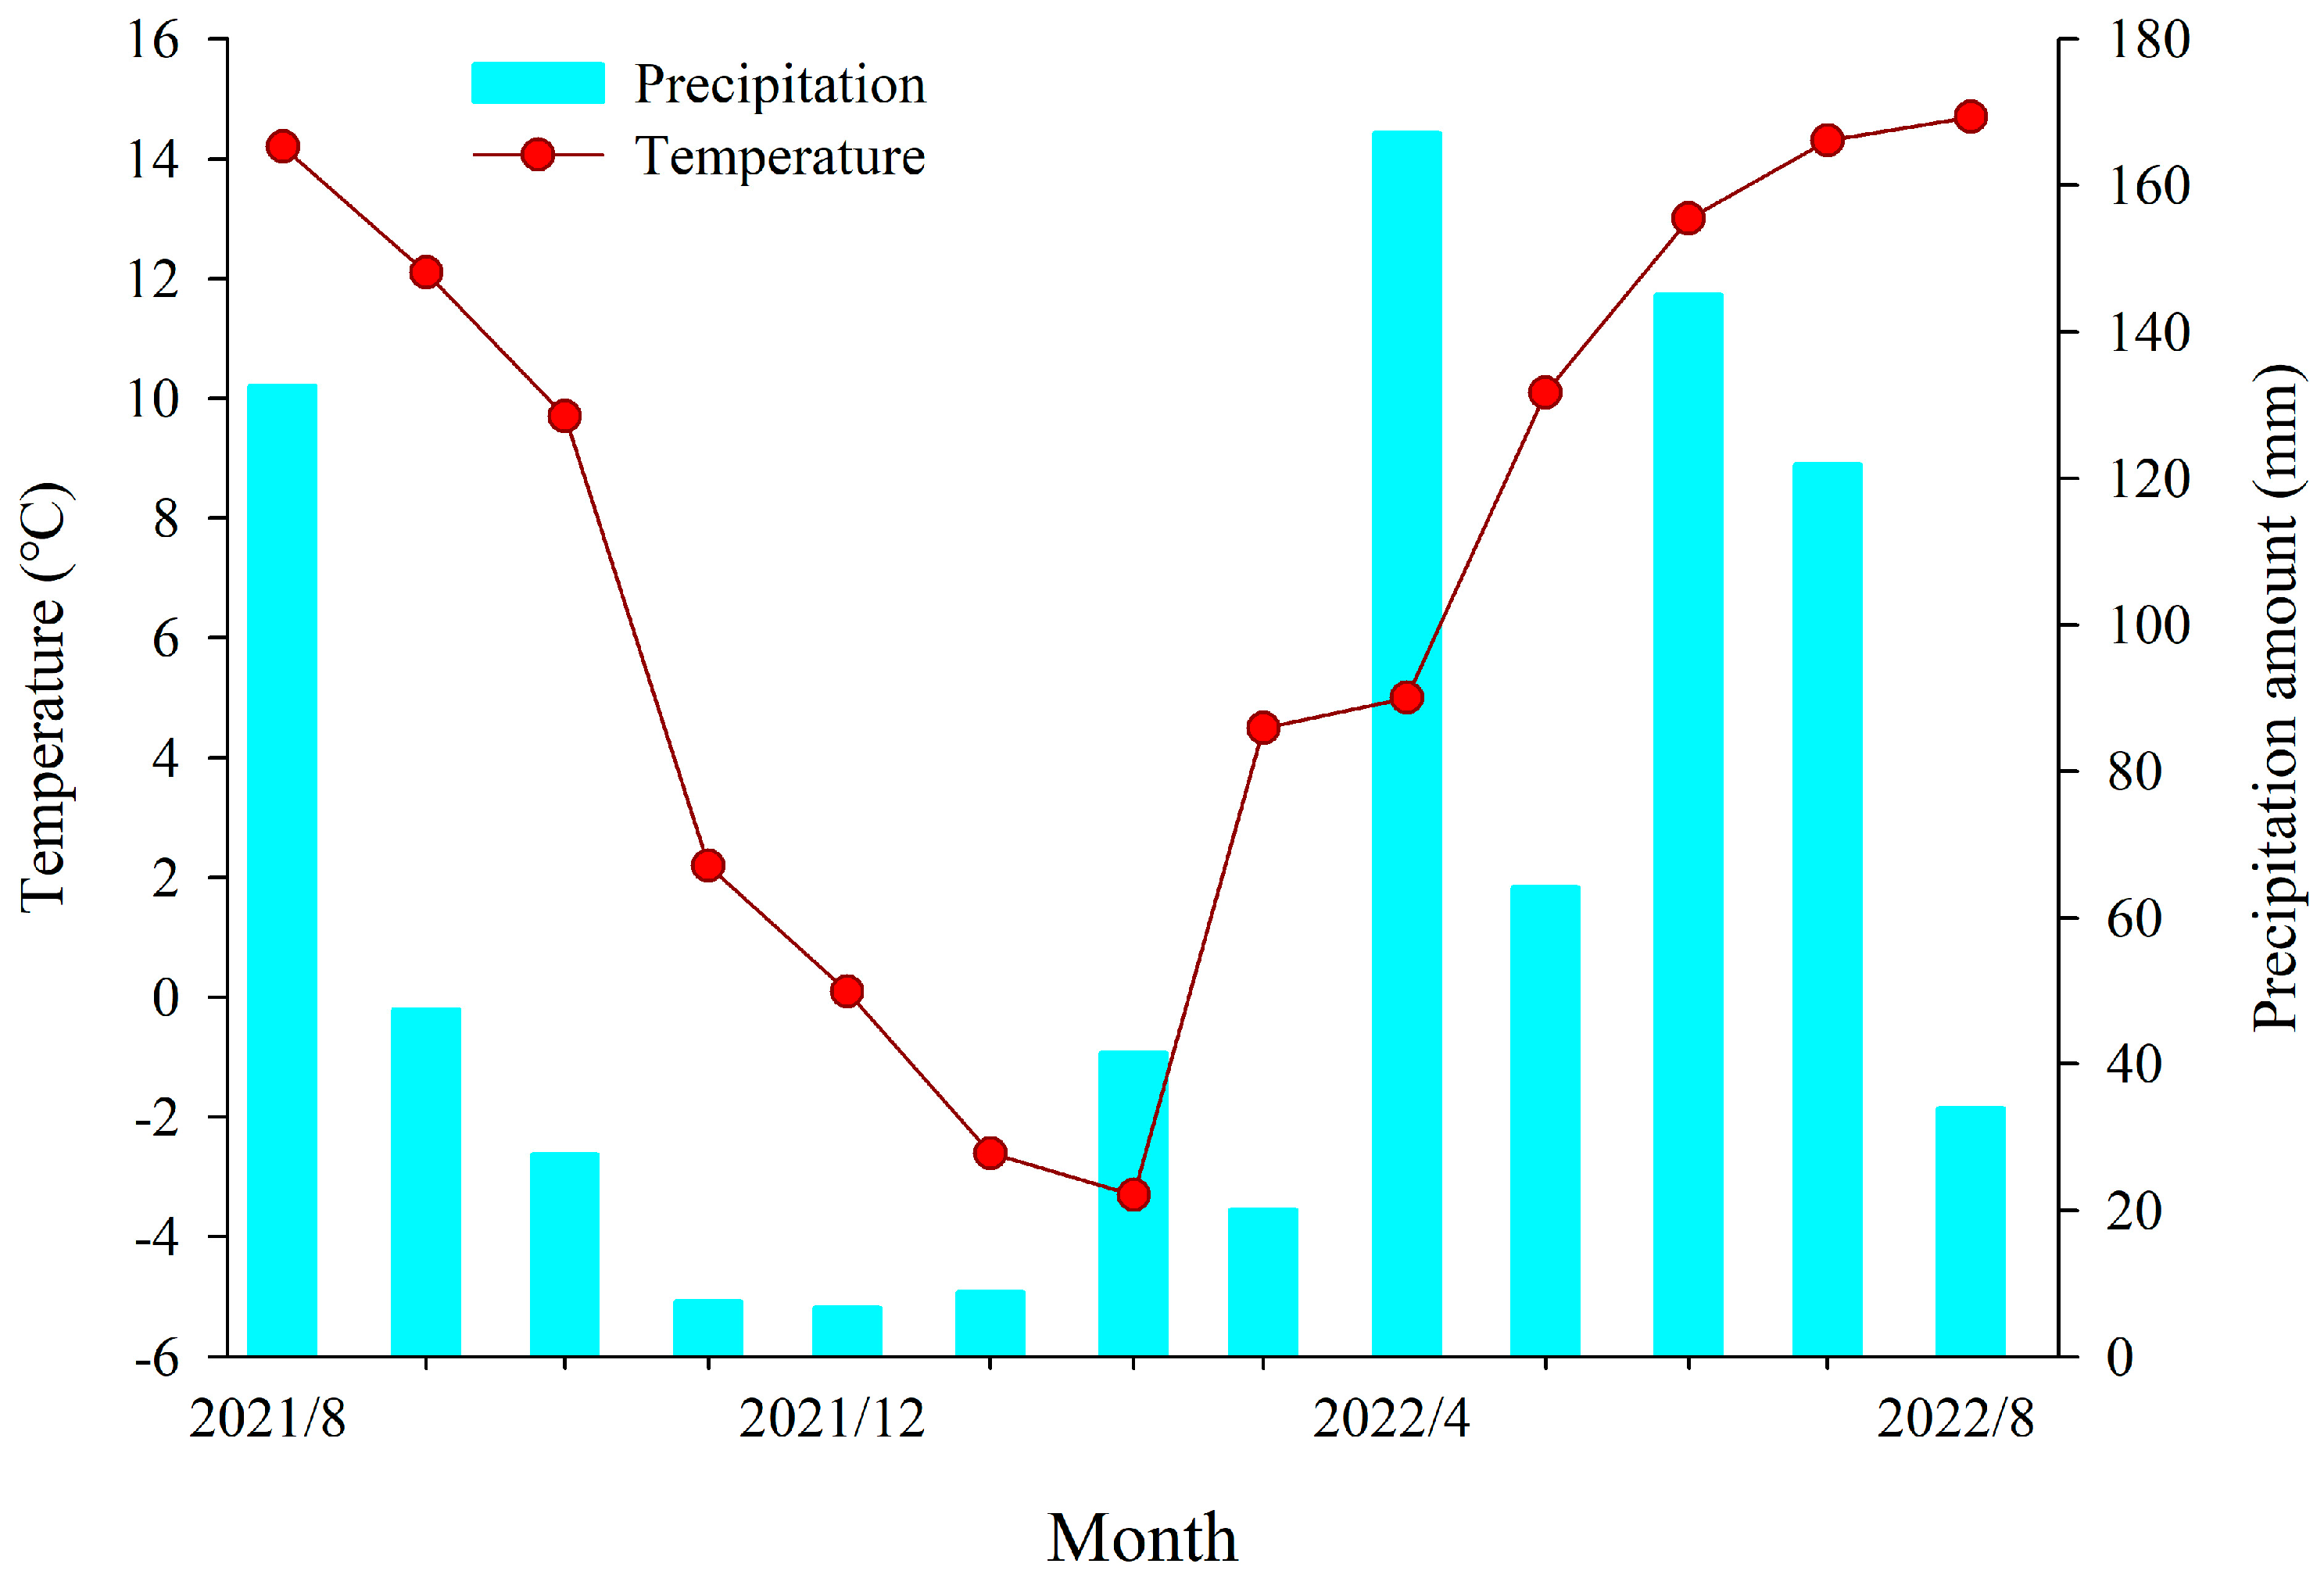
The Mingyong Glacier (98.46° E, 28.27 ° N) originates from the Meili Snow Mountains and is one of the lowest glaciers in the Hengduan Mountains, Southeastern Tibetan Plateau. The Mingyong Glacier is a rare low-latitude and low-altitude temperate glacier in the world. It has a length of 11.7 km, with an average width of 500 m, covering an area of 13 km2, annual melting water of 232 million cubic meters, and is the headwater of the Mingyong River, a tributary of Lancang River. The Mingyong Glacier moves very fast, and it is the fastest glacier in the Hengduan Mountains [21]. The scope of the Mingyong Glacier basin is shown in Figure 2. However, now, under the influence of climate warming, the ice tongue area of the Mingyong Glacier is constantly retreating. As this area belongs to the alpine climate, the temperature here is low throughout the year (Figure 3). The dry and wet seasons are distinct here and the vertical climate changes significantly.
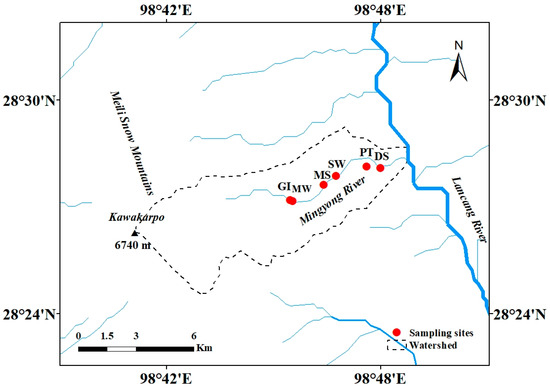
Figure 2.
The Mingyong Glacier basin (data from the geospatial data cloud: http://www.gscloud.cn (accessed on 3 August 2023)).
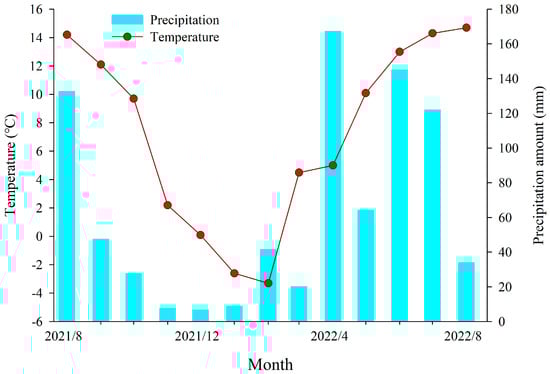
Figure 3.
The monthly precipitation amount and mean temperature in Deqin Meteorological Station (data from the China National Meteorological Sciences Data Center: http://data.cma.cn (accessed on 18 October 2023)).
3. Data Sources and Methods
3.1. Field Sampling
Based on investigations and early research results of the Mingyong Glacier, factors such as surface topography, rock, soil, and vegetation distribution of the glacier were comprehensively considered, and reasonable monitoring and sampling points were constructed in the Mingyong Glacier basin. Glacial ice was collected at the ablation zone of the Mingyong Glacier (near the GI point in Figure 1, latitude and longitude: 28.45° N, 98.76° E, altitude: 2840 m); ice-melt water was collected from non-glacial areas (near the MW point in Figure 1, latitude and longitude: 28.45° N, 98.76° E, altitude: 2821 m); river water (river midstream) was collected in the middle reaches of the Mingyong River (near the MS point in Figure 1, latitude and longitude: 28.46° N, 98.77° E, altitude: 2556 m); river water (river downstream) was collected in the lower reaches of the Mingyong River (near the DS point in Figure 1, latitude and longitude: 28.46° N, 98.80° E, altitude: 2245 m); groundwater was collected at the underground spring in the middle reaches of the Mingyong River (near the SW point in Figure 1, latitude and longitude: 28.46° N, 98.78° E, altitude: 2443 m); precipitation was collected at Mingyong Village (near the PT point in Figure 1, latitude and longitude: 28.47° N, 98.79° E, altitude: 2323 m, fixed sampling point). The precipitation collector was placed on the roof of 4 m by using the rain measuring cylinder. After collecting the precipitation, it was placed into the sampling bottle immediately for sealing. Precipitation collector collects both liquid and solid precipitation. After collecting the solid sample (snow and hail), it was melted at room temperature in a self-sealing low-density polyethylene bag and then sealed into a high-density polyethylene bottle. Precipitation events encountered in the usual sampling process were collected in the basin in real time. At the same time, hand-held GPS positioning of each sampling point was carried out to accurately determine the longitude and latitude position and elevation of each sampling point. All sampling bottles were made of sterile polyethylene plastic bottles. If non-sterile sampling bottles are used, the polyethylene bottles should be soaked in deionized water in the laboratory in advance. During the sampling process, the polyethylene bottles were cleaned with natural water 3–5 times before water samples were taken. All liquid natural water bodies (ice-melt water, precipitation, groundwater, river water, and so on) were collected with a 60-mL narrow-mouth sampling bottle, and solid natural water bodies such as glacial ice or snow were collected with a 500-mL wide-mouth sampling bottle. Two bottles of the same type of sample were collected, one for the determination of hydrogen and oxygen stable isotopes and other parameters and one for reserve. When sampling river water, the sampling bottle is as deep as possible into the water body to ensure that the river water body is fully mixed and to avoid the water surface evaporation caused by isotope fractionation. The collected samples were frozen in time and sent for testing and analysis. In this study, continuous sampling was conducted over a hydrological year, from 7 August 2021 to 7 August 2022. A total of 244 samples were finally obtained, including 25 glacial ice samples, 45 ice-melt water samples, 54 river water samples in the middle reaches of the Mingyong River, 55 river water samples in the lower reaches of the Mingyong River, 54 groundwater samples, and 11 precipitation samples (of which 1 sample was the precipitation sample at the end of the Mingyong Glacier, and the rest comprised the precipitation sample at Mingyong Village), as shown in Table 1. The sampling site in this study was based on convention, and the reason why glacial ice was taken from the solid area at the end of the ice tongue was for safety considerations and easy access. Ice-melt water was obtained from the melting parts of the ice tongue. The sampling site of river water (river midstream) was set according to the midstream position. The same was true with regard to river water (river downstream) sampling. Due to sampling conditions and financial constraints, it was not possible to drill deeper wells for groundwater, so the sampling site of groundwater was set up at the location of natural gusher flows between the middle and lower reaches. Moreover, the precipitation sampling site was set up in the Mingyong Village due to its limited sampling conditions. The above settings of sampling sites were considered reasonable by researchers. The data of the Deqin Meteorological Station are from the National Meteorological Science Data Center of China: http://data.cma.cn.

Table 1.
Water Isotopes in the Mingyong Glacier basin.
3.2. Sample Analysis
The samples were mailed to the State Key Laboratory of Cryospheric Science, Northwest Institute of Eco-Environment and Resources, Chinese Academy of Sciences, for testing and analysis. The State Key Laboratory of Cryospheric Science is based on the Cold and Arid Regions Environmental and Engineering Research Institute of the Chinese Academy of Sciences. It was 1 of the 27 state key laboratories approved by the Ministry of Science and Technology in 2007. Therefore, the experimental test and analysis in the State Key Laboratory of Cryospheric Science can ensure the accuracy and scientific results in time. The isotope analysis instrument used was the DLT-100 liquid water isotope analyzer produced by LGR Company in the United States, with a test accuracy of D/H < 0.60‰ and 18O/16O < 0.20‰. The DLT-100 liquid water isotope analyzer is a commonly used instrument for liquid water isotope analysis, so it was chosen. Among them, there are 4 LGR standard samples according to the Vienna Standard Mean Ocean Water, which are LGR1 (δD = −154.48‰, δ18O = −19.68‰), LGR2 (δD = −117.15‰, δ18O = −15.60‰), LGR3E (δD = −79.24‰, δ18O = −10.93‰), and LGR4A (δD = −51.21‰, δ18O = −7.76‰). The significant digit of the measured data conforms to the significant digit rule of the stable isotope analysis results, and the test values used in the final calculation were proofread. The ratio of δD and δ18O is expressed as the thousandth difference with respect to the Vienna Standard Mean Ocean Water (V-SMOW) and is calculated as follows, where the mean analytical error of δ18O is ±0.1‰ and the mean analytical error of δD is ±0.5‰. The results were linearly corrected and time-corrected using two international standards, V-SMOW and GISP or SLAP, and one laboratory work standard. The final results were expressed as V-SMOW. Typically, the delta value is less than −100, which means that the heavy isotope of the sample being measured is more depleted. On the contrary, the more positive the measured value, the more enriched the heavy isotope. The expression formula is as follows:
3.3. Research Method
The End-Member Mixing Analysis (EMMA), proposed by Christophersen et al. [22], is a common method used to determine the proportion of component sources in each water body. The method is based on the law of conservation of mass. Similarly, according to convention, the composition of the water body is generally ice-melt water, groundwater, and precipitation. Therefore, these three subjects are taken as research objects. In this study, the three end-member mixing model (also known as the three-source isotope hydrograph separation model) was used to calculate the composition ratio of ice-melt water, precipitation, and groundwater in the runoff of the lower reaches of the Mingyong River. Deuterium excess (d-excess) was proposed by Dansgaard, whose expression equation is d-excess = δD − 8δ18O [23]. There are significant spatiotemporal differences in d-excess and δ18O concentrations in different water bodies [16]. Therefore, the two can be used as tracers to separate the isotope runoff of three water sources, and the basic equation is as follows:
Qt = Qg + Qp + Qi
Qtδt = Qgδg + Qpδp + Qiδi
QtCt = QgCg + QpCp + QiCi
Groundwater is the first end member; precipitation is the second end member; ice-melt water is the third end member; δ and C are two different tracers; t is the runoff water body; and Qg, Qp, and Qi are the end members of groundwater, precipitation, and ice-melt water recharge sources, respectively. Qg, Qp, and Qi can be calculated with the following formula:
4. Results
4.1. Variation Characteristics of Stable Isotopes for Different Water Bodies
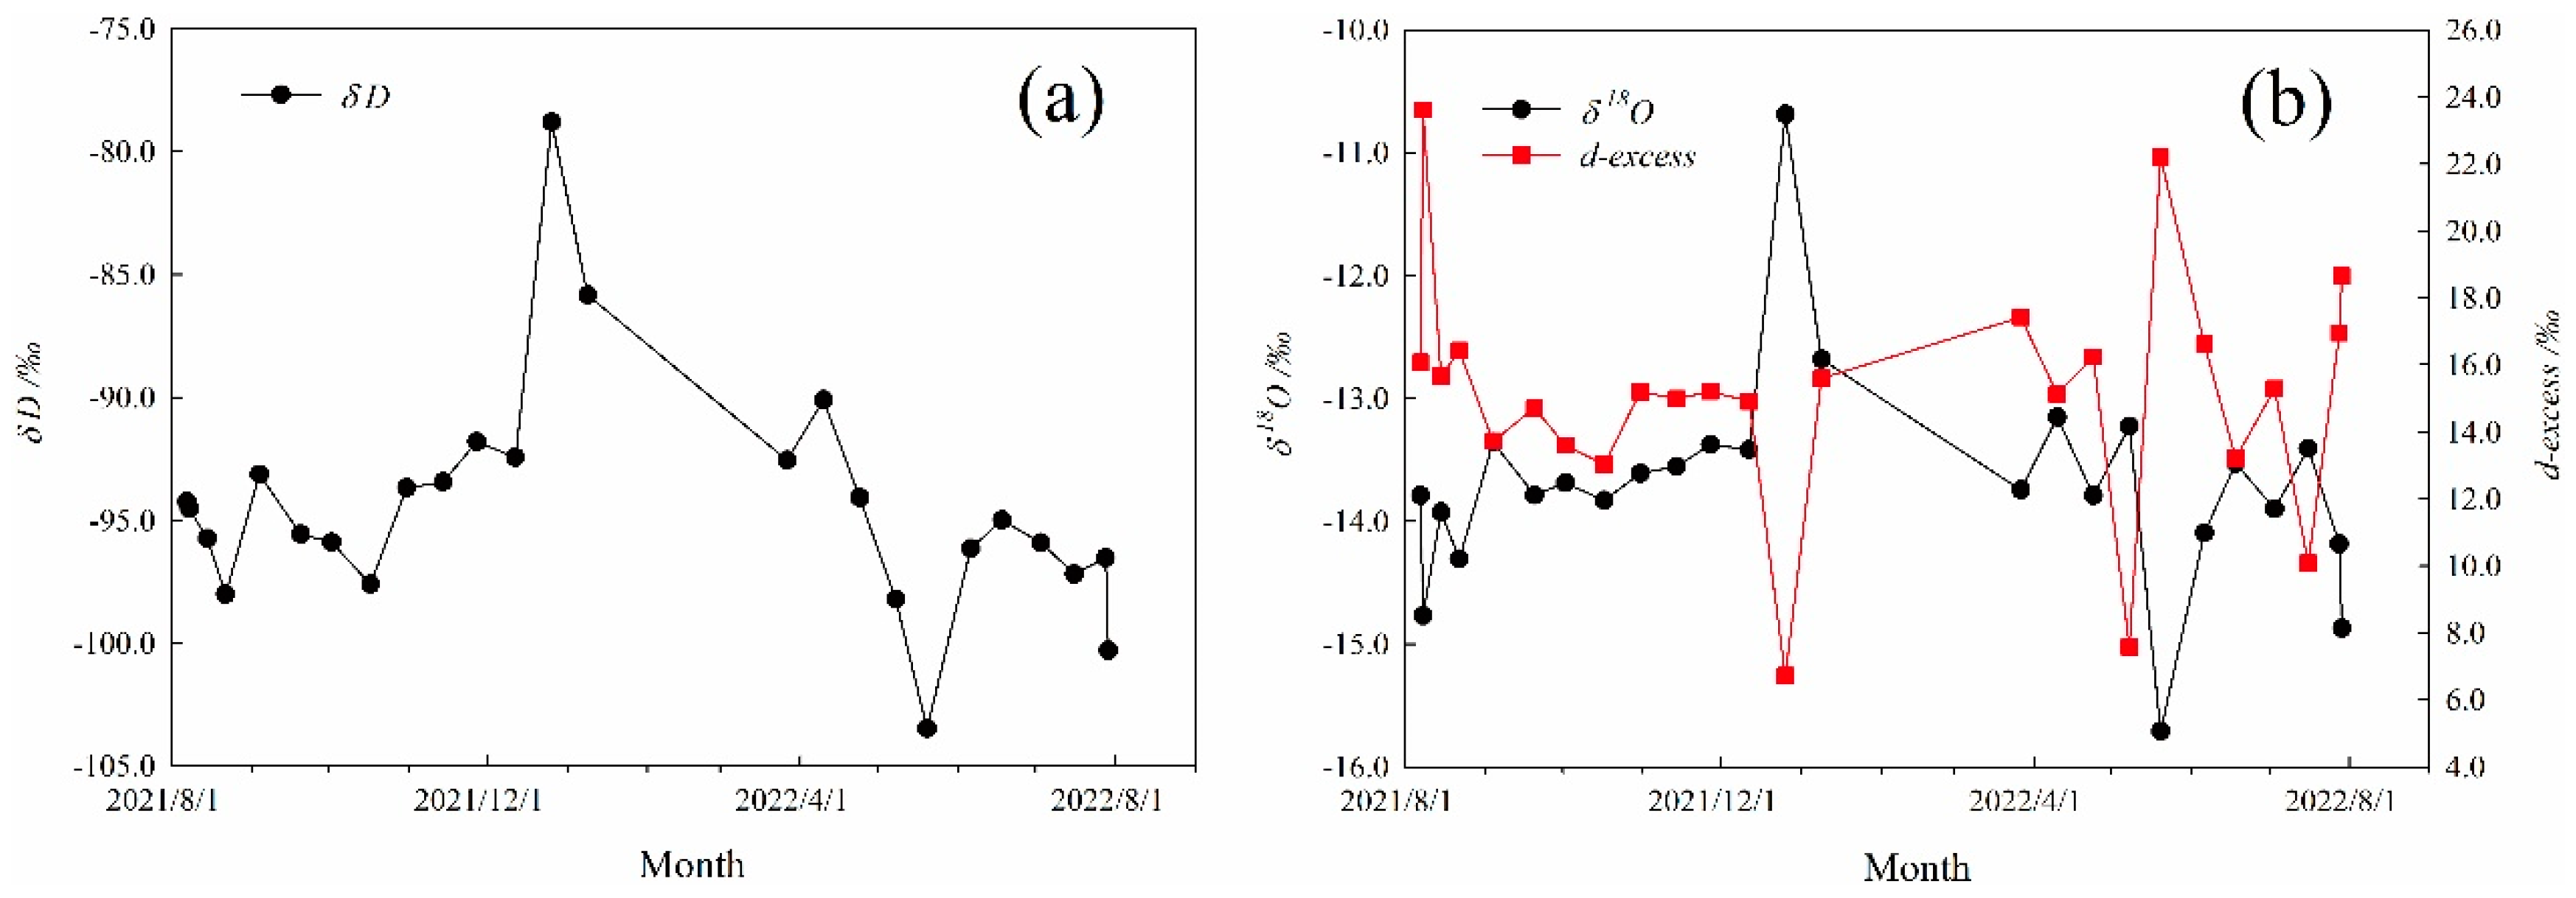
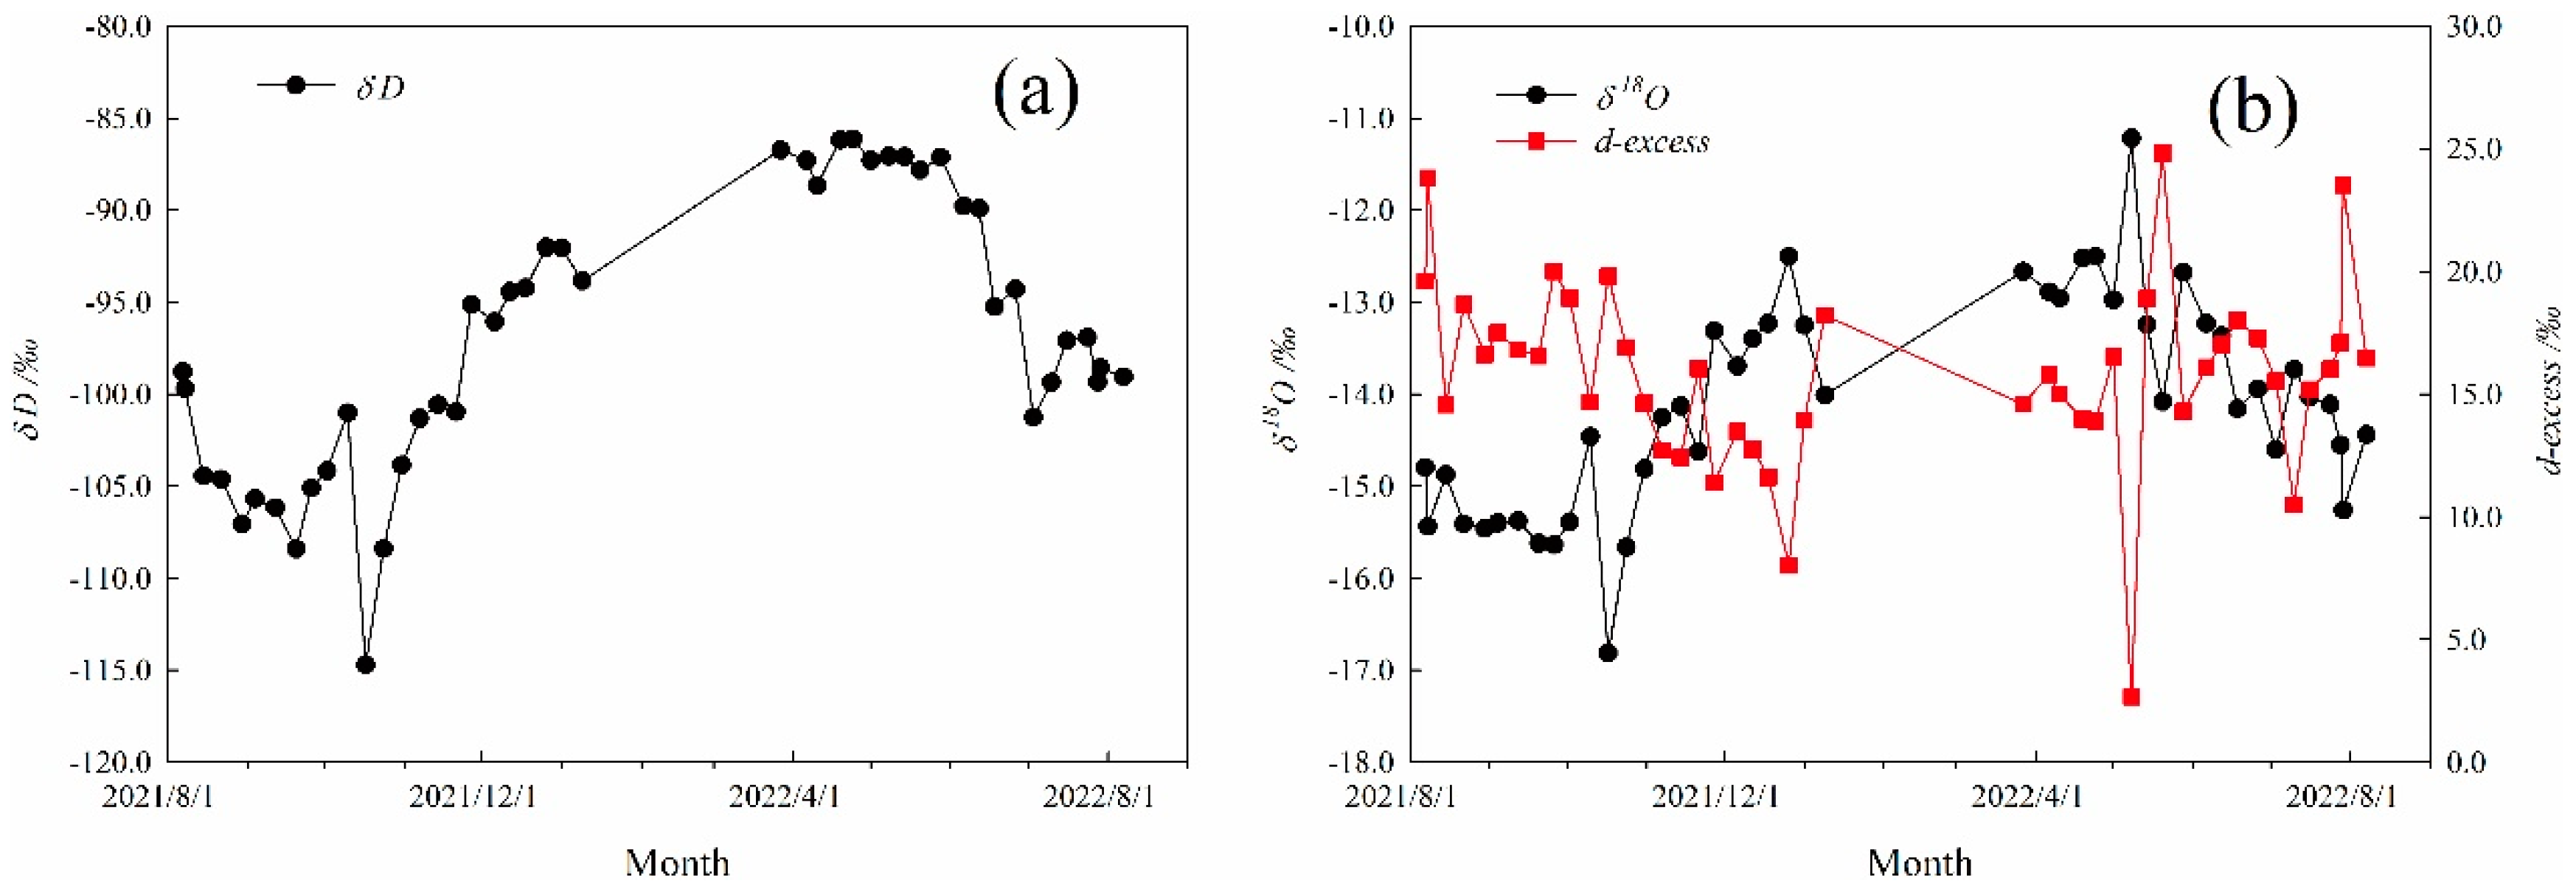
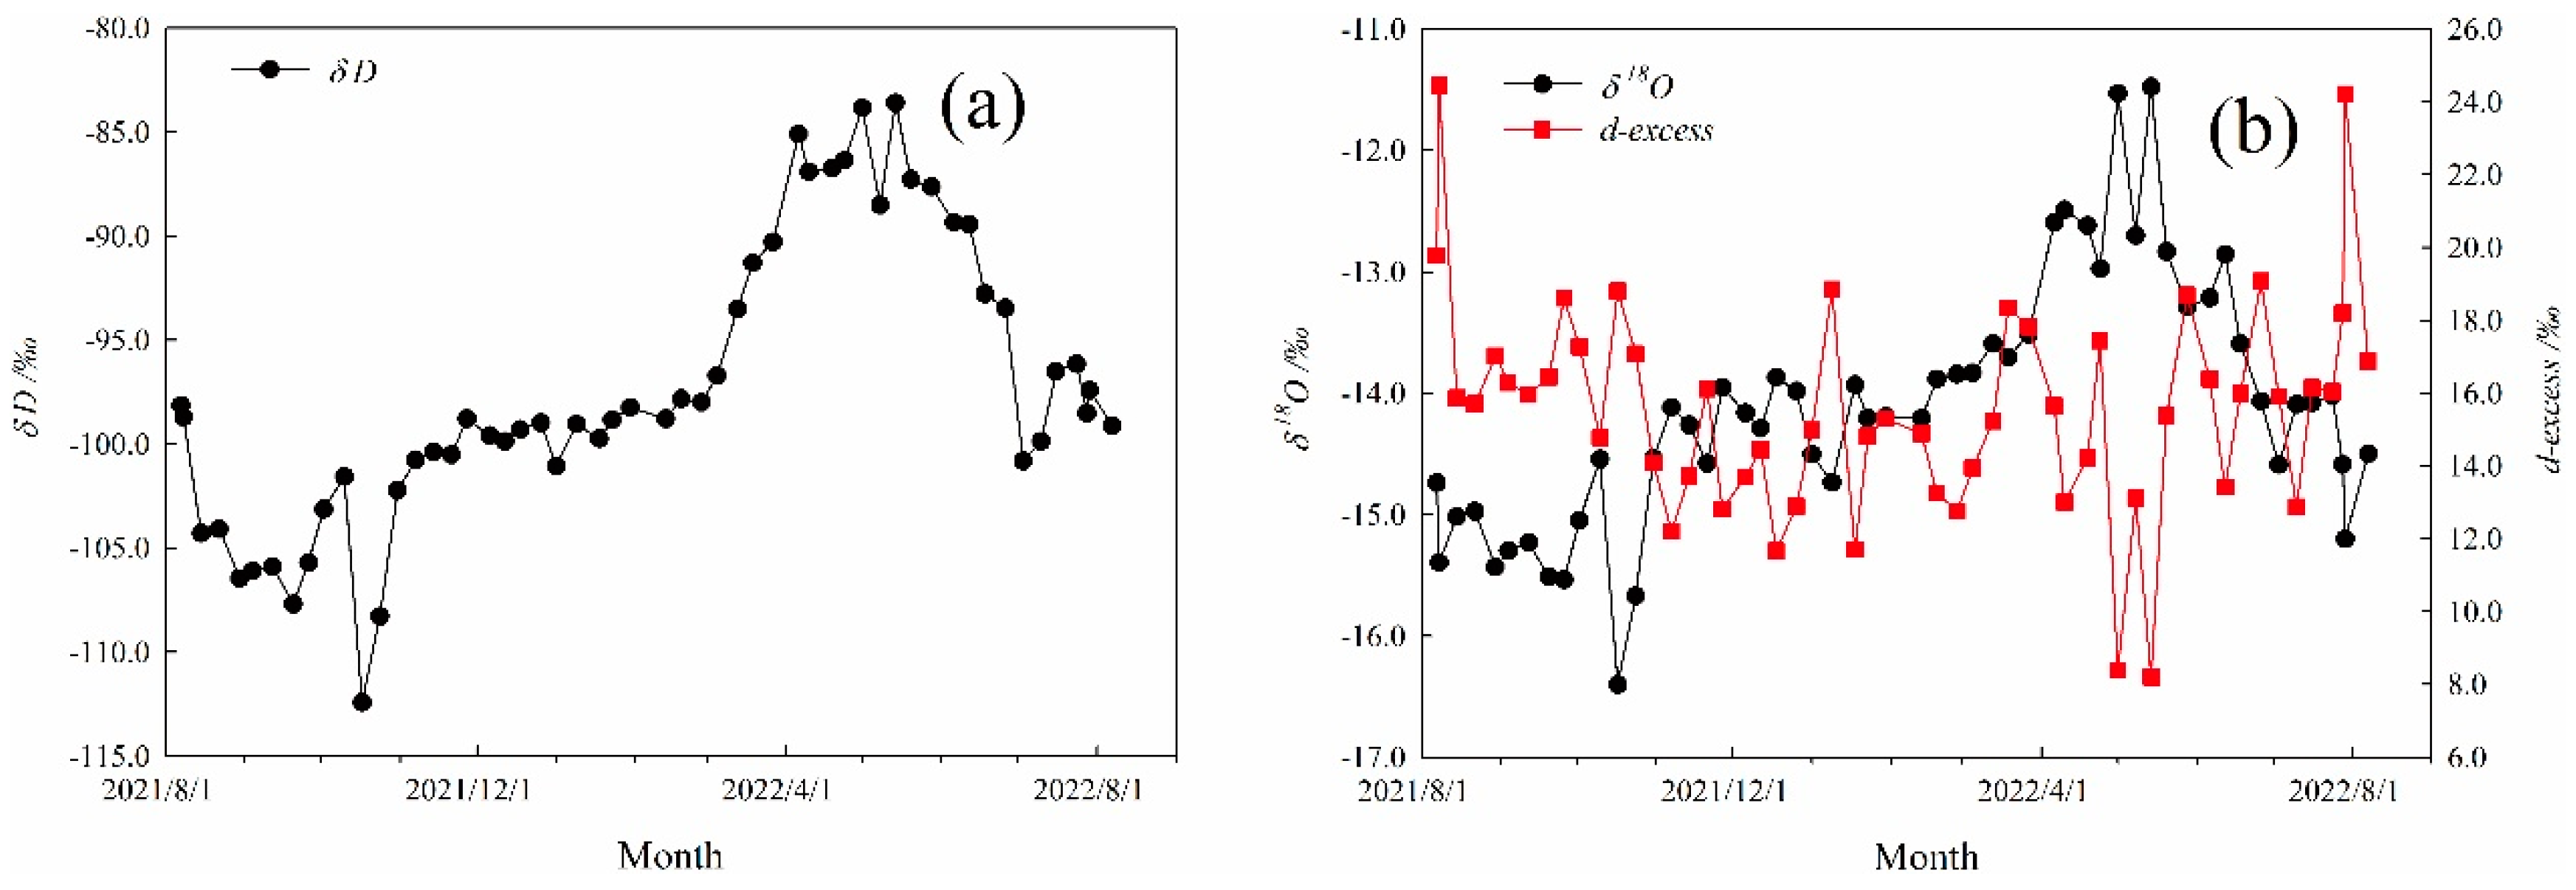
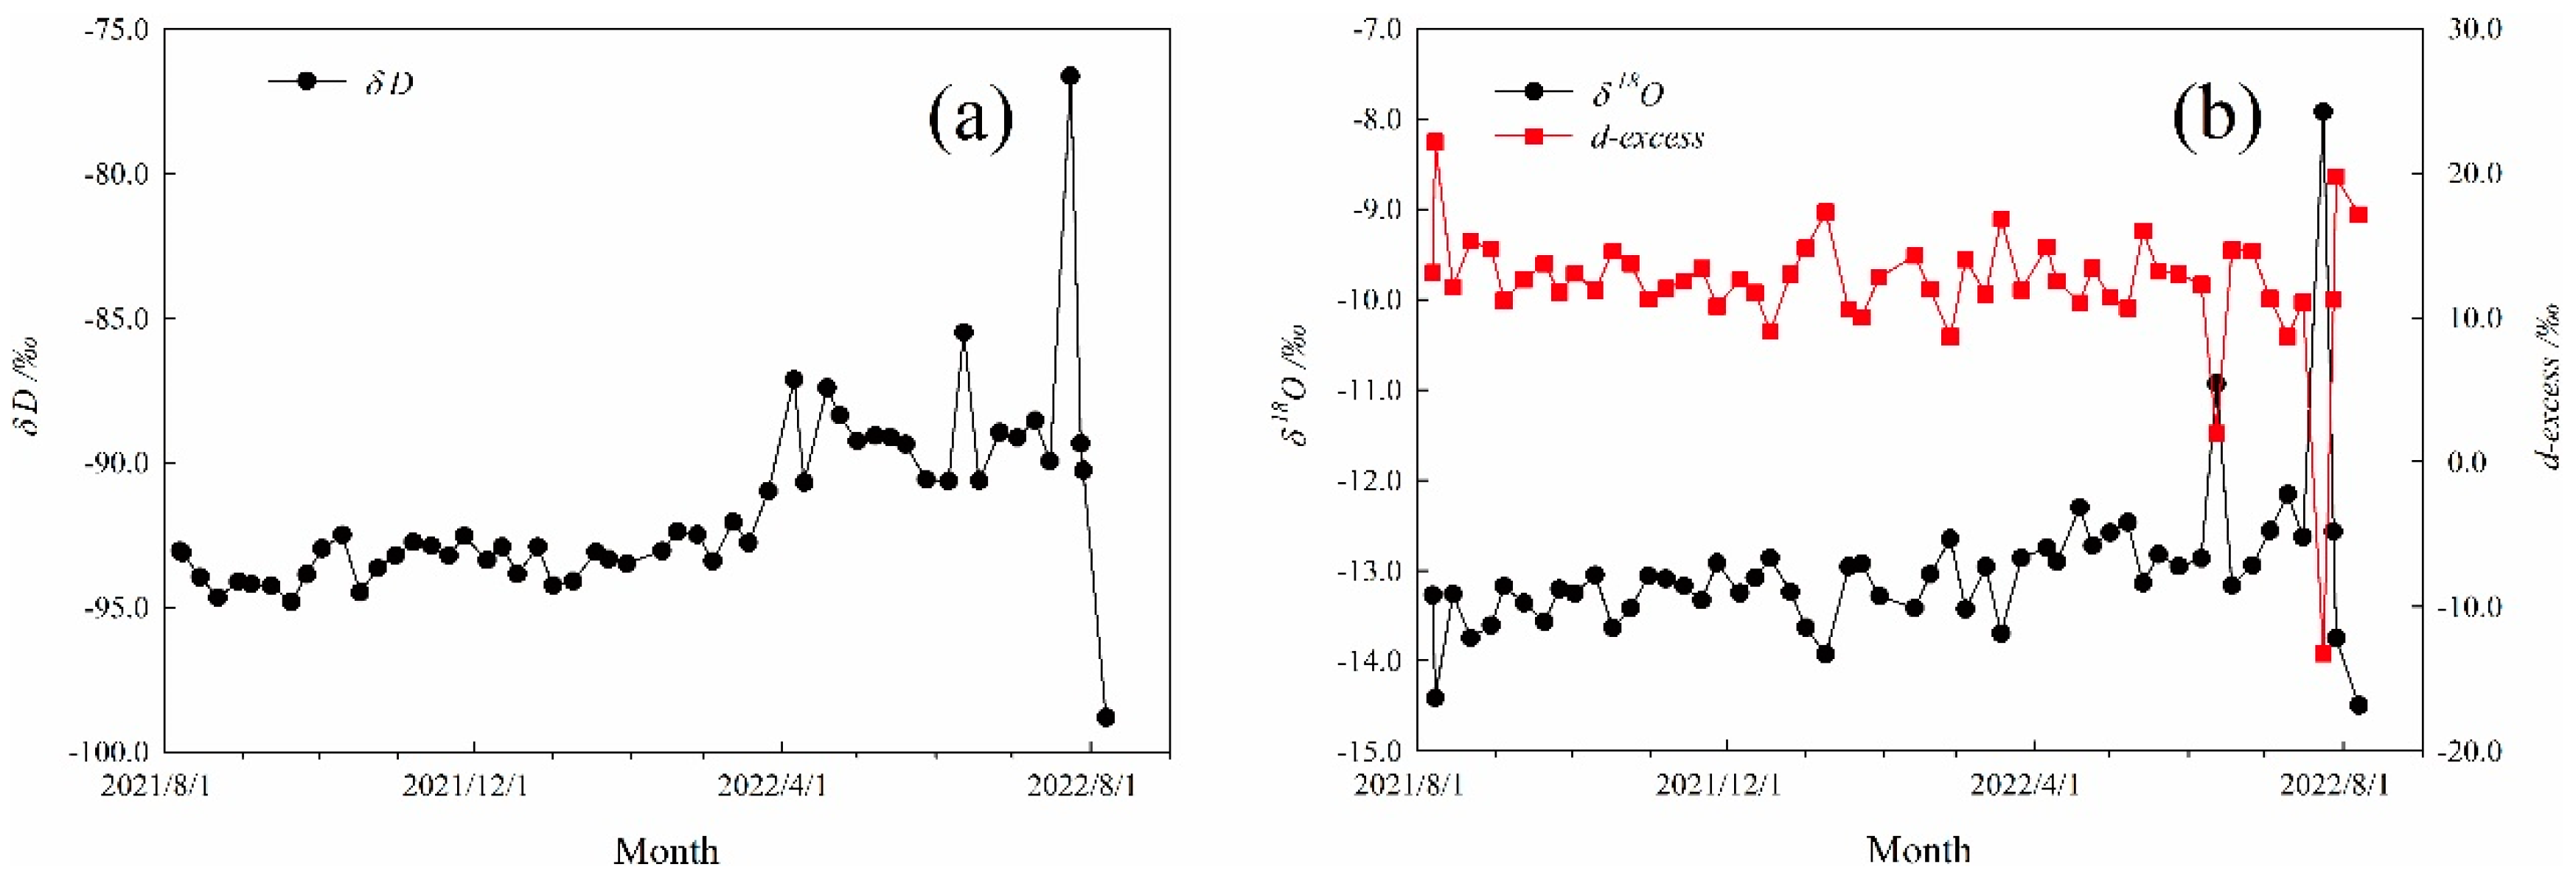
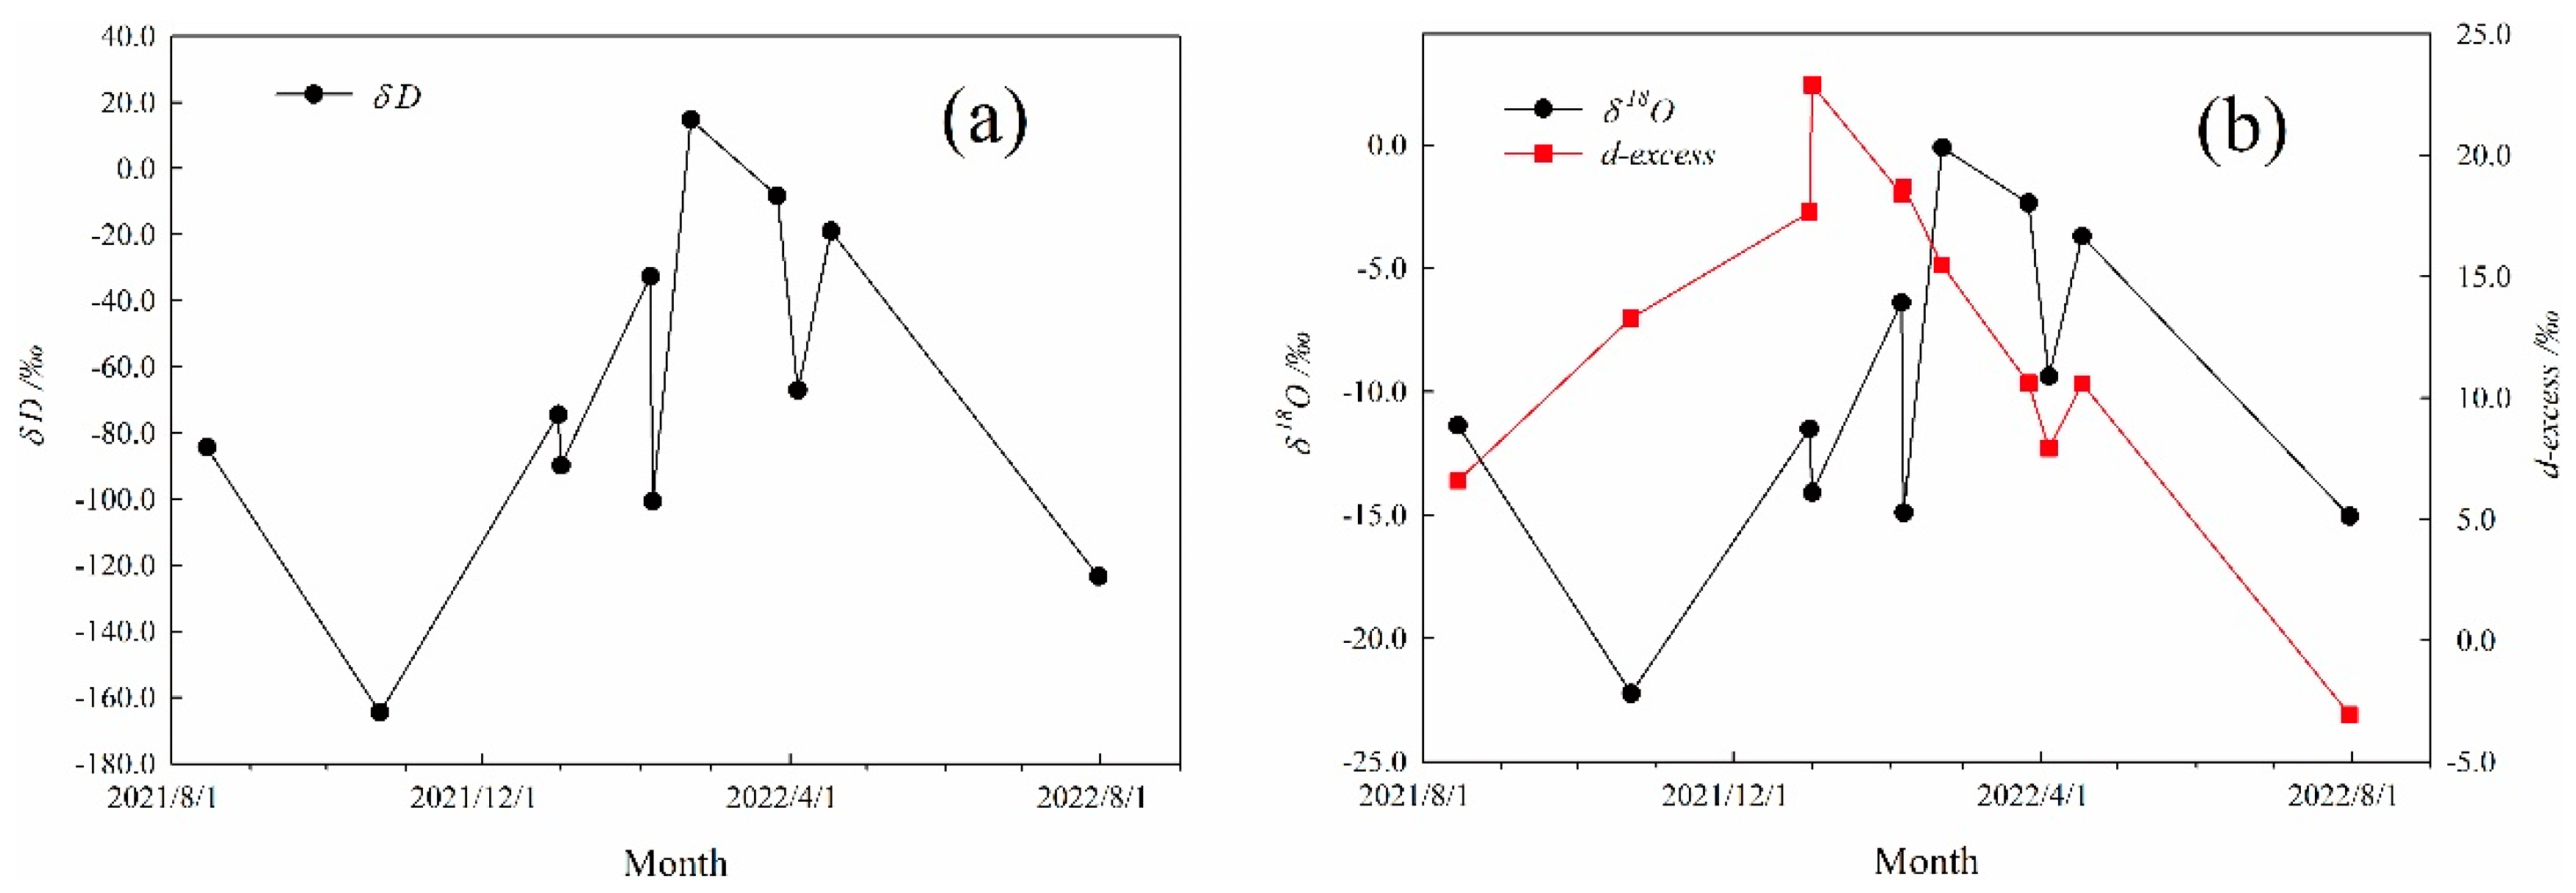
The range of stable isotopes in various natural water bodies is as follows. Among them, the glacial ice isotopes vary from −78.79‰ to −103.48‰ for δD and from −10.69‰ to −15.71‰ for δ18O. The ice-melt water isotopes vary from −86.12‰ to −114.71‰ for δD and from −11.22‰ to −16.81‰ for δ18O. The river (river midstream) isotopes vary from −83.60‰ to −112.41‰ for δD and from −11.47‰ to −16.40‰ for δ18O. The river (river downstream) isotopes vary from −84.62‰ to −111.48‰ for δD and from −11.42‰ to −16.27‰ for δ18O. The groundwater isotopes vary from −76.62‰ to −98.81‰ for δD and from −7.92‰ to −14.49‰ for δ18O. The precipitation isotopes vary from 14.64‰ to −164.55‰ for δD and from −0.10‰ to −22.23‰ for δ18O. It is also found that the average values of stable isotopes follow the order of precipitation (−68.15‰ for δD, −10.10‰ for δ18O), groundwater (−91.70‰ for δD, −13.01‰ for δ18O), glacial ice (−94.41‰ for δD, −13.70‰ for δ18O), river water (river downstream, −96.86‰ for δD, −14.06‰ for δ18O), ice-melt water (−97.00‰ for δD, −14.11‰ for δ18O), and river water (river midstream, −97.32‰ for δD, −14.11‰ for δ18O).
Similarly, the range of deuterium excess in various natural water bodies is as follows. The glacial ice deuterium excess varies from 23.61‰ to 6.73‰. The ice-melt water deuterium excess varies from 24.83‰ to 2.67‰. The river (river midstream) deuterium excess varies from 24.45‰ to 8.20‰. The river (river downstream) deuterium excess varies from 25.17‰ to 4.11‰. The groundwater deuterium excess varies from 22.17‰ to −13.25‰. The precipitation deuterium excess varies from 22.90‰ to −3.06‰. The average values of deuterium excess follow the order of ice-melt water (15.84‰), river water (river downstream, 15.60‰), river water (river midstream, 15.57‰), glacial ice (15.15‰), precipitation (12.64‰), and groundwater (12.35‰).
According to the above isotopic content in each water body, the average values of stable isotopes follow the order of precipitation, groundwater, glacial ice, river water (river downstream), ice-melt water, and river water (river midstream). While the average values of deuterium excess follow the order of ice-melt water, river water (river downstream), river water (river midstream), glacial ice, precipitation, and groundwater. The ranges and average values of stable isotopes and d-excess of ice-melt water, river water (river midstream), and river water (river downstream) are close. The average values of stable isotopes between glacial ice and groundwater are close, and the average values of deuterium excess of precipitation are close to groundwater.
Figure 4, Figure 5, Figure 6, Figure 7, Figure 8 and Figure 9 show that the high values of δD and δ18O of ice-melt water, river water (river midstream), river water (river downstream), groundwater, and precipitation generally occur from March to August, that is, spring and summer, while the low values generally occur from September to the following February, that is, autumn and winter. The occurrence time of high and low values of δD and δ18O in glacial ice is opposite to that of five other types of water samples. The highest values of δD and δ18O of glacial ice occur around December in winter, and the lowest values occur around May in spring. At the same time, the δD and δ18O of the six water samples showed the same change trend at the time node.
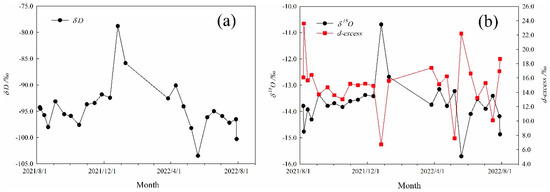
Figure 4.
The range of δD (a), δ18O, and d-excess (b) in glacial ice from 7 August 2021 to 7 August 2022.
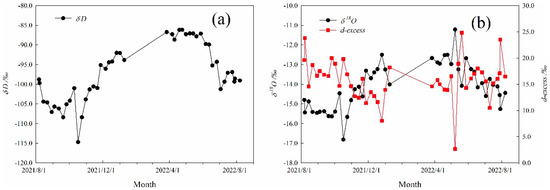
Figure 5.
The range of δD (a), δ18O, and d-excess (b) in ice-melt water from 7 August 2021 to 7 August 2022.
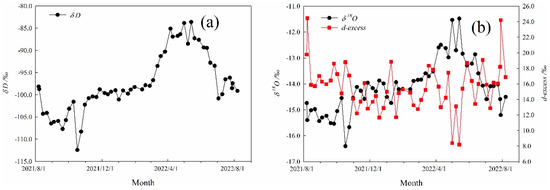
Figure 6.
The range of δD (a), δ18O, and d-excess (b) in river water (river midstream) from 7 August 2021 to 7 August 2022.
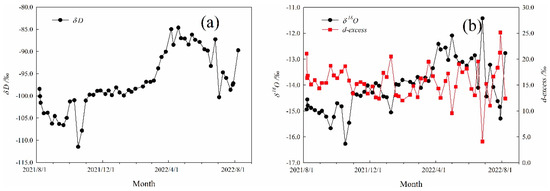
Figure 7.
The range of δD (a), δ18O, and d-excess (b) in river water (river downstream) from 7 August 2021 to 7 August 2022.
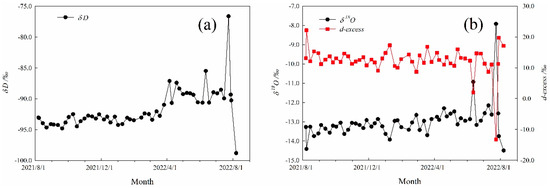
Figure 8.
The range of δD (a), δ18O, and d-excess (b) in groundwater from 7 August 2021 to 7 August 2022.
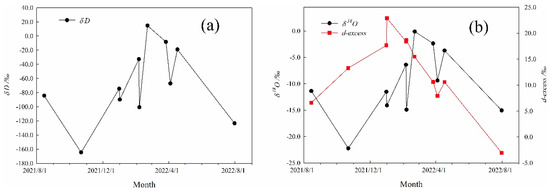
Figure 9.
The range of δD (a), δ18O, and d-excess (b) in precipitation from 7 August 2021 to 7 August 2022.
4.2. Water Line
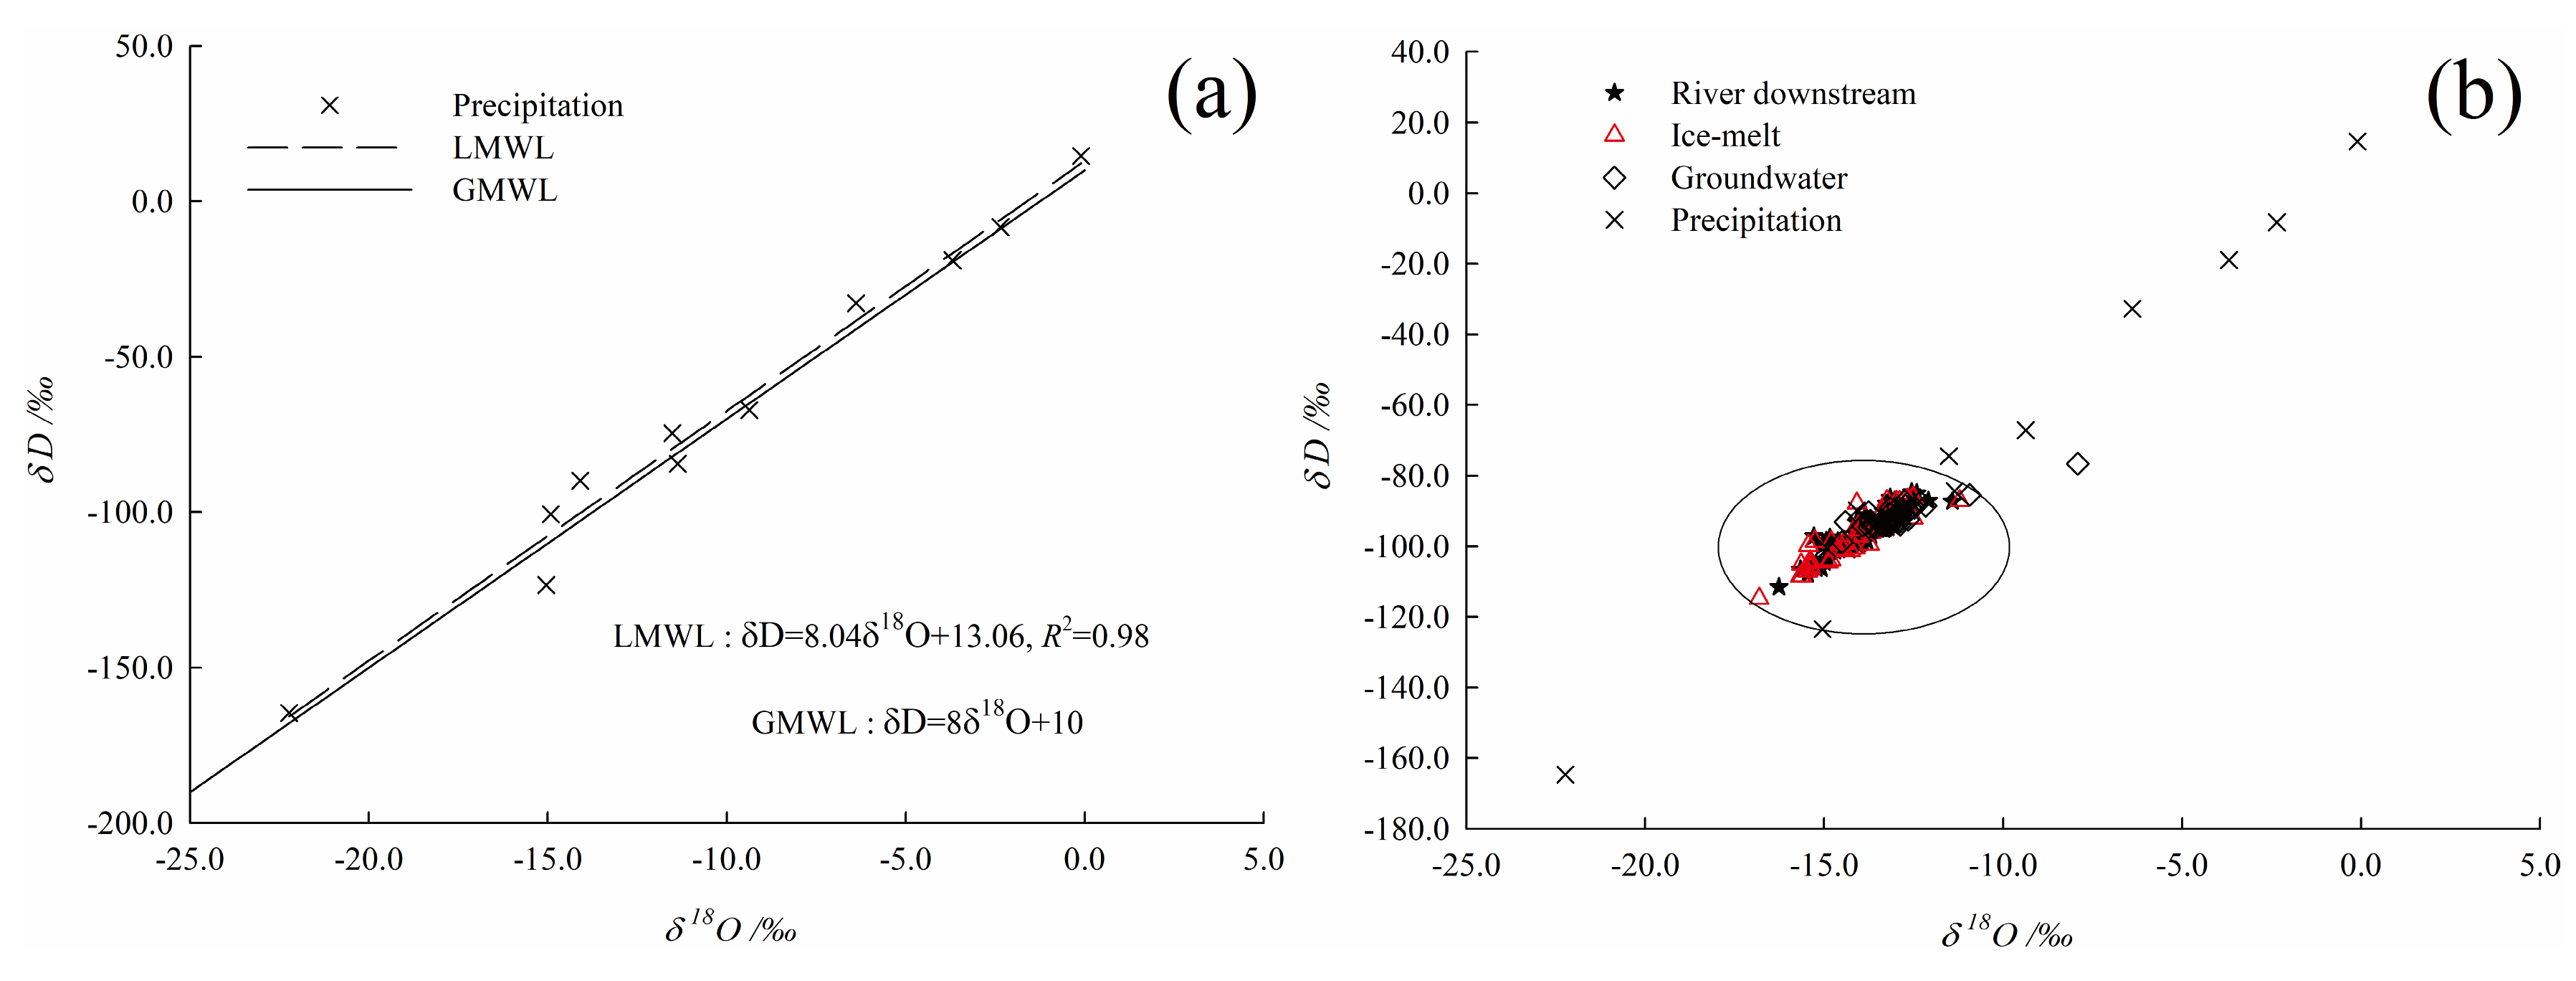
The local meteoric water line (LMWL) in the Mingyong Glacier basin is δD = 8.04δ18O + 13.06, R2 = 0.98, n = 11. There are some differences in the slope and intercept of the meteoric water line in different regions, as well as in the global meteoric water line (GMWL), which is related to the distinctive natural ecological environment of water vapor sources in different places and the specific environmental conditions during the migration of rain cloud droplets. The slope of the local meteoric water line in the Mingyong Glacier basin is very close to that of the global meteoric water line (GMWL): δD = 8δ18O + 10. The larger intercept indicates that the non-equilibrium dynamic evaporation fractionation effect may be higher in the Mingyong Glacier basin, which has important environmental significance. At the same time, the precipitation source in this region is relatively stable and less affected by other environmental factors. Friedman points out that the evaporation of raindrops can cause the meteoric water line to have a slope below 8 due to atmospheric conditions [24]. High temperature and strong evaporation lead to high heavy isotope enrichment and low slope in liquid precipitation. From the perspective of the LMWL slope of the Mingyong Glacier basin, it is very similar to the slope of global meteoric water line and greater than 8, indicating that evaporation in this area is weaker than the inland arid areas. The Mingyong Glacier basin is located in the inland alpine area, and the steam source is far away compared to the coastal area; moreover, the temperature difference between winter, spring, summer, and autumn is not obvious, that is, the annual temperature difference is small [16], indicating that the environment in this area is humid and the evaporation under clouds is not strong. The LMWL intercept of the Mingyong Glacier basin is 13.06, which is larger than the global meteoric water line intercept, indicating that there are multiple sources of water vapor in the study area. This is consistent with the fact that the water vapor sources and influencing factors of precipitation in southwest China are quite complex, including the South China Sea, the Bay of Bengal, the Indian Ocean, the Arabian Sea, and trans-equatorial airflow [13]. The formation and evolution process of precipitation isotopes in inland alpine mountains is complicated, and its differences cannot be viewed alone. For comparison, Figure 10a displays the precipitation in the fitting of the sample line (called LMWL) and the global meteoric water line. Figure 10b displays the Mingyong River’s runoff components of a scatter diagram; it shows that precipitation, groundwater, ice-melt water, and river water (river downstream) are mainly concentrated in the oval circle, and most of the precipitation scatter is not there. This suggests that clustering bodies of water together creates a fairly strong connection. In short, in this region, only ice meltwater and groundwater have strong clustering with the river water (river downstream), while precipitation is far away, indicating that it contributes little to the composition of river water (river downstream).

Figure 10.
The local meteoric water line (a) and scatter diagram (b) of the relationship between δD and δ18O of runoff components in the Mingyong Glacier basin.
4.3. Hydrograph Separation of Mingyong River
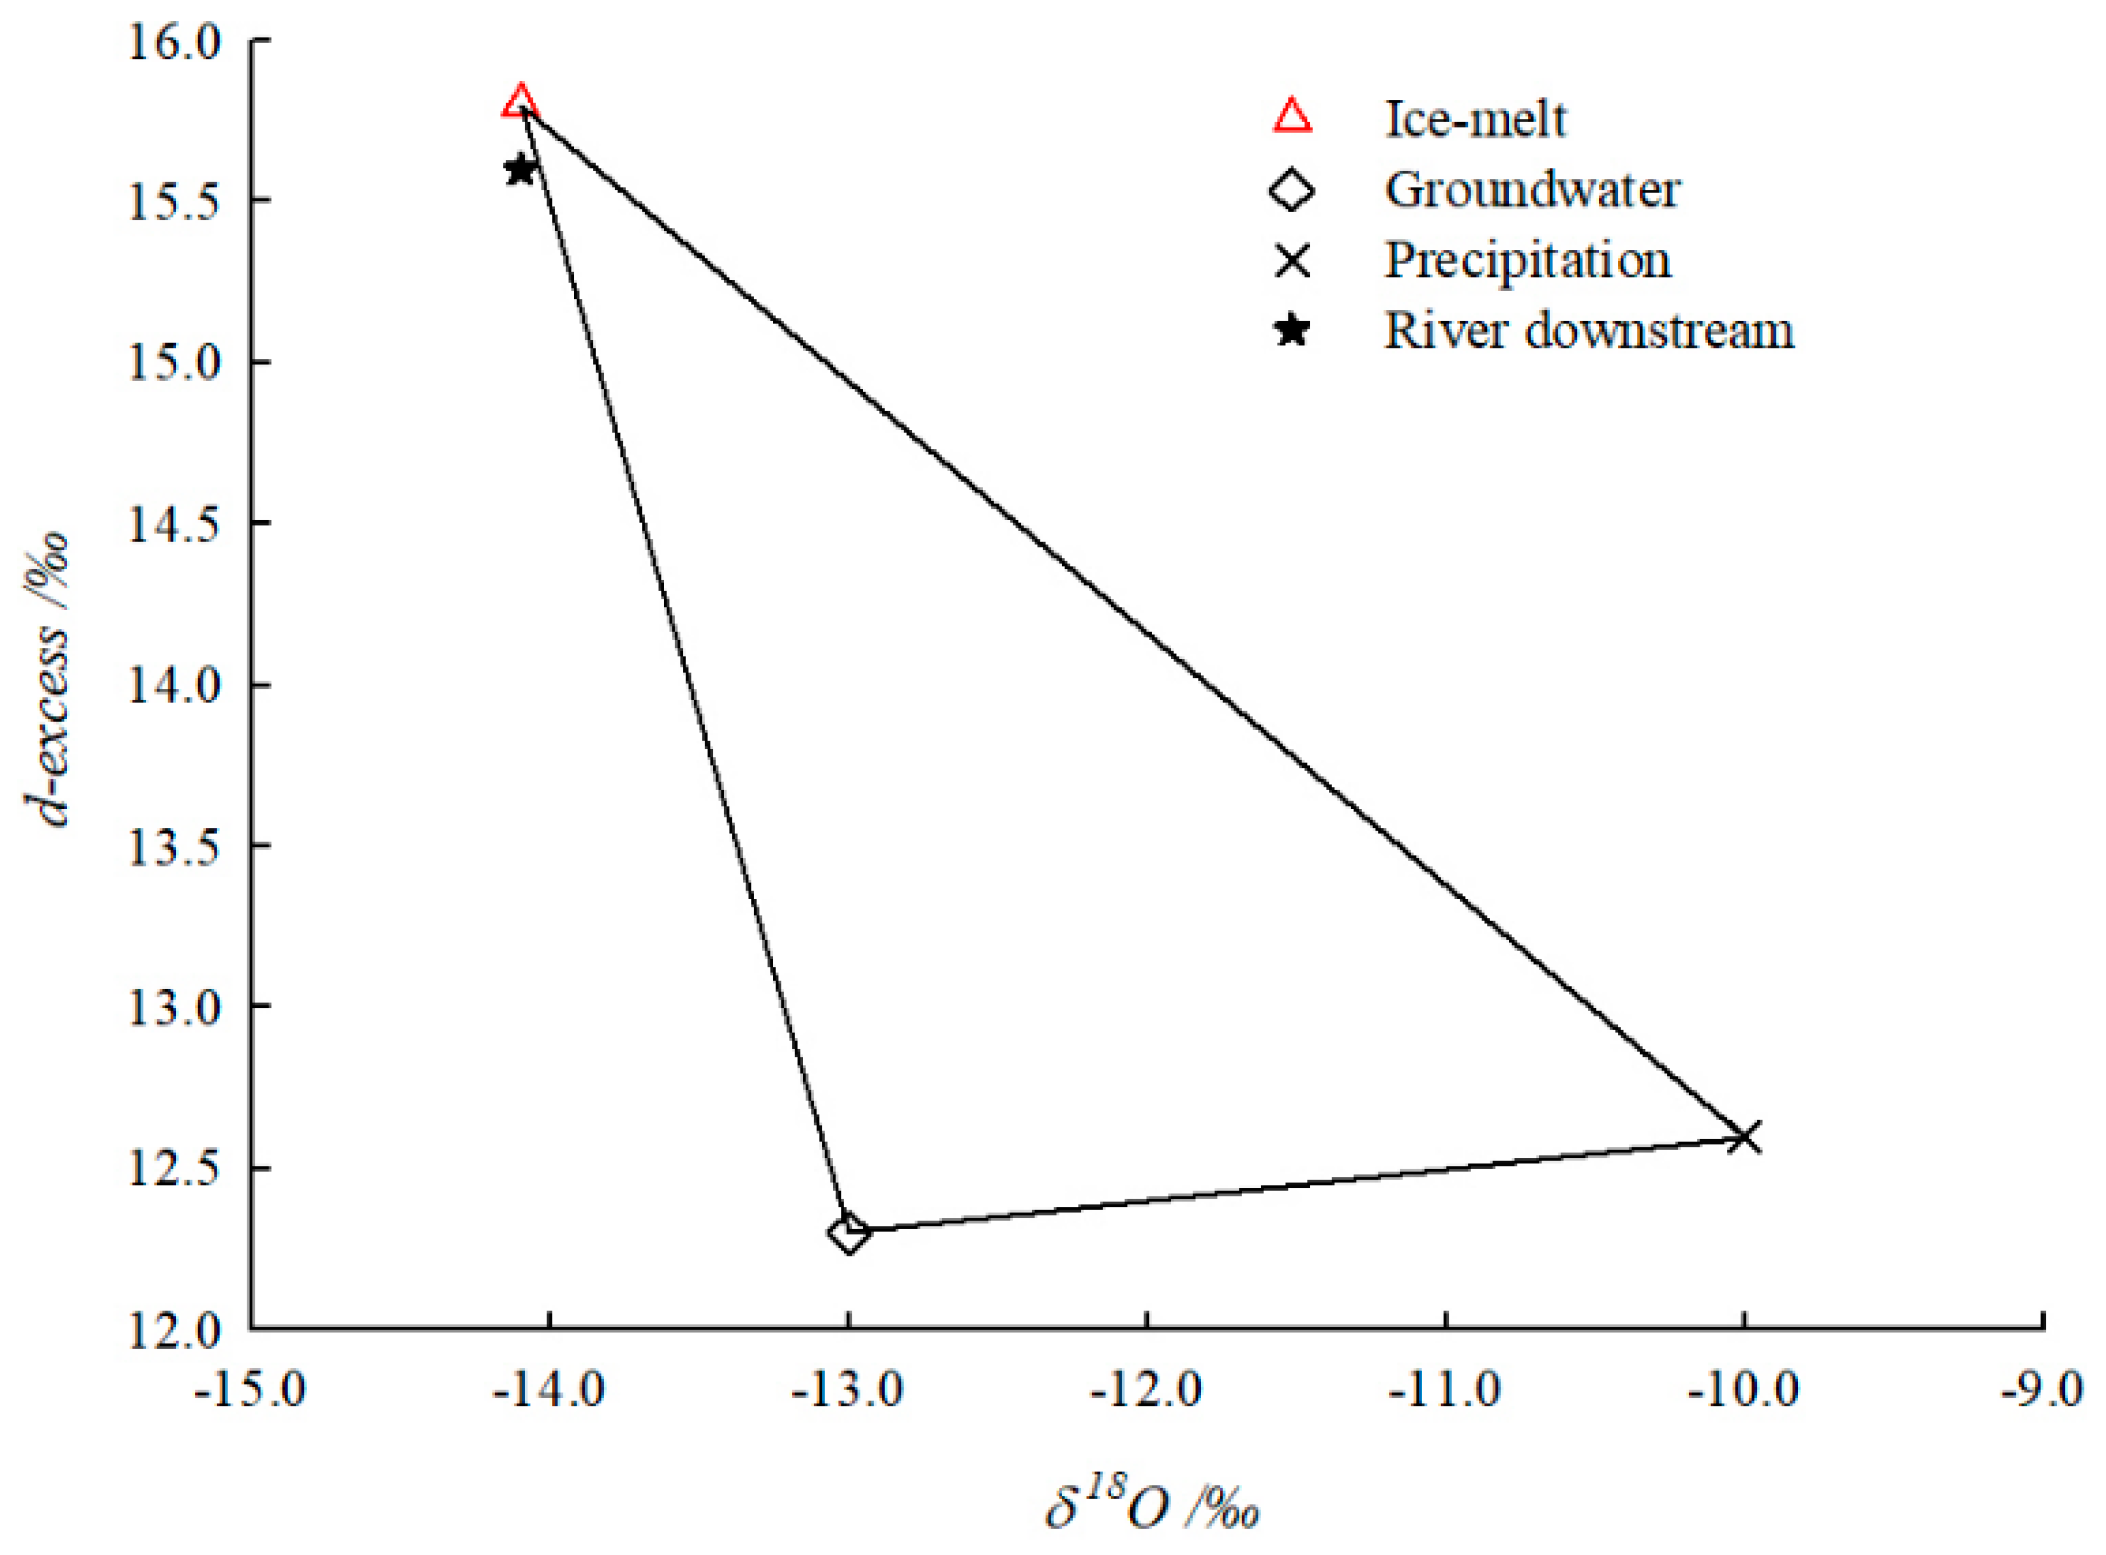
Because the concentration of d-excess and δ18O is significantly different in space and time, d-excess and δ18O are used as tracers to separate the recharge components of the lower reaches of the Mingyong River in the Mingyong Glacier basin. As shown in Figure 11, ice-melt water (mean value) is taken as the first end member, groundwater (mean value) as the second end member, and precipitation (mean value) as the third end member through a whole hydrological year. Combined with the isotopic change characteristics data of each water body and the end member diagram, it is concluded that the main recharge source of the lower reaches of the Mingyong River in the Mingyong Glacier basin is ice-melt water, with the order being as follows: ice-melt water, groundwater, and precipitation.
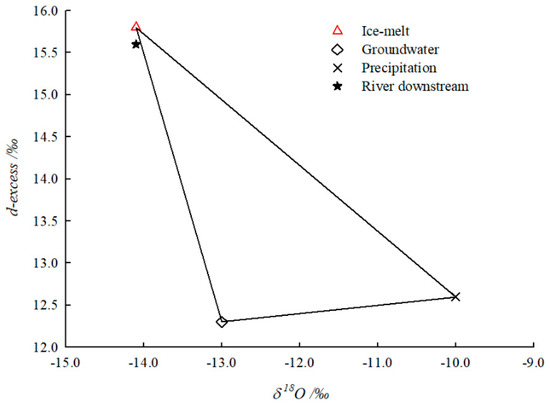
Figure 11.
End member diagram of δ18O and d-excess for the whole year.
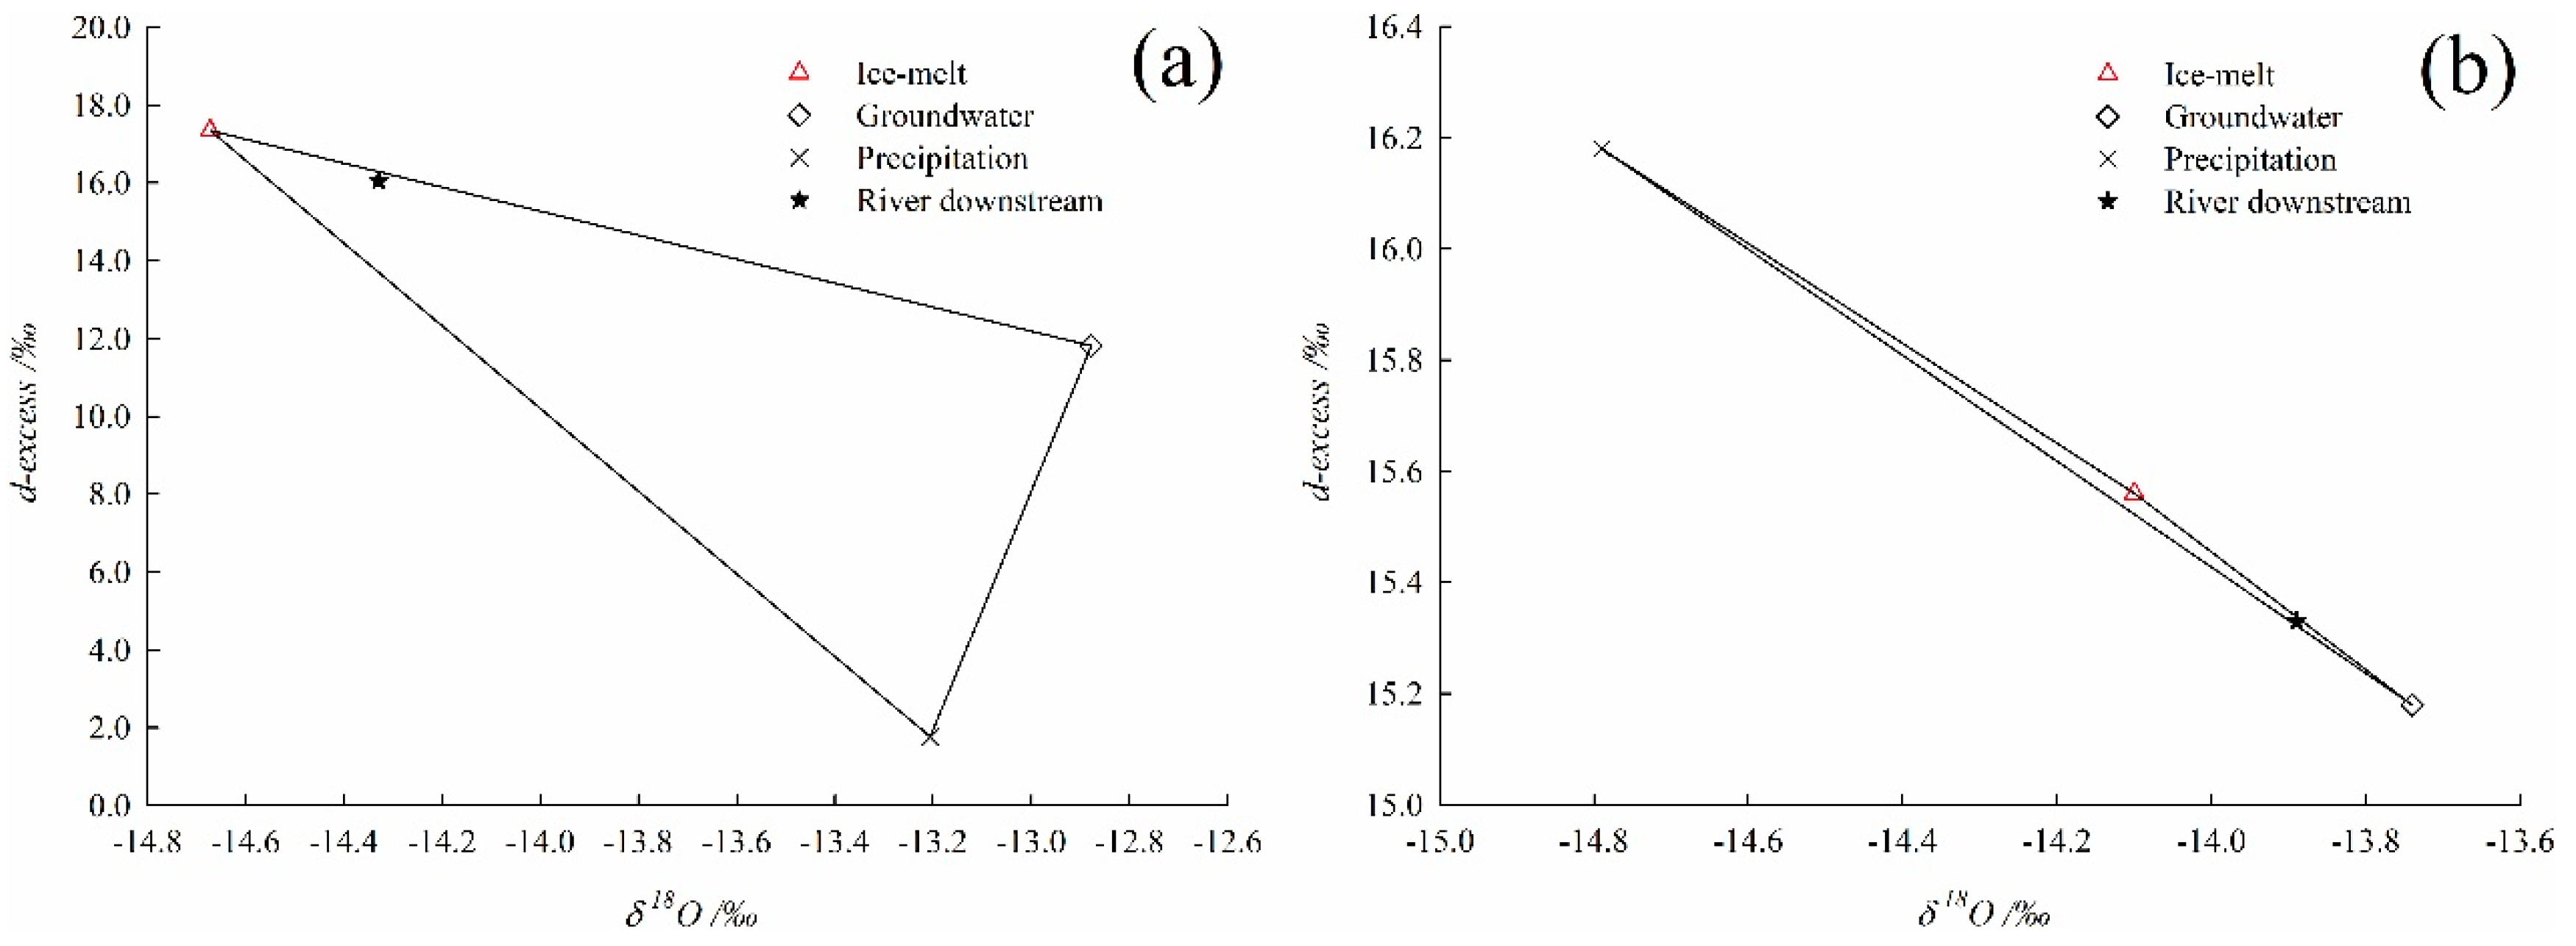
The whole year is further divided into ablation period and accumulation period for specific separation calculation, in which the main ablation period is from June to September, and the accumulation period is from October to the following May. The division is based on the calculation result of mass accumulation balance of Glacier No. 1 of White Water River Glacier at the Yulong Snow Mountain near the study area [25]. The Mingyong Glacier is a typical temperate glacier, which is still in motion during the accumulation period, and the ablation amount at the end of the accumulation period is not zero. Therefore, three end-member hydrograph separation is adopted during the ablation period and accumulation period. In the final calculation formula derived from Formulas (3)–(5), δ18O and d-excess are used as tracers. The results show that the recharge rates of ice-melt water, groundwater, and precipitation to the lower reaches of the Mingyong River are 80.6%, 17.2%, and 2.2%, respectively. According to field research, the lower reaches of the Mingyong River should comprise a mixed water body of ice-melt water, groundwater, and precipitation. Therefore, this study intersects the river water (river downstream) line in the accumulation period with the ice-melt water line, groundwater line, and LMWL to obtain three end members, respectively, as follows: the end member of ice-melt water is δ18O = −14.10‰ and δD = −97.24‰, the end member of groundwater is δ18O = −13.74‰ and δD = −94.74‰, and the end member of precipitation is δ18O = −14.79‰ and δD = −102.14‰. Based on the above end members, the end member of d-excess is obtained. Similarly, with the end member values of δ18O and d-excess as tracers during the accumulation period, the recharge rates of ice-melt water, groundwater, and precipitation to the lower reaches of the Mingyong River are 19.2%, 73.1%, and 7.7%, respectively. The results of hydrograph separation of the lower reaches of the Mingyong River during the ablation period and accumulation period above are shown in Figure 12.
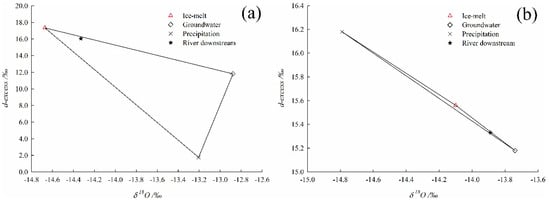
Figure 12.
End member diagrams of ablation period (a) and accumulation period (b).
5. Discussion
From the location of the Mingyong Glacier basin, this area is affected by the East Asian monsoon in the Pacific Northwest and the South Asian/Indian monsoon in the Bay of Bengal, Indian Ocean. Additionally, the temperature effect is not so obvious compared with the arid area in the mainland. The interaction of heavy isotopes due to the water vapor migration path in this region is more complex. The ice coverage of the outer edge of the Mingyong Glacier is most obviously affected by the temperature change, which is influenced by the refreezing process in winter and the melting process in summer. Therefore, it can be inferred that the variation range of groundwater isotopes is more stable than that of ice-melt water and precipitation, and it can be basically seen that the global temperature rise caused by climate change is greatly affected. Ice-melt water is at the interface of condensation and refreezing, so hybrid power is strong, and isotope variation is large [16]. For the months with high and low values of δD and δ18O, the isotope values show a phenomenon of continuous enrichment or depletion with time, which reflects the difference of precipitation formation process in different seasons to some extent. In addition to glacier ice, high values of δD and δ18O of ice-melt water, river water (river midstream), river water (river downstream), groundwater, and precipitation all appear in the period from March to August, that is, spring and summer. Low values are present in the period from September to the following February, namely autumn and winter. The high and low values of δD and δ18O of glacial ice appear in opposite months to the other five water samples, the highest values of δD and δ18O of glacial ice appear in December in winter, and the lowest values appear in May in spring. This is because the specific physical and chemical properties of solid glacial ice will have a certain impact on the month of the occurrence of high and low values of stable isotopes of hydrogen and oxygen. The high values of hydrogen and oxygen stable isotopes of ice-melt water, river water (river midstream), river water (river downstream), and groundwater appeared in similar months, while the high values of hydrogen and oxygen stable isotopes of precipitation appeared in March, which may be due to the error caused by the arid climate and small sample size of precipitation collection points. It can be seen that under the influence of temperature, heavy isotopes are generally enriched in spring and summer, and are depleted in autumn and winter. The d-excess defined by Dansgaard can be used to indicate the climate characteristics of the source of water vapor [23]. In this study, the overall change of d-excess tends to be stable, and the month in which the high and low values appear is not obvious to follow. In recent years, new studies have pointed out that the judgment of the climate characteristics of water vapor sources is limited only by a single d-excess characterization, indicating that the d-excess in water vapor is not a single but complex climate characterization, so we should not discuss it too much.
Pearson’s correlation analysis was used to study the correlation between isotopes of water samples and temperature, precipitation, and relative humidity. It was found that the correlation coefficients between the monthly average δ18O values of glacial ice, ice-melt water, river water (river midstream), river water (river downstream), groundwater, precipitation, and the monthly average temperature values of Deqin Meteorological Station are as follows: −0.79 (showing a significant level at 0.01 level), −0.51, −0.19, −0.14, 0.28, and −0.35. Correspondingly, the correlation coefficients with the monthly value of precipitation are −0.50, 0.01, 0.28, 0.42, 0.50, and 0.13. Similarly, the correlation coefficients with the monthly value of relative humidity are −0.61 (significant level at 0.05 level), −0.41, −0.02, 0.08, 0.25, and −0.28. The correlation coefficients between the monthly average δD values of glacial ice, ice-melt water, river water (river midstream), river water (river downstream), groundwater, precipitation, and the monthly average temperature values of Deqin Meteorological Station are as follows: −0.84 (significant level at 0.01 level), −0.38, −0.03, −0.04, 0.36, and −0.48. The corresponding correlation coefficients with precipitation monthly value are −0.45, 0.14, 0.43, 0.45, 0.68 (significant level at 0.05 level), and 0.01. Further, the corresponding correlation coefficients with the monthly relative humidity are −0.65 (significant level at 0.05 level), −0.27, 0.10, 0.11, 0.39, and −0.37, respectively. The correlation coefficients between the monthly average of d-excess of glacial ice, ice-melt water, river water (river midstream), river water (river downstream), groundwater, precipitation, and the monthly average temperature of Deqin Meteorological Station are as follows: 0.27, 0.72 (significant level at 0.05 level), 0.67 (significant level at 0.05 level), 0.48, −0.10, and −0.86 (significant level at 0.01 level). The corresponding correlation coefficients with precipitation monthly value are as follows: 0.37, 0.45, 0.45, −0.01, −0.11, and −0.71 (significant level at 0.05). The corresponding correlation coefficients with the monthly relative humidity are 0.22, 0.71 (significant level at 0.05), 0.48, 0.10, 0.02, and −0.60, respectively.
At the same time, by setting up the control group in the middle and lower reaches of the river (Mingyong Village is located between the middle and lower reaches of the Mingyong River), this study explored the possible effects of human activities in the village on various water isotopes. From figures above, the river (river midstream) isotopes vary from −83.60‰ to −112.41‰ for δD, and from −11.47‰ to −16.40‰ for δ18O. The river (river downstream) isotopes vary from −84.62‰ to −111.48‰ for δD and from −11.42‰ to −16.27‰ for δ18O. The average values of stable isotopes between river water (river midstream, −97.32‰ for δD, −14.11‰ for δ18O) and river water (river downstream, −96.86‰ for δD, −14.06‰ for δ18O) are similar. The difference is not obvious, which indicates that the natural environment of the water body in this region is good and that the influence of human activity pollution is relatively small. If human activities have unstable effects on regional natural environment elements and if large pollutants are produced into water bodies, this may affect the evaporation fractionation effect of isotopes to a certain extent.
The length of the Mingyong River measured using ArcGIS is about 7.1 km. The Mingyong Glacier basin is surrounded by mountains on three sides. According to the observations during the sampling period, the temperature near the ice surface during the ablation period in this area is quite high and can reach 29 °C. Due to the small basin area, there is a large amount of glacier loss during the summer ablation period. In addition, the glacier basin here has the characteristics of large river drop, short river length, and strong kinetic energy. Therefore, it takes a short time for ice-melt water from the upper end of glacier to reach the sampling point in the lower reaches of the Mingyong River. The particularity of natural geographical environment in the Mingyong Glacier basin inevitably determines the particularity of its recharge source. According to the calculation results of the ablation period, the recharge ratio of ice-melt water to the downstream mountain pass exceeds 80%, indicating that the recharge source of the river water (river downstream) during the ablation period is mainly the ice-melt water from the ice tongue of the Mingyong Glacier. According to the calculation results during the accumulation period, groundwater is the main recharge source, and its recharge ratio exceeds 70%, which conforms to the recharge law of inland river source. Surface runoff increases in the wet season, the river supplies groundwater, and the river level decreases in the dry season, and then groundwater supplies the river. According to the observation during the sampling period, the groundwater in the Mingyong Glacier basin does not show a great difference in season, that is, the groundwater in the Mingyong Glacier basin appears to cause an outcrop all year round, which may be related to the large elevation drop in the basin and the obvious effect of underground water pressure discharge. According to the research results of Kong et al., the annual groundwater recharge in the Mingyong Glacier basin comes from ice-melt water (46%) and precipitation recharge (54%). In the nonmonsoon seasons (November to the following May), groundwater recharge comes from ice-melt water (46%) and precipitation recharge (41%) [16]. That is, during the nonmonsoon seasons, nearly half of the ice-melt water and precipitation recharge the groundwater. According to the results of this paper, groundwater recharges the lower reaches of the Mingyong River in this season. In other words, most of the ice-melt water in the accumulation period does not flow to the downstream mountain pass but is transformed into groundwater during the flow process, and then recharges to the river water (river downstream) through groundwater. Therefore, ice-melt water is very important as it is the recharge source of river water (river downstream) in the accumulation period.
6. Conclusions
Based on field sampling and experimental data, the spatiotemporal variations of stable isotopes of hydrogen and oxygen in six different water bodies in the Mingyong Glacier basin were analyzed. Furthermore, d-excess and δ18O were used as tracers to analyze the recharge components of the downstream mountain pass of the basin. The main conclusions are as follows:
- (1)
- The analysis results of isotopic variations in different water bodies are as follows. In addition to the significant differences in precipitation isotopes, the isotopes variation characteristics of other waters tend to be stable. On the spatial scale, the annual average values of δD and δ18O in each water body are in the following order: precipitation, groundwater, glacial ice, river water (river downstream), ice-melt water, and river water (river midstream). The annual average values of d-excess in each water body are in the following order: ice-melt water, river water (river downstream), river water (river midstream), glacial ice, precipitation, and groundwater. The variation ranges and annual average values of δD, δ18O, and d-excess of ice-melt water, river water (river midstream), and river water (river downstream) are close to each other. The annual average values of δD and δ18O between glacial ice and groundwater are close to one another, and the annual average values of d-excess of precipitation are close to those of groundwater. In terms of time, except for glacial ice, the highest values of δD and δ18O in the other five water samples appear in spring and summer, and the lowest values appear in autumn and winter. The difference is that high and low values of δD and δ18O in glacial ice are opposite to the other water samples. In addition, the local meteoric water line of the Mingyong Glacier basin was obtained, namely LMWL: δD = 8.04δ18O + 13.06.
- (2)
- The results of hydrograph separation show that the recharge rates of ice-melt water, groundwater, and precipitation to the lower reaches of the Mingyong River in the ablation period are 80.6%, 17.2%, and 2.2%, and in the accumulation period, they are 19.2%, 73.1%, and 7.7%, respectively. At the same time, the ice-melt water in the accumulation period has a high recharge rate to groundwater, and groundwater is mostly recharged to the river water (river downstream). Therefore, ice-melt water in this area, as an important basin water resource, should be rationally planned and utilized to make an important contribution to regional sustainable development.
Author Contributions
L.W. and Z.Z. conceived the idea of this study; Z.Z carried out data analysis and wrote the manuscript draft; L.W. supervised the research project and designed the structure of this manuscript; J.F., Y.S. and X.Z. contributed to sampling organization; Z.D. reviewed and edited this manuscript; X.C., L.D. and T.L. provided supported regarding field investigation design and measuring instruments. All authors have read and agreed to the published version of the manuscript.
Funding
This research was jointly supported by the National Natural Science Foundation of China (No. 42061012) and Yunnan Province Agricultural Basic Research Joint Project (No. 202301BD070001-094).
Data Availability Statement
The data presented in this study are available upon request from the corresponding author. The data are not publicly available because they have not yet been published.
Acknowledgments
The authors would like to acknowledge the Forestry and Grassland Bureau of Deqin County, Meili Snow Mountain National Park Development and Operation Co., Ltd. of Deqin County for their assistance in field survey and sampling. Furthermore, we would like to thank the State Key Laboratory of Cryospheric Sciences and the Tianshan Glaciological Station of the Northwest Institute of Eco-Environment and Resources of the Chinese Academy of Sciences for their help in laboratory testing. We also thank Zongxing Li and researcher Baijuan Zhang of the Northwest Institute of Eco-Environment and Resources, Chinese Academy of Sciences, for their help in analyzing the data. Finally, we thank the editors and anonymous reviewers for their helpful comments regarding this paper.
Conflicts of Interest
The authors declare that no conflicts of interest.
References
- Douville, H.; Raghavan, K.; Renwick, J.; Allan, R.; Arias, P.; Barlow, M.; Cerezo-Mota, R.; Cherchi, A.; Gan, T.; Gergis, J.; et al. Water cycle changes. In Climate Change 2021; Masson-Delmotte, V., Zhai, P., Pirani, A., Connors, S., Péan, C., Berger, S., Caud, N., Chen, Y., Goldfarb, L., Gomis, M., et al., Eds.; The Physical Science Basis; Cambridge University Press: Cambridge, UK, 2021. [Google Scholar]
- Lei, W.; Charles, A.L. Global climate change and its impacts. Adv. Water Sci. 2003, 14, 667–674. [Google Scholar]
- Wang, C.; Huang, M.; Zhai, P. New progress and enlightenment on different types of drought changes from IPCC Sixth Assessment Report. Acta Meteorol. Sin. 2022, 80, 168–175. [Google Scholar]
- Lu, G.; He, H. View of global hydrological cycle. Adv. Water Sci. 2006, 17, 419–424. [Google Scholar]
- Piao, S.; Ciais, P.; Huang, Y.; Shen, Z.; Peng, S.; Li, J.; Zhou, L.; Liu, H.; Ma, Y.; Ding, Y.; et al. The impacts of climate change on water resources and agriculture in China. Nature 2010, 467, 43–51. [Google Scholar] [CrossRef] [PubMed]
- Wang, X.; Huang, G.; Liu, J. Projected increases in near-surface air temperature over Ontario, Canada: A regional climate modeling approach. Clim. Dyn. 2015, 45, 1381–1393. [Google Scholar] [CrossRef]
- Vaughan, D.; Comiso, J.; Allison, I.; Carrasco, J.; Kaser, G.; Kwok, R.; Mote, P.; Murray, T.; Paul, F.; Ren, J.; et al. Observations: Cryosphere. In Climate Change 2013; Stocker, T., Qin, D., Plattner, G., Tignor, M., Allen, S., Boschung, J., Nauels, A., Xia, Y., Bex, V., Midgley, P., Eds.; The Physical Science Basis. Contribution of Working Group I to the Fifth Assessment Report of the Intergovernmental Panel on Climate Change; Cambridge University Press: Cambridge, UK, 2013. [Google Scholar]
- Oerlemans, J. Extracting a Climate Signal from 169 Glacier Records. Science 2005, 308, 675–677. [Google Scholar] [CrossRef] [PubMed]
- Yao, T.; Thompson, L.; Yang, W.; Yu, W.; Gao, Y.; Guo, X.; Yang, X.; Duan, K.; Zhao, H.; Xu, B.; et al. Different glacier status with atmospheric circulations in Tibetan Plateau and surroundings. Nat. Clim. Chang. 2012, 2, 663–667. [Google Scholar] [CrossRef]
- Kong, Y.; Pang, Z. Isotope hydrograph separation in alpine catchments: A review. J. Glaciol. Geocryol. 2010, 32, 619–625. [Google Scholar]
- Zhang, Y.; Wu, Y.; Wen, X.; Su, J. Application of environmental isotopes in water cycle. Adv. Water Sci. 2006, 17, 738–747. [Google Scholar]
- Klaus, J.; McDonnell, J. Hydrograph Separation Using Stable Isotopes: Review and Evaluation. J. Hydrol. 2013, 505, 47–64. [Google Scholar] [CrossRef]
- Zhang, G.; Jiao, Y.; He, L.; Liu, X.; Liu, C.; Yan, X.; Wang, M. Hydrogen and oxygen isotopes in precipitation in southwest China: Progress and prospects. J. Glaciol. Geocryol. 2015, 37, 1094–1103. [Google Scholar]
- Miao, W.; Liu, S.; Zhu, Y.; Duan, S.; Han, F. Spatio-temporal differentiation and altitude dependence of temperature and precipitation in Meili Snow Mountains. Clim. Chang. Res. 2022, 18, 328–342. [Google Scholar]
- Wu, K.; Liu, S.; Zhu, Y.; Xie, F.; Gao, Y. High-resolution monitoring of glacier dynamics based on unmanned aerial vehicle survey in the Meili Snow Mountain. Prog. Geogr. 2021, 40, 1581–1589. [Google Scholar] [CrossRef]
- Kong, Y.; Wang, K.; Pu, T.; Shi, X. Nonmonsoon precipitation dominates groundwater recharge beneath a monsoon-affected glacier in Tibetan Plateau. J. Geophys. Res. Atmos. 2019, 124, 10913–10930. [Google Scholar] [CrossRef]
- Shi, Y. Concise Glacier Inventory of China; Shanghai Popular Science Press: Shanghai, China, 2008. [Google Scholar]
- Lan, Y.; Liu, G.; Shao, X. Variation of the Melang Glacier in Mount Kawa Karpo in the Past 40 Years, Based on Dendrochronolog. J. Glaciol. Geocryol. 2011, 33, 1229–1234. [Google Scholar]
- Yang, Z. Biodiversity and its conservation in the scenic area of Deqin-Meili Snow Mountain, Yunnan Province. For. Inventory Plan. 2008, 33, 14–18. [Google Scholar]
- Duan, S.; Liu, S.; Zhu, Y.; Miao, W.; Han, F.; Qi, M. Reconstructing and analyzing avalanche events of 1991 and 2019 in Meili Snow Mountain. J. Glaciol. Geocryol. 2022, 44, 771–783. [Google Scholar]
- Zheng, B.; Zhao, X.; Li, T.; Wang, C. Features and fluctuation of the Melang Glacier in the Mainri Mountain. J. Glaciol. Geocryol. 1999, 21, 145–150. [Google Scholar]
- Christophersen, N.; Hooper, R. Multivariate analysis of stream water chemical data: The use of principal components analysis for the end-member mixing problem. Water Resour. Res. 1992, 28, 99–107. [Google Scholar] [CrossRef]
- Dansgaard, W. Stable isotopes in precipitation. Tellus 1964, 16, 436–468. [Google Scholar] [CrossRef]
- Friedman, I.; Machta, L.; Soller, R. Water-vapor exchange between a water droplet and its environment. J. Geophys. Res. 1962, 67, 2761–2766. [Google Scholar] [CrossRef]
- Du, J.; He, Y.; Li, S.; Wang, S.; Niu, H. Mass balance of a typical monsoonal temperate glacier in Hengduan Mountains Region. Acta Geogr. Sin. 2015, 70, 1415–1422. [Google Scholar]


Disclaimer/Publisher’s Note: The statements, opinions and data contained in all publications are solely those of the individual author(s) and contributor(s) and not of MDPI and/or the editor(s). MDPI and/or the editor(s) disclaim responsibility for any injury to people or property resulting from any ideas, methods, instructions or products referred to in the content. |
© 2024 by the authors. Licensee MDPI, Basel, Switzerland. This article is an open access article distributed under the terms and conditions of the Creative Commons Attribution (CC BY) license (https://creativecommons.org/licenses/by/4.0/).