Article

Organic Pollutants Removal in a Hybrid Constructed Wetland Wastewater Treatment Plant with an Aeration System

by
Michał Marzec
1,
Agnieszka Listosz
1,
Arkadiusz Malik
1,
Mariusz Kulik
2 and
Krzysztof Jóźwiakowski
1,*
1
Department of Environmental Engineering and Geodesy, University of Life Sciences in Lublin, Leszczyńskiego St. 7, 20-069 Lublin, Poland
2
Department of Grassland and Landscape Planning, University of Life Sciences in Lublin, Akademicka St. 15, 20-950 Lublin, Poland
*
Author to whom correspondence should be addressed.
Water 2024, 16(7), 947; https://doi.org/10.3390/w16070947
Submission received: 18 February 2024 / Revised: 14 March 2024 / Accepted: 22 March 2024 / Published: 25 March 2024
(This article belongs to the Section Wastewater Treatment and Reuse)

Abstract

:
This study presents the efficiency of TSS and organic pollutants (BOD5 and COD) removal in a hybrid constructed wetland wastewater treatment plant (VF-HF type) with an aeration system. This study was conducted over 6 years (2017–2022) in a facility with a capacity of 4.5 m3/day located in southeastern Poland and designed to treat real domestic wastewater from a school building. The studied facility consists of a three-chambered septic tank, a pumping station with an aeration system, and two beds with vertical and horizontal flow planted with giant miscanthus and willow. As a result of artificial aeration, the dissolved oxygen concentration in wastewater after mechanical treatment increased significantly, by an average of 1.18 mg O2/L, and was negatively correlated with wastewater temperature. The cumulative pollutant removal effects of the treatment plant (primary settling tank + VFCW + HFCW) were 81% for TSS, 98% for BOD5, and 89% for COD. There was no statistically significant effect of aeration on the organic pollutant removal effects in the VF bed, and such an effect was found for the temperature of wastewater entering the VF bed. The TSS, BOD5, and COD removal effects in the VF bed and BOD5 in the VF-HF system were positively correlated with air temperature. The technological reliability of the treatment plant was 98% for TSS and 100% for BOD5 and COD. The use of artificial aeration of wastewater makes it possible to achieve high organic pollutant removal efficiency in SSF CWs and to compensate for limitations due to the reduction in the area of constructed wetland beds.

1. Introduction

Constructed wetlands (CWs) are engineered systems that treat wastewater using natural processes [1]. Various pollutants, including organics, can be removed in CWs through a complex, interconnected system of plants, media, water, and microorganisms [2,3,4,5]. Compared to conventional wastewater treatment technologies, CWs have low operating costs and high resistance to changes in process conditions, including hydraulic loading and pollutant loadings [4,6,7,8,9,10]. CWs are considered an environmentally sustainable, socially acceptable, cost-effective wastewater treatment technology and a favorable alternative for minor- and medium-scale domestic wastewater treatment [11,12,13,14].
CWs for wastewater treatment are classified into two types, with surface (FWS) and subsurface (SSF) wastewater flow [3,4,5]. Pollutant removal mechanisms in SSF CWs are quite complex and include physical processes such as precipitation, filtration, volatilization, and biochemical processes induced by plants and wetland microorganisms. Microbial degradation is the dominant process for removing organic matter and other pollutants [1,15,16,17].
The degradation of organic pollutants in CWs, in addition to temperature, wastewater quality, and substrate properties, is decisively influenced by dissolved oxygen (DO) content [4,17,18,19,20]. Its increase determines the activity of microorganisms, thus accelerating the process of organic degradation [4,17,18,20], while a decrease in oxygen availability, especially in highly polluted wastewater, is one of the main factors limiting the removal of pollutants [11]. The degradation of organic pollutants is considered a preferential process from the point of view of oxygen consumption over nitrification, so most of the oxygen is preferentially consumed during organic degradation, which may reflect negatively on the rate of oxidation of nitrogen compounds [21].
In SSF CWs, the oxygen demand exerted by incoming wastewater generally exceeds the amount of oxygen available in the system [17]. For oxygen to be available for pollutant oxidation processes, it can be transferred into the wastewater or to the surface of the biofilm. The main pathways for oxygen transfer in SSF CWs are atmospheric diffusion, plant-mediated oxygen transfer, and convective airflow in the pore space of the medium [17,18].
Atmospheric diffusion in SSF CWs with the horizontal flow (HSSF-CW) is hampered by the fact that air must pass through a layer of unsaturated gravel and leaf litter before reaching the water surface, and the surface area of the air-water interface is severely limited due to the presence of sand or gravel in the substrate. Additionally, the actual rates of plant-mediated oxygen transfer are not high enough to meet the demand exerted by pretreated domestic wastewater under typical loading conditions [18,22].
The limited oxygen transfer capacity of conventional systems with HSSF-CWs has led to the development of alternative design configurations that improve oxygen transfer to the subsurface zone. These include unsaturated vertical-flow (VSSF-CW) systems that take advantage of intermittent wastewater metering and frequent wastewater level fluctuations [18,23,24,25,26]. Connecting VSSF-CW units in series with the upward and downward flow can accelerate diffusion and oxygen transfer. It leads to a gradient of physical, chemical, and biological conditions conducive to microbial growth and reproduction, resulting in high removal efficiency of nutrients and organic pollutants [27,28,29]. Against the background of these solutions, artificial aeration of the substrate or wastewater is considered the most effective way to supply oxygen and increase the efficiency of SSF CWs [11,30]. Studies of such solutions using continuous and intermittent aeration are gaining increasing attention in the literature and engineering practice. This is especially true for HF CW systems, which tend to be more limited in terms of oxygen availability due to the permanent water backing up in the filter bed [22]. According to a study by Nivala et al. [31], it is possible to achieve higher carbon removal rates in aerated HF-CWs systems than in non-aerated systems, even by more than 20%. Comparing the treatment efficiencies of several HF-CW systems working in parallel, these authors showed that all aerated systems achieved up to 99% removal of TSS and BOD. Removal efficiencies of more than 90% for suspended solids and organic COD pollutants were demonstrated by Pascual et al. [32] and Aguilar et al. [33] in studies of aerated HF-CW systems. Lower removal potential for these pollutants (around 65%) was found in their studies by Ugetti et al. [34] and Xu et al. [35]. Far fewer studies refer to VF-CW and aerated VF-HF CW hybrid systems. They show that artificially supplying oxygen to the beds does not significantly improve the removal effects of organic pollutants [31,33].
In most of the CWs described above, aeration is realized by introducing oxygen into the beds. The aeration capacity (oxygen transfer efficiency) is relatively low in them for reasons such as the distribution of aerators, and the impeded mixing of water due to the presence of porous material [22]. Furthermore, the cited studies were conducted at laboratory scales or pilot facilities. There is a lack of studies on operating aerated CWs at full technical scale [31,32,34]. Also, in Poland, CWs are usually built as classical, non-aerated systems [9,24,36,37,38].
Given the above, it was decided to conduct this study in a two-stage VF-HF CWs system, in which oxygen is introduced directly into the wastewater before it is fed to the vertical flow bed. Wastewater aeration in this system is carried out ad hoc, in conjunction with the wastewater pumping cycle to the VF bed. The facility was built next to a school building based on the concept of the article’s authors. This study was conducted under actual conditions, at full technical scale, during many years of facility operation.
This study aimed to analyze the efficiency and reliability of total suspended solids and organic pollutant removal, as well as the process’s aeration efficiency and energy intensity. In addition, this study was intended to show whether aeration of wastewater can contribute to high organic pollutant removal performance in VF-HF CW at higher hydraulic bed loading.

2. Materials and Methods

2.1. Characteristics of the Experimental Facility and Test Conditions

The analyzed treatment plant is located in Poizdów, Poland (51°37′48.9″ N 22°20′46.8″ E) and has been operating since 2016. The facility is designed to treat domestic wastewater from the building of the School Complex in Poizdów and periodically also wastewater brought by septic tankers from no-outflow tanks. The designed capacity of the treatment plant is 4.5 m3/d [39].
The treatment plant process line includes a primary settling tank, a pumping station with an aeration system, and a soil–plant beds system with vertical (VF) and horizontal flow (HF) (Figure 1 and Figure 2). Wastewater from the school building flows into the three-chamber primary settling tank with an active capacity of 8.64 m3. From the settling tank, wastewater flows by gravity to a pumping station with an active capacity of 1.4 m3. A wastewater aeration system was installed in the pumping station and included a Hiblow HP-120 membrane blower (Techno Takatsuki, Osaka, Japan), an Akwatech HD 340 disk diffuser (AKWATECH SYSTEMS, Poznań, Poland), and technical hoses. At the pumping station, the wastewater is oxygenated and then pumped by a WQ 450F pump (Omnigena, Swiecice, Poland) to a bed of vertical flow (VF) wastewater. The duty cycle of the blower and pump depends on the level of wastewater in the pumping chamber and is based on signals from float sensors. The setting of the float sensors ensures almost simultaneous startup and shutdown of both devices. In the VF bed, wastewater flows vertically down and then flows by gravity to the HF bed (Figure 1 and Figure 2).
The first bed, with a vertical flow of wastewater (VF), has an area of 70 m2 and a depth of 0.8 m, and the second bed, with a horizontal flow (HF), has an area of 70 m2 and a depth of 1.2 m. The beds were isolated from native soil with a 1 mm thick PEHD waterproofing geomembrane. The VF and HF beds were filled with a layer of sand with a grain size of 1–6 mm. The bed with the vertical effluent flow was planted with giant miscanthus (Miscanthus x giganteus Greef et Deu.), while the bed with the horizontal flow was planted with willow (Salix viminalis L.). On the outflow from the HF bed, a tilting pipe is installed to regulate the level of wastewater in this bed. Treated wastewater is discharged into the ground via an infiltration pond [39]. The technological system also used a filter with a sorption material for phosphorus removal (Figure 1 and Figure 2), but it was not studied.
The school building is supplied with water from the collective water supply system. There are toilets for students and staff equipped with toilet bowls and urinals with flushable water, and washbasins with cold water. The institution has a canteen, except meals are prepared outside the building. There is no so-called nonreturnable water consumption in the building, i.e., the water used in the building is practically all sent as domestic sewage to the sewage treatment plant. During the study period, approximately 160 students attended the school each year, and the number of school employees was 30. The amount of wastewater inflow to the wastewater treatment plant was determined based on readings from a water meter installed in the school building and the average water consumption calculated from them.
The average 24 h wastewater inflow to the treatment plant during a typical period was approximately 3.8 m3. The average hydraulic loading of the bed with vertical flow VF (70 m2) was approximately 0.054 m3/m2∙d (54 mm/d). The theoretical retention time of wastewater, determined based on the parameters of the beds (horizontal dimensions, porosity of the bed-filling material, and height of the layer filled with wastewater) and the average daily inflow of wastewater [40], was 1.1 d for the VF bed and 5.9 d for the HF bed.
The meteorological conditions were characterized based on data from the Automatic Meteorological Station “Klimaks” in Sosnowica, located in the same region. During the research period, a temperate climate with continental influences was typical. The highest total precipitation and average air temperatures were recorded in the growing season (April–October) (Figure 3). Average air temperatures in the summer months (June–August) reached 19.7 °C, while in the winter months (December–February) they ranged from −1.0 °C to 1.0 °C. On average, the highest monthly rainfall sums were recorded in summer—in July (87 mm), and the lowest in winter—in March (24 mm) (Figure 3). Analyzing annual rainfall in the years 2017–2022, it should be stated that they were characterized by very high variability. The years 2018, 2021, and 2022 were close to normal, i.e., average annual precipitation fluctuated around the long-term average from 1985 to 2016 (532 mm). In turn, 2019 was a dry year (80% of normal), while 2020 was very wet (137% of normal). In turn, based on average annual air temperatures compared to the average from the multiannual period 1985–2016 (8.5 °C), a higher average annual air temperature was observed in all years, except for 2021. The year 2017 (average annual air temperature—9.4 °C) was warm, while the years 2018 (10.0 °C), 2019 (10.5 °C), and 2020 (10.0 °C) were very warm (Figure 4) compared to the multi-year average.

2.2. Analytical Methods

The removal of organic pollutants from wastewater at the subject treatment plant was analyzed based on test results collected in 2017–2022. Wastewater samples for analysis were taken at a frequency of once a month at four points of the treatment plant: S1—raw wastewater flowing into the first chamber of the primary settling tank; S2—mechanically treated and aerated wastewater, S3—wastewater flowing out of the VF-type bed with giant miscanthus, and S4—wastewater flowing out of the HF bed with willow (Figure 1). A total of 55 measurement series were performed. The course of wastewater sampling considered weather conditions to minimize their influence on the results obtained.
Temperature, pH, dissolved oxygen concentration (DO), total suspended solids (TSS), biochemical oxygen demand (BOD5), and chemical oxygen demand (COD) were determined in wastewater samples. Dissolved oxygen concentration and pH were determined using an ORION Star A329 Set meter (Thermo Scientific, Waltham, MA, USA). BOD5 was determined by the dilution and inoculation method with allylthiourea based on the measured dissolved oxygen concentration immediately after sampling and after 5 days of incubation. COD was determined by the photometric method using tube tests. Measurements were made with a NANOCOLOR® UV–VIS spectrophotometer (Macherey-Nagel, Düren, Nordrhein-Westfalen, Germany) after oxidation of the samples at 148 °C for 2 h. Total suspended solids were determined by the weight method using filtration through 65 g/m2 paper filters. The sampling, transport, and processing of samples and their analysis were performed following Polish standards [41,42,43,44,45], which are in accordance with the American Public Health Association (APHA) [46].

2.3. Statistical Analysis

Based on the results, basic statistics were determined for the analyzed pollutant indicators and treatment stages, including mean, minimum, and maximum values, medians, standard deviations, and coefficients of variation. In addition, the relative frequency of characteristic pollutant levels in mechanically treated wastewater entering the biological stage (VF-HF) was determined. The number of class intervals and their range for each pollutant indicator was chosen to make the frequency distribution as detailed as possible without affecting the transparency of the statistical set structure [47].
Based on the average values of pollutant indicators in the influent (Cin) and effluent from the beds (Cout), the average pollutant removal efficiency (BOD5, COD, and TSS) was calculated according to the formula:
η = 100 1 C o u t C i n   [ % ]
The relationships between the efficiency of removal of pollutants from wastewater in the VF bed and the concentration of oxygen in the wastewater fed to the VF bed, as well as the effects of pollutant removal and air temperature, were subjected to statistical analysis. As a first step, the normality of the distributions of the variables under study was tested using the Shapiro–Wilk test. A nonparametric Spearman rank correlation analysis was performed since the data did not follow a normal distribution.
The effectiveness of the applied wastewater aeration system was statistically verified using the nonparametric Wilcoxon paired-order test for dependent samples. The effect size of wastewater aeration was determined based on the Z parameter and the number of observations and then evaluated according to Cohen’s terminology [48].
A reliability assessment of technological wastewater treatment plants was carried out for fundamental pollutant indicators (TSS, BOD5, and COD) using elements of Weibull reliability theory. The Weibull distribution is a practical general probability distribution that applies to the study of reliability and assessment of the risk of exceeding limit values of pollutant indicators in treated wastewater [49]. The following probability density function characterizes it as follows:
f   ( x ) = c   b   ·   x θ b   c 1 · e   x θ c b
where x—a variable describing the concentration of a pollution parameter in the treated effluent, b—scale parameter, c—shape parameter, θ—position parameter, and e—constant (2.71828…), assuming: θ < x, b > 0, c > 0.
Reliability analysis was carried out separately for each indicator, considering the indicators’ values in the treated wastewater flowing out of the HF bed with willow wilt (n = 55). The analysis consisted of estimating the parameters of the Weibull distribution using the maximum likelihood method and verifying the null hypothesis that the Weibull distribution can describe the variable under analysis. Verification was performed with the Hollander–Proschan test at the 0.05% significance level.
Reliability was determined from the distribution on the graphs, taking into account the normative values of the indicators, as specified in the Regulation of the Minister of Maritime and Inland Navigation [50] for wastewater discharged from wastewater treatment plants up to 2000 PE: TSS—50 mg/L, BOD5—40 mgO2/L, and COD—150 mgO2/L. The reliability levels obtained were interpreted as the percentage of time that the expected pollutant concentrations in the treated wastewater were following accepted standards or treatment goals [49,51].
Analyses were performed using Statistica 13.3.

3. Results and Discussion

3.1. Composition of Treated Wastewater

The results of tests on raw wastewater at the buffer tank outflow, mechanically treated wastewater after aeration, and biologically treated wastewater in a vertical flow (VF) and horizontal flow (HF) bed were used to evaluate the efficiency of removal of organic pollutants, expressed in terms of BOD5 and COD and TSS. The characteristic values of each pollutant indicator are given in Table 1.
During the study period, the hydraulic load of the treatment plant was lower than that assumed in the design [39]. The average 24 h amount of wastewater flowing into the facility oscillated between 3.5 m3/d in 2022 and 4.1 m3/d in 2018 (Figure 5). An exceptional year in terms of hydraulic loading of the treatment plant was 2020. The average 24 h amount of wastewater flowing into the treatment plant was 1.7 m3/d, which resulted from restrictions imposed on schools’ operations in connection with the coronavirus pandemic (COVID-19).
The average values of the analyzed indicators in the raw wastewater (S1) were 114 mgO2/L for BOD5, 319 mgO2/L for COD, and 106 mg/L for TSS (Table 1). At the same time, they showed a considerable variation, as the maximum values for BOD5 occasionally exceeded 300 mgO2/L and COD—900 mgO2/L (Table 1). This had to do with the fact that during vacations and longer school breaks, the treatment plant was periodically supplied with wastewater delivered by slurry trucks from nondrainage tanks, usually characterized by a high concentration of pollutants compared to fresh wastewater from the school building. This method of wastewater supply was adopted to compensate for the water shortage for vegetation in the soil–plant beds caused by the reduction in wastewater inflow from the school building and high air temperatures.
Compared to data reported in the literature for typical domestic wastewater in Poland, the concentration of pollutants in wastewater entering the treatment plant was low [52,53]. This is directly related to the origin of the wastewater. The composition of wastewater from public buildings, including schools, differs from that of residential buildings. Bugajski [54], analyzing the quality of raw wastewater in two schools in southern Poland, noted the magnitude of BOD5 at an average of 264 and 173 mgO2/L. The average COD in these wastewaters was 514 and 424 mgO2/L, respectively, and the concentration of TSS was 254 and 183 mg/L [54]. Against this background, the concentration of the analyzed pollutant indicators at the Poizdów treatment plant was low. The rationale for this state is the absence of impurities associated with food preparation in the total volume of wastewater.
Raw wastewater flowed into a three-chamber primary settling tank and then flowed to the pumping station, where it was artificially aerated before entering the biological stage (VF-HF hybrid soil–plant bed system). Mechanically treated wastewater after aeration (measuring point S2) had slightly lower concentrations of organic pollutants and TSS than raw wastewater (measuring point S1). The most noticeable changes were recorded in the concentration of TSS; its average content decreased to 65.74 mg/L, while the median was 36 mg/L (Table 1). This indicator showed the most significant value variation at this measurement point (Cv = 116). The recorded values oscillated from more than 9 to approximately 347 mg/L, with nearly 60% of the recorded values not reaching the limit of 50 mg/L (Figure 5), and more than 30% were 50–150 mg/L. Values exceeding 250 mg/L accounted for less than 8% of the total results.
The average value of BOD5 in the wastewater at S2 was 101 mgO2/L, with a median of 100.0 mgO2/L. Approximately 88% of BOD5 values oscillated between 50 and 150 mgO2/L (Figure 5). Slightly more than 5% of the results exceeded 150 mgO2/L, while approximately 7% were low values, in the 0–50 mgO2/L range.
The mean COD value was 256 mgO2/L, and the median was 231 mgO2/L. All COD values exceeded the level of 100 mgO2/L. More than half of the recorded results were between 200 and 300 mgO2/L, approximately 22% exceeded 300 mgO2/L, and the remaining 25% oscillated between 100 and 200 mgO2/L (Figure 5).
The BOD5 and COD indices showed average variability, although it should be noted that there was a significant amplitude of values (Table 1). As in the case of raw wastewater, the extreme maximum values of BOD5 and COD may have been decisively influenced by wastewater delivered by slurry trucks.
Analysis of the BOD5 and COD ratios indicates the low susceptibility of mechanically treated wastewater to biological decomposition. In the wastewater flowing into the VF bed, the average BOD5/COD ratio was 0.41, with a very similar median of 0.42. It was significantly lower than those reported in the literature for raw or pretreated domestic wastewater [55,56]. This result indicates a high proportion of hard-to-degrade organic compounds, which may have affected the removal rate of organic pollutants at the biological stage. The unfavorable composition of wastewater resulting from the BOD5/COD ratio may have been related to the presence of a buffer tank, in which the initial sedimentation of biodegradable pollutants in solid or suspended form took place.
The composition of wastewater entering the VF-HF system showed high variability between the years of this study. The highest concentrations were recorded in the early period of this study (2017), which was related to the higher frequency of wastewater delivery from nondrainage tanks. At that time, the average concentration of TSS exceeded 208 mg/L, BOD5 was 153 mgO2/L, and COD was 433 mgO2/L. It was reflected in the pollutant load of the VF bed surface, with TSS close to 12 g/m2∙d, BOD5—9 g/m2∙d, and COD—25 g/m2∙d (Figure 6). During this period, the average load of organic pollutants expressed by COD on the VF bed was higher than the level recommended for Polish conditions by Gajewska [57]. In the following years, the load of the treatment plant was almost exclusively domestic wastewater flowing from the school building, except during holiday periods, when the delivery of wastewater was necessary due to the condition of plants on the soil–plant beds. From 2018 to 2022, the average annual concentrations of total suspended solids in mechanically treated wastewater were 50 mg/L; only in 2020 did the average exceed the 100 mg/L limit. During the same period, the magnitude of BOD5 took average values of 100 mgO2/L; in 2020, it dropped to approximately 50 mgO2/L. The average annual COD volumes oscillated between 200 and 250 mgO2/L, with the lowest value found to be similar to BOD5 in 2020. The marked decrease in the concentration of organic pollutants (BOD5 and COD) in 2020 was due to the peculiarities of school operations during the coronavirus pandemic. Due to the suspension of teaching activities, the school building mainly generated wastewater related to cleaning work, while there was a smaller share of fecal wastewater, for example. During this period, the unit area load of the VF bed stabilized at a lower level (Figure 6). The average for the entire study period of the VF bed loading of TSS was 4.01 g/m2∙d, BOD5—5.43 g/m2∙d, and COD—13.84 g/m2∙d (Figure 6). These were slightly lower than those recorded at other sites in Poland [38,58]. However, it is worth noting that in the cited cases, the wastewater came from residential buildings, which firmly determined its composition [38].
An important parameter from the point of view of the analysis in question is the content of dissolved oxygen in the treated wastewater. It determines the proper course of degradation processes of organic pollutants in CWs [19,20]. The technological system of the facility used a system of aeration of mechanically treated wastewater before its introduction to a system of two soil–plant beds. The main idea behind this solution was to enrich the wastewater with oxygen and improve the biochemical transformations at the biological stage. According to many authors, such a solution can compensate for the reduced surface standards of soil–plant beds [22]. According to Gajewska [57], the minimum area of a VF bed in two-stage VF-VF systems in Poland should be within 2–3 m2 per capita (PE). The treatment plant in Poizdów was designed for an inflow of wastewater corresponding to 45 PE. According to the recommendations, the VF bed area should be at least 90 m2.
In the wastewater flowing into the settling tank (S1), the average dissolved oxygen content was 0.88 mgO2/L, with a similar median (Table 1). The average dissolved oxygen content of wastewater pumped from the pumping station to the soil–plant bed with the vertical flow (VF) was 2.06 mgO2/L, indicating a significant increase over raw wastewater. The increment varied quite slightly. On average, it was 1.18 mgO2/L; however, it exceeded 5 mgO2/L in extreme cases. There was also an occasional decrease in dissolved oxygen content compared to raw wastewater (Figure 7). One factor that may have affected the solubility of oxygen in wastewater is the temperature [18]. Spearman’s rank order correlation analysis showed a negative correlation between the increase in oxygen concentration in aerated wastewater (Δ DO) and its temperature—the lower the wastewater temperature, the more significant the increase in dissolved oxygen content in wastewater due to aeration (Figure 8). The magnitude of the correlation coefficient (rS = −0.4486) indicates a moderate relationship, and the p-value (0.000593) confirms its statistical significance (p < 0.05).
Analysis of the data, including the oxygen content of wastewater flowing into the primary settling tank (S1) and subjected to aeration (S2) by the Wilcoxon paired-order test, showed that the difference between these parameters is statistically significant (p < 0.05) (Table 2).
The magnitude of the effluent aeration effect at the pumping station was determined based on the Z parameter (Table 2), and the number of observations (n) was 0.690. According to Cohen’s guidelines [48], it should be considered average (>0.5). The effect can be attributed to the artificial aeration of wastewater as it is pumped to the bed with the vertical flow. This simple solution is based on mechanical devices controlled by float sensor signals, limiting its unreliability. At the optimum pressure level, the blower provides a capacity of approximately 120 L/min [59]. With a power of 120 W, it also has low energy consumption. During the 6 years of operation, the unit energy consumption for each m3 of treated wastewater was 0.47 kWh at the treatment plant, driven by the operation of a membrane blower and wastewater pumps. After considering the power of the installed equipment, the energy consumption attributable solely to the operation of the membrane blower oscillated between 0.05 and 0.10 kWh for each m3 of treated wastewater. These data indicate that the system’s energy efficiency is high compared to traditional wastewater treatment methods. According to some reports, the specific energy consumption for treating 1 m3 of wastewater in municipal activated sludge treatment plants can range from 0.128 to 2280 kWh, with an average of 0.903 kWh/m3 [60]. On the other hand, Gu et al. [61] estimated the electricity demand of different types of wastewater treatment plants at 0.6–0.8 kWh/m3 for activated sludge plants and about 0.5 kWh/m3 for sparged filters. It is worth mentioning that these data refer to facilities with a high throughput (about 5000 m3/d), and as a rule of thumb, unit energy consumption increases as the capacity of the facilities decreases [60,61].
In the bed with the vertical effluent flow (VF), the magnitude of pollutant indicators decreased significantly. The average content of TSS at the bed outflow (measuring point S3) was 17.57 mg/L, and the median was 13.00 mg/L (Table 1, Figure 9). The range of recorded values was high, with occasional results exceeding 50 mg/L. As at earlier stages, suspended solids concentrations showed the most significant variability among the analyzed pollution indicators. At point S3, this may have been due to higher amounts of mineral-suspended solids carried away with the wastewater. A leaching effect was likely with high doses of one-time wastewater flowing into the bed. The average BOD5 in the effluent flowing from the VF bed was 6.87 mgO2/L, with a median of 5.0 mgO2/L. The recorded values did not exceed the level of 25 mgO2/L, which means that at the first stage of biological treatment, the Poizdów treatment plant ensured that the standard for BOD5 specified in the project [39] and in the applicable legal acts [50] was met. The average COD at measuring point S3 was 50.68 mgO2/L, and the median was 43.0 mgO2/L. As in the case of BOD5, the recorded values in no case exceeded the limit specified for treated wastewater [39,50].
In the wastewater discharged from the VF bed, the BOD5/COD ratio decreased significantly. The average ratio of the ratios was 0.13, and the median was 0.12. Such a result directly results from the processes in the VF bed. It indicates that easily decomposable organic matter underwent rapid mineralization, while compounds resistant to aerobic decomposition remained in the composition of wastewater in an increased proportion.
The results presented here indicate favorable conditions for mineralizing organic matter in a bed with a vertical flow (VF). Oxygenic decomposition of organic carbon occurs here due to aerobic chemoheterotrophic bacteria, which have a rapid metabolic rate [57,62]. In the treatment plant in question, the metabolic transformation may have been further intensified by the higher oxygen availability of the wastewater at the distribution stage to the surface of the VF bed. In addition, the diffusion of oxygen and the subsequent increase in oxygen content were influenced by pulsed wastewater dosing and the nature of the flow in the bed [3,23]. The average dissolved oxygen content in wastewater from the bed with vertical flow was 3.69 mgO2/L (Table 1, Figure 9). A comparison of the range of values at S2 and S3 points to greater stability of the oxygen diffusion process caused by the nature of the bed flow than by artificial aeration of the wastewater.
HF beds in hybrid systems are expected to optimize pollutant removal, mainly due to anaerobic and hypoxic conditions [3]. The biological decomposition of organic matter, with the participation of anaerobic microorganisms, occurs much more slowly and takes approximately 20 times longer than aerobic decomposition [63]. Nevertheless, anaerobic decomposition is necessary to remove some organic compounds, especially those resistant to aerobic decomposition [57,64].
The average TSS content in the effluent discharged from the HF bed was 12.08 mg/L, and the median was 6.0 mg/L. Additionally, at this stage of treatment, the TSS values showed high variability, and occasionally values exceeding the permissible level for treated wastewater, defined by the project and legal acts as 50 mg/L [39,50], were recorded.
The mean value of BOD5 was 1.96 mgO2/L, and the median was 1.50 mgO2/L (Table 1, Figure 9). The COD values were 26.46 mgO2/L and 25 mgO2/L, respectively. The magnitudes of BOD5 in no case exceeded 10 mgO2/L, and COD exceeded 80 mgO2/L, and by a wide margin met the requirements specified in the applicable legal acts for treatment plants of this size (Figure 9) [50]. The oxygen content of the treated effluent in the HF bed remained high, having dropped by an average of 0.55 mgO2/L, or approximately 15%, compared to the S3 point.
The mean BOD5/COD ratio and median were 0.04, indicating that the compounds expressed as BOD5 were removed almost entirely at the biological stage.

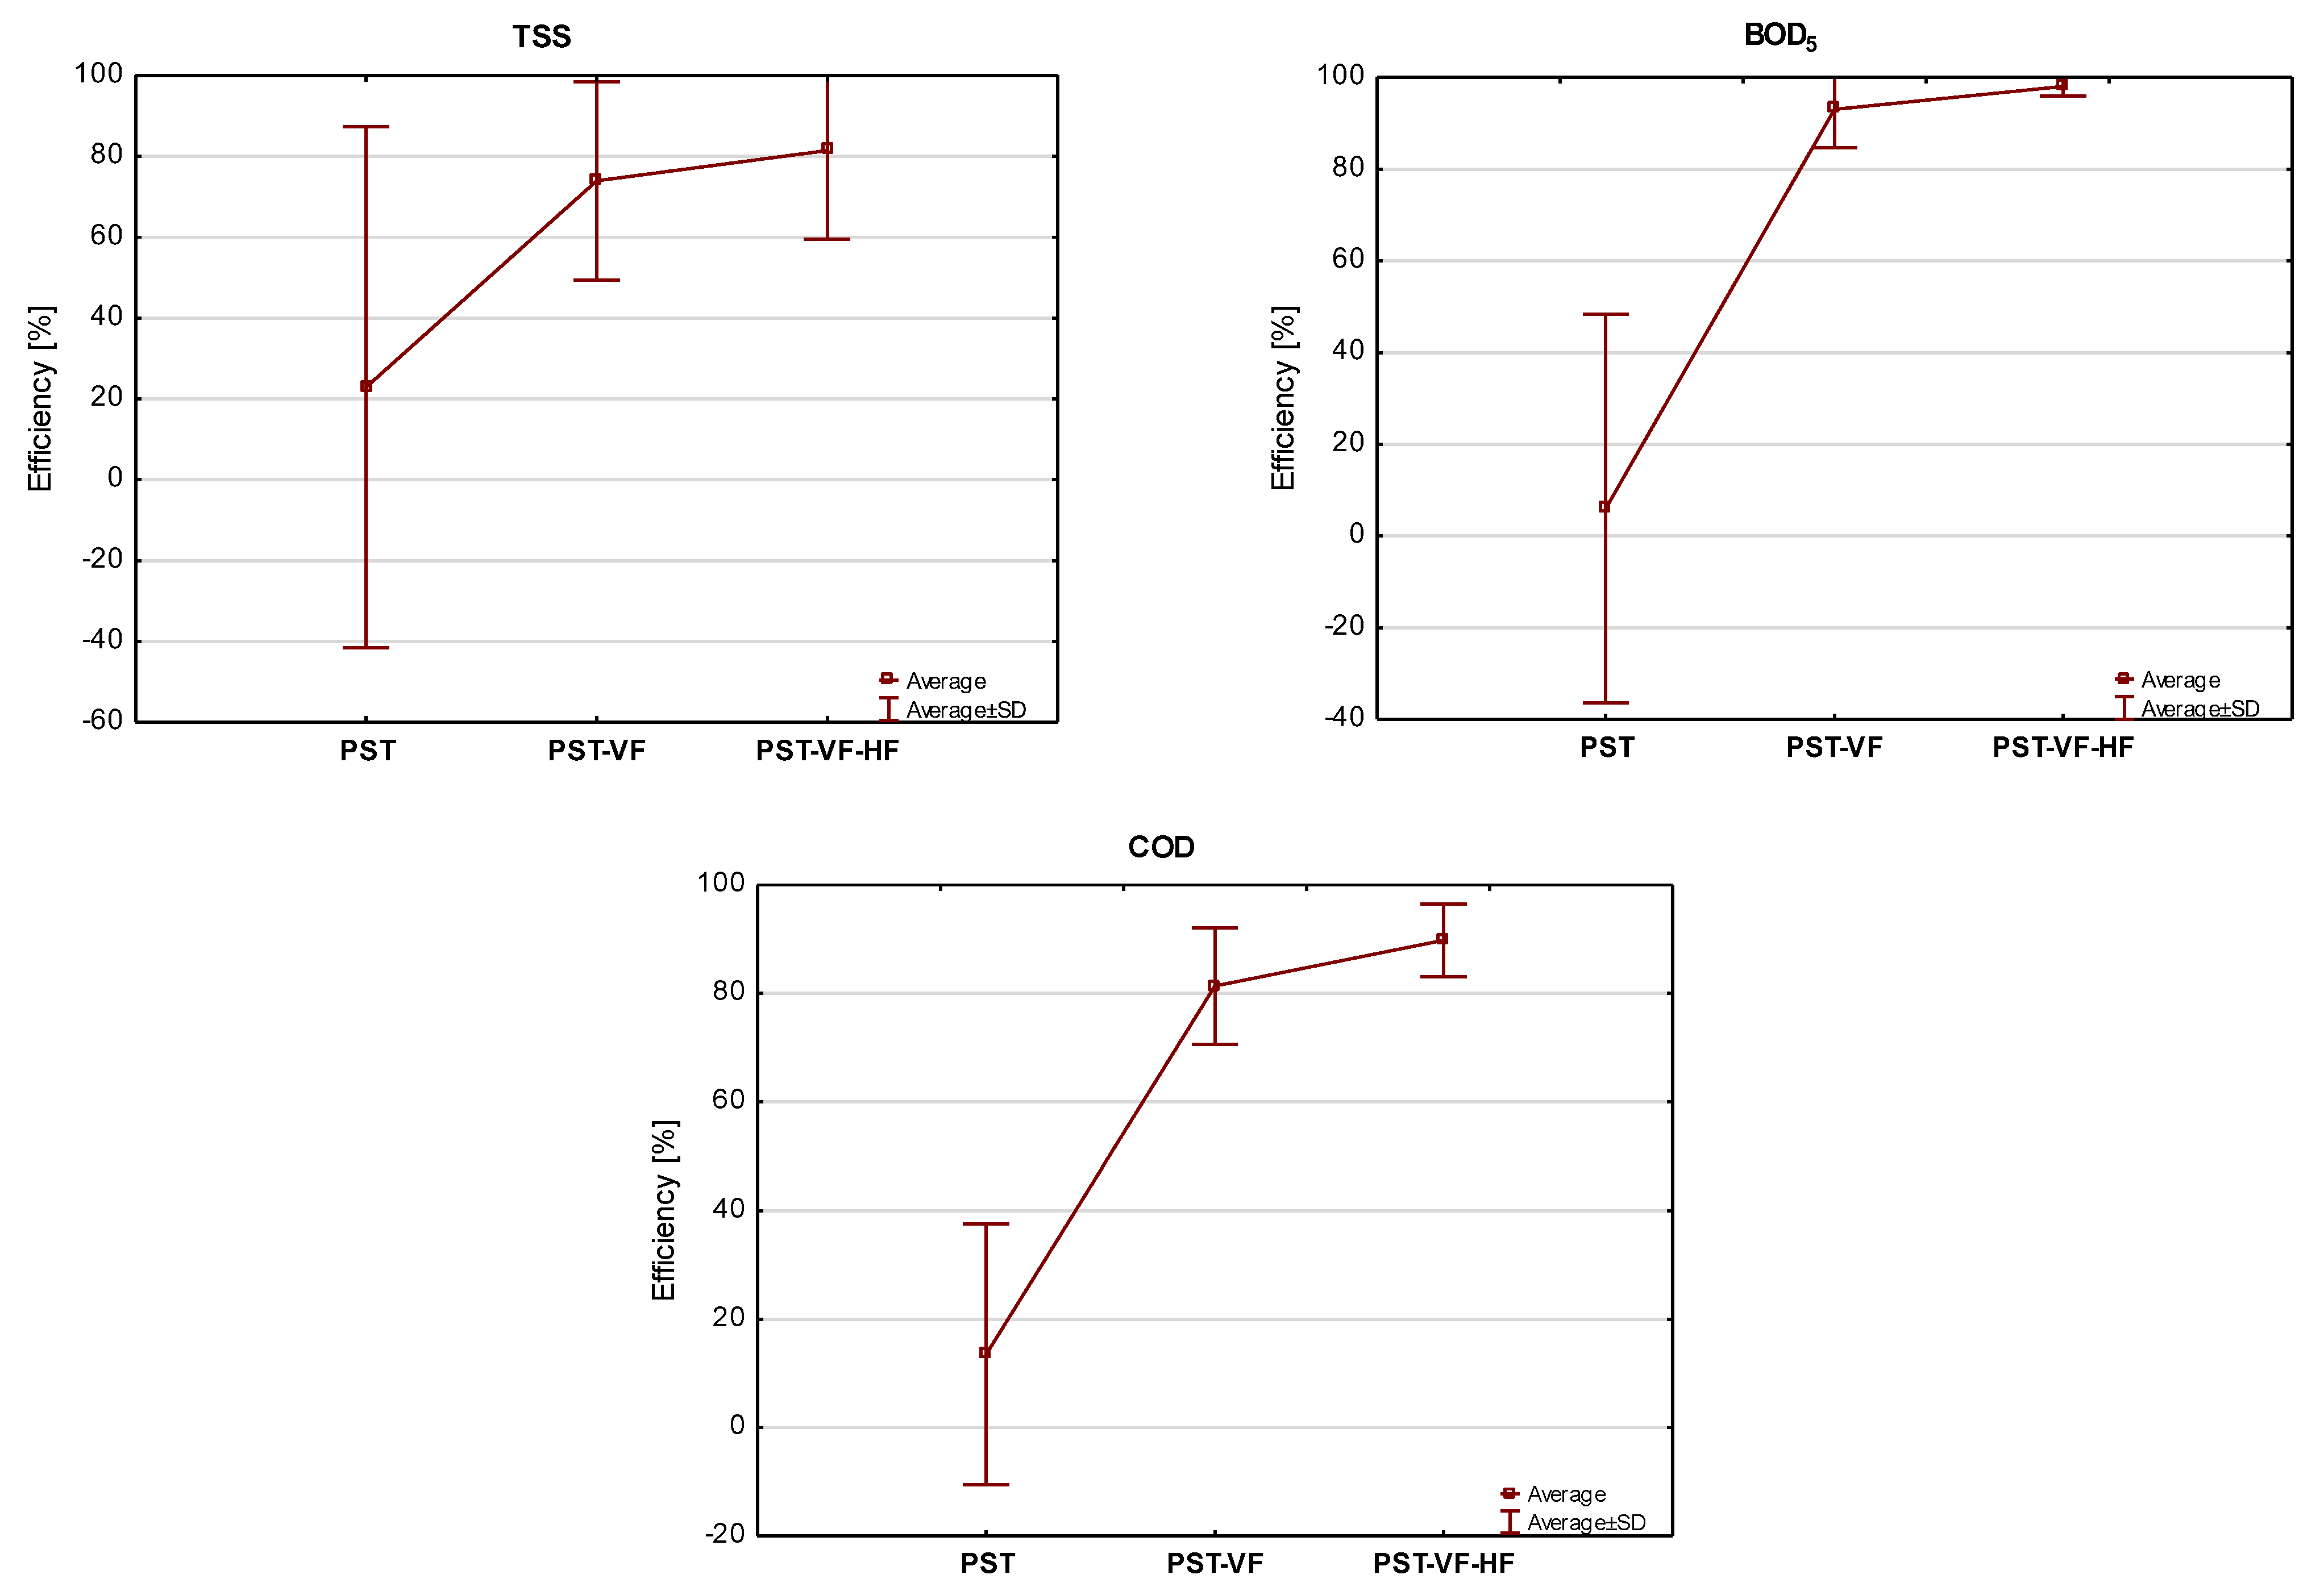
3.2. Efficiency of Pollutant Removal

The study results indicate that the Poizdów WWTP is highly effective in removing organic pollutants and TSS. The pre-settling tank was shown to have little effect on reducing the analyzed pollutants. Its efficiency for TSS removal exceeded 20%; for BOD5 and COD, it was 6% and 13%, respectively (Figure 10).
There was a marked decrease in contaminant concentration in the VF bed. The cumulative efficiencies, including treatment in the primary settling tank and vertical flow (VF) bed, increased to approximately 75% for TSS, 93% for BOD5, and 82% for COD. The average effects determined only for the VF bed were TSS—57.1%, BOD5—93.0%, and COD—78.7%.
The results are not significantly different from those recorded in nonaerated systems with subsurface wastewater flow. Studies conducted under similar climatic conditions show that the efficiency of operation of traditional VF beds (without aeration) can be in the range of 86–98% [65,66] concerning BOD5, while the efficiency of reducing COD can vary from 79 to 94% [6,67]. Marzec et al. [38] in a VF bed with giant miscanthus without aeration under similar climatic conditions obtained slightly higher results (TSS averaged 86.9%, BOD5—96.6%, and COD—94.8%) but at four times lower hydraulic loading (12.5 mm/d). High hydraulic loading results in shorter contact time between wastewater and microorganisms forming a biological membrane on the filter material, which may limit the decomposition process of organic compounds [3].
Comparison of VF bed efficiency with other aerated beds yields inconclusive results. Nivala et al. [31] obtained a high degree of BOD5 reduction in aerated VF beds, in the range of 98%, higher compared to classical vertical flow beds. Wu et al. [68] showed that the efficiency of COD reduction in aerated VF beds could range from 93.6% to 99.3%, depending on the aeration time, with the efficiency increasing with increasing bed aeration time. In contrast, studies by Uggetti et al. [34] and Li et al. [13] have shown little effect of aeration, regardless of its nature (continuous or intermittent), on the effects of organic compound removal expressed in COD.
The results obtained can be considered satisfactory, considering the reduced area of the VF bed compared to the recommendations. The higher oxygen concentration may have influenced it due to, among other things, artificial aeration of wastewater in the pumping station. This thesis is not confirmed by statistical analysis. The low values of Spearman’s correlation coefficients indicate a weak relationship between the pollutant removal efficiency (TSS, BOD5, and COD) of the VF bed and the dissolved oxygen content of the wastewater fed to the bed (Table 3). According to the analysis results, the determined coefficients are statistically insignificant (p > 0.05).
On the other hand, the nonparametric Spearman rank correlation analysis showed a relationship between the removal effects of all contaminants and the temperature of wastewater entering the bed with the vertical flow (Table 4). According to the analysis results, increased wastewater temperature was accompanied by increased treatment effects (Figure 11). The magnitudes of the correlation coefficients indicate weak correlations (rS < 0.4), but they are nevertheless statistically significant (p < 0.05).
In the horizontal flow (HF) bed, the BOD5 value decreased on average by more than 70%, COD by approximately 50%, and TSS by approximately 30%. The lower treatment effects in the HF bed may have been caused by random factors related, for example, to the accumulation and decomposition of plant residues, temperature changes, and precipitation [37]. The influence of these factors on the recorded results may be all the more remarkable because the concentration of pollutants in the influent and treated wastewater in the HF bed was low. According to Obarska-Pempkowiak et al. [69], higher organic pollutant effects can be achieved in HF beds but at higher pollutant loadings. This is also confirmed by the study of Jóźwiakowski et al. [56], who, in a single-stage HSFCW system fed with pretreated domestic wastewater, obtained BOD5 reductions of 85%, COD reductions of 81%, and TSS reductions of 60%.
The cumulative pollutant removal effects for the entire facility (primary settling tank + VF + HF) were 81% for TSS, 98% for BOD5, and 89% for COD (Figure 10).
On the other hand, the efficiency of the VF-HF constructed wetland system as a result of the chemical composition of the mechanically treated wastewater (S2) and the wastewater discharged from the HF bed (S4) was 71.8% for TSS, 97.8% for BOD5, and 88.4% for COD. These effects are slightly lower or comparable to those obtained in other VF-HF systems operating under similar climatic conditions but without aeration [7,37,38].
Nonparametric Spearman rank correlation analysis showed correlations between contaminant removal effects at different biological treatment stages and air temperature. Significant correlations were found by analyzing the variation in treatment effects in the VF bed under different seasonal conditions. The correlation coefficients for TSS, BOD5, and COD removal effects were 0.2–0.4 and indicated a weak positive correlation. The determined coefficients were statistically significant (p < 0.05) in all cases (Table 5). The horizontal flow (HF) bed did not show a similar relationship. All correlation coefficients rS had low values and were not statistically significant (p > 0.05).
For the entire VF-HF system, air temperature strongly affected the achieved organic pollutant elimination effects expressed by the BOD5 index. A positive Spearman correlation coefficient indicates higher effects were recorded at higher air temperatures. The determined magnitude of the coefficient (0.6537) indicates a strong relationship, while the p-value confirms its statistical significance (p < 0.05) (Table 5). For TSS and COD, the correlation coefficients were low and not statistically significant.
The trends are consistent with the results of studies presented in the literature. Most authors confirm that the activity of microorganisms, and thus the effectiveness of CWs, especially concerning easily degradable pollutants expressed as BOD5, is higher during higher temperatures [3,70,71]. However, this is not the rule, as some studies conducted under temperate climate conditions indicate the absence of any relationship between the removal effects of pollutants expressed by the BOD5 index and air temperature [38,72]. It can be assumed that in the case of the WWTP in question, favorable thermal conditions favored the development of microbial structures that form a biofilm on the substrate particles, and the supply of additional oxygen provided with wastewater enhanced this effect [20]. With the greater availability of oxygen, the potential of microorganisms to hydrolyze organic compounds and utilize their products could be fully exploited. In this case, artificial aeration of the wastewater could offset the limiting effect of the oxygen deficit.

3.3. Technological Reliability

The technological reliability of a wastewater treatment plant, defined as its ability to dispose of the expected amount of wastewater to the degree required by the wastewater receiver, was determined using the Weibull method. First, the distribution parameters were estimated, and the null hypothesis that a Weibull distribution can describe empirical data was verified. The analysis used the values of the main pollutant indicators (BOD5, COD, and TSS) in the wastewater discharged from the VF-HF system to the receiver.
The null hypothesis was positively verified, and the goodness of fit of the obtained distributions was high at 70–90% at a significance level of α = 0.05 (Table 6).
The technological reliability of the wastewater treatment plant was determined based on distributor functions, taking into account the indicator limits specified in the Regulation of the Minister of Maritime and Inland Navigation [50] for wastewater treatment plants below 2000 PE (Figure 12).
According to the guidelines proposed by Andraka and Dzienis [51] for WWTPs below 2000 PE, the minimum level of technological reliability, considering the principles of inspection and evaluation of wastewater samples in Poland, should be 97.27%. It means these wastewater treatment plants, operating defectively for 9 days a year, still have a 95% chance of passing inspection procedures (α = 0.05).
The reliability of the tested object in removing TSS from wastewater was 98%. Based on this, it can be concluded that, on average, for 357 days a year, the treatment plant operated without failure, which means that the total suspended solids in the wastewater discharged to the receiver were below the limit value (50 mg/L). The facility provided the required level of technological reliability regarding removing total suspended solids and, with a risk level of α = 0.05, guaranteed positive passage of control procedures.
The technological reliability of the Poizdów constructed wetland treatment plant in terms of removing organic pollutants, expressed by the indicators BOD5 and COD, was 100% (Figure 12). This means that throughout the study period, the treatment plant operated without failure, and the values of the indicators in the treated wastewater in no case exceeded the permissible levels set by Polish law (40 mgO2/L and 150 mgO2/L, respectively). It gives grounds for the prediction that, with the operator’s risk at α = 0.05, the facility is guaranteed to pass the control procedures for BOD5 and COD indicators throughout the year. The determined reliability levels do not differ from those recorded in other nonaerated CWs using similar plant species operating under similar climatic conditions but with lower hydraulic loading [36,37,38].

4. Conclusions

This study analyzed the removal efficiency of the organic pollutants BOD5, COD, and TSS in a hybrid constructed wetland wastewater treatment plant of VF-HF type with an aeration system for wastewater flowing into the facility. So far, the results of studies on the operation of CWs with aeration realized by introducing oxygen into the beds are known from the literature, and these experiments were conducted mainly on a laboratory scale or in pilot facilities. Since there is a lack of research showing how hybrid CW systems are fed into which already aerated wastewater is fed, it was decided to take up this topic and conduct research in this area. Due to space limitations in the treatment plant, lower standards for the unit area of constructed wetland beds were applied. To compensate for the smaller area of the beds, a system of aeration of mechanically treated wastewater before entering the bed of VF type was used.
The results show that the concentration of pollutants in the wastewater flowing into the treatment plant was lower than that in typical domestic wastewater, which was directly related to the origin of the wastewater. The aeration system used significantly increased the oxygenation of wastewater flowing into the VF bed, with the magnitude of the increase in the oxygen content of the wastewater negatively correlated with its temperature. The aeration system has proven simple in operation and reliable due to the lack of electronic components and mechanical controls. No malfunctions were found under operating conditions. Another advantage of the system is its low energy consumption because it assumes short-term, ad hoc wastewater aeration. During the 6 years of operation, the unit energy consumption for each m3 of treated wastewater was 0.47 kWh. The energy consumption attributable solely to the operation of the membrane blower oscillated between 0.05 and 0.10 kWh for each m3 of treated wastewater and was clearly lower compared to wastewater treatment systems using conventional methods.
Despite the reduced bed area, the efficiency of the VF-HF system did not differ from classical systems (without aeration) operating under similar climatic conditions. Exceptionally high effects were recorded in the bed with vertical wastewater flow. Statistical analysis showed no significant relationship between the VF bed’s removal efficiency and the wastewater’s dissolved oxygen content flowing into the bed. Such a relationship was found between the efficiency of wastewater treatment in the VF bed and the temperature of the wastewater and air. It may suggest that artificial aeration of wastewater under favorable thermal conditions offsets the limitations associated with oxygen deficiency and allows the potential of microorganisms inhabiting the bed to decompose organic compounds to be exploited. Due to its high reliability in reducing BOD5, COD, and TSS, the studied WWTP guarantees the year-round achievement of pollutant index values at the outflow below the regulatory limits. Due to its simplicity, low failure rate, and energy consumption, the system described in the paper can be recommended for use, especially for constructed wetlands subject to high hydraulic and pollutant loading. The ad hoc aeration of wastewater during distribution to constructed wetland beds can compensate for the limitations of reducing their surface area.

Author Contributions

Conceptualization, M.M.; Methodology, M.M. and A.L.; Investigation, M.M., A.L. and M.K.; Writing—original draft, M.M.; Data curation, A.L., A.M. and M.K.; Validation, K.J.; Formal analysis, K.J.; Writing—review and editing, K.J. All authors have read and agreed to the published version of the manuscript.

Funding

This research was funded by the Ministry of Science and Higher Education Republic of Poland (contract No. TKD/DS/1, 2017-2019 and TKD/S/2/2020) and the Ministry of Education and Science Republic of Poland (contract No. TKD/S/2/2021 and TKD/S/2/2022).

Data Availability Statement

Data is contained within the article.

Conflicts of Interest

The authors declare no conflicts of interest.

References

  1. Liu, H.; Hu, Z.; Zhang, J.; Ngo, H.H.; Guo, W.; Liang, S.; Fan, J.; Lu, S.; Wu, H. Optimizations on supply and distribution of dissolved oxygen in constructed wetlands: A review. Bioresour. Technol. 2016, 214, 797–805. [Google Scholar] [CrossRef] [PubMed]
  2. Kadlec, R.H.; Knight, R.L. Treatment Wetlands; CRC Press LLC: Boca Raton, FL, USA, 1996. [Google Scholar]
  3. Saeed, T.; Sun, G. A review on nitrogen and organics removal mechanisms in subsurface flow constructed wetlands: Dependency on environmental parameters, operating conditions and supporting media. J. Environ. Manag. 2012, 112, 429–448. [Google Scholar] [CrossRef] [PubMed]
  4. Wu, H.; Zhang, J.; Ngo, H.H.; Guo, W.; Hu, Z.; Liang, S.; Fan, J.; Liu, H. A review on the sustainability of constructed wetlands for wastewater treatment: Design and operation. Bioresour. Technol. 2015, 175, 594–601. [Google Scholar] [CrossRef] [PubMed]
  5. Ilyas, H.; Masih, I. The performance of the intensified constructed wetlands for organic matter and nitrogen removal: A review. J. Environ. Manag. 2017, 198, 372–383. [Google Scholar] [CrossRef]
  6. Masi, F.; Martinuzzi, N. Constructed wetlands for the Mediterranean countries: Hybrid systems for water reuse and sustainable sanitation. Desalination 2007, 215, 44–55. [Google Scholar] [CrossRef]
  7. Vymazal, J.; Kröpfelová, L. Removal of organics in constructed wetlands with horizontal sub-surface flow: A review of the field experience. Sci. Total Environ. 2009, 407, 3911–3922. [Google Scholar] [CrossRef]
  8. Ayaz, S.Ç.; Aktaş, Ö.; Akça, L.; Fındık, N. Effluent quality and reuse potential of domestic wastewater treated in a pilot-scale hybrid constructed wetland system. J. Environ. Manag. 2015, 156, 115–120. [Google Scholar] [CrossRef]
  9. Jóźwiakowski, K.; Marzec, M.; Kowalczyk-Juśko, A.; Gizińska-Górna, M.; Pytka-Woszczyło, A.; Malik, A.; Listosz, A.; Gajewska, M. 25 years of research and experiences about the application of constructed wetlands in southeastern Poland. Ecol. Eng. 2019, 127, 440–453. [Google Scholar] [CrossRef]
  10. Kataki, S.; Chatterjee, S.; Vairale, M.G.; Dwivedi, S.K.; Gupta, D.K. Constructed wetland, an eco-technology for wastewater treatment: A review on types of wastewater treated and components of the technology (macrophyte, biolfilm and substrate). J. Environ. Manag. 2021, 283, 111986. [Google Scholar] [CrossRef]
  11. Zhang, X.W.; Hu, Z.; Ngo, H.H.; Zhang, J.; Guo, W.S.; Liang, S.; Xie, H.J. Simultaneous improvement of waste gas purification and nitrogen removal using a novel aerated vertical flow constructed wetland. Water Resour. 2018, 130, 79–87. [Google Scholar] [CrossRef]
  12. Temel, F.A.; Ozyazici, G.; Uslu, V.R.; Ardali, Y. Full scale subsurface flow constructed wetlands for domestic wastewater treatment: 3 years’ experience. Environ. Prog. Sustain. 2018, 37, 1348–1360. [Google Scholar] [CrossRef]
  13. Li, X.; Zhu, W.; Meng, G.; Zhang, C.; Guo, R. Efficiency and kinetics of conventional pollutants and tetracyclines removal in integrated vertical-flow constructed wetlands enhanced by aeration. J. Environ. Manag. 2020, 273, 111120. [Google Scholar] [CrossRef] [PubMed]
  14. Sgroi, M.; Pelissari, C.; Roccaro, P.; Sezerino, P.H.; Garcia, J.; Vagliasindi, F.G.A.; Avila, C. Removal of organic carbon, nitrogen, emerging contaminants and fluorescing organic matter in different constructed wetland configurations. Chem. Eng. J. 2018, 332, 619–627. [Google Scholar] [CrossRef]
  15. Cui, L.; Ouyang, Y.; Gu, W.; Yang, W.; Xu, O. Evaluation of nutrient removal efficiency and microbial enzyme activity in a baffled subsurface-flow constructed wetland system. Bioresour. Technol. 2013, 146, 656–662. [Google Scholar] [CrossRef] [PubMed]
  16. Meng, P.; Pei, H.; Hu, W.; Shao, Y.; Li, Z. How to increase microbial degradation in constructed wetlands: Influencing factors and improvement measures. Bioresour. Technol. 2014, 157, 316–326. [Google Scholar] [CrossRef] [PubMed]
  17. Kadlec, R.H.; Wallace, S.D. Treatment Wetlands, 2nd ed.; CRC Press/Taylor & Francis Group: Boca Raton, FL, USA, 2009; ISBN 9781420012514. [Google Scholar]
  18. Nivala, J.; Wallace, S.; Headley, T.; Kassa, K.; Brix, H.; van Afferden, M.; Müller, R. Oxygen transfer and consumption in subsurface flow treatment wetlands. Ecol. Eng. 2013, 61, 544–554. [Google Scholar] [CrossRef]
  19. Lin, C.J.; Chyan, J.M.; Zhuang, W.X.; Vega, F.A.; Mendoza, R.M.O.; Senoro, D.B.; Shiu, R.F.; Liao, C.H.; Huang, D.J. Application of an innovative front aeration and internal recirculation strategy to improve the removal of pollutants in subsurface flow constructed wetlands. J. Environ. Manag. 2020, 256, 109873. [Google Scholar] [CrossRef] [PubMed]
  20. Li, J.; Zheng, L.; Ye, C.; Ni, B.; Wang, X.; Liu, H. Evaluation of an intermittent-aeration constructed wetland for removing residual organics and nutrients from secondary effluent: Performance and microbial analysis. Bioresour. Technol. 2021, 329, 124897. [Google Scholar] [CrossRef]
  21. Hu, Y.; Zhao, Y.; Zhao, X.; Kumar, J.L.G. High Rate Nitrogen Removal in an Alum Sludge-Based Intermittent Aeration Constructed Wetland. Environ. Sci. Technol. 2012, 46, 4583–4590. [Google Scholar] [CrossRef]
  22. Rous, V.; Vymazal, J.; Hnátková, T. Treatment wetlands aeration efficiency: A review. Ecol. Eng. 2019, 136, 62–67. [Google Scholar] [CrossRef]
  23. Jia, W.; Zhang, J.; Wu, J.; Xie, H.; Zhang, B. Effect of intermittent operation on contaminant removal and plant growth in vertical flow constructed wetlands: A microcosm experiment. Desalination 2010, 262, 202–208. [Google Scholar] [CrossRef]
  24. Gajewska, M.; Skrzypiec, K.; Jozwiakowski, K.; Bugajski, P. Kinetics of pollutants removal in hybrid treatment wetlands—Case study comparison. Ecol. Eng. 2018, 120, 222–229. [Google Scholar] [CrossRef]
  25. Sharma, P.K.; Minakshi, D.; Rani, A.; Malaviya, P. Treatment efficiency of vertical flow constructed wetland systems operated under different recirculation rates. Ecol. Eng. 2018, 120, 474–480. [Google Scholar] [CrossRef]
  26. Zhao, X.; Hu, Y.; Zhao, Y.; Kumar, L. Achieving an extraordinary high organic and hydraulic loadings with good performance via an alternative operation strategy in a multi-stage constructed wetland system. Environ. Sci. Pollut. Res. 2018, 25, 11841–11853. [Google Scholar] [CrossRef] [PubMed]
  27. Kumar, M.; Singh, R. Performance evaluation of semi continuous vertical flow constructed wetlands (SC-VF-CWs) for municipal wastewater treatment. Bioresour. Technol. 2017, 232, 321–330. [Google Scholar] [CrossRef] [PubMed]
  28. Liu, X.; Zhang, K.; Fan, L.; Luo, H.; Jiang, M.; Anderson, B.C.; Li, M.; Huang, B.; Yu, L.; He, G.; et al. Intermittent micro-aeration control of methane emissions from an integrated vertical-flow constructed wetland during agricultural domestic wastewater treatment. Environ. Sci. Pollut. Res. 2018, 25, 24426–24444. [Google Scholar] [CrossRef] [PubMed]
  29. Nguyen, X.C.; Nguyen, D.D.; Loan, N.T.; Chang, S.W. Potential of integrated vertical and horizontal flow constructed wetland with native plants for sewage treatment under different hydraulic loading rates. Water Sci. Technol. 2017, 76, 434–442. [Google Scholar] [CrossRef]
  30. Murphy, C.; Rajabzadeh, A.R.; Weber, K.P.; Nivala, J.; Wallace, S.D.; Cooper, D.J. Nitrification cessation and recovery in an aerated saturated vertical subsurface flow treatment wetland: Field studies and microscale biofilm modeling. Bioresour. Technol. 2016, 209, 125–132. [Google Scholar] [CrossRef]
  31. Nivala, J.; Boog, J.; Headley, T.; Aubron, T.; Wallace, S.; Brix, H.; Mothes, S.; van Afferden, M.; Müller, R.A. Side-by-side comparison of 15 pilot-scale conventional and intensified subsurface flow wetlands for treatment of domestic wastewater. Sci. Total Environ. 2019, 658, 1500–1513. [Google Scholar] [CrossRef]
  32. Pascual, A.; Álvarez, J.A.; de la Varga, D.; Arias, C.A.; Van Oirschot, D.; Kilian, R.; Soto, M. Horizontal flow aerated constructed wetlands for municipal wastewater treatment: The influence of bed depth. Sci. Total Environ. 2023, 908, 168257. [Google Scholar] [CrossRef]
  33. Aguilar, L.; Gallegos, Á.; Pérez, L.M.; Arias, C.A.; Rubio, R.; Haulani, L.; Raurich, J.R.; Pallarés, M.; de Pablo, J.; Morató, J. Effect of intermittent induced aeration on nitrogen removal and denitrifying-bacterial community structure in Cork and gravel vertical flow pilot-scale treatment wetlands. J. Environ. Sci. Health Part A Toxic/Hazard. Subst. Environ. Eng. 2021, 56, 1121–1130. [Google Scholar] [CrossRef]
  34. Uggetti, E.; Hughes-Riley, T.; Morris, R.H.; Newton, M.I.; Trabi, C.L.; Hawes, P.; Puigagut, J.; García, J. Intermittent aeration to improve wastewater treatment efficiency in pilot-scale constructed wetland. Sci. Total Environ. 2016, 559, 212–217. [Google Scholar] [CrossRef] [PubMed]
  35. Xu, W.; Yang, B.; Wang, H.; Wang, S.; Jiao, K.; Zhang, C.; Li, F.; Wang, H. Improving the removal efficiency of nitrogen and organics in vertical-flow constructed wetlands: The correlation of substrate, aeration and microbial activity. Environ. Sci. Pollut. Res. Int. 2022, 30, 21683–21693. [Google Scholar] [CrossRef] [PubMed]
  36. Jucherski, A.; Nastawny, M.; Walczowski, A.; Jóźwiakowski, K.; Gajewska, M. Assessment of the technological reliability of a hybrid constructed wetland for wastewater treatment in a mountain eco-tourist farm in Poland. Wat. Sci. Technol. 2017, 75, 2649–2658. [Google Scholar] [CrossRef]
  37. Marzec, M.; Jóźwiakowski, K.; Dębska, A.; Gizińska-Górna, M.; Pytka-Woszczyło, A.; Kowalczyk-Juśko, A.; Listosz, A. The efficiency and reliability of pollutant removal in a hybrid constructed wetland with common reed, manna grass, and Virginia mallow. Water 2018, 10, 1445. [Google Scholar] [CrossRef]
  38. Marzec, M.; Gizińska-Górna, M.; Jóźwiakowski, K.; Pytka-Woszczyło, A.; Kowalczyk-Juśko, A.; Gajewska, M. The efficiency and reliability of pollutant removal in a hybrid constructed wetland with giant miscanthus and Jerusalem artichoke in Poland. Ecol. Eng. 2019, 127, 23–35. [Google Scholar] [CrossRef]
  39. Malik, A. Construction and Detailed Design of a Hybrid, Wetland Sewage Treatment Plant with a Daily Capacity of Q = 4.5 m3/d for a School Complex in Poizdów, Kock Commune; Typescript: Lublin, Poland, 2015. (In Polish) [Google Scholar]
  40. Conley, L.M.; Dick, R.L.; Lion, L.W. An Assesment of the root zone method of wastewater treatment. Res. J. WPCF 1991, 64, 239–247. [Google Scholar]
  41. PN-74/C-04620/00; Water and Sewage—Sampling—General Provision and Scope of the Standard. ISO: Geneva, Switzerland, 1999. (In Polish)
  42. PN-EN 25667-2; Water Quality—Sampling—Guidance on Sampling Techniques. ISO: Geneva, Switzerland, 1993. (In Polish)
  43. PN-EN 1899-1:2002; Water Quality—Determination of Biochemical Oxygen Demand after n Days (BOD)—Part 1: Dilution and Vaccination Method with the Addition of Allythiourea. ISO: Geneva, Switzerland, 2002. (In Polish)
  44. PN-ISO 15705:2005; Water Quality—Determination of the Chemical Oxygen Demand Index (ST-COD)—Small-Scale Sealed-Tube Method. ISO: Geneva, Switzerland, 2005. (In Polish)
  45. PN-EN 872:2007; Water Quality—Determination of Suspended Solids—Method by Filtration trough Filters. ISO: Geneva, Switzerland, 2007. (In Polish)
  46. American Public Health Association (APHA). Standard Methods for Examination of Water and Wastewater, 21st ed.; APHA: Washington, DC, USA, 2005. [Google Scholar]
  47. Mucha, J. Geostatistical Methods in Documenting Deposits; Department of Mine Geology, AGH Kraków: Warszawa, Poland, 1994. (In Polish) [Google Scholar]
  48. Cohen, J. Statistical Power Analysis for the Behavioral Sciences; Lawrence Erlbaum Associates: Hillsdale, NJ, USA, 1988. [Google Scholar]
  49. Bugajski, P.; Wałęga, A.; Kaczor, G. Application of the Weibull reliability analysis of haousehold sewage treatment plant. Gaz Woda I Tech. Sanit. 2012, 2, 56–58. (In Polish) [Google Scholar]
  50. Regulation of the Minister of Marine Economy and Inland Navigation of 12 July 2019 on Substances Particularly Harmful to the Aquatic Environment and the Conditions to be Met When Introducing Sewage into Waters or into the Ground, as well as When Discharging Rainwater or Meltwater into Waters or Water Facilities (No 2019 Item 1311). Available online: https://isap.sejm.gov.pl/isap.nsf/download.xsp/WDU20190001311/O/D20191311.pdf (accessed on 8 January 2022). (In Polish)
  51. Andraka, D.; Dzienis, L. Required reliability level of wastewater treatment plants according to European and Polish regulations. Zesz. Nauk. Politech. Białostockiej. Ser. Inżynieria Sr. 2003, 16, 24–28. (In Polish) [Google Scholar]
  52. Kaczor, G. Concentrations of the pollutants in the sewage drained from the rural sewerage systems in lesser Poland voivodship. Infrastruct. Ecol. Rural. Areas 2009, 9, 97–104. (In Polish) [Google Scholar]
  53. Nowobilska-Majewska, E.; Bugajski, P. The Analysis of the Amount of Pollutants in Wastewater after Mechanical Treatment in the Aspect of their Susceptibility to Biodegradation in the Treatment Plant in Nowy Targ. J. Ecol. Eng. 2019, 20, 135–143. [Google Scholar] [CrossRef]
  54. Bugajski, P. Pollution loads for sewage from school buildings in rural areas. Infrastruct. Ecol. Rural. Areas 2010, 14, 137–145. (In Polish) [Google Scholar]
  55. Cossu, R.; Lai, T.; Sandon, A. Standardization of BOD5/COD ratio as a biological stability index for MSW. Waste Manag. 2012, 32, 1503–1508. [Google Scholar] [CrossRef] [PubMed]
  56. Jóźwiakowski, K.; Bugajski, P.; Mucha, Z.; Wójcik, W.; Jucherski, A.; Nastawny, A.; Siwiec, T.; Mazur, A.; Obroślak, R.; Gajewska, M. Reliability and efficiency of pollution removal during long-term operation of a one-stage constructed wetland system with horizontal flow. Sep. Purif. Technol. 2017, 187, 60–66. [Google Scholar] [CrossRef]
  57. Gajewska, M. Wetlands with vertical flow of wastewater. Characteristics of processes and applications. In Monografie’ Komitetu Inżynierii Środowiska; Wydawnictwo PAN: Warszawa, Poland, 2019; Volume 150. (In Polish) [Google Scholar]
  58. Gajewska, M.; Obarska-Pempkowiak, H. Efficiency of pollutant removal by five multistage constructed wetlands in a temperate climate. Environ. Prot. Eng. 2011, 37, 27–36. [Google Scholar]
  59. Available online: https://www.takatsuki.co.jp/en/product/about-hiblow/ (accessed on 8 January 2023).
  60. Siatou, A.; Manali, A.; Gikas, P. Energy Consumption and Internal Distribution in Activated Sludge Wastewater Treatment Plants of Greece. Water 2020, 12, 1204. [Google Scholar] [CrossRef]
  61. Gu, Y.; Li, Y.; Li, X.; Luo, P.; Wang, H.; Wang, X.; Wu, J.; Li, F. Energy self-sufficient wastewater treatment plants: Feasibilities and challenges. Energy Procedia 2017, 105, 3741–3751. [Google Scholar] [CrossRef]
  62. García, J.; Rousseau, D.P.L.; Morató, J.; Lesage, E.; Matamoros, V.; Bayona, J.M. Contaminant removal processes in subsurface-flow constructed wetlands: A review. Rev. Environ. Sci. Biotechnol. 2010, 40, 561–661. [Google Scholar] [CrossRef]
  63. Mitch, W.J.; Gosselink, J.G. Wetlands; Van Nostrand Reinhold Company: New York, NY, USA, 1986. [Google Scholar]
  64. Demirel, B.; Yenigum, O.; Onay, T.T. Anaerobic treatment of dairy wastewater: A review. Process Biochem. 2005, 40, 2583–2595. [Google Scholar] [CrossRef]
  65. Gajewska, M.; Obarska-Pempkowiak, H.; Kopeć, Ł. Operation of small wastewater treatment facilities in a scattered settlement. Rocz. Ochr. Śr. 2011, 15, 13. [Google Scholar]
  66. Vymazal, J. Constructed Wetlands for Wastewater Treatment. Water 2010, 2, 530–549. [Google Scholar] [CrossRef]
  67. Sharma, P.K.; Inoue, T.; Kato, K.; Ietsugu, H.; Tomita, K.; Nagasawa, T. Potential of hybrid constructed wetland system in treating milking parlor wastewater under cold climatic conditions in northern Hokkaido, Japan. In Proceedings of the 12th International Conference on Wetland Systems for Water Pollution Control, Venice, Italy, 4–8 October 2010; pp. 929–938. [Google Scholar]
  68. Wu, H.; Fan, J.; Zhang, J.; Ngo, H.H.; Guo, W.; Hu, Z.; Lv, J. Optimization of organics and nitrogen removal in intermittently aerated vertical flow constructed wetlands: Effects of aeration time and aeration rate. Int. Biodeterior. Biodegrad. 2016, 113, 139–145. [Google Scholar] [CrossRef]
  69. Obarska-Pempkowiak, H.; Gajewska, M.; Wojciechowska, E. Hydrofitowe Oczyszczanie wód i Ścieków; Wydawnictwo Naukowe PWN: Warszawa, Poland, 2010; pp. 35–40. (In Polish) [Google Scholar]
  70. Zhao, Y.J.; Hui, Z.H.; Chao, X.; Nie, E.; Li, H.J.; He, J.; Zheng, Z. Efficiency of two-stage combinations of subsurface vertical down-flow and up-flow constructed wetland systems for treating variation in influent C/N ratios of domestic wastewater. Ecol. Eng. 2011, 37, 1546–1554. [Google Scholar] [CrossRef]
  71. Varma, M.; Kumar Gupta, A.; Sarathi Ghosal, P.; Majumder, A. A review on performance of constructed wetlands in tropical and cold climate: Insights of mechanism, role of influencing factors, and system modification in low temperature. Sci. Total Environ. 2021, 755, 142540. [Google Scholar] [CrossRef]
  72. Jóźwiakowska, K.; Bugajski, P. Influence of the Bed Temperature on the Operational Reliability of a Hybrid Constructed Wetland Wastewater Treatment Plant in South-Western Poland—A Case Study. Sustainability 2023, 15, 11790. [Google Scholar] [CrossRef]
Figure 1. Technological scheme of the tested VF-HF CW [39]. Notation: S1, S2, S3, and S4—sampling points; I, II, III—numbers of primary settling tank chambers.
Water 16 00947 g001
Figure 2. Longitudinal profile of the tested VF-HF CW [39]. Notation: I, II, III—numbers of primary settling tank chambers.
Water 16 00947 g002
Figure 3. Average monthly rainfall and air temperature for the Sosnowica station in 2017–2022.
Water 16 00947 g003
Figure 4. Average annual rainfall and air temperature for the Sosnowica station in 2017–2022.
Water 16 00947 g004
Figure 5. Frequency histogram of indicator values (TSS, BOD5, and COD) in the influent to the VF-HF.
Water 16 00947 g005
Figure 6. Average indicators of the quality and quantity of wastewater entering the VF bed from 2017 to 2022.
Water 16 00947 g006
Figure 7. Dissolved oxygen content of raw wastewater (S1) and mechanically treated wastewater after aeration (S2).
Water 16 00947 g007
Figure 8. Matrix scatter plot of the total variables for the increase in oxygen content and effluent temperature in S2.
Water 16 00947 g008
Figure 9. Dynamics of pollutant concentrations in the successive stages of treatment. Notation: dashed black line—Polish requirements specified for wastewater discharged into water and soil from treatment plants below 2000 PE [50].
Water 16 00947 g009
Figure 10. Average efficiency of pollutants removal in the tested VF-HF CWs. Notation: PST—primary settling tank, VF—vertical flow bed, HF—horizontal flow bed.
Water 16 00947 g010
Figure 11. Matrix scatter plot of total variables for removal efficiency at VF and effluent temperature at S2.
Water 16 00947 g011
Figure 12. Weibull cumulative distribution functions and the technological reliabilities determined for each pollution parameter. Notation: dashed green line—reliability function, continuous green line—confidence interval, red arrows—probability of achieving the indicators limit in the effluent, circles lines—probability for variables describing the concentration of a pollution parameter in the treated effluent.
Water 16 00947 g012
Table 1. Basic statistics for the indicator values in the treated wastewater (n = 55).
ParametersStatistics Indicators
AverageMedianMinMaxSDCv
Temperature [°C]S116.8316.306.7025.04.5026.74
S216.3116.405.7025.04.6728.60
S315.9015.604.4025.305.2132.79
S415.9315.803.9025.205.6235.27
pHS1-7.206.577.90--
S2-7.526.438.60--
S3-6.536.137.44--
S4-6.796.517.91--
Dissolved oxygen
[mg O2/L]
S10.880.860.092.090.5157.22
S22.061.410.107.471.7182.73
S33.693.451.587.011.0829.16
S43.143.091.086.850.9329.84
TSS
[mg/L]
S1106.5566.6711.0380.098.3292.28
S265.7436.009.52347.3776.34116.12
S317.5713.001.3388.717.5399.76
S412.086.01.4286.015.53128.57
BOD5
[mg O2/L]
S1114.86106.5036.50329.049.4943.09
S2101.25100.028.50254.039.8339.34
S36.875.00.1525.05.9085.84
S41.961.500.129.201.7287.39
COD
[mg O2/L]
S1319.36279.0135.0949.0174.9754.79
S2256.73231.0106.0964.0121.8747.47
S350.6843.09.81127.024.9149.15
S426.4625.06.3280.012.7048.0
Notes: S1—inflow to preliminary settling tank; S2—outflow from pumping station (aeration chamber); S3—outflow from bed VF; S4—outflow from bed HF; SD—Standard deviation; Cv—Coefficient of variation; n—number of samples.
Table 2. Wilcoxon paired order test parameters for oxygen concentration in raw (DO-S1) and aerated (DO-S2) wastewater (n = 53).
Dependent SamplesZp
DO-S2/DO-S15.0239440.000001
Table 3. Spearman’s correlation (rS) and p-value determining the relationship between the contaminant removal efficiency of the VF bed and the oxygen concentration of the effluent entering the VF bed.
CorrelationrSp-Value
VF TSS/DO-S2−0.24910.1029
VF BOD5/DO-S2−0.04450.7467
VF COD/DO-S20.03930.7754
Notes: VF TSS—TSS effects in VF; VF BOD5—BOD5 effects in VF; VF COD—COD effects in VF; DO-S2—dissolved oxygen concentration in S2.
Table 4. Spearman’s correlation (rS) and p-value determining the relationship between contaminant removal efficiency in the VF bed and effluent temperature in S2.
CorrelationrSp-Value
TSS effects in VF/Wastewater temperature in S20.33090.0282
BOD5 effects in VF/Wastewater temperature in S20.38990.0032
COD effects in VF/Wastewater temperature in S20.27550.0417
Notes: VF TSS—TSS effects in VF; VF BOD5—BOD5 effects in VF; VF COD—COD effects in VF; underlined—statistically significant rS values.
Table 5. Spearman’s correlation (rS) and p-value determining the relationship between pollutant removal efficiency and air temperature.
CorrelationrSp-Value
VF TSS/Air temperature0.33090.0282
VF BOD5/Air temperature0.38990.0032
VF COD/Air temperature0.27550.0417
HF TSS/Air temperature−0.12460.4147
HF BOD5/Air temperature0.21470.1154
HF COD/Air temperature−0.01240.9279
VF-HF TSS/Air temperature0.25880.0897
VF-HF BOD5/Air temperature0.65370.0000
VF-HF COD/Air temperature0.19190.1603
Notes: VF TSS—TSS effects in VF; VF BOD5—BOD5 effects in VF; VF COD—COD effects in VF; HF TSS—TSS effects in HF; HF BOD5—BOD5 effects in HF; HF COD—COD effects in HF; VF-HF TSS—TSS effects in VF-HF; VF-HF BOD5—BOD5 effects in VF-HF; VF-HF COD—COD effects in VF-HF; underlined—statistically significant rS values.
Table 6. Parameters of the Weibull distribution and the Hollander–Proschan goodness-of-fit test (n = 55).
ParameterParameters of Weibull DistributionHollander–Proschan Goodness-Of-Fit Test
θcbStatp
TSS1.38180.966811.8710.37490.7077
BOD50.06361.26182.12480.24930.8031
COD2.79802.203529.9020.12640.8993
Notes: Symbols: stat—value of the test statistic, p—significance level of the test; when p ≤ 0.05 the distribution of data is not Weibull distribution.
Disclaimer/Publisher’s Note: The statements, opinions and data contained in all publications are solely those of the individual author(s) and contributor(s) and not of MDPI and/or the editor(s). MDPI and/or the editor(s) disclaim responsibility for any injury to people or property resulting from any ideas, methods, instructions or products referred to in the content.

