Abstract
In semi-closed coastal brackish systems, the stratification of the water column due to the interaction between freshwater and seawater can lead to a reduction in the dissolved oxygen (DO) levels in the bottom layers, consequently affecting the benthic nutrient flux and causing the degradation in water quality. We performed in situ investigations using a benthic lander to examine changes in the sediment oxygen demand (SOD) and benthic nutrient flux during the development of stratification in the downstream area of an artificially constructed brackish lake. During each measurement period, the temperature and salinity of the water column showed vertically stable stratification. The potential energy anomaly was 88.1–125.7 J/m3, with the stratification intensity strengthening gradually over the measurement period. The concentration of DO in bottom waters gradually decreased as the stratification of the water intensified and the temperature increased, establishing hypoxic conditions. As the stratification intensified, the SOD decreased with the DO concentration in bottom waters, while the benthic fluxes of NH4-N and PO4-P exhibited an opposite effect. When the effect of offshore water (introduced through a sluice gate) was insignificant, the SOD contributed 33% of the net loss of DO below the pycnocline. During this period, the benthic NH4-N and PO4-P fluxes were estimated to contribute 55% and 87% to the net fluxes in NH4-N and PO4-P, respectively, in the water column below the pycnocline. The benthic NH4-N and PO4-P fluxes resulted in excess phosphorus in the bottom water. When the inflow of seawater through the sluice gate was sufficient, the flow in the upstream direction of the bottom layer moved phosphorus-rich bottom water downstream, which is important for algal growth in the middle-upstream region.
1. Introduction
Stratification is the physical condition of a water column that reduces the vertical mixing of the surface and bottom layers in an aquatic environment and has a significant effect on the distribution, dispersal, recirculation, exchange, and partitioning of microbial communities, algae, nutrients, and metals [1,2,3,4]. In an estuarine environment, stratification is largely a result of horizontal and vertical density gradients created by a difference in the densities of seawater and freshwater in the water column. The stratification of the water column blocks the supply of dissolved oxygen (DO) from the surface to the bottom layer and causes hypoxia due to the decomposition of organic substances that accumulate in the bottom layer [5,6]. Hypoxia is a state in which the DO concentration is less than 2 mg/L, which is deleterious to fish and invertebrates [7]. Exposure to long-term hypoxic conditions can hinder the ability of fish larvae to capture prey and makes them more vulnerable to predators [8,9]. In coastal environments, hypoxia has been reported most often in micro- and meso-tidal systems with weak tidal energy [10,11,12]. In eutrophic estuaries, high pelagic primary production and strong stratification lead to a continuous flux of organic matter to the sediment, resulting in stronger nutrient fluxes into the water column from hypoxic and anoxic conditions in the bottom layers, creating a feedback loop between pelagic productivity and anoxic conditions [13].
Sediments contribute to the biogeochemical cycling of organic matter through the mineralization of deposited particles driven by benthic macro- and micro-organisms [14]. Additionally, the benthic fauna influences benthic fluxes by performing life functions such as bioturbation and bioirrigation [15,16]. These processes at the sediment–water interface have a significant impact on both local and global cycling, especially in shallow coastal environments with higher primary productivity compared to the open ocean [17]. In shallow coastal zones, the fluxes of inorganic nutrients from the sediment to the overlying water column can act as an important source of primary production through benthic–pelagic coupling [18,19,20,21]. Studies of coastal intermittently closed and open lake lagoon (ICOLL) systems located sporadically across the world have shown that sediments are the most important sink and source of nitrogen and phosphorus in the water column [22,23,24]. Stratification can accelerate the release of nutrients from sediments under hypoxic and/or anoxic conditions in bottom waters [25,26]. The measurement of the benthic nutrient flux is, therefore, important for understanding nutrient behavior in shallow coastal environments. However, our knowledge of nutrient fluxes from sediments in semi-closed systems such as ICOLL is still lacking.
Benthic nutrient fluxes can be measured using two main methods. The first estimates the flux using an advection–diffusion model based on the vertical distribution of nutrients in pore water [27]. However, flux measurements using diffusion can result in underestimates because they do not include physical mixing induced by benthic activity [28]. The second method calculates flux by measuring the change in the nutrient concentration of the overlying water over time through the incubation of sediment. Sediment incubation involves culturing an intact sediment core in the laboratory [29] and installing a benthic chamber directly in the field [24,30]. Laboratory incubation offers the advantage of examining changes in the benthic flux under various environmental conditions, such as aerobic and/or anaerobic conditions [31,32], and in situ measurements provide more accurate and reliable information because they are performed in real environments [33,34]. Recently, in situ measurements of the benthic flux have been made using a benthic lander equipped with a measuring sensor, data recorder, and sampling device [35,36].
We investigated the intensity of the stratification, the vertical distribution of water quality, and the benthic flux using a small benthic lander as stratification developed in an artificially constructed brackish coastal lake. Based on these field observations, the effect of the stratification intensity on the benthic flux was investigated, and the effect of the benthic flux on bottom water quality during the stratification period (when the vertical exchange of the water column was blocked) was evaluated.
2. Materials and Methods
2.1. Study Area
Saemangeum Lake is an artificial brackish lake created when dike construction was completed in 2006. The lake is a semi-closed brackish environment, as the Mangyeong and Dongjin Rivers flow continuously from the east, and seawater from the Yellow Sea flows in and out of the west through a sluice gate in the dike. In addition, as a road running in an east–west direction across the center of the lake was built in 2020, the Mangyeong Basin in the north is separated from the Dongjin Basin in the south (Figure 1). The tidal cycle of the sea area outside the dike means the sluice gate does not operate during neap tides but is operated mainly during spring tides, when a large tidal range develops. The depth of the lake increases gradually from upstream to midstream and deepens sharply downstream; the maximum water depth is approximately 40 m near the Sinshi sluice gate [37]. The average annual inflow of river water flowing from the upstream watershed of the lake is 1100 × 106 m3/year from the Mangyeong River and 700 × 106 m3/year from the Dongjin River [38]. Precipitation in the watershed is concentrated in the period from June to September. Accordingly, stratification of the lake strengthens during periods of high river inflow [32]. Kwak et al. (2023) recorded water temperature and salinity data at 1 min intervals for approximately 40 days at a point downstream of the lake during a period of increased freshwater inflow due to concentrated rainfall [39]. Despite external factors, such as the operation of a sluice gate and wind temporarily weakening the strength of the stratification, they found that the stratification remained continuously strong throughout the observation period.
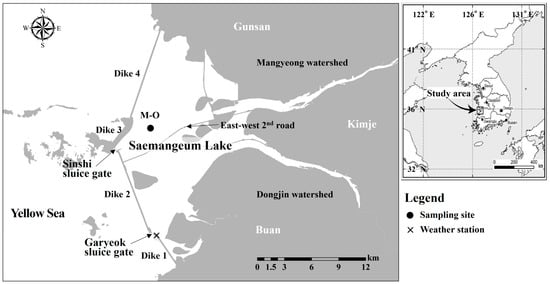
Figure 1.
Map of Saemangeum Lake showing the sampling site (●: M-O) and weather station (×).
After construction of the dike, mixing of seawater and lake water decreased and the influence of freshwater from the upstream watershed expanded, resulting in a sharp increase in the concentrations of chlorophyll-a (Chl-a) and nutrients in the lake. Following the initial completion of the dike, the mean concentrations of NH4-N, PO4-P, and Chl-a in surface water increased to 0.19 mg/L, 0.05 mg/L, and 11.7 mg/m3, respectively, compared to their pre-construction levels of 0.10 mg/L, 0.02 mg/L, and 5.6 mg/m3, respectively [40]. An excess of nutrients was reportedly supplied from the bottom waters of the lake [38,41]. From seawall completion in 2006 to 2010, hypoxia with strong salinity stratification was observed only in the mid-upstream region of the lake, which is directly affected by river inflow [40]. Since 2016, hypoxia and strong salinity stratification have been observed continuously in the downstream regions of the lake [32,42,43]. To understand the change in the water quality of Saemangeum Lake, it is, therefore, necessary to accurately measure the nutrient flux at the sediment–water interface during the stratification period and evaluate the effect of this flux on the water quality of the lake.
2.2. Sampling
A brief but intensive investigation was performed to understand the vertical structure of the physical and chemical parameters during development of stratification in Saemangeum Lake. Field measurements were taken three times according to the operation of the sluice gate of the dike at site M-O downstream of Mangyeong Basin. During the three survey periods, the water depth at site M-O was 8–10 m. The first measurement was taken on 15 June 2021, when the outer seawater and lake water were exchanged by the operation of the sluice gate (once per day). The second measurement was taken on 6 July 2021, when there was no seawater inflow due to the sluice gate not operating. Finally, a third measurement was taken on 13 July 2021, when the lake water was discharged to the outer sea area by the operation of the sluice gate (once per day). During each measurement period, the daily precipitation was 85.5 mm one day before the second measurement, and there was no rainfall during the other measurement periods. The mean wind speed was approximately 4 m/s at the first and third measurements and 2.6 m/s at the second measurement.
In each investigation, pH, water temperature, DO, and salinity were measured from the surface layer to the bottom layer at intervals of approximately 1 m using a multi-parameter water quality analyzer (HL4, Hydrolab Company, Loveland, CO, USA). Samples for water quality analysis were collected from the surface to the bottom at intervals of approximately 1 m by connecting a hose washed with HNO3 to a peristaltic pump and stored at −20 °C until laboratory analysis.
2.2.1. In Situ Measurement of Benthic Oxygen and Nutrient Fluxes
Benthic oxygen and nutrient fluxes were investigated by miniaturizing the benthic lander developed by Lee et al. (2010) [35]. Benthic oxygen and nutrient fluxes have been measured in situ using a benthic lander by many researchers [20,44,45,46,47]. The outer frame of the benthic lander used in this work was made of stainless steel. A stirrer was attached to the lid of an opaque rectangular chamber made of polyvinylchloride and measuring 18 × 18 × 32 cm to mix internal water at 30 rpm. The average flow velocity inside the chamber at 30 rpm was 4.4 cm/s, and the diffusive boundary layer (DBL) was estimated to be approximately 180 μm based on the relationship between shear velocity and the DBL [46].
The benthic lander was placed at the bottom of site M-O for 1 day at the same time the physical and chemical measurements in the water column were taken (Figure 2). After arriving at the site using a small vessel, the benthic lander was moved to the floor with the support of a scuba diver with the chamber lid left open. The lid of the chamber closed automatically after 1 h to account for the effect of resuspended sediments during installation of the benthic lander on the seafloor. The concentration of DO in the overlying water in the chamber was measured every 10 s using an oxygen sensor (OXYBase WR-RS232, PreSens, Regensburg, Germany) attached to the chamber’s lid and stored automatically in the memory of the main board. Water samples within the chamber of the benthic lander were collected to estimate the benthic fluxes of nutrients. Six samples were collected (each 50 mL) in the chamber using an automatic-syringe water sampler at intervals of 3 h. After the benthic lander was recovered, the sample was immediately filtered and stored at −20 °C until analysis.
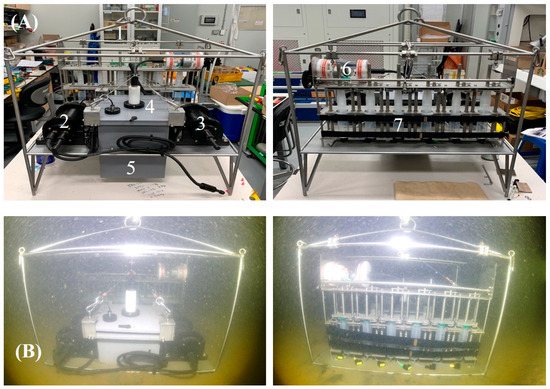
Figure 2.
Photographs of the benthic lander. (A) Components of benthic lander: 1. frame, 2. main board, 3. battery, 4. chamber lid with stirrer and DO sensor, 5. chamber body, 6. motor, and 7. sampling syringes. (B) The benthic lander on the floor of the lake.
2.2.2. Laboratory Analysis
Nutrient samples collected from each layer of water at site M-O were analyzed using two auto-analyzers (SAN PLUS, Skalar, Breda, The Netherlands; QuAAtro, BLTEC, Osaka, Japan). Total nitrogen (T-N) and total phosphorus (T-P) were analyzed for the unfiltered samples, and dissolved inorganic nutrients (NO3-N, NO2-N, NH4-N, and PO4-P) were analyzed after GF/C (Whatman, Maidstone, UK) filtration. Organic nitrogen (Org-N) and organic phosphorus (Org-P) were calculated as the difference between T-N and dissolved inorganic nitrogen (DIN; NO3-N + NO2-N + NH4-N), and the difference between T-P and PO4-P, respectively. Total organic carbon (TOC) was analyzed using a TOC analyzer (Multi N/C 3100, Analytik Jena, Jenna, Germany). Chl-a was extracted using 90% acetone and quantified with a spectrophotometer (Specord 200 plus, Analytik Jena, Jena, Germany) [48]. Measurements of inorganic dissolved nutrients in the in situ benthic chamber were carried out using the same analytical method as for the water layers.
2.2.3. Potential Energy Anomaly and Benthic Flux Calculation
The intensity of stratification was quantified as the potential energy anomaly (PEA), which measures the amount of mechanical energy required to mix the stratified water column completely:
where is the potential energy anomaly (J/m3), is the gravitational acceleration (m/s2), H is the total depth (m), is the depth-averaged density (kg/m3), and is the local density (kg/m3) at depth .
The benthic fluxes at the sediment–water interface were calculated as follows [49]:
where is the benthic flux (mg/m2/d) of nutrients, is the concentration at the elapsed time (mg/L), is the initial concentration (mg/L), is the concentration of the acquired sample at the elapsed time (mg/L), is the concentration of the replenished sample at the elapsed time (mg/L), V is the volume of the chamber (L), n is the number of samples, is the volume of the replenished sample at the elapsed time (L), A is the area of contact between the sample and overlying water (m2), and t is the time (days).
2.2.4. Other Data Sources
The inflow of freshwater into the Mangyeong Basin of Saemangeum Lake was estimated using the drainage–area ratio method, which is based on the flow rate observed at the Samrye-kyo gauging station (station ID 3301670: 35°53′54″ N, 127°04′16″ E) 1 km upstream of the Mangyeong River and Mangyeong River watershed. The inflow of seawater through the sluice gate of the dike was analyzed by acquiring data according to the operation of the sluice gate and the water level in the lake, as measured by the Korea Rural Community Corporation (Naju, Republic of Korea).
2.2.5. Statistical Analysis
The Spearman correlation coefficient was used to test the correlations between various water quality parameters in the water column during each survey period. All data analyses were conducted using SPSS (ver. 12.0; SPSS Inc., Chicago, IL, USA). The significance level was 0.05, and the extremely significant level was set to 0.01.
3. Results
3.1. Hydrologic Conditions
The inflow of freshwater into the Mangyeong Basin of Saemangeum Lake was 2.1 × 10⁶ m3/day during the first measurement period, 36.5 × 10⁶ m3/day during the second measurement period, and 4.5 × 10⁶ m3/day during the third period. The freshwater inflow decreased after the second period, when it peaked. The inward and outward movements of water from the lake were affected by the number of times the sluice gate opened, lake water level, and tide level in the open sea during the period excluding the neap tide. The amount of seawater inflow increased gradually during the operation of the sluice gate from June 8 to June 16 before the first measurement period, and then decreased (Figure 3). This change in seawater inflow was more evident from 21 June to 30 June, when the sluice gate was operated twice daily. This phenomenon occurs because the amount of seawater flowing into the lake increases before and after the spring tide, when the tidal range of the open sea peaks. Between the second and third measurement periods, little seawater flows through the sluice gate. During this period, the lake water level increased due to the rapid increase in river inflow along with the increase in precipitation. Accordingly, the lake water was discharged to the open sea through the sluice gate.
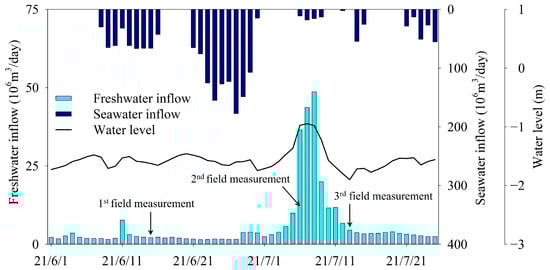
Figure 3.
Freshwater and seawater inflows and lake water levels during the three survey periods.
The first measurement was in a period during which the influence of seawater on the lake was relatively high (because the inflow of seawater through the sluice gate was higher) compared with other periods. The second measurement was taken during a period when there was no inflow of seawater (because the sluice gate was closed for approximately 7 days before the survey date), and the influence of freshwater inflow was greater compared with the first measurement due to the increased inflow of freshwater. The third measurement period (when the water level in the lake rapidly decreased) was a period during which fresh water from the upstream moved further downstream because the lake water was discharged to the outside through the sluice gate. The influence of fresh water in the lake, therefore, increased more than it did during the second measurement period.
3.2. Vertical Profiles of Salinity, Water Temperature, DO, and pH
The vertical distributions of salinity, water temperature, DO, and pH observed at site M-O during each measurement period indicate that stratification strengthened over time (Figure 4).
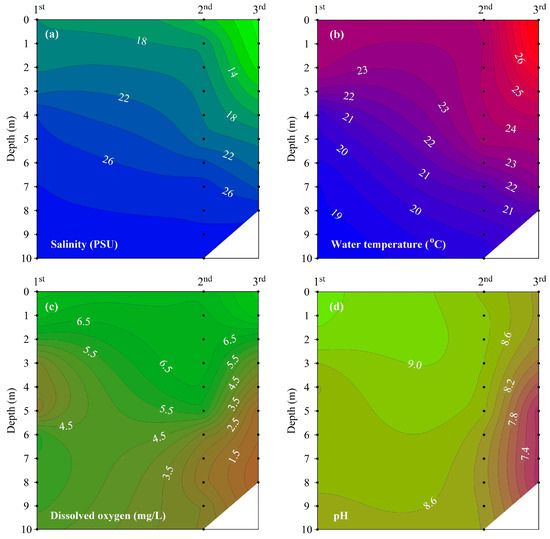
Figure 4.
Vertical profile of (a) salinity, (b) water temperature, (c) DO, and (d) pH at site M-O.
Salinity showed a vertical distribution that increased with increasing water depth. Between the first and third measurements, the salinity of the surface water decreased from 18.0 to 7.3 under the influence of freshwater inflow, but the salinity of the bottom water decreased from 28.9 to 27.6, showing a small change compared to that showed by the surface water. The difference in salinity between the surface and bottom waters increased gradually over the three survey periods, indicating a gradual strengthening of haline stratification.
Water temperature showed a vertical distribution that decreased with increasing water depth. The contour lines of water temperature and salinity showed a similar distribution. The difference in water temperature between the surface and bottom waters showed a tendency to increase with time, similar to salinity, indicating that thermal stratification gradually strengthened. As a result, the haline and thermal stratifications of the water column over the three survey periods were enhanced due to the increase in freshwater inflow to the surface and the increase in water temperature.
The PEA indicating stratification intensity was 88.1 J/m3 in the first measurement, 104.4 J/m3 in the second measurement, and 125.7 J/m3 in the third measurement, and the stratification strengthened gradually over the three survey periods.
As the stratification strengthened, the DO in the bottom water gradually decreased, with hypoxic conditions evident at a depth of 5 m or less in the third measurement. The vertical distribution of pH was similar to that of DO, with the lowest pH observed in the bottom water in the third measurement (when the stratification was strongest).
3.3. Vertical Profiles of TOC, Chl-a, and Nutrients
The TOC, Chl-a, and nutrients at site M-O during each measurement provided evidence of a clear difference in the vertical distribution as haline and thermal stratifications developed (Figure 5).
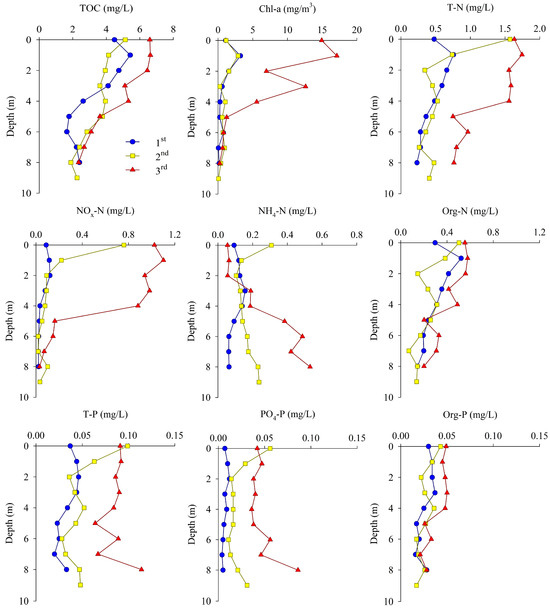
Figure 5.
Vertical profiles of TOC, Chl-a, and nutrients at site M-O.
The TOC concentration was between 1.65 and 6.63 mg/L during the three survey periods. The vertical mean concentration of TOC was highest in the third measurement. The vertical distribution of TOC in all measurements decreased with increasing water depth. As the influence of freshwater increased over time, the TOC concentration of the surface water showed a tendency to increase gradually, whereas the TOC concentration of the bottom water showed relatively small changes.
The concentration of Chl-a was between 0.05 and 17.12 mg/m3 during the three survey periods. The vertical mean concentration of Chl-a was highest in the third measurement, similar to that of TOC, and tended to decrease with increasing water depth in all measurements. In the third measurement, which was influenced the most by freshwater and had the highest stratification intensity, the difference in concentration between the surface and bottom waters was the greatest.
The concentration of T-N was between 0.458 and 1.262 mg/L during the three survey periods. The vertical mean concentration of T-N was highest in the third measurement, but the difference between the surface and bottom waters was the greatest in the second measurement, when the stream flow rate was highest, as the concentration of the surface water increased rapidly. The vertical distribution of NOx-N (NO2-N + NO3-N) was similar to that of T-N, and its concentration decreased sharply at depths below 5 m, where hypoxic conditions were observed in the third measurement. The vertical distribution of NH4-N showed a tendency to increase with water depth, as opposed to NOx-N, as the stratification strengthened. In particular, the NH4-N concentration in the bottom water increased gradually throughout the measurement period.
The concentration of T-P was between 0.034 and 0.086 mg/L during the three survey periods. The vertical mean concentration of T-P was highest in the third measurement, as was the case for the other measurements, and the difference in concentration between the surface and the bottom waters was the greatest in the second measurement, similar to trends for T-N. The vertical distribution of PO4-P tended to increase with water depth as the stratification strengthened, and the concentration of bottom water increased gradually during the three survey periods, similar to that of NH4-N.
3.4. Sediment Oxygen Demand and Benthic Nutrient Fluxes
Calculations of the sediment oxygen demand (SOD) at site M-O were based on the change in DO in a chamber of a benthic lander over a period of 10 h and measured at intervals of 10 s during each measurement period. Considering the stabilization of water in the in situ chamber when calculating the SOD, DO data from the beginning of the measurement to 1.5 h were removed before analysis. At the first measurement, DO decreased from 4.51 mg/L to 1.92 mg/L and the SOD was 1.00 g/m2/d. At the second measurement, DO decreased from 2.07 mg/L to 0.72 mg/L, and the SOD was 0.52 g/m2/d. At the third measurement, DO decreased from 0.46 mg/L to 0.07 mg/L and the SOD was 0.15 g/m2/d (Table 1). As the initial concentration of DO in the chamber decreased gradually from the first to the third measurement, the DO concentration gradient gradually became gentler and the SOD also decreased gradually (Figure 6).

Table 1.
SOD and benthic nutrient fluxes at site M-O.
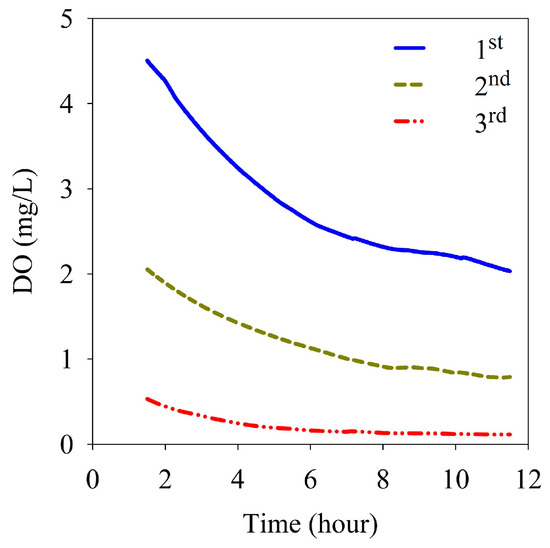
Figure 6.
Variation of dissolved oxygen with the elapsed time in the benthic chamber.
The change in the flux of inorganic nutrients in the chamber of the benthic lander according to the elapsed time at site M-O is shown in Figure 7. In the second measurement, the second sample (taken before 3 h) could not be obtained because of an operational error by the automatic water collector of the benthic lander, and the flux between 0 and 3 h could not be calculated. The NOx-N fluxes were negative from 0 to 9 h in the first and third measurements, but were between 9 and 12 h in the second measurement. The mean fluxes of NOx-N were −7.31, 9.59, and −3.14 mg/m2/d at the first, second, and third measurements, respectively (Table 1). NOx-N was removed from the overlying water during the first and third measurements and supplied to the overlying water during the second measurement. The fluxes of NH4-N showed high values from 0 h to 6 h for all measurements. The mean fluxes of NH4-N were 55.83, 68.88, and 91.08 mg/m2/d in the first, second, and third measurements, respectively, indicating that they were supplied from sediments in all measurements. In addition, the flux of NH4-N tended to increase with a decrease in the initial DO concentration of the overlying water (Table 1 and Figure 6). The fluxes of PO4-P showed high values from 0 h to 6 h in all measurements (Figure 7c), similar to that of NH4-N. The mean fluxes of PO4-P were calculated to be 13.38, 14.64, and 22.71 mg/m2/d in the first, second, and third measurements, respectively. Similar to NH4-N, the flux increased gradually over the three survey periods (Table 1).
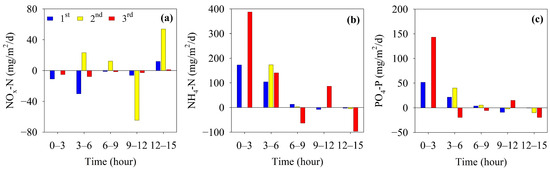
Figure 7.
Fluxes of (a) NOx-N, (b) NH4-N, and (c) PO4-P in the benthic chamber.
4. Discussion
4.1. Changes in Vertical Distribution of Water Quality and Development of Stratification
During periods of high precipitation, a strong influx of river water into the surface of an estuary isolates the bottom waters, enhancing stratification and affecting the distribution of nutrients in the water column and creating hypoxic or anoxic conditions in the bottom layer [50,51,52]. Environments with limited exchange with external seawater, such as Saemangeum Lake, are vulnerable to hypoxia because their nutrient loads are retained and recirculated [53]. The correlation among various water quality parameters during each measurement period is presented in Table 2.
Table 2.
Correlation matrix of various water quality parameters in water column at site M-O.
Water density and DO showed a strong negative correlation in the second and third measurements but not in the first. The first measurement was taken when the inflow of seawater from the outside through the sluice gate was relatively high. During this period, the correlation between DO and water density was not significant because seawater containing high levels of DO flowed into the bottom of the lake and increased the DO concentration of the bottom water. As a result, the expansion of freshwater to the lake surface under reduced or blocked conditions of external seawater inflow strengthened the stratification and blocked the vertical exchange of DO. The rapid depletion of DO in the bottom water then led to hypoxia. During the three survey periods, the water quality parameters showing significant correlations with DO gradually increased with the development of stratification. DO showed a strong positive correlation with organic matter (TOC, Chl-a, Org-N, and Org-P) in the water column in the third measurement, in particular, when stratification was the strongest.
The data for pH showed a strong negative correlation with water density in all measurements. In addition, pH and DO were strongly positively correlated in the second (r = 0.809, p < 0.01) and third (r = 0.883, p < 0.01) measurements compared with the first (r = 0.647, p < 0.05) measurement. This is likely related to the decomposition of organic matter in the bottom waters because the concentration of DO in the bottom water was lower in the second and third measurements compared with the first measurement. In the second and third measurements, pH showed a strong positive correlation with TOC. The release of inorganic carbon during the metabolic processing of organic matter changed the proportions of different types of inorganic carbon, decreasing the pH [54].
Overall, TOC showed a strong negative correlation with water density and a strong positive correlation with Org-N and Org-P. On the other hand, Chl-a concentrations showed a significant negative correlation with water density in the first and third measurements. The second measurement was the period during which the inflow of freshwater increased rapidly following intensive rainfall during the survey period. In estuaries, high freshwater inflows cause turbidity and rapid flushing, which reduced phytoplankton production by limiting the time and light available for phytoplankton growth at high nutrient concentrations [55]. In the second measurement, despite the high nutrient status of the surface water, the lower concentration of Chl-a during this period resulted in a relatively lower correlation between Chl-a and water density. Moreover, in the second measurement, Chl-a did not show a significant correlation with other organic substances. However, in the third measurement, when the concentration of Chl-a was highest in the surface layer, Chl-a and TOC, Org-N, and Org-P showed a strong positive correlation, indicating that algae particles were influencing the vertical distribution of these organic substances.
Overall, T-N, NOx-N, and Org-N showed strong negative correlations with water density. However, NH4-N did not show a significant correlation with water density in the first and second measurements, and showed a strong positive correlation with water density in the third measurement. Unlike other nitrogen species, NH4-N decreased rapidly, with a sharp increase in Chl-a concentration in the surface water during the third measurement compared with the second measurement. In addition, NH4-N and Chl-a showed a strong negative correlation in the third measurement, but not the other measurement periods. Some phytoplankton may prefer to take up NH4-N over NO3-N, leading to the depletion of NH4-N [56].
Org-P showed a strong negative correlation with water density in the second and third measurements, whereas PO4-P showed no significant correlation with water density, except in the first measurement. Unlike other water quality parameters, PO4-P and NH4-N were inconsistently correlated with water density in each measurement. This is because the concentrations of PO4-P and NH4-N during stratification are influenced by the influx of freshwater and uptake by phytoplankton in the surface water and are generated during mineralization in bottom waters due to the death of organisms, such as freshwater phytoplankton, introduced into the surface water, and then sinking below the pycnocline [50]. Jeong et al. (2021) reported that the proportion of DIN and phosphorus increases through the mineralization of dissolved organic nitrogen and phosphorus in the bottom water during long-term stratification in Saemangeum Lake [43].
4.2. Benthic Nutrient Fluxes under Stratified Conditions
Benthic nutrient fluxes are mediated by interactions among many physical, chemical, and biological processes [57]. Stratification affects these processes and benthic nutrient fluxes [58]. The in situ benthic nutrient fluxes in this study were higher than Thau Lagoon and Corunna Lake, where the water depth was shallow and anoxia did not occur [22,59]. However, in Jinhae Bay, a eutrophic bay with limited water exchange, the benthic fluxes of NH4-N and PO4-P were recorded as 133.7–574.0 and 27.9–93.0 mg/m2/d, respectively [60]. These flux rates were higher than the results of this study in an anoxic environment. Furthermore, in the Marano and Grado Lagoon, in areas with limited water exchange under well-oxygenated conditions, the flux rates of NH4-N and PO4-P were −5.6–45.5 and −3.2–0.0 mg/m2/d, respectively. But, during anoxic events, these rates were calculated as a maximum of 7396.5 and 324.9 mg/m2/d, respectively [24]. Therefore, these previous results indicate a high likelihood that the strong stratification leading to hypoxic/anoxic conditions in the bottom water during periods of high water temperature significantly influences the benthic flux of nutrients.
In this study, the benthic fluxes of NH4-N and PO4-P (downstream of Saemangeum Lake) were positively correlated with PEA and negatively correlated with DO concentrations in the bottom water, although measurement data were insufficient (Figure 8). During the three survey periods, the stratification of the water column further strengthened, owing to the increase in freshwater inflow into the lake. Under these circumstances, the precipitation and decomposition of organic substances from the surface water decreases the DO in the bottom water. As a result, the enhanced stratification in the water column and the decrease of DO in the bottom water were considered to be the cause of the increased benthic fluxes of NH4-N and PO4-P.
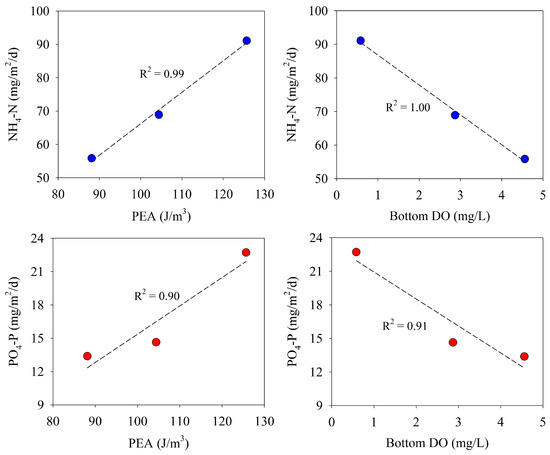
Figure 8.
Relationship between benthic nutrient fluxes and PEA and bottom water DO.
Benthic nutrient fluxes are determined primarily by the rates of sedimentation and decomposition of detritus and the rates of movement of nutrients from the sediment–water interface by molecular diffusion and infauna bioturbation [61]. The reduction of the oxic layers in the sediment due to the decrease in DO in the bottom water controls nitrification, and the release of NH4-N from the sediment increases when anoxic conditions are reached [26]. In this study, the increase in the benthic flux of NH4-N according to the decrease in DO concentration in the bottom water (along with the strengthening of the stratification) appeared to reflect the biogeochemical cycling of nitrogen.
The behavior of phosphorus at the sediment–water interface is determined primarily by anoxic mineralization, which is influenced by iron(III) oxide reduction and sulfate reduction. In an environment in which sulfate reduction is dominant, iron(III) oxide is reduced by sulfide, and phosphorus is released from the sediment into overlying water. This can be accelerated by permanently burying the iron with solid iron sulfide, which cannot adsorb phosphorus [25]. Under oxic conditions, the release of phosphorus is associated with the formation of anoxic microlayers at the sediment–water interface due to the high microbial activity in the sediment [62]. In this study, the benthic flux of PO4-P increased with decreases in the DO concentration in the bottom water, similar to that of NH4-N, but showed a sharper increase in the third measurement compared with the first and second measurements. In the third measurement, the PO4-P released from the sediment was assumed to be accelerated by sulfate reduction when the DO concentration of the bottom water was almost depleted as the intensity of stratification in the water column strengthened. Jeong and Kwak (2020) reported that the increase in PO4-P release from sediments downstream of Saemangeum Lake was related to sulfate reduction [32].
4.3. Contribution of Benthic Fluxes to Bottom Water during Stratification
Stratification of a water column inhibits the vertical exchange of dissolved inorganic nutrients; the elution of nutrients from the sediment to the overlying water, therefore, affects the concentration of nutrients in bottom waters. Based on the results of three surveys, the concentrations of nitrogen and phosphorus in the bottom water at site M-O showed a positive correlation with the benthic fluxes (Figure 9). Although the measurement data may not be sufficient, this strong positive correlation suggests that the nitrogen and phosphorus concentrations in the bottom water downstream of the Saemangeum Lake are strongly influenced by the benthic fluxes.
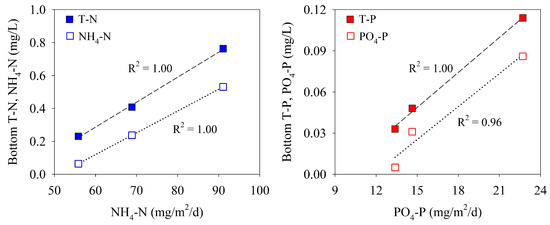
Figure 9.
Relationship between benthic flux and concentrations of nitrogen and phosphorus in bottom waters.
The contribution of the benthic flux to the dissolved substances in bottom waters (during stratification by water temperature and salinity) can be estimated based on the depth of the water column below the pycnocline and the change in dissolved substances between the three survey periods [63,64]. Between the first and second measurements during this investigation period, the contribution of the benthic flux was not calculated, given the effect of external seawater flowing through the sluice gate of the dike. Between the second and third measurements, the surface water of the lake was discharged to the outside through the sluice gate, and inflow of seawater from the outside was limited. The third measurement was taken 7 days after the second, and the thickness of the water below the pycnocline at this time was approximately 4 m. During the second and third measurements, the mean DO concentrations below the pycnocline decreased from 2.71 mg/L to 0.92 mg/L. The net loss of DO in the water column below the pycnocline during this period was estimated at 1.02 g/m2/day. The average SOD of the second and third measurements accounted for 33% of the net DO loss (Table 3). These results suggest that the consumption of DO in the water column below the pycnocline during this period is more important for water column respiration than is the SOD. However, the relative importance of the SOD and water column respiration is closely related to the depth below the pycnocline, depending on the investigation period [65].
Table 3.
Contribution of SOD and benthic fluxes to water column below the pycnocline during the second and the third measurements.
During the same period, the mean benthic DIN and NH4-N fluxes contributed 33% and 55% to the net fluxes of T-N and NH4-N, respectively, in the water column below the pycnocline. The supply of NH4-N to the water column below the pycnocline can occur through the decomposition of organic nitrogen in the water, in addition to the benthic NH4-N flux. The supply of NH4-N due to the decomposition of organic substances in the water column was estimated at 35.01 mg/m2/day when the remaining DO loss (due to the difference between the net DO loss and the SOD) was converted into nitrogen using the Redfield molar ratio (C:N:P:-O2 = 106:16:1:138). This flux accounted for 24% of the net flux of NH4-N in the water column below the pycnocline. The dissimilar nitrate reduction to ammonium in a water column with low DO concentrations can act as an important source of NH4-N [66].
During the second and third measurements, the net fluxes of T-P and PO4-P in the water column below the pycnocline were estimated at 25.57 and 21.43 mg/m2/day. The average benthic PO4-P flux accounted for 73% and 87% of the net fluxes of T-P and PO4-P, respectively. The supply of PO4-P due to the decomposition of organic matter in the water column under the pycnocline, calculated in the same way as NH4-N, was 4.85 mg/m2/day, which was estimated to be 23% of the net fluxes of PO4-P. In addition, the concentration of PO4-P in the water column below the pycnocline was affected by the adsorption and desorption of particles. Özkundakei et al. (2011) reported that the contribution of adsorption or desorption in stratified eutrophic lakes was relatively insignificant at 2–7% for hypolimnetic PO4-P fluxes [63].
During the strengthening of stratification in the water column, the benthic fluxes of NH4-N and PO4-P, between the first and third measurements, increased by 63% and 70%, respectively. The results of this study show that the physical, chemical, and biological processes of the water column according to the stratification intensity strongly affect the benthic nutrient fluxes, even for a short period of time. The contribution of the PO4-P benthic flux to the water column under the pycnocline was larger than that of NH4-N, and the molar ratio of the NH4-N/PO4-P benthic fluxes was an average of 9.5. Therefore, the benthic nutrient fluxes in stratified conditions contributed to the formation of phosphorus-excessive water masses in the bottom water. The formation of a salt wedge in Saemangeum Lake due to the inflowing of high-salinity seawater during the operation of the sluice gate caused an average flow of the bottom layer in the upstream direction [67]. Kwak et al. (2023), who conducted continuous field observations in the downstream area of Saemangeum Lake, reported that, when seawater flows in through the sluice gate, the residual flow in the lake flows downstream in the surface layer and upstream in the bottom layer [39]. During the stratification period when there was little or no inflow of seawater through the sluice gate, the bottom water downstream containing excess phosphorus due to the benthic flux moved upstream when sufficient seawater flowed through the sluice gate. The phosphorus-rich bottom water had a significant effect on algal growth in the mid-upstream regions of the lake, where phosphorus acts as a limiting factor [43].
5. Conclusions
We investigated the effects of SOD and benthic nutrient fluxes on bottom water according to the development of stratification downstream of an artificially constructed semi-enclosed brackish lake. The intensity of stratification within the lake was affected by the inflow of freshwater from the river and the inflow of seawater through the sluice gate of the dike. As the stratification strengthened, the DO concentration in the bottom water gradually decreased until hypoxic conditions were reached. During the three survey periods, the SOD decreased, and the benthic NH4-N and PO4-P fluxes increased with decreasing concentrations of DO in bottom waters. The relationship between the benthic NH4-N and PO4-P fluxes and PEA indicate that the intensity of stratification strongly influences the benthic nutrient flux. In addition, the relationship between benthic flux and bottom water concentrations of NH4-N and PO4-P showed that the benthic nutrient flux influences the nutrient dynamics in bottom waters. The contributions of the benthic NH4-N and PO4-P fluxes to the net fluxes of NH4-N and PO4-P in the water layer below the pycnocline during the period when seawater inflow through the sluice gate was insignificant were estimated at 55% and 87%, respectively. Excess PO4-P in bottom waters due to the benthic fluxes downstream of the lake may, therefore, move upstream according to the operation of the sluice gate and act as a potential source of algal growth in the mid-upstream regions.
Our investigation of Saemangeum Lake revealed that, even when seawater with high levels of DO is introduced through the current sluice gate operation, the bottom layer’s DO is not easily improved due to the strong stratification and high biological activity during the summer season. This creates a vicious circle of hypoxic and/or anoxic conditions in bottom waters, increasing nutrient concentrations in the sediment and accelerating their release into the overlying water, thereby affecting eutrophication in the lake. To address this issue, it is necessary to improve the sluice gate operation so that seawater with high levels of DO can be rapidly and widely circulated into the lake. Additionally, reducing the load of organic substances and nutrients entering the lake through continuous pollution-reduction activities, such as managing non-point pollution sources in the upper watershed, is also essential.
Author Contributions
Methodology, Y.-H.J. and D.-H.K.; Formal analysis, Y.-H.C.; Investigation, Y.-H.C.; Resources, D.-H.K.; Data curation, Y.-H.J.; Writing—original draft, Y.-H.J.; Writing—review & editing, D.-H.K.; Visualization, Y.-H.C.; Supervision, D.-H.K.; Project administration, D.-H.K.; Funding acquisition, D.-H.K. All authors have read and agreed to the published version of the manuscript.
Funding
This work was supported by the National Research Foundation of Korea (NRF-2019R1A2C1006441) from the Ministry of Education, and was partly supported by the Jeonbuk Green Environment Center, funded by the Korea Ministry of Environment.
Data Availability Statement
Data are contained within the article.
Conflicts of Interest
The authors declare no conflict of interest.
References
- Long, A.; Sun, L.; Shi, R.; Zhou, W.; Dang, A. Saltwater intrusion induced by a complete neap tide and its effect on nutrients variation in the estuary of Pearl River, China. J. Coast. Res. 2013, 29, 1158–1168. [Google Scholar] [CrossRef]
- Liu, B.; de Swart, H.E. Quantifying the Effect of Salinity Stratification on Phytoplankton Density Patterns in Estuaries. Estuaries Coast. 2017, 41, 453–470. [Google Scholar] [CrossRef]
- Shilei, Z.; Yue, S.; Tinglin, H.; Ya, C.; Xiao, Y.; Zizhen, Z.; Yang, L.; Zaixing, L.; Jiansheng, C.; Xiao, L. Reservoir water stratification and mixing affects microbial community structure and functional community composition in a stratified drinking reservoir. J. Environ. Manag. 2020, 267, 110456. [Google Scholar] [CrossRef] [PubMed]
- Jia, Z.; Li, S.; Liu, Q.; Jiang, F.; Hu, J. Distribution and partitioning of heavy metals in water and sediments of a typical estuary (Modaomen, South China): The effect of water density stratification associated with salinity. Environ. Pollut. 2021, 287, 117277. [Google Scholar] [CrossRef] [PubMed]
- Chen, C.C.; Gong, G.C.; Shiah, F.K. Hypoxia in the East China Sea: One of the largest coastal low-oxygen areas in the world. Mar. Environ. Res. 2007, 64, 399–408. [Google Scholar] [CrossRef] [PubMed]
- Lee, J.; Park, K.T.; Lim, J.H.; Yoon, J.E.; Kim, I.N. Hypoxia in Korean coastal waters: A case study of the natural Jinhae Bay and artificial Shihwa Bay. Front. Mar. Sci. 2018, 5, 70. [Google Scholar] [CrossRef]
- Diaz, R.J. Overview of hypoxia around the world. J. Environ. Qual. 2001, 30, 275–281. [Google Scholar] [CrossRef] [PubMed]
- Taylor, D.L.; Eggelston, D.B. Effects of hypoxia on an estuarine predator-prey interaction: Foraging behavior and mutual interference in the blue crab Callinectes sapidus and the infaunal clam prey Mya arenaria. Mar. Ecol. Prog. Ser. 2000, 196, 221–237. [Google Scholar] [CrossRef]
- Purcell, J.E.; Decker, M.B.; Breitburg, D.L.; Broughton, K.J. Fine-scale vertical distributions of Mnemiopsis leidyi ctenophores: Predation on copepods relative to stratification and hypoxia. Mar. Ecol. Prog. Ser. 2014, 500, 103–120. [Google Scholar] [CrossRef]
- Li, M.; Zhong, L. Flood–ebb and spring–neap variations of mixing, stratification and circulation in Chesapeake Bay. Cont. Shelf Res. 2009, 29, 4–14. [Google Scholar] [CrossRef]
- Zhang, H.; Zhao, L.; Sun, Y.; Wang, J.; Wei, H. Contribution of sediment oxygen demand to hypoxia development off the Changjiang Estuary. Estuar. Coast. Shelf Sci. 2017, 192, 149–157. [Google Scholar] [CrossRef]
- Qian, W.; Gan, J.; Liu, J.; He, B.; Lu, Z.; Guo, X.; Wang, D.; Guo, L.; Huang, T.; Dai, M. Current status of emerging hypoxia in a eutrophic estuary: The lower reach of the Pearl River estuary, China. Estuar. Coast. Shelf Sci. 2018, 205, 58–67. [Google Scholar] [CrossRef]
- Schourup-Kristensen, V.; Larsen, J.; Maar, M. Drivers of hypoxia variability in a shallow and eutrophicated semi-enclosed fjord. Mar. Pollut. Bull. 2023, 188, 114621. [Google Scholar] [CrossRef] [PubMed]
- Middelburg, J.J. Reviews and syntheses: To the bottom of carbon processing at the seafloor. Biogeosciences 2018, 15, 413–427. [Google Scholar] [CrossRef]
- Berezina, N.A.; Maximov, A.A.; Vladimirova, O.M. Influence of benthic invertebrates on phosphorus flux at the sediment-water interface in the easternmost Baltic. Sea. Mar. Ecol. Prog. Ser. 2019, 608, 33–43. [Google Scholar] [CrossRef]
- Kendzierska, H.; Łukawska-Matuszewska, K.; Burska, D.; Janas, U. Benthic fluxes of oxygen and nutrients under the influence of macrobenthic fauna on the periphery of the intermittently hypoxic zone in the Baltic Sea. J. Exp. Mar. Biol. Ecol. 2020, 530, 151439. [Google Scholar] [CrossRef]
- Kopp, D.; Lefebvre, S.; Cachera, M.; Villanueva, M.C.; Ernande, B. Reorganization of a marine trophic network along an inshore–offshore gradient due to stronger pelagic–benthic coupling in coastal areas. Prog. Oceanogr. 2015, 130, 157–171. [Google Scholar] [CrossRef]
- Hopkinson, C.S.; Giblin, A.E.; Tucker, J. Benthic metabolism and nutrient regeneration on the continental shelf of eastern Massachusetts, USA. Mar. Ecol. Prog. Ser. 2001, 224, 1–19. [Google Scholar] [CrossRef]
- Lawrence, W.; Dagg, M.J.; Liu, H.; Cummings, S.R.; Ortner, P.B.; Kelble, C. Wind events and benthic-pelagic coupling in a shallow subtropical bay in Florida. Mar. Ecol. Prog. Ser. 2004, 266, 1–13. [Google Scholar] [CrossRef][Green Version]
- Lee, J.S.; Kim, K.H.; Shim, J.; Han, J.H.; Choi, Y.H.; Khang, B.J. Massive sedimentation of fine sediment with organic matter and enhanced benthic-pelagic coupling by an artificial dyke in semi-enclosed Chonsu Bay, Korea. Mar. Pollut. Bull. 2012, 64, 153–163. [Google Scholar] [CrossRef]
- Hyun, J.H.; Kim, S.H.; Mok, J.S.; Lee, J.S.; An, S.U.; Lee, W.C. Impacts of long-line aquaculture of Pacific oyster (Crassostrea gigas) on sulfate reduction and diffusive nutrient flux in the coastal sediments of Jinhae-Tongyeong, Korea. Mar. Pollut. Bull. 2013, 74, 187–198. [Google Scholar] [CrossRef] [PubMed]
- Spooner, D.R.; Maher, W. Benthic sediment composition and nutrient cycling in an Intermittently Closed and Open Lake Lagoon. J. Mar. Syst. 2009, 75, 33–45. [Google Scholar] [CrossRef]
- De Vittor, C.; Faganeli, J.; Emili, A.; Covelli, S.; Predonzani, S.; Acquavita, A. Benthic fluxes of oxygen, carbon and nutrients in the Marano and Grado Lagoon (northern Adriatic Sea, Italy). Estuar. Coast. Shelf Sci. 2012, 113, 57–70. [Google Scholar] [CrossRef]
- Petranich, E.; Covelli, S.; Acquavita, A.; De Vittor, C.; Faganeli, J.; Contin, M. Benthic nutrient cycling at the sediment-water interface in a lagoon fish farming system (northern Adriatic Sea, Italy). Sci. Total Environ. 2018, 644, 137–149. [Google Scholar] [CrossRef]
- Lehtoranta, J.; Ekholm, P.; Pitkänen, H. Coastal eutrophication thresholds: A matter of sediment microbial processes. AMBIO 2009, 38, 303–308. [Google Scholar] [CrossRef] [PubMed]
- Jäntti, H.; Hietanen, S. The effects of hypoxia on sediment nitrogen cycling in the Baltic Sea. AMBIO 2012, 41, 161–169. [Google Scholar] [CrossRef]
- Matos, C.; Berrêdo, J.; Machado, W.; Metzger, E.; Sanders, C.; Faial, K.; Cohen, M. Seasonal changes in metal and nutrient fluxes across the sediment-water interface in tropical mangrove creeks in the Amazon region. Appl. Geochem. 2022, 138, 105217. [Google Scholar] [CrossRef]
- Qu, W.; Morrison, R.J.; West, R.J.; Su, C. Diagenetic stoichiometry and benthic nutrient fluxes at the sediment-water interface of Lake Illawarra, Australia. Hydrobiologia 2005, 537, 249–264. [Google Scholar] [CrossRef]
- Engelsen, A.; Hulth, S.; Pihl, L.; Sundbäck, K. Benthic trophic status and nutrient fluxes in shallow-water sediments. Estuar. Coast. Shelf Sci. 2008, 78, 783–795. [Google Scholar] [CrossRef]
- Grenz, C.; Rodier, M.; Seceh, C.; Varillon, D.; Haumani, G.; Pinazo, C. Benthic nutrients and oxygen fluxes at the water sediment interface in a pearl farming atoll (Ahe, Tuamotu, French Polynesia). Mar. Pollut. Bull. 2021, 173, 112963. [Google Scholar] [CrossRef] [PubMed]
- Belias, C.; Dassenakis, M.; Scoullos, M. Study of the N, P and Si fluxes between fish farm sediment and seawater. Results of simulation experiments employing a benthic chamber under various redox conditions. Mar. Chem. 2007, 103, 266–275. [Google Scholar] [CrossRef]
- Jeong, Y.H.; Kwak, D.H. Influence of external loading and halocline on phosphorus release from sediment in an artificial tidal lake. Int. J. Sediment Res. 2020, 35, 146–156. [Google Scholar] [CrossRef]
- Glud, R.N.; Gundersen, J.K.; Jørgensen, B.B.; Revsbech, N.P.; Schulz, H.D. Diffusive and total oxygen uptake of deep-sea sediments in the eastern South Atlantic Ocean:in situ and laboratory measurements. Deep-Sea Res. I Oceanogr. Res. Pap. 1994, 41, 1767–1788. [Google Scholar] [CrossRef]
- Hall, P.O.J.; Brunnegård, J.; Hulthe, G.; Martin, W.R.; Stahl, H.; Tengberg, A. Dissolved organic matter in abyssal sediments: Core recovery artifacts. Limnol. Oceanogr. 2007, 52, 19–31. [Google Scholar] [CrossRef]
- Lee, J.S.; Bahk, K.S.; Khang, B.J.; Kim, Y.T.; Bae, J.H.; Kim, S.S.; Park, J.J.; Choi, O.I. The development of a benthic chamber (BelcI) for benthic boundary layer studies. Sea J. Korean Soc. Oceanogr. 2010, 15, 41–50. [Google Scholar]
- Berelson, W.; McManus, J.; Severmann, S.; Rollins, N. Benthic fluxes from hypoxia-influenced Gulf of Mexico sediments: Impact on bottom water acidification. Mar. Chem. 2019, 209, 94–106. [Google Scholar] [CrossRef]
- Shin, Y.R.; Jung, J.Y.; Choi, J.H.; Jung, K.W. Hydrodynamic modeling of Saemangeum reservoir and watershed using HSPF and EFDC. J. Korean Soc. Water Environ. 2012, 28, 384–393. [Google Scholar]
- Kim, S.H.; Kim, K.; Lee, M.; Jeong, H.J.; Kim, W.J.; Park, J.G.; Yang, J.S. Enhanced benthic nutrient flux during monsoon periods in a coastal lake formed by tideland reclamation. Estuaries Coast. 2009, 32, 1165–1175. [Google Scholar] [CrossRef]
- Kwak, D.H.; Song, Y.S.; Choi, Y.H.; Kim, K.M.; Jeong, Y.H. Influence of sluice gate operation on salinity stratification and hypoxia development in a brackish estuary dam. Reg. Stud. Mar. Sci. 2023, 57, 102731. [Google Scholar] [CrossRef]
- Jeong, Y.H.; Yang, J.S. The long-term variations of water qualities in the Saemangeum salt-water lake after the sea-dike construction. J. Korean Soc. Mar. Environ. Energy 2015, 18, 51–63. [Google Scholar] [CrossRef]
- Jeong, Y.H.; Kim, C.S.; Yang, J.S. Estimation of addition and removal processes nutrients from bottom water in the Saemangeum Salt-Water Lake by using missing model. J. Korean Soc. Mar. Environ. Energy 2014, 17, 306–317. [Google Scholar] [CrossRef]
- Kwak, D.H.; Jeon, Y.T.; Hur, Y.D. Phosphorus fractionation and release characteristics of sediment in the Saemangeum Reservoir for seasonal change. Int. J. Sediment Res. 2018, 33, 250–261. [Google Scholar] [CrossRef]
- Jeong, Y.H.; Kwak, D.H. Factors affecting behavior and distribution of dissolved organic matter in an artificial coastal reservoir. Reg. Stud. Mar. Sci. 2021, 44, 101786. [Google Scholar] [CrossRef]
- Sayles, F.L.; Dickinson, W.H. The ROLAI2D lander: A benthic lander for the study of exchange across the sediment–water interface. Deep Sea Res. A 1991, 38, 505–529. [Google Scholar] [CrossRef]
- Hammond, D.E.; Cummins, K.M.; McManus, J.; Berelson, W.M.; Smith, G.; Spagnoli, F. Methods for measuring benthic nutrient flux on the California Margin: Comparing shipboard core incubations to in situ lander results. Limnol. Oceanogr. Methods 2004, 2, 146–159. [Google Scholar] [CrossRef]
- Tengberg, A.; Stahl, H.; Gust, G.; Muller, V.; Arning, U.; Andersson, H.; Hall, P.O.J. Intercalibration of benthic flux chambers: I. Accuracy of flux measurements and influence of chamber hydrodynamics. Prog. Oceanogr. 2004, 59, 1–28. [Google Scholar] [CrossRef]
- Kim, S.-H.; Lee, J.S.; Kim, K.T.; Kim, S.L.; Yu, O.H.; Lim, D.; Kim, S.H. Low benthic mineralization and nutrient fluxes in the continental shelf sediment of the northern East China Sea. J. Sea Res. 2020, 164, 101934. [Google Scholar] [CrossRef]
- Parsons, T.R.; Maita, Y.; Lalli, C.M. A Manual of Chemical and Biological Methods for Seawater Analysis; Pergamon Press: Oxford, UK, 1984. [Google Scholar]
- Song, Y.; Jeong, Y.H.; Shin, C.M.; Kwak, D.H. Spatial distribution and comparative evaluation of phosphorus release rate in benthic sediments of an estuary dam. Int. J. Sediment Res. 2002, 37, 355–369. [Google Scholar] [CrossRef]
- Sierra, J.P.; Sánchez-Arcilla, A.; González Del Río, J.; Flos, J.; Movellán, E.; Mösso, C.; Martínez, R.; Rodilla, M.; Falco, S.; Romero, I. Spatial distribution of nutrients in the Ebro estuary and plume. Cont. Shelf Res. 2002, 22, 361–378. [Google Scholar] [CrossRef]
- Wang, P.; Wang, H.; Linker, L. Relative importance of nutrient load and wind on regulating interannual summer hypoxia in the Chesapeake Bay. Estuaries Coasts 2015, 38, 1048–1061. [Google Scholar] [CrossRef]
- Oviatt, C.; Smith, L.; Krumholz, J.; Coupland, C.; Stoffel, H.; Keller, A.; McManus, M.C.; Reed, L. Managed nutrient reduction impacts on nutrient concentrations, water clarity, primary production, and hypoxia in a north temperate estuary. Estuar. Coast. Shelf Sci. 2017, 199, 25–34. [Google Scholar] [CrossRef]
- McGlathery, K.J.; SundbÃfÂck, K.; Anderson, I.C. Eutrophication in shallow coastal bays and lagoons: The role of plants in the coastal filter. Mar. Ecol. Prog. Ser. 2007, 348, 1–18. [Google Scholar] [CrossRef]
- Guo, J.; Yuan, H.; Song, J.; Li, X.; Duan, L. Hypoxia, acidification and nutrient accumulation in the Yellow Sea Cold Water of the South Yellow Sea. Sci. Total Environ. 2020, 745, 141050. [Google Scholar] [CrossRef] [PubMed]
- Murrell, M.C.; Hagy III, J.D.; Lores, E.M.; Greene, R.M. Phytoplankton production and nutrient distributions in a sub-tropical estuary: Importance of freshwater flow. Estuaries Coast. 2007, 30, 390–402. [Google Scholar] [CrossRef]
- Dortch, Q. The interaction between ammonium and nitrate uptake in phytoplankton. Mar. Ecol. Prog. Ser. 1990, 61, 183–201. [Google Scholar] [CrossRef]
- Boström, B.; Andersen, J.M.; Fleischer, S.; Jansson, M. Exchange of phosphorus across the sediment-water interface. Hydrobiologia 1988, 170, 229–244. [Google Scholar] [CrossRef]
- Noori, R.; Berndtsson, R.; Adamowski, J.F.; Abyaneh, M.R. Temporal and depth variation of water quality due to thermal stratification in Karkheh Reservoir, Iran. J. Hydrol. Reg. Stud. 2018, 19, 279–286. [Google Scholar] [CrossRef]
- Lacoste, É.; Bec, B.; Gall, P.L.; Boufahja, F.; Raimbault, P.; Messiaen, G.; Ouisse, V.; d’Orbcastel, E.R.; Munaron, D.; Fiandrino, A.; et al. Benthic-pelagic coupling under juvenile oyster influence in a French Mediterranean coastal lagoon (Thau Lagoon). Estuar. Coast. Shelf Sci. 2022, 267, 107779. [Google Scholar] [CrossRef]
- Lee, J.S.; Kim, Y.T.; Shin, K.H.; Hyun, J.H.; Kim, S.Y. Benthic nutrient fluxes at longline sea squirt and oyster aquaculture farms and their role in coastal ecosystems. Aquac. Int. 2011, 19, 931–944. [Google Scholar] [CrossRef]
- Herbert, R.A. Nitrogen cycling in coastal marine ecosystems. FEMS Microbiol. Rev. 1999, 23, 563–590. [Google Scholar] [CrossRef] [PubMed]
- Kleeberg, A.; Kozerski, H.P. Phosphorus release in Lake Großer Müggelsee and its implications for lake restoration. Hydrobiologia 1997, 342, 9–26. [Google Scholar] [CrossRef]
- Özkundakei, D.; Hamilton, D.P.; Gibbs, M.M. Hypolimnetic phosphorus and nitrogen dynamics in a small, eutrophic lake with a seasonally anoxic hypolimnion. Hydrobiologia 2011, 661, 5–20. [Google Scholar] [CrossRef]
- Chi, L.; Song, X.; Ding, Y.; Yuan, Y.; Wang, W.; Cao, X.; Wu, Z.; Yu, Z. Heterogeneity of the sediment oxygen demand and its contribution to the hypoxia off the Changjiang estuary and its adjacent waters. Mar. Pollut. Bull. 2021, 172, 112920. [Google Scholar] [CrossRef] [PubMed]
- McCarthy, M.J.; Carini, S.A.; Liu, Z.; Ostrom, N.E.; Gardner, W.S. Oxygen consumption in the water column and sediments of the northern Gulf of Mexico hypoxic zone. Estuar. Coast. Shelf Sci. 2013, 123, 46–53. [Google Scholar] [CrossRef]
- Lam, P.; Lavik, G.; Jensen, M.M.; van de Vossenberg, J.; Schmid, M.; Woebken, D.; Gutiérrez, D.; Amann, R.; Jetten, M.S.M.; Kuypers, M.M.M. Revising the nitrogen cycle in the Peruvian oxygen minimum zone. Proc. Natl. Acad. Sci. USA 2009, 106, 4752–4757. [Google Scholar] [CrossRef]
- Yoo, S.C.; Suh, S.W.; Lee, H.Y. Impacts on residence time and water quality of the Saemangeum reservoir caused by inner development. J. Korean Soc. Mar. Environ. Energy 2012, 15, 186–197. [Google Scholar] [CrossRef]


Disclaimer/Publisher’s Note: The statements, opinions and data contained in all publications are solely those of the individual author(s) and contributor(s) and not of MDPI and/or the editor(s). MDPI and/or the editor(s) disclaim responsibility for any injury to people or property resulting from any ideas, methods, instructions or products referred to in the content. |
© 2024 by the authors. Licensee MDPI, Basel, Switzerland. This article is an open access article distributed under the terms and conditions of the Creative Commons Attribution (CC BY) license (https://creativecommons.org/licenses/by/4.0/).