Article

Determination of the Effects of Different Irrigation Levels and Vermicompost Doses on Water Consumption and Yield of Greenhouse-Grown Tomato

1
Department of Biosystems Engineering, Faculty of Agriculture, Kırşehir Ahi Evran University, 40100 Kırşehir, Türkiye
2
Department of Land Improvement, Environmental Development and Spatial Management, Poznań University of Life Sciences, 60-649 Poznań, Poland
3
Department of Biosystems Engineering, Faculty of Engineering, Alanya Alaaddin Keykubat University, 07425 Alanya, Türkiye
4
Department of Agricultural and Environmental Chemistry, Faculty of Agriculture and Economics, University of Agriculture in Krakow, 30-149 Krakow, Poland
5
Department of Agrometeorology, Plant Irrigation and Horticulture, Faculty of Agriculture and Biotechnology, Bydgoszcz University of Science and Technology, 85-029 Bydgoszcz, Poland
*
Author to whom correspondence should be addressed.
Water 2024, 16(8), 1095; https://doi.org/10.3390/w16081095
Submission received: 6 March 2024 / Revised: 8 April 2024 / Accepted: 10 April 2024 / Published: 11 April 2024

Abstract

:
This study was conducted in pots under a polycarbonate greenhouse to determine the effects of different irrigation levels and vermicompost doses on the morphological and phenological characteristics, water consumption, water use efficiency, and yield parameters of tomato plants. For this purpose, different irrigation levels of 100%, 75%, 50% (I100: full irrigation, I75, I50) and vermicompost (VC) doses of 0, 10% and 20% (VC0, VC10 and VC20, w/w) were applied as the treatments. The study’s results determined the irrigation levels and vermicompost doses affected the tomato plants’ morphological and fruit quality parameters. The highest and lowest plant water consumption (ET) values for the treatments were determined as 47.8 L (I100VC10) and 21.2 L (I50VC0), respectively. Moreover, irrigation water levels and vermicompost doses significantly influenced the total yield of tomatoes. The highest and lowest total and marketable yields were obtained from the I100VC20 and I50VC0 irrigation levels and vermicompost doses. Similarly, the highest and lowest total water use efficiencies were achieved from the I100VC20 (21.9 g L−1) and I50VC0 (11.0 g L−1) treatments. Furthermore, the highest and lowest marketable water use efficiencies were obtained from the I100VC20 (21.9 g L−1) and I50VC0 (7.8 g L−1) treatments. The yield response factor (ky) was found to be 1.42. Although the highest efficiency was achieved from 100% full irrigation and a 20% vermicompost dose in the study, it is suggested that 75% irrigation level and 10% fertilizer doses can also be applied in places where water is limited and fertilizer is expensive. The results revealed that the appropriate irrigation level and vermicompost doses could reliably be used to enhance tomato yield.

1. Introduction

Increasing the water use efficiency of agricultural output in arid and semi-arid environments—particularly in the Mediterranean region—has become imperative due to the widespread water scarcity. The feasibility of agricultural output in these areas is significantly impacted by irregular and uneven precipitation distribution and climate change [1,2].
As a result of drought, as well as decreasing and expensive water resources, the importance of agricultural irrigation planning and methods in arid and semi-arid regions becomes evident [3,4]. Limited irrigation, defined as applying less water than the plant’s full water requirement, is an irrigation strategy with significant potential to decrease irrigation water use and improve water efficiency [5].
In addition, adopting irrigation strategies that can save irrigation water and maintain acceptable yields, thus increasing water use efficiency (WUE), can help conserve this more limited resource [6,7]. Improving water productivity could be more profitable for farmers than maximizing agricultural yield, especially in regions with limited water resources like the Mediterranean basin [8]. Water use efficiency can be optimised by adopting more effective irrigation applications [9]. Not only agronomic practice factors such as irrigation and fertilization and regular irrigation, including optimum irrigation scheduling, plant water consumption, and WUE, are essential and required for the best productivity in culture plants under field conditions but also these practice factors are vital for greenhouse studies [10]. Species belonging to the Solanaceae family (tomatoes, peppers and aubergines) account for about 60% of the production grown in greenhouses. Among crops grown in greenhouses, tomatoes are the most studied plant [11]. The tomato (Solanum lycopersicum L.), a fruit and vegetable crop rich in essential vitamins and minerals, has been commonly cultivated worldwide. In order to optimize economic benefits, surplus chemical fertilizer use and incorrect irrigation levels are common practices [12,13,14].
Furthermore, chemical fertilizers are frequently applied to crops to meet their nutritional needs and increase yields. However, their high costs and excessive application in soils increase production costs and sometimes negatively affect the soil and environmental health [15]. Vermicompost (VC) is an organic matter-decomposition product of earthworms and microorganisms working together, a natural eco-manure resource [16]. Vermicompost is an organic amendment with the added benefits of sustaining soil health and providing crops with a sustainable supply of nutrients, potentially reducing dependence on chemical fertilizers [15]. Wu et al. [17] examined the impact of VC on the quantity and quality of tomatoes grown in saline soil. Chemical fertilizer treatments did not increase tomato yield, according to the results, but under salt stress, cow manure and vermicompost did. In conclusion, by enhancing photosynthetic capability and encouraging the transport of carbohydrates to fruit, VC may alleviate the adverse effects of salt stress and improve tomato productivity and fruit quality. Vermicompost applications positively contribute to the physical and chemical properties of soil and increase quality and quantity in plant production [18,19]. In particular, the use of VC, which is a good soil regulator that provides high water retention capacity, cation exchange capacity, porosity rate, aeration, and microbial activity, has increased in recent years with the increase in organic farming awareness [20,21]. Soil treated with VC exhibits improved plant growth, including more leaves, flowers, and fruit [22].
In studies conducted on irrigation levels and VC doses, Şenyiğit et al. [23] determined the effects of water consumption and yield of basil plants under greenhouse conditions. For this purpose, four different irrigation water levels (100% 75%, 50%, 25%, 0) and three different vermicompost doses (V0: 0 kg da−1, V1: 100 kg da−1 and V2: 200 kg da−1) were applied. The study found that irrigation is necessary to obtain a higher yield per unit area in basil cultivation under greenhouse conditions. Considering the irrigation and labour costs, choosing the full irrigation option (100%) is appropriate, providing the highest efficiency from the unit area under sufficient water. However, in regions where water is limited or expensive, applying a constraint between the 75% water constraint and full irrigation may be useful, where both water and WUE are highest. In addition, it was concluded that vermicompost application at V1 level can be recommended because it reduces the plants’ water consumption, increases productivity and is an environmentally friendly fertilizer. Vermicompost application at V2 level reduced the yield, and it was determined that high doses of vermicompost application should be avoided. Coşkan and Şenyiğit [24] investigated selected lettuce plant micronutrient intake under greenhouse conditions. For this purpose, five different irrigation water levels (100%: full irrigation, 75%: with 25% water deficit, 50%: with 50% water deficit, 25%: with 25% water deficit, 0: without irrigation) and two different vermicompost doses (VC25: 25 g, VC50: 50 g) were applied. The trial found that both VC doses and water level were effective for micronutrient intake. Among the VC doses, VC25 increased nutrient uptake, while VC50 decreased the nutrient content of plants. It has been observed that full irrigation (100%) is not the best option for micronutrient intake, and 75% provides more micronutrient intake. Demir [25] applied three different VC doses and three different irrigation levels for lettuce plants. It was observed that the highest lettuce yield (178.7 g plant−1) was obtained at full irrigation (100%) and 5% VC application, while the lowest lettuce yield (94.0 g plant−1) was in the control application (25%). The results showed that applying VC under various irrigation schedules can effectively enhance the physicochemical characteristics of the soil and increase lettuce yield. Although various studies have been conducted on the effects of irrigation levels and chemical fertilizers on plant and soil fertility, there has not been sufficient research on the effects of water and organic fertilizer on plants [26]. Additionally, researchers have reported that increasing irrigation levels and vermicompost doses is not always the best option in terms of plant productivity.
For this purpose, this study aimed to determine the effects of different irrigation levels and vermicompost doses on the morphological and phenological characteristics, water consumption, WUE and yield parameters of tomato plants under polycarbonate greenhouse conditions and to determine the most appropriate irrigation level and vermicompost doses.

2. Materials and Methods

2.1. Experimental Site Description

In order to determine the effects of irrigation levels and VC doses, pot experiments were conducted under a polycarbonate greenhouse at Kırşehir Ahi Evran University, Turkey (39°08′02″ N, 34°07′08″ E, 1082 m sea level). The greenhouse has a north–south orientation. In 2022, the study was carried out in the polycarbonate greenhouse between early May and mid-August. The study location has typical continental climate conditions. Rainfall totals are 383.2 mm annually, with over half falling between November and May. The average annual temperature, humidity, and evaporation for a Class A pan are 11.5 °C, 63.0% and 1368.9 mm, respectively [27]. The climate parameters of the study area are included in Table 1.
Tomato growth and development are significantly influenced by environmental temperature and relative humidity. The mean temperature measured outside was lower than the temperature within the greenhouse during the experiment. However, the measured mean relative humidity values were lower than the outside.
Each pot was filled to a capacity of 6.4 L using air-dried soil. The soil had a texture of sandy clay loam, consisting of 8.02% silt, 21.08% clay, and 70.9% sand. The bulk density of the soil used in the experiments was 1.27 g cm−3. The gravimetric soil water contents were 4.4% and 19.4% at the wilting point and field capacity. The vermicompost used in the study was obtained from cow manure, passed through a 2 mm sieve, and mixed into the soil once with planting. Some physical and chemical properties of the experimental soil and vermicomposting are presented in Table 2.
Irrigation water used in the experiment was taken from the tap. The class of water was C2-S1, according to [28]. The parameters of the water used for irrigation are listed below in Table 3.

2.2. Experimental Design and Treatments

The plant material used in the experiment was the tomato variety TYBİF F1. The study was conducted with three irrigation levels and three VC doses. Following a factorial arrangement trial design in random plots, a total of 9 treatments (3 × 3) were applied and each treatment was replicated three times.
In the experiment, before the irrigation level treatments started, the pots were brought to field capacity on 11 May 2022. Then, irrigation applications started and were terminated on 8 August 2022. The volume of irrigation water given to the treatments was calculated by weighing the pots daily. Gravimetric monitoring was used to monitor the soil moisture levels. Accordingly, irrigation regimes were applied as follows: I100 treatment: full irrigation (100% of water used), I75 treatment: 25% less water applied, I50 treatment: 50% less water applied, I25 treatment: 25% less water applied. The total weight of the pots belonging to the treatments was 3.5 kg. We prepared the amount in VC applications on a weight basis (w/w). Accordingly, two different doses of VC were used, 10% (VC10) and 20% (VC20) (w/w), and no VC was added to the control pots (VC0).

2.3. Crop Water Requirement and Water Use Efficiency

Before the trials began, the field capacity weight of every pot was identified. To stop evaporation, tap water was first added to the pots and the tops covered. Each pot’s weight was taken to be its field capacity weight (WFC) once the drainage stopped. The pots were weighed before watering to determine the amount of water to apply per pot. Using Equation (1). the amount of applied irrigation water (IW) was calculated [29,30]:
IW = ((WFC − W)/ρw) × CAW
where IW: amount of applied irrigation water (L), WFC: pot weight at field capacity, W: weight of the pot just before irrigation (kg), ρw: unit mass of water (1 kg L−1), and CAW: water application coefficient for each treatment (75%, 50%, 25%).
Daily irrigation intervals were applied to the plants, taking into account the water content of the soil in control applications. Using the water balance equation, the amount of evapotranspiration between two successive irrigations was determined (Equation (2)):
ET = (Wn − Wn+1)(IW − R)
where Wn and Wn+1: pot weights before the nth and (n + 1)th irrigation (kg), and R: amounts of applied and drainage water (L).
Each pot had a drain pan beneath to collect leachate. After drainage was stopped, the volume of collected drainage water was measured for each pot to check and adjust the leachate fractions to a value of 0.20.
In the study, considering the ET and yield of the treatments, WUE values were calculated using Equation (3) [31]:
WUE = (EY/ET)
where WUE: water use efficiency (g L−1), EY: economic yield (g pot−1), and ET: plant water consumption (L pot−1).
Total and marketable WUE was calculated with the help of WUE by [31]. The total WUE was determined with total yield (g pot−1) and water applied to the plant (L pot−1). Similarly, marketable WUE (g L−1) was determined with marketable yield (g pot−1) and total water applied to the plant (L pot−1).
The water use–yield relationship was determined using relative yield reduction and relative water consumption in Equation (4) [32]:
( 1 Y a Y m ) = k y ( ET a ET m )
where Ya: actual yield (g pot−1), Ym: maximum yield (g pot−1), ETa: actual plant water consumption (L pot−1), ETm: maximum crop water consumption (L pot−1), and ky: yield response factor indicating decrease in yield concerning per-unit decrease in ET.

2.4. Crop Management

The plant material used in this study was the tomato variety TYBIF F1. The total period of the growing season of tomatoes was 90 days (May to August) in 2022. Tomatoes were suspended from a wire above the greenhouse at the late seedling stage to ensure upward growth. Tomato plants were grown to the fourth trusses. All cultural operations, such as leaf pruning, axil removal, and tip removal, were carried out on the plants during cultivation. Different phenological growth stages and picking time were recorded by observation. For the treatments with full irrigation, the dates of the growth stages are given in Table 4.

2.5. Measurements and Analyses of the Plants and Fruit

2.5.1. Soil, Vermicompost, and Water Analyses

The hydrometer method was used to determine the size distribution of soil particles [33]. Then, the soil textural class was determined using the USDA triangle for soil texture determination. Undisturbed soil samples taken with steel cylinders with a volume of 100 cm3 were dried in the oven at 105 °C until they reached a constant weight, and the weight of the oven-dry soil was determined by dividing it by the total cylinder volume [34]. The pots, filled with airdried soils, were watered until fully saturated and covered with plastic mulch to prevent evaporation. After providing for drainage of excess water leaked from the bottom of the pots, the weight of the pots was accepted as field capacity [29,30]. Using a pH meter, the soil response (pH) values were obtained from a 1:5 (w:v, water:soil) soil-water suspension, and an an EC meter was used to identify the soil electrical conductivity (EC 25 °C) from the same soil-water suspension [35]. CaCO3 content was measured using a Scheibler calcimeter [36], available P contents were measured with extraction with 0.5 M NaHCO3 at pH 8.5 [37], and available K was measured from NH4OAc (pH, 7.0) extract according to [38]. The soil samples’ organic matter (OM) content was determined using the modified Walkley–Black method [39].
Irrigation water samples, pH and electrical conductivity (EC) values (Eutech PC 700), Mg, Na, K: AAS direct reading (Agilent 240 AA Atomic Absorption Spectrometer), Ca: Flame photometer direct reading (JENWAY/PFP7 flame photometer), CO3, HCO3: sulphuric acid titration [28], Cl: Mohr method (silver nitrate titration) [28], SO4: barium chloride method [40] (spectrophotometric) (Thermo Scientific™ GENESYS™ 10S UV-vis spectrophotometer), sodium adsorption rate (SAR) [28].

2.5.2. Morphological Measurements

This study investigated selected agronomic variables such as stem diameter, plant height, number of leaves, and stem and root weight. The plant height, expressed in centimetres, was measured from the root neck to the growth tip. Using a digital caliper, stem diameters (mm) were measured from three points of the plant and averages were noted. Moreover, the number of leaves and flowers (piece plant−1) was recorded. After cutting the tomato plants from the root collar, their stems and roots were weighed to determine their fresh weight (g). The same samples were then dried in an oven at 65 °C to determine their dry weight (g). These steps were carried out at the end of the experiment.

2.5.3. Measurement and Analysis of Quality Parameters

For each sample, tomatoes of the same size and maturity free of external defects were gathered to determine the quality parameters. The sample’s water was extracted using an extractor. A digital calliper with ±0.1 mm sensitivity was used to measure the width and length of the fruit in millimetres. The weight of the fruit (g) was measured with an electronic scale with ±0.005 g sensitivity. After harvest, the firmness of the fruit was measured with a penetrometer (Force Gauge brand, PCE-PTR 200 model). In fruit juice extracts, solid content, pH, and titratable acidity were determined. A Hanna HI 96,801 digital refractometer measured TSS (%) (°Brix). An HI 9321 digital pH meter was used for the pH measurement. Titratable acidity was determined via titration with 0.1 N NaOH up to an endpoint of pH 8.1 and given as a percentage of citric acid in 100 mL of juice. Colour measurement of fruit picked up randomly from each replication was carried out using a colourimeter (Konica-Minolta CR-410). Based on a white plate, the L*, a*, and b* values for colour measurement were determined following the calibration procedure. L determines the lightness or darkness of the colour, from black (0) to white (100), and a and b determine the colour on a colour plane perpendicular to L. On the horizontal axis, +a represents red, −a represents green, +b on the vertical axis indicates yellow and −b indicates blue. Hue, which determines the basic components of the colour, and chroma, which determines the saturation and liveliness of the colour, were calculated from a and b [41].
Additionally, yield values (g pot−1) for each plant were measured. When the fruit reached the variety’s desired size and colour, harvesting was completed. The total yield value was determined by totalling the end-harvest yield values at the end of the treatment. Marketable fruit weight classification and yield (g pot−1) calculation were carried out as per [42,43]. Accordingly, depending on fruit width, marketable yield is classified as follows: Class I > 5.5 cm, 4.5 cm < Class II > 5.5 cm, 3.5 cm < Class III > 4.5 cm, and 3.5 cm < Class IV. Tomato fruit that was too small, misshapen or cracked was considered unmarketable yield [42,43].

2.6. Weather Data Measurements

Inside and outside air temperatures were measured with Onset HOBO U12 data loggers, which record temperature and relative humidity values. These devices can measure temperature in the range of −20/+70 °C with an accuracy of ±0.35 °C, and relative humidity measurements between 5% and 95% with an accuracy of 2.5%. The inside and outside greenhouse environment measurements were recorded at 1 h intervals.

2.7. Statistical Analysis

The statistical program SPSS 15.0 was used to study the differences in tomato characteristics between irrigation levels and VC doses. When the differences between the means were statistically significant (p < 0.05), the mean values of traits were compared using Duncan’s multiple range test.

3. Results and Discussion

3.1. Morphological Properties of Tomatoes

Morphological observations are important for determining plants’ optimum productivity [10]. The morphological properties of tomatoes in the experiment are given in Table 5.
The results show that the responses of tomatoes to irrigation level and VC dose applications are different. Accordingly, the highest stem diameter was obtained in I50VC10 and the lowest in I50VC0 treatment. Stem diameters were statistically significantly affected by irrigation level and VC doses (p < 0.01). Additionally, the interaction of irrigation level × VC doses significantly affected stem diameter (p < 0.05). Gutiérrez-Miceli et al. [44] applied different doses of vermicompost:soil (1:1, 1:2, 1:3, 1:4, 1:5 and 0:1) for tomatoes. The highest stem diameter was found in the 1:4 application. Additionally, it was determined that vermicompost doses increased stem diameter values compared to the control application. Siingh et al. [45] found the difference between stem diameter values in two different applications in tomato production (3-day intermittent irrigation + 5 t ha−1 VC and 3-day intermittent irrigation) to be insignificant (p > 0.05). Colimba-Limaico et al. [31] found that the values for stem diameter increased with increasing irrigation levels (80%, 100%, 120% and 140%). Boyacı et al. [46] found that the difference in plant stem diameter between different irrigation levels (60%, 80%, 100% and 120%) was significant (p < 0.01). In this study, increasing irrigation levels and VC doses increased plant stem diameter.
Moreover, this study found that in the I100VC20 and I50VC0 treatments, plant height was highest and lowest, respectively. In addition, plant heights were in the same group in I100VC20, I100VC10 and I75VC10 treatments. Plant height values were significantly affected by irrigation level and VC doses (p < 0.01). However, irrigation level × VC dose interactions significantly influenced plant height (p > 0.05). Gutiérrez-Miceli et al. [44] used six different vermicompost:soil treatments (1:1, 1:2, 1:3, 1:4, 1:5 and 0:1) in tomato cultivation. While average plant heights increased in all treatments in the first harvest, there was a difference in the 1:1 application in the second harvest compared to the control treatment (p < 0.05). The highest plant height was achieved in the 1:4 application in the first harvest and in the 1:1 application in the second harvest. Siingh et al. [45] found the difference between plant heights in two different applications in tomato cultivation (3-day intermittent irrigation + 5 t ha−1 VC and 3-day intermittent irrigation) to be insignificant (p > 0.05). In previous research, Colimba-Limaico et al. [31] reported that plant height increased as the irrigation level increased. According to research by Atilgan et al. [47], tomato plants grown under full irrigation settings have an average height considerably taller than those grown under deficit irrigation conditions (p > 0.05). Similarly, this study determined that increasing irrigation levels and VC doses increased plant height values.
In the experiment, I75VC20 applications produced more leaves, while I50V0 applications produced fewer. Leaf numbers were statistically significantly affected by irrigation level, VC doses and irrigation level × VC dose interactions (p < 0.01). Gutiérrez-Miceli et al. [44] determined that different vermicompost doses in tomatoes did not significantly influence the number of leaves in the first and second harvests. Atilgan et al. [47] stated that the difference in leaf numbers for different irrigation levels was insignificant. In this experiment, increased irrigation and VC treatments affected the number of plant leaves. Moreover, the highest number of flowers was obtained in I75VC20 and the lowest in I50VC0 treatments. According to the flower numbers obtained for the treatments, the effect of irrigation levels on the number of flowers was statistically significant (p < 0.05). The effect of VC doses was significant at p < 0.01. According to findings, increasing doses of VC increased the number of flowers. However, the result of the interaction of irrigation level × VC doses on the number of flowers was insignificant (p > 0.05). The highest stem wet weight was obtained in the I75VC20 treatments, and the highest stem dry weight was obtained in the I75VC10 treatments. In addition, the stem dry weight was also included in the same group in I75VC10, I100VC10 and I75VC20 treatments. The lowest fresh and dry weights were obtained in I100VC0 treatments. The effect of irrigation level on stem fresh weight was significant (p < 0.01), while its effect on stem dry weight was found to be insignificant (p > 0.05). The effect of VC treatments on fresh and dry stem weight was significant (p < 0.01). Additionally, the effect of irrigation level × VC dose interactions on stem wet weight was found to be insignificant (p > 0.05), while its effect on root dry weight was found to be significant (p < 0.05). According to the root fresh and dry weight values obtained for the treatments, the effect of irrigation level and VC doses on root fresh and dry weights was statistically significant (p < 0.01). Additionally, the effects of irrigation level × VC dose interactions on root fresh weight were significant (p < 0.05) and insignificant on root dry weight (p > 0.05). In a study conducted by Nazarideljou and Heidari [48], the shoot dry weight of the Zinnia elegance ‘Dreamland Red’ plant showed a tendency to decrease with increasing water stress (40% field capacity). Also, with high levels of drought stress, the addition of VC did not prevent biomass reduction. The highest was found at 70% irrigation level of shoot dry weight and 2.5–5% VC doses. Similarly, Guzman-Alborez [49] reported that leaf, stem, and root weights decreased under water-limit conditions. They also reported that leaf, stem and root weights were statistically in the same group at increasing VC doses compared to the control group. Researchers have reported that the highest amount of fresh and dry matter for tomato plants is obtained from increasing water levels [50,51]. In this study, stem fresh weight increased at I75 irrigation level and VC20 doses, while stem dry weights were higher at I75 irrigation and VC10 applications. While root fresh weight increased with VC20 doses, stem dry weight was higher in VC10 applications.

3.2. Quality Parameters of the Tomatoes

The quality parameters of the tomato fruit for different treatments are presented in Table 6. We found the widest fruit in the I100V10 treatment and the narrowest in the I50V0 treatment. In addition, fruit width was the same groups I100VC0, I100VC10 and I100VC20 treatments. According to the fruit width values obtained for the treatments, statistically significant differences were determined between the irrigation level treatments (p < 0.01). Vermicompost doses and irrigation level × VC doses interactions on fruit width were insignificant (p > 0.05). Moreover, the highest fruit length was achieved in I100VC20 treatments and the lowest in I50VC0 treatments. According to the fruit length values obtained for the treatments, the effect of irrigation level and VC doses on fruit size was statistically significant (p < 0.01). The effect of irrigation level × VC interaction on fruit length was insignificant (p > 0.05). Boyacı et al. [46] found that the difference between tomato fruit width and fruit length values between different irrigation levels (60%, 80%, 100% and 120%) was statistically significant (p < 0.01). Similarly, increased irrigation levels increased fertilizer intake and contributed positively to fruit width and height values.
This study obtained the highest fruit weight in I100VC10 and the lowest in I50VC0 treatments. According to the fruit weight values achieved for the treatments, the effect of irrigation level on fruit weight was significant (p < 0.01). The influence of VC doses and irrigation level × VC interaction on fruit weight was insignificant (p > 0.05). Siingh et al. [45] found the difference between tomato fruit weight values to be insignificant (p > 0.05) in their study, in which VC was not applied and 5 t/ha VC was applied. Boyacı et al. [46] noticed that the difference in fruit weight values between different irrigation levels (60%, 80%, 100% and 120%) was significant (p < 0.01). In their experiment, since mineral matter intake decreased at decreasing irrigation levels, fruit weight values increased at increasing irrigation levels.
Low pH values (around 2.0) typically indicate sour fruit in quality analyses [52]. That study obtained the highest pH value in I50V10 and the lowest in I100VC20 treatments. According to the pH values obtained for the treatments, the effect of irrigation water level and VC doses on pH was statistically significant (p < 0.01). However, the effects of irrigation level × VC dose interactions on pH were insignificant (p > 0.05). The pH of tomato juice is an important quality parameter that determines taste. In previous research, Lovelli et al. [53] and Boyaci et al. [46] reported that the difference between different irrigation levels and pH values was statistically significant (p < 0.01). Gutiérrez-Miceli et al. [44] found that vermicompost applications statistically affected pH values in tomato cultivation compared to the control group without VC (p < 0.05). It was also reported that the differences between VC applications were insignificant (p > 0.05). Similarly, that study determined that the effect of irrigation and vermicompost doses on pH was important.
Fruit flesh firmness and skin resistance in tomatoes are critical harvest criteria against mechanical damage, as they change during storage, distribution and maturity [54]. According to fruit flesh hardness values, the effect of irrigation level, VC doses, and the interaction of irrigation level × VC doses on fruit flesh hardness was significant (p < 0.01). Boyaci et al. [46] determined that fruit flesh firmness values between irrigation levels increased by 120% and decreased by 60%. Accordingly, water stress was found to reduce fruit flesh firmness significantly. In our findings, fruit flesh firmness values decreased with decreasing water levels.
A low acidity value indicates sweet fruit in a quality analysis [52]. According to the TA values obtained for the treatments, the effect of irrigation level, vermicompost doses and irrigation level x vermicompost interaction on TA was statistically significant (p < 0.01). According to research, TA decreases as irrigation level increases [46,55]. In that study, increasing irrigation levels decreased TA values, while increasing VC doses increased TA values.
TSS in tomato fruit is an important ingredient that creates fruit aroma [56]. The effects of irrigation level, VC doses and irrigation level × VC interactions on TSS were statistically significant (p < 0.01). Researchers have found the highest TSS in tomatoes at different irrigation levels, where water limitation is highest [31,55]. Siingh et al. [45] found the TSS value to be 4.3° Brix in 3-day intermittent irrigation application and 4.9° Brix in 5 t ha−1 VC + 3-day intermittent irrigation application. Accordingly, it was determined that the VC application reduced the TSS value. Gutiérrez-Miceli et al. [44] reported that TSS increased in vermicompost doses compared to the control application. Similar to the study conducted by the researchers, increasing irrigation levels and VC doses increased TSS.
According to the hue and chroma values obtained for the treatments, the effects of irrigation level × VC dose interactions on hue and chroma were statistically significant (p < 0.01). Fruit colour is one of the most significant quality parameters affecting fruit attractiveness in tomatoes [57]. The fruit colour hue angle values express the colour tone of tomatoes. A lower hue colour angle value causes the red colour to appear better [58]. In tomato fruit, fruit skin colour and chroma values are expressions of colour saturation and vividness [59]. In Goel and Kaur [60], tomatoes under treatments VC15, VC30, VC45 were better in colour than control plants. In this study, VC10 doses were found to be redder, and VC20 doses were found to be more vivid. Additionally, more red tomatoes were obtained at decreasing irrigation levels. Thus, this research found that combining irrigation levels and VC doses influenced the tomato’s colour and vividness.

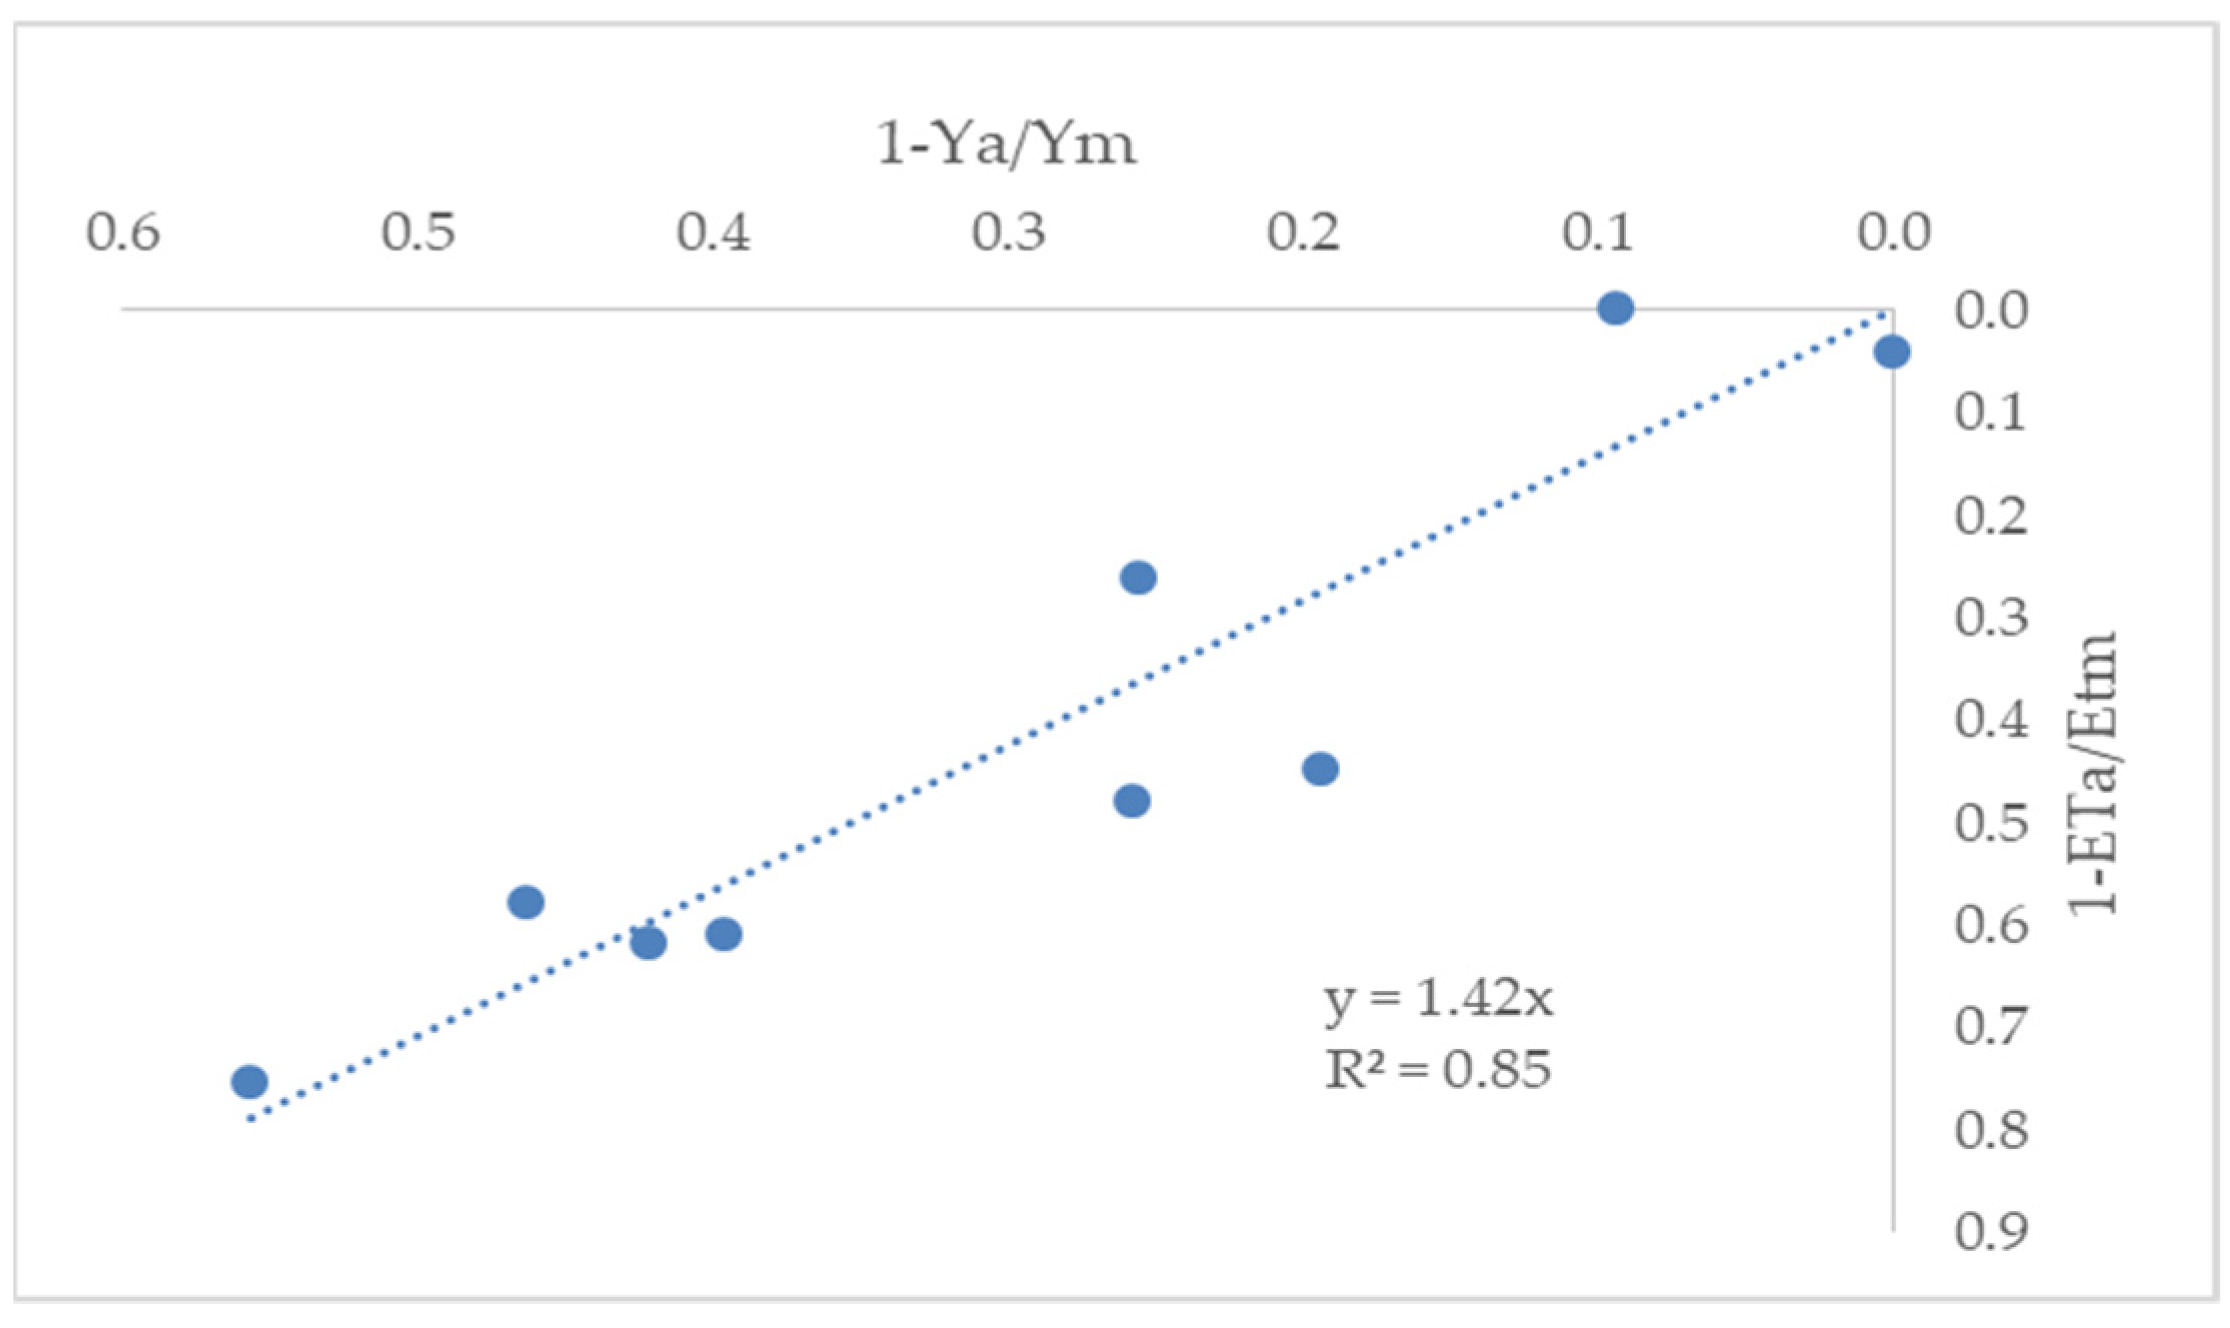
3.3. Water Consumption and Yield Relationships

Because it affects fruit set and quality, water management is crucial for tomatoes at every stage of plant growth. Based on the treatments, water consumption, yield and WUE values are given in Table 7.
ET decreased because of insufficient water application at irrigation levels; therefore, lower evapotranspiration was obtained in the I50 treatments. Furthermore, the highest ET value was determined in the I100VC10 (47.8 L) and the lowest in the I50VC0 (21.2 L) treatments. According to the ET values obtained for the treatments, the effect of the interaction of irrigation level × VC doses on ET was found to be statistically significant (p < 0.01). Accordingly, the study found that irrigation levels and vermicompost doses affected ET values. Demir [25] conducted measurements at different irrigation levels (100, 50 and 25%) and VC doses (0, 2.5 and 5% w/w). A study reported that 5% VC application increased the field capacity of the soil compared to a non-vermicompost application. Accordingly, the highest usable available water capacity was obtained with 5% VC application. Şenyiğit et al. [23] applied different irrigation levels (100, 75, 50, 25, 0%) and different VC doses (0, 1000 and 2000 kg ha−1). The study reported that VC doses reduced water consumption by reducing the need for irrigation water. Similar to the studies conducted by the researchers, it was determined that 20% VC application increased the usable water retention capacity and had a lower ET value than 10% VC application. This study obtained the highest total yield from the I100V20 (947.9 g pot−1) and the lowest total yield. Additionally, application I100VC20 produced the maximum marketable yield (947.9 g pot−1), while application I50VC0 produced the lowest total yield (165.3 g pot−1). According to the total yield and total marketable yield values obtained for the treatments, the interaction of irrigation level × VC doses on total yield and total marketable yield was statistically significant (p < 0.01). Thus, this study found that tomatoes’ yield and marketable yield values were influenced by the amount of irrigation and the dosage of VC. Yang et al. [26] compared vermicompost application and three different irrigation levels (low irrigation: 50–60%, medium irrigation: 60–70% and high irrigation: 70–80%). According to study findings, a higher yield in VC application was obtained with the water level of medium irrigation (60–70%). Compared to low and high irrigation levels, the yield rose by 28.22% and 14.07%, respectively, at the medium irrigation level. Demir [25] conducted studies on lettuce plants at different irrigation levels (100, 50 and 25%) and VC doses (0, 2.5, and 5% w/w). They reported that VC applications, irrigation level and VC × irrigation level interactions significantly affected lettuce yield. Accordingly, the highest yield (178.7 g pot−1) was achieved from applying 5% VC at the highest irrigation level (100%). Similarly, the highest tomato yield was obtained at 100% irrigation level and increasing VC doses. Therefore, it can be found that increased irrigation levels increase vermicompost intake and yield.
Water use efficiency is an indicator that shows the effective use of water resources in crop production. If the water supply is restricted, this indicator is key in choosing the right irrigation management techniques [61]. In this study, the highest total WUE was obtained from the treatment of I100VC20 (21.9 g L−1), while the lowest total WUE was obtained from I50VC0 (11 g L−1). The highest marketable WUE was obtained from treatment I100VC20 (21.9 g L−1), and the lowest total WUE was I50VC0 (11 g L−1). According to the total WUE and marketable WUE values obtained for the treatments, the effect of irrigation level × VC interaction on total WUE and marketable WUE was statistically significant (p < 0.01). The study findings determined that irrigation levels and VC doses affected tomatoes’ total WUE and marketable WUE values. Pereira et al. [10] reported that farmers may be more successful in maximizing water efficiency than agricultural productivity, particularly in areas with limited water resources like the Mediterranean basin. Nazarideljou and Heidari [48] investigated the effects of different irrigation levels (40, 70 and 100%) and different levels of VC (0, 2.5 and 5%) on Zinnia elegance ‘Dreamland Red’. The study found the highest WUE value at 70% irrigation level and 2.5% VC, and the lowest WUE value at 40% irrigation level and 0 VC. This study found the highest total and marketable WUE for the I100VC20 treatment (21.9 g L−1). However, applying I75VC20 (18.2 g L−1) in places with water shortage and applying I100VC10 (19.0 g L−1) in places with high fertiliser costs may yield positive results in maintaining the water and productivity balance.
Knowledge of the yield response factor (ky) reduces yield losses during the growing season by making it possible to select the best crop for a particular location and season according to the water deficit condition. Planning for production heavily depends on how different crops will respond in terms of yield to a water deficit [10]. The relationship between relative yield decreased and relative evapotranspiration deficit is presented in Figure 1.
Efficient water management and economic evaluation require information on water–yield relationships [62]. The yield response factor (ky) for tomatoes was 1.42 for the growing season (Figure 1). The higher the value of Ky, the less tolerant the tomato is to drought [63]. The yield response factor, which approaches 1 when yield decreases proportionately to ET deficiency, shows how tolerant a crop is to water stress [64]. Although tomato is a relatively moderately sensitive crop, the estimated value of the Ky is 1.05 [65]. Tomatoes require varied amounts of water at different stages of growth. Based on deficit irrigation during specific stages of tomato growth, several researchers have found that flowering and fruiting were the phenological stages most susceptible to water stress [66,67,68]. The study by Ayas [69] to examine the effects of water deficit on some tomato parameters during four crop growth stages in the greenhouse found the ky value between 0.48 and 1.59. In another study, Ayas [70] stated that the Ky factor for tomatoes in the unheated greenhouse was 1.0. Cui et al. [71] in the high tunnel, found the ky value in tomato in different periods, vegetative phase (0.27–0.37), flowering and fruit development phase (0.61–0.91) and the fruit ripening phase (1.56–2.41). The yield response factor (ky) for processing tomato, Kuşçu et al. [62] was found 1.59 and Kuşçu et al. [72] 1.65. When deficit evapotranspiration is applied, the value of ky can vary with location, species, variety, irrigation technique, management, and growth stage [73,74]. Proper irrigation management is essential for crops cultivated in greenhouses to be more productive and of higher quality. Crops within the greenhouse need regular watering to reduce water stress, maximize yield, and maintain high quality. Water application scheduling is particularly important, since insufficient irrigation results in water stress and lowers productivity, whilst excessive irrigation lowers yield [75]. In that experiment, the ky value was higher than 1, showing that the plant is sensitive to unit water deficit. Moreover, the high ky value determined in this study stated that the yield reduction rate was proportionally higher than the relative evapotranspiration deficit.

4. Conclusions

It has been revealed that irrigation and fertilization are necessary to obtain higher yields per unit area in tomato cultivation under greenhouse conditions. Irrigation level and VC doses significantly affected crop growth, yield, and WUE. The effects of irrigation level and VC dose applications on the morphological and phenological characteristics, water consumption, WUE and yield parameters of the tomato plant examined were visible at the highest application dose (I100VC20). Considering irrigation costs, it is appropriate to choose full irrigation (I100VC20), which provides the highest efficiency from the unit area under conditions where water is sufficient and cheap. In regions where water is limited or expensive, it is thought that a constraint application between the I75VC20 and full irrigation treatments, where WUE and productivity are high, may be useful. In regions where fertilizer is limited or expensive, it is thought that the treatment of I100VC10 may be beneficial due to its high efficiency and marketable WUE. The study results concluded that 10% and 20% VC doses can be recommended because they reduce the plant’s water consumption, increase productivity, and are environmentally friendly fertilizers. More research on various species and production techniques is necessary to evaluate the possible long-term consequences on agricultural systems.

Author Contributions

Conceptualization, S.B., A.A. and J.K.; methodology, S.B., J.K. and A.A.; validation, S.B., R.R. and D.L.; formal analysis, S.B. and M.N.; investigation, S.B. and A.A.; resources, S.B.; data curation, S.B.; writing—original draft preparation, S.B., J.K. and A.A.; writing—review and editing, S.B., J.K., A.A. and D.L.; visualization, S.B.; supervision, A.A., M.N. and R.R.; project administration, A.A. and R.R.; funding acquisition, S.B. and D.L. All authors have read and agreed to the published version of the manuscript.

Funding

This research received no external funding.

Data Availability Statement

Data are contained within the article.

Conflicts of Interest

The authors declare no conflicts of interest.

References

  1. İnce Kaya, Ç.; Yazar, A. Saltmed model performance for quinoa irrigated with fresh and saline water in a mediterranean environment. Irrig. Drain. 2016, 65, 29–37. [Google Scholar] [CrossRef]
  2. Shammout, M.W.; Qtaishat, T.; Rawabdeh, H.; Shatanawi, M. Improving water use efficiency under deficit irrigation in the Jordan Valley. Sustainability 2018, 10, 4317. [Google Scholar] [CrossRef]
  3. Uçak, A.B.; Atılgan, A.; Korytowski, M.; Kocięcka, J.; Liberacki, D.; Stachowski, P.; Saltuk, B.; Rolbiecki, R. Derinkuyu dry bean irrigation planning in semi-arid climate by utilising crop water stress index values. J. Water Land Dev. 2023, 59, 1–8. [Google Scholar] [CrossRef]
  4. Rolbiecki, R.; Yücel, A.; Kocięcka, J.; Atilgan, A.; Marković, M.; Liberacki, D. Analysis of SPI as a Drought Indicator during the Maize Growing Period in the Çukurova Region (Turkey). Sustainability 2022, 14, 3697. [Google Scholar] [CrossRef]
  5. Fereres, E.; Soriano, M.A. Deficit irrigation for reducing agricultural water use. J. Exp. Bot. 2007, 58, 147–159. [Google Scholar] [CrossRef] [PubMed]
  6. Parry, M.A.J.; Flexas, J.; Medrano, H. Prospects for crop production under drought: Research priorities and future directions. Ann. Appl. Biol. 2005, 147, 211–226. [Google Scholar] [CrossRef]
  7. Topcu, S.; Kirda, C.; Dasgan, Y.; Kaman, H.; Cetin, M.; Yazici, A.; Bacon, M.A. Yield response and N-fertiliser recovery of tomato grown under deficit irrigation. Eur. J. Agron. 2007, 26, 64–70. [Google Scholar] [CrossRef]
  8. Pereira, L.S.; Oweis, T.; Zairi, A. Irrigation management under water scarcity. Agric. Water Manag. 2002, 57, 175–206. [Google Scholar] [CrossRef]
  9. Costa, J.M.; Ortuno, M.F.; Chaves, M.M. Deficit irrigation as a strategy to save water: Physiology and potential application to horticulture. J. Integr. Plant Biol. 2007, 49, 1421–1434. [Google Scholar] [CrossRef]
  10. Kiymaz, S.; Basak, H.; Ertek, A. Growth, yield and water use efficiency responses of greenhouse-grown bell pepper (Capsicum Annum L.) cultivars to different irrigation and nitrogen applications. Fresenius Environ. Bull. 2020, 29, 5568–5674. [Google Scholar]
  11. Katsoulas, N.; Kittas, C. Impact of greenhouse microclimate on plant growth and development with special reference to the Solanaceae. Eur. J. Plant Sci. Biotechnol. 2008, 2, 31–44. [Google Scholar]
  12. Ivushkin, K.; Bartholomeus, H.; Bregt, A.K.; Pulatov, A.; Kempen, B.; de Sousa, L. Global mapping of soil salinity change. Remote Sens. Environ. 2019, 231, 111260. [Google Scholar] [CrossRef]
  13. Zhang, X.; Tang, H.M.; Du, H.; Bao, Z.L.; Shi, Q.H. Sugar metabolic and N-glycosylated profiles unveil the regulatory mechanism of tomato quality under salt stress. Environ. Exp. Bot. 2020, 177, 104145. [Google Scholar] [CrossRef]
  14. Zhao, S.S.; Zhang, Q.K.; Liu, M.Y.; Zhou, H.P.; Ma, C.L.; Wang, P.P. Regulation of plant responses to salt stress. Int. J. Mol. Sci. 2021, 22, 4609. [Google Scholar] [CrossRef]
  15. Qasim, M.; Ju, J.; Zhao, H.; Bhatti, S.M.; Saleem, G.; Memon, S.P.; Ali, S.; Younas, M.U.; Rajput, N.; Jamali, Z.H. Morphological and Physiological Response of Tomato to Sole and Combined Application of Vermicompost and Chemical Fertilizers. Agronomy 2023, 13, 1508. [Google Scholar] [CrossRef]
  16. Hu, Y.; Sun, Z.; Wang, D.; Sun, Y. Analysis of antagomistic microorganism in vermicompost. Chin. J. Appl. Environ. Biol. 2004, 10, 99–103, (In Chinese with English Abstract). [Google Scholar]
  17. Wu, D.; Chen, C.; Liu, Y.; Zhang, G.; Yang, L. Vermicompost improves tomato yield and quality by promoting carbohydrate transport to fruit under salt stress. Horticulturae 2023, 9, 1015. [Google Scholar] [CrossRef]
  18. Alam, M.N.; Jahan, M.S.; Ali, M.K.; Ashraf, M.A.; Islam, M.K. Effect of vermicompost and chemical fertilizers on growth, yield and yield components of potato in barind soils of Bangladesh. J. Appl. Sci. Res. 2007, 12, 1879–1888. [Google Scholar]
  19. Ali, M.; Griffiths, A.J.; Williams, K.P.; Jones, D.L. Evaluating the Growth Characteristics of Lettuce in Vermicompost and Greenwaste Compost. Eur. J. Soil Biol. 2007, 43, 316–319. [Google Scholar] [CrossRef]
  20. Orozco, F.H.; Cegarry, J.; Trrujillo, L.M.; Roig, A. Vermicomposting of coffee pulp using the earthworm Eisenia fetida: Effects on C and N contents and the availability of nutrients. Biol. Fertil. Soils 1996, 22, 162–166. [Google Scholar] [CrossRef]
  21. Bossuyt, H.; Six, J.; Hendrix, P.F. Protection of soil carbon by microaggregates within earthworm casts. Soil Biol. Biochem. 2005, 37, 251–258. [Google Scholar] [CrossRef]
  22. Rehman, S.U.; De Castro, F.; Aprile, A.; Benedetti, M.; Fanizzi, F.P. Vermicompost: Enhancing plant growth and combating abiotic and biotic stress. Agronomy 2023, 13, 1134. [Google Scholar] [CrossRef]
  23. Şenyiğit, U.; Toprak, M.; Çoşkan, A. Farklı sulama suyu düzeyleri ve vermikompost dozlarının cam sera koşullarında yetiştirilen fesleğen (Ocimum basilicum L.) bitkisinin su tüketimi ve verimine etkileri. Türk Bilim Ve Mühendislik Derg. 2021, 3, 37–43. [Google Scholar]
  24. Coşkan, A.; Şenyiğit, U. Farklı sulama suyu düzeyi ve vermikompost dozlarının marul bitkisinin mikro element alımına etkileri. Ziraat Fakültesi Derg. 2018, 348–356. [Google Scholar]
  25. Demir, Z. Effects of vermicompost on soil physicochemical properties and lettuce (Lactuca sativa Var. Crispa) yield in greenhouse under different soil water regimes. Commun. Soil Sci. Plant Anal. 2019, 50, 2151–2168. [Google Scholar] [CrossRef]
  26. Yang, L.; Zhao, F.; Chang, Q.; Li, T.; Li, F. Effects of vermicomposts on tomato yield and quality and soil fertility in greenhouse under different soil water regimes. Agric. Water Manag. 2015, 160, 98–105. [Google Scholar] [CrossRef]
  27. Meteoroloji Genel Müdürlüğü. Climate Kırşehir (Turkey). Available online: https://www.mgm.gov.tr/veridegerlendirme/il-ve-ilceler-istatistik.aspx?m=KIRSEHIR (accessed on 15 October 2023).
  28. USSL. Diagnoses and Improvement of Saline and Alkali Soils; Richards, L.A., Ed.; United State Salinity Laboratory Staff, USDA_SCS, Agriculture Handbook No. 60; USSL: Washington, DC, USA, 1954; 160p. [Google Scholar]
  29. Kurunc, A.; Unlukara, A.; Cemek, B. Salinity and drought affect yield response of bell pepper similarly. Acta Agric. Scand. Sect. B Soil Plant Sci. 2011, 61, 514–522. [Google Scholar] [CrossRef]
  30. Ünlükara, A.; Kurunc, A.; Cemek, B. Green Long Pepper Growth under Different Saline and Water Regime Conditions and Usability of Water Consumption in Plant Salt Tolerance. J. Agric. Sci. 2015, 21, 167–176. [Google Scholar] [CrossRef]
  31. Colimba-Limaico, J.E.; Zubelzu-Minguez, S.; Rodríguez-Sinobas, L. Optimal irrigation scheduling for greenhouse tomato crop (Solanum lycopersicum L.) in Ecuador. Agronomy 2022, 12, 1020. [Google Scholar] [CrossRef]
  32. Doorenbos, J.; Kassam, A.H. Yield Response to Water; Irrigation and Drainage Paper 1986, No. 33; FAO: Rome, Italy, 1979; 193p. [Google Scholar]
  33. Bouyoucus, G.Y. A Calibaration of the hydrometer for making mechanical analysis of soils. Agron. J. 1951, 43, 434–438. [Google Scholar] [CrossRef]
  34. Blake, G.R.; Hartge, K.H. Bulk Density. In Methods of Soil Analysis; Klute, A., Ed.; Part 1—Physical and Mineralogical Methods Second Edition; American Society of Agronomy: Madison, WI, USA, 1986. [Google Scholar]
  35. Rhoades, J.; Chandavi, D.; Lesch, S.F. Soil Salinity Assessment Methods and Interpretation of Electrical Conductivity Measurement; FAO Irrigation and Drainage Paper 57; FAO: Rome, Italy, 1999. [Google Scholar]
  36. USDA. Soil Survey Staff; Soil Survey Manuel; USDA Handbook. No: 18; USDA: Washington DC, USA, 1993. [Google Scholar]
  37. Olsen, S.R.; Cole, V.; Watanabe, F.S.; Dean, L.A. Estimation of Available Phosphorus in Soils by Extraction with Sodium Bicarbonate; U.S. Department of Agriculture: Washington DC, USA, 1954. [Google Scholar]
  38. Jackson, M.L. Soil Chemical Analysis; Prentice Hall of India Private Limited: New Delhi, India, 1958. [Google Scholar]
  39. Nelson, D.W.; Sommers, L.E. Methods of Soil Analysis, Part 2. Chemical and Microbiological Properties, 2nd ed.; Page, A.L., Miller, R.H., Keeney, D.R., Eds.; Başbakanlık Köy Hizmetleri Genel Müdürlüğü Yayın Evi: Madison, WI, USA, 1982. [Google Scholar]
  40. Eltan, E. İçme ve Sulama Suyu Analiz Yöntemleri. Başbakanlık Köy Hizmetleri Genel Müdürlüğü Yayın Evi, Ankara, 109 sy. 1998. Available online: https://kutuphane.tarimorman.gov.tr/vufind/Record/15528 (accessed on 10 February 2024).
  41. McGuire, G.R. Reporting of objective color measurements. HortScience 1992, 27, 1254–1255. [Google Scholar] [CrossRef]
  42. Tüzel, Y.; Duyar, H.; Öztekin, G.B.; Gül, A. Domates Anaçlarının Farklı Dikim Tarihlerinde Bitki Gelişimi, Sıcaklık Toplamı İsteği, Verim ve Kaliteye Etkileri. Ege Üniv. Ziraat Fak. Derg. 2009, 46, 79–92. [Google Scholar]
  43. Boyacı, S.; Akyüz, A. Effect of greenhouse cooling methods on the growth and yield of tomato in a Mediterranean climate. Int. J. Hortic. Agric. Food Sci. 2018, 2, 199–207. [Google Scholar] [CrossRef]
  44. Gutiérrez-Miceli, F.A.; Santiago-Borraz, J.; Molina, J.A.M.; Nafate, C.C.; Abud-Archila, M.; Llaven, M.A.O.; Rinco´n-Rosales, R.; Dendooven, L. Vermicompost as a soil supplement to improve growth, yield and fruit quality of tomato (Lycopersicum esculentum). Bioresour. Technol. 2007, 98, 2781–2786. [Google Scholar] [CrossRef]
  45. Siingh, B.K.; Pathak, K.A.; Ramakrıshna, Y.; Verma, V.K.; Deka, B.C. Vermicompost, mulching and irrigation level on growth, yield and TSS of Tomato (Solanum lycopersicum L.). Indian J. Hill Farming 2013, 26, 105–110. [Google Scholar]
  46. Boyaci, S.; Kocięcka, J.; Atilgan, A.; Liberacki, D.; Rolbiecki, R.; Saltuk, B.; Stachowski, P. Evaluation of Crop Water Stress Index (CWSI) for High Tunnel Greenhouse Tomatoes under Different Irrigation Levels. Atmosphere 2024, 15, 205. [Google Scholar] [CrossRef]
  47. Atilgan, A.; Rolbiecki, R.; Saltuk, B.; Jagosz, B.; Arslan, F.; Erdal, I.; Aktas, H. Deficit Irrigation Stabilizes Fruit Yield and Alters Leaf Macro and Micronutrient Concentration in Tomato Cultivation in Greenhouses: A Case Study in Turkey. Agronomy 2022, 12, 2950. [Google Scholar] [CrossRef]
  48. Nazarideljou, M.J.; Heidari, Z. Effects of vermicompost on growth parameters, water use efficiency and quality of zinnia bedding plants (Zinnia elegance ‘Dreamland Red’) under different ırrigation regimes. Int. J. Hortic. Sci. Technol. 2014, 1, 141–150. [Google Scholar] [CrossRef]
  49. Guzmán-Albores, J.M.; Montes-Molina, J.A.; Castañón-González, J.H.; Abud-Archila, M.; Gutiérrez-Miceli, F.A.; Ruíz-Valdiviezo, V.M. Effect of different vermicompost doses and water stress conditions on plant growth and biochemical profile in medicinal plant, Moringa oleifera Lam. J. Environ. Biol. 2020, 41, 240–246. [Google Scholar] [CrossRef]
  50. Kirda, C.; Cetin, M.; Dasgan, Y.; Topcu, S.; Kaman, H.; Ekici, B.; Derici, M.R.; Ozguven, A.I. Yield response of greenhouse grown tomato to partial root drying and conventional deficit irrigation. Agric. Water Manag. 2004, 69, 191–201. [Google Scholar] [CrossRef]
  51. Patanè, C.; Tringali, S.; Sortino, O. Effects of deficit irrigation on biomass, yield, water productivity and fruit quality of processing tomato under semi-arid Mediterranean climate conditions. Sci. Hortic. 2011, 129, 590–596. [Google Scholar] [CrossRef]
  52. Brown, A. Understanding Food Principles and Preparation; Thomson Wadsworth: Belmont, CA, USA, 2007; pp. 245–266. [Google Scholar]
  53. Lovelli, S.; Potenza, G.; Castronuovo, D.; Perniola, M.; Candido, V. Yield, quality and water use efficiency of processing tomatoes produced under different irrigation regimes in Mediterranean environment. Ital. J. Agron. 2017, 12, 795. [Google Scholar] [CrossRef]
  54. Batu, A. Determination of acceptable firmness and colour values of tomatoes. J. Food Eng. 2004, 61, 471–475. [Google Scholar] [CrossRef]
  55. Hong, M.; Zhang, Z.; Fu, Q.; Liu, Y. Water requirement of solar greenhouse tomatoes with drip irrigation under mulch in the Southwest of the Taklimakan Desert. Water 2022, 14, 3050. [Google Scholar] [CrossRef]
  56. Özkaplan, M. Serada Topraksiz Domates Yetiştiriciliğinde Büyüme, Gelişme ve Verim Üzerine ışik ve Sıcaklığın Kantitatif Etkilerinin Modellenmesi. Master’s Thesis, Ondokuz Mayıs Üniversitesi Fen Bilimleri Enstitüsü, Samsun, Türkiye, 2018. [Google Scholar]
  57. Matas, A.J.; Gapper, N.E.; Chung, M.-Y.; Giovannoni, J.J.; Rose, J.K.C. Biology and genetic engineering of fruitmaturation for enhanced quality and shelf-life. Curr. Opin. Biotechnol. 2009, 20, 197–203. [Google Scholar] [CrossRef] [PubMed]
  58. Özkaplan, M.; Balkaya, A. The effects of light and temperature on the fruit quality parameters of cluster tomatoes growing in soilless culture. Anadolu J. Agric. Sci. 2019, 34, 227–238. [Google Scholar] [CrossRef]
  59. Radzevičius, A.; Karklelienė, R.; Viškelis, P.; Bobinas, C.; Bobinaitė, R.; Sakalauskienė, S. Tomato (Lycopersicon esculentum Mill.) fruit quality and physiological parameters at different ripening stages of; Lithuanian cultivars. Agron. Res. 2009, 7, 712–718. [Google Scholar]
  60. Goel, S.; Kaur, N. Impact of Vermicompost on Growth, Yield and Quality of Tomato Plant (Lycopersicum esculentum). J. Adv. Lab. Res. Biol. 2012, 3, 281–284. [Google Scholar]
  61. Mukherjee, A.; Kundu, M.; Sarkar, S. Role of irrigation and mulch on yield, evapotranspiration rate and water use pattern of tomato (Lycopersicon esculentum L.). Agric. Water Manag. 2010, 98, 182–189. [Google Scholar] [CrossRef]
  62. Kuşçu, H.; Turhan, A.; Demir, A.O. The response of processing tomato to deficit irrigation at various phenological stages in a sub-humid environment. Agric. Water Manag. 2014, 133, 92–103. [Google Scholar] [CrossRef]
  63. Alomran, M.; Louki, I.I.; Aly, A.A.; Nadeem, M.E. Impact of deficit irrigation on soil salinity and cucumber yield under greenhouse condition in arid environment. J. Agric. Sci. Technol. 2013, 15, 1247–1259. [Google Scholar]
  64. Singh, Y.; Rao, S.S.; Regar, O.L. Deficit irrigation and nitrogen effects on seed cotton yield, water productivity and yield response factor in shallow soils of semi-arid environment. Agric. Water Manag. 2010, 97, 965–970. [Google Scholar] [CrossRef]
  65. Allen, R.G.; Pereira, L.S.; Raes, D.; Smith, M. Crop Evapotranspiration (Guidelines for Computing Crop Water Requirements); Irrigation and Drainage Paper Nº 56; FAO: Rome, Italy, 1998. [Google Scholar]
  66. Nangare, D.D.; Singh, Y.; Kumar, P.S.; Minhas, P.S. Growth, fruit yield and quality of tomato (Lycopersicon esculentum Mill.) as affected by deficit irrigation regulated on phenological basis. Agric. Water Manag. 2016, 171, 73–79. [Google Scholar] [CrossRef]
  67. Ripoll, J.; Urban, L.; Brunel, B.; Bertin, N. Water deficit effects on tomato quality depend on fruit developmental stage and genotype. J. Plant Physiol. 2016, 190, 26–35. [Google Scholar] [CrossRef]
  68. Khapte, P.; Kumar, P.; Burman, U.; Kumar, P. Defcit irrigation in tomato: Agronomical and physio-biochemical implications. Sci. Hort. 2019, 248, 256–264. [Google Scholar] [CrossRef]
  69. Ayas, S. Water-yield relationshıps of deficit irrigated tomato (Lycopersıcon Lycopersıcum L. Var. Hazar F1). Appl. Ecol. Environ. Res. 2019, 17, 7765–7781. [Google Scholar] [CrossRef]
  70. Ayas, S. The effects of different regimes on tomato (Lycopersicon lycopersicum L. var. Hazal) yield and quality characterictics under unheated greenhouse conditions. Bulg. J. Agric. Sci. 2015, 21, 1235–1241. [Google Scholar]
  71. Cui, J.; Shao, G.; Lu, J.; Keabetswe, L.; Hoogenboom, G. Yield, quality and drought sensitivity of tomato to water deficit during different growth stages. Sci. Agric. 2020, 77, e20180390. [Google Scholar] [CrossRef]
  72. Kuscu, H.; Turhan, A.; Ozmen, N.; Aydinol, P.; Demir, A.O. Optimizing levels of water and nitrogen applied through drip irrigation for yield, quality, and water productivity of processing tomato (Lycopersicon esculentum Mill.). Hort. Environ. Biotechnol. 2014, 55, 103–114. [Google Scholar] [CrossRef]
  73. Kirda, C. Deficit irrigation scheduling based on plant growth stages showing water stress tolerance. In FAO, Deficit Irrigation Practices; FAO Water Report No. 22; FAO: Rome, Italy, 2002; pp. 3–10. [Google Scholar]
  74. Kaboosi, K.; Kaveh, F. Sensitivity analysis of FAO 33 crop water production function. Irrig. Sci. 2012, 30, 89–100. [Google Scholar] [CrossRef]
  75. Locascio, S.J.; Smajstrla, A.G. Water application scheduling by pan evaporation for drip-irrigated tomato. J. Am. Soc. Hort. Sci. 1996, 121, 63–68. [Google Scholar] [CrossRef]
Figure 1. Relationships between relative tomato yield reduction as a function of relative ET deficit.
Water 16 01095 g001
Table 1. Climate parameters on the site.
Year Climate ParametersMayJuneJulyAugust
2022OutdoorTmean, °C15.420.222.020.3
RHmean, %60.960.550.952.9
IndoorTmean, °C24.626.728.023.7
RHmean, %47.350.541.960.3
Long-term (1930–2021)Tmean, °C15.519.723.123.0
RHmean, %60.254.247.647.6
Note: Tmean: mean air temperature; RHmean: relative humidity.
Table 2. Some physico-chemical properties of the experimental soil and vermicompost.
PropertiesSoilVermicompost
pH8.448.27
EC (µS cm−1)135.713,300
CaCO3 (%)41.95.99
OM (%)2.6537.11
Available P2O5 (kg da−1)8.70379.42
Available K2O (kg da−1)72.03726.56
Table 3. Analyses of the irrigation water used in the experiment.
pHEC, dS m−1Anions, meq L−1Cations, meq L−1SAR
CaMgKNaCO3HCO3ClSO4
7.700.622.81.200.051.40050.30.31.40
Note: pH is the water reaction, EC is the irrigation water electrical conductivity, and SAR is the sodium adsorption ratio.
Table 4. Phenological observation dates of tomatoes in the full irrigation treatments.
Growth Stages of TomatoI100VC0I100VC10I100VC20
Transplanting11 May11 May11 May
First flowering29 May27 May25 May
Fruit setting8 June6 June4 June
First picking17 July14 July10 July
Last picking8 August8 August8 August
Table 5. Morphological properties of tomatoes at different irrigation levels and vermicompost doses.
TreatmentsStem Diameter
(mm)
Plant Height
(cm)
Number of Leaves
(Pieces)
Number of Flowers
(Pieces)
Stem Wet Weight (g)Stem Dry Weight (g)Root Wet Weight (g)Root Dry Weight (g)
I50VC011.4 d67.2 b17.2 c13.3 d90.5 c42.2 cd49.0 cd27.4 de
I75VC011.6 d78.6 b17.0 c16.2 d94.7 c37.4 de43.1 d21.4 ef
I100VC011.6 d77.3 b16.7 c15.5 d70.3 c30.8 e40.6 d14.3 f
I50VC1014.9 a76.3 b17.8 c20.5 c165.0 b50.7 ab110.6 a46.6 a
I75VC1012.3 cd98.5 a21.2 ab20.7 bc193.3 b56.9 a83.1 b39.7 ab
I100VC1013.2 bc105.8 a20.8 ab21.3 bc181.4 b55.8 a73.6 b32.7 bcd
I50VC2013.8 ab79.4 b19.8 b23.0 bc195.8 b44.4 bcd91.2 ab38.6 abc
I75VC2012.9 bc82.0 b21.7 a26.8 a243.0 a55.0 a107.9 a47.1 a
I100VC2013.3 bc111.0 a20.5 ab23.7 b182.0 b48.2 abc71.1 bc29.8 cde
Irrigation*********NS****
VC****************
Irrigation × VC*NS**NSNS**NS
Note: Irrigation level, I100: 100% ET; I75: 75% ET; I50: 50% ET; vermicompost doses, VC0: no vermicompost; VC10: 10% VC; VC20: %20 VC, a–f different letters within the same column show significant differences at p < 0.05 significance level. *, ** Significant at the 0.01 and 0.05 probability levels, respectively. NS, Non-significant.
Table 6. Quality parameters of tomatoes at different treatments.
TreatmentsWidth
(mm)
Length
(mm)
Weight
(g)
pHFirmness
(kg m−2)
TA
(%)
TSS
(°Brix)
Hue Chrome
I50VC040.8 d36.5 d35.2 d4.2 ab2.1 d0.35 ef4.42 d20.1 c94.1 ab
I75VC045.4 bc39.3 cd45.2 cd4.2 bc2.5 b0.40 de3.50 f25.8 a64.2 cd
I100VC055.7 a47.4 b70.3 b4.1 cd2.1 d0.33 f2.80 g26.2 a70.8 bc
I50VC1041.5 cd36.6 d35.5 d4.3 a2.0 d0.50 c6.05 b20.0 c93.6 ab
I75VC1046.9 b39.9 cd50.4 c4.1 bc2.0 d0.50 c5.20 c23.4 ab45.0 d
I100VC1056.9 a46.5 b84.2 a4.1 cd2.2 cd0.42 d4.10 e21.6 bc87.3 abc
I50VC2041.4 cd41.4 c34.4 d4.1 cd2.0 d0.70 a7.08 a25.3 a67.9 c
I75VC2047.7 b47.7 b51.5 c4.1 de3.0 a0.60 b6.88 a24.3 ab96.0 a
I100VC2055.5 a55.5 a79.8 ab4.0 e2.3 c0.5 c4.63 d23.5 ab71.5 bc
Irrigation*****************
VCNS**NS**********NS
Irrigation × VCNSNSNSNS**********
Note: Irrigation level, I100: 100% ET; I75: 75% ET; I50: 50% ET; vermicompost doses, VC0: no vermicompost; VC10: 10% VC; VC20: %20 VC, TA: titratable Acidity, TSS: total soluble solid, a–g different letters within the same column show significant differences at p < 0.05 significance level. *, ** Significant at the 0.01 and 0.05 probability levels, respectively. NS, Non-significant.
Table 7. Water consumption, yield and water use efficiency under the different irrigation levels and vermicompost doses.
TreatmentsET (L)Total Yield (g L−1)Marketable Yield (g L−1)Total WUE (g L−1)Marketable WUE (g L−1)
I50VC021.2 h233.7 h165.3 h11.0 h7.8 h
I75VC028.9 e368.3 g322.3 f12.8 g11.2 f
I100VC035.5 b492.2 e492.2 d13.9 e13.9 d
I50VC1027.6 f362.0 g276.8 g13.1 fg10.0 g
I75VC1038.5 c522.8 d470.5 e13.6 ef12.2 e
I100VC1047.8 a908.3 b908.3 b19.0 c19.0 b
I50VC2025.7 g399.5 f326.9 f15.6 d12.7 e
I75VC2035.6 b700.0 c646.2 c19.7 b18.2 c
I100VC2043.3 b947.9 a947.9 a21.9 a21.9 a
Irrigation**********
VC**********
Irrigation × VC**********
Note: Irrigation level, I100: 100% ET; I75: 75% ET; I50: 50% ET; vermicompost doses, VC0: no vermicompost; VC10: 10% VC; V20: %20 VC, a–h different letters within the same column show significant differences at p < 0.05 significance level. ** Significant at the 0.05 probability levels.
Disclaimer/Publisher’s Note: The statements, opinions and data contained in all publications are solely those of the individual author(s) and contributor(s) and not of MDPI and/or the editor(s). MDPI and/or the editor(s) disclaim responsibility for any injury to people or property resulting from any ideas, methods, instructions or products referred to in the content.

