Article

Trends of Major Ions in a Carpathian River in Poland: The Influence of Flow and Damming

by
Ewa Szarek-Gwiazda
Institute of Nature Conservation, Polish Academy of Sciences, Adama Mickiewicza 33, 31-120 Krakow, Poland
Water 2024, 16(8), 1096; https://doi.org/10.3390/w16081096
Submission received: 14 March 2024 / Revised: 8 April 2024 / Accepted: 9 April 2024 / Published: 11 April 2024

Abstract

:
Flow influences major ion concentrations in river water, therefore, it seems that it can differentiate ion concentrations in mountain rivers in different hydrological years. This study aimed to determine the impact of flow on the major ion concentrations in the Carpathian Raba River above and below the Dobczyce Reservoir (southern Poland) in hydrologically dry (HD), average (HA), and wet (HW) years (period April–October) in the period 2010–2017. In the river above the reservoir, the flow negatively affected the concentrations of most major ions under all hydrological conditions, which resulted in their significant differences between (1) the studied hydrological years (except for SO42−)–higher in the HD years than in the HA or HW years–and (2) seasons–higher Mg2+, Na+, K+, Cl, and SO42− concentrations (mainly point sources of pollution) were identified in summer or autumn than in spring in the HD and HA years. The dam reservoir strongly modified the ion concentrations in the downstream river. It significantly decreased all major ion concentrations only in the HD years, when they were high in the upstream river, and Ca2+, Mg2+, or HCO3 concentrations in all the studied hydrological years. There, the ion concentrations were not related to the flow that resulted in their insignificant differences between the studied hydrological years (with the exception of HCO3, Ca2+, and Cl) and different seasonal changes to those in the river above the dam. The obtained results allow for predicting conditions favouring an increase in the salinity of mountain river waters; therefore, they are important for appropriate management and water use opportunities.

1. Introduction

Flow has been recognised as a crucial factor influencing the water chemistry of running waters. It has a strong impact on many physico-chemical parameters, such as water temperature, nutrient concentrations [1,2,3], conductivity, and major ion concentrations [1,4,5,6,7]. Too high concentrations of a single major ion and groups of ions may adversely affect aquatic biocenosis [8,9]. Salinity, referring to the total concentration of dissolved inorganic ions (mostly Na+, K+, Ca2+, Mg2+, HCO3, CO32−, Cl, and SO42− [10]) in water, has been recognised as one of the most important parameters determining biodiversity in aquatic ecosystems, including phyto- and zooplankton, benthic macroinvertebrates, and fish [11,12,13,14,15,16]. It affects various levels of ecosystem organisation [14]. Moreover, an increase in salinity may result in the mass development of species new to the habitat, which may endanger local biocenosis [8,17]. Therefore, the ability to predict changes in the major ion concentrations under different hydrological conditions is important for the appropriate management of running waters, water use opportunities, and ecosystem services.
Mountain rivers in southern Poland are characterised by large fluctuations in flows [18,19]. Additionally, the frequency of heavy rainfall and floods has increased in recent years, and, according to simulations, their further increase is expected in the future [20]. At the same time, rainfall is often irregular or non-existent, which results in prolonged periods of drought [21]. Low flow favours the concentration of major ions in the water. Therefore, it seems that the flow prevailing in a given year should shape ion concentrations in a mountain river, which should be expressed in their differences between hydrologically dry, average, and wet years. This topic refers to the global problem of the salinity of streams and rivers due to climate change [14,22], and in mountain rivers, it is poorly understood.
Dam reservoirs located on mountain rivers can modify the major ion concentrations in the river water; however, the influence is ambiguous, as in the river below the dam, they were lower or higher or similar to those in the river above the dam [23,24,25,26,27]. This phenomenon results from many factors, such as the reservoir’s morphometry, function, age, and stratification; the mixing of river waters with reservoir waters; the inflow of smaller tributaries with different chemical compositions; physical, chemical, and biological processes taking place in the reservoir; the level of water release from the reservoir; and the water residence time in the reservoir [7,24,26,28]. Since these last three factors are strongly related to climatic and hydrological conditions, it seems that the flow prevailing in a given year may also shape the different impacts of the reservoir on the major ion concentrations in the downstream river. This topic is poorly understood.
The sources of major ions in running waters are mainly geochemical background or human activity in the catchment area [6,29,30,31,32,33]. In the latter case, the major ion concentrations are usually higher in river waters flowing through urban and agricultural areas than through forest and meadow areas [31,32,34]. River waters flowing through urban areas are usually characterised by higher concentrations of Na+, K+, Cl, and SO42−, while those flowing through agricultural areas are characterised by higher concentrations of Ca2+, Mg2+, HCO3, and, often, K+ and SO42− [29,34].
This study aimed to determine the impact of the flow and the dam reservoir on the major ion concentrations (Na+, K+, Ca2+, Mg2+, HCO3, Cl, SO42−) in the water of a mountain river in southern Poland in various hydrological years (dry—HD; average—HA; wet—HW). The following hypotheses were stated:
Hypothesis 1: 
The flow prevailing in a given year determines the differences in the major ion concentrations between HD, HA, and HW years.
Hypothesis 2: 
Changes in flow may cause seasonal changes in major ion concentrations in the mountain river.
Hypothesis 3: 
A deep mountain dam reservoir affects the major ion concentrations in the river downstream differently in different hydrological years.

2. Materials and Methods

2.1. Study Area

This study was carried out on the Raba River, with a length of 137.4 km, which rises in the Carpathian belt of the Gorce Mountains (730 m a.s.l.) and flows into the Vistula River (180 m a.s.l.) in southern Poland. The mountainous part of the Raba River basin, built mostly of Tertiary shale–sandstone rocks of Magura Unit, containing medium or small quantities of calcium, and, in a small area, shale–sandstone rocks of sub-Magura beds, slightly richer in basic components. The sub-mountainous part of the basin is formed mainly of the shale–sandstone rocks of Istebna and Godula beds. The mountainous part of the basin is dominated by loam soil with a lower or medium content of skeleton grain, while in the direct basin of the Dobczyce Reservoir, it is dominated by fine sandy soils from flysch rock [35].
At the end of the 20th century, the Raba River was polluted mainly with municipal sewage from three small towns (less than 18,000 inhabitants), sewage from villages, and runoff from agriculture and other diffuse sources of pollution. Over the last 30 years, there has been improvement in catchment management, as well as the modernisation of and introduction of new technologies at sewage treatment plants [21]. The river is characterised by a large amplitude of runoff [19].
The Dobczyce Reservoir (49°52′ N, 20°02′ E, alt. 269.9 m asl) was built on a 60 km section of the river in 1986 as a drinking water reservoir for the Krakow agglomeration [36]. It is 10 km in length and has a mean depth of 11 m (max. 30 m), an area of ~985 ha, and a capacity of 99.2 × 10⁶ m3. It is a meso-eutrophic reservoir of the submontane type [37]. The average water exchange is 3.6 times a year [36]. Water in its lower, deeper part is stratified in summer, while it mixes in spring and autumn. Water outflows from the reservoir through the power plant complex, as well as the upper or bottom outlets of the dam. During low flows, dam bottom outlets are used. The catchment area of the river above the reservoir (784 km2) is presently 50% forested, while agricultural land covers 43% [21].

2.2. Methods

The data of mean daily flow of the Raba River, both upstream (Stróża village, 78.07 km of river course) and downstream (the dam cross-section, 59.70 km) of the Dobczyce Reservoir, were obtained from the Regional Water Management Board in Krakow, Poland. Based on the daily flow, it was calculated that the mean annual flow of the Raba River for the period 1994–2017 was 11.0 m3 s−1, and without taking into account 2010, which was hydrologically extremely wet, it was 10.4 m3 s−1. The years with a mean annual flow (1) lower than the multiannual mean flow were considered to be hydrologically dry, (2) those close to the multiannual mean flow were hydrologically average, and (3) those higher than the multiannual mean flow were hydrologically wet [38]. For the statistical analysis (including flow and major ions) for the period 2010–2017, two HD (2012, 2015) and HA years (2013, 2016) and three HW years (2010, 2014, 2017) were distinguished (Table 1). In the HD years, no high flows (>100 m3 s−1, [36]) were recorded, while in the HA years, they occurred (101–140 m3 s−1) in June 2013 and October 2016. In the HW years, high flows occurred in September 2017, and high flows and flooding (>300 m3 s−1, [18]) occurred in May–July and September 2010 and May 2014. The year 2011 was not included in the study because the mean annual flow (7.7 ± 13.6 m3 s−1) and for the period April–October (9.7 ± 11.5 m3 s−1) did not allow it to be clearly classified as a HD or HA year. The flow occurring in the river on the sampling day was used for statistical analyses. A detailed description of the method for determining HD, HA, and HW years was given by [38].
Data of the major ions Cl, SO42−, HCO3, Ca2+, Mg2+, Na+, and K+ concentrations in the water of the Raba River belong to the Institute of Nature Conservation, the Polish Academy of Sciences, the Karol Starmach Department of Freshwater Biology, in Krakow. The samples of surface water were collected near the river shore from two sites: (1) one located above the reservoir, near the inlet, and (2) another below the reservoir, near the outlet, once a month from April to October in 2010 and 2012–2017 (Figure 1). Each year, 7 water samples were taken from each site (in total 98 water samples). They were collected into 500 mL polyethylene bottles and stored at low temperature (5 °C). Before the analysis, the water samples were filtered through pore-sized syringe filters (Ministart RC 25; Sartorius Stedim Biotech GmbH, Göttingen, Germany). Concentrations of anions and cations were analysed via ion chromatography (DIONEX ICS 1000 and IC DX 320; Dionex Corporation, Sunnyvale, CA, USA). Before the measurements, the ion chromatographs were calibrated using Thermo Scientific Dionex Ion Standards. The correctness of the determinations of cations and anions was checked on the basis of water ion balance calculations.

2.3. Statistics

The flow and major ion concentrations on the day of sample collection were used for statistical analysis. As the sample series for the studied hydrological years and seasons were small and some ion concentrations did not show a normal distribution, nonparametric tests were used. The differences in the major ion concentrations in the river water between different hydrological years (HD, HA, HW) (Hypothesis 1) were calculated using the Mann–Whitney test. This test was also used to check the differences in ion concentrations between seasons (spring—April, May; summer—June, July, August; autumn—September, October) in the HD, HA, and HW years (Hypothesis 2). The differences in the ion concentrations between sites 1 and 2 (Hypothesis 3) were calculated using the Wilcoxon test. The Mann–Whitney test was used to compare differences between two independent groups, while Wilcoxon test was used to compare paired data. To determine the relationship between flow and the major ion concentrations, principal component analysis (PCA) was used. Only those chemical variables with values >0.7 were taken into consideration. The Spearman correlation coefficients were calculated to determine the relationship between the studied parameters in the river water. STATISTICA version 10 was used for the statistical analyses (StatSoft 2014).

3. Results

3.1. The River above the Reservoir

The flow on the sampling days was significantly higher in the HW years than in the HD years (Table 2, Figure 2). It showed significant seasonal changes in the HA years and was higher in spring than in summer (Table 3, Figure 3). Moreover, it showed high variability in spring in the HD and HA years, as well as in spring and summer in the HW years (Figure 3).
The major ion concentrations varied in a wide range (in mg dm−3; Cl 5.4–29.2, SO42− 15.0–34.0, HCO3 92.0–241.8, Ca2+ 31.4–72.5, Mg2+ 4.9–11.0, Na+ 4.9–27.6, K+ 1.8–4.5) in the river water above the dam (Figure 2). The maximum and highest median ion concentrations were found in the HD years, when the flow was low. The flow prevailing in a given year determines the significant differences in the major ion concentrations (with the exception of SO42−) between the HD, HA, and HW years (Hypothesis 1). The concentrations of HCO3, Ca2+, and K+ in the water were significantly higher in the HD years compared to the HA and HW years, while Cl, Na+, and Mg2+ concentrations were higher in the HD years than the HW years (Table 2).
Most ion concentrations in the Raba River water showed seasonal changes, increasing from spring, when the flow was higher, to autumn, when the flow was lower, in the HD and HA years (Table 3, Figure 3) (Hypothesis 2). The increase in median from spring to autumn was highest for Na+ and Cl concentrations (3.3 and 2.6 times, respectively) in the HD years, while it was usually small for HCO3, Ca2+, and Mg2+ concentrations (usually ~1.2 times) in all hydrological years (Figure 3). The differences in the major ion concentrations (with the exception of HCO3 and Ca2+) between some seasons in the HD and HA (with the exception of SO42−) years, as well as in the K+ concentration between spring and autumn in the HW years, were statistically significant (Table 3).

3.2. The River below the Reservoir

In the HD and HA years, no high flows were observed in the river below the reservoir, while in the HW years, they occurred in May–September 2010, May 2014, and September 2017, and flooding occurred in May 2010 and 2014. The flow did not show any significant differences between the studied hydrological years (Table 2) but showed them between some seasons in the HD and HA years (Table 3).
The major ion concentrations in the river water below the dam were found in the following ranges: (in mg dm−3) Cl 5.3–19.0, SO42− 14.7–42.7, HCO3 114.8–230.4, Ca2+ 32.9–73.5, Mg2+ 5.0–11.9, Na+ 5.2–13.8, and K+ 2.2–3.5 (Figure 2). The median ion concentration was usually the highest in the HD years, as in the upstream river (Figure 2). The concentrations of Cl, HCO3, and Ca2+ were significantly higher in the HD years than the HA or HW years, while concentrations of SO42−, Mg2+, Na+, and K+ were similar in the studied hydrological years (insignificant differences) (Table 2).
Seasonal changes in the concentrations of major ions in the river water differed from those in the river upstream of the dam. Concentrations of Cl, SO42−, and Na+ in the HA years and SO42− and Mg2+ in the HW years were higher in spring than in summer and autumn, showing the opposite pattern to that in the river above the reservoir (Table 3, Figure 3).

3.3. Differences between Major Ion Concentrations above and below the Reservoir

Taking all the data into account, the dam reservoir significantly reduced the major ions concentrations (except for Cl) in the downstream river (Table 4). It was found in 75–80% of cases for SO42−, HCO3, Mg2+, and Ca2+ and 58–68% of cases for Cl, Na+, and K+, and it was the highest (Cl, Na+ up to 2.7 times; SO42− up to 2 times; HCO3, Ca2+, Mg2+, and K+ up to 1.4 times) in late summer and autumn in the HD years. The opposite pattern, i.e., an increase in the ion concentrations in the river below the dam or similar ion concentrations at both sites was found in 20–42% of cases. Such a phenomenon usually occurred at higher flow in spring (April or May) in the HD years, as well as in spring (May) and other months in the HA and HW years (e.g., September 2010, 2017, August 2014, 2017). A detailed analysis showed a significant decrease in the concentrations of all ions in the HD years, Ca2+ and Mg2+ in the HA years, and Ca2+, Mg2+, and HCO3 in the HW years (Table 4) (Hypothesis 3).
Additionally, in the HD and HA years, decreases in maximum ion (9.8–50.0%), median (6.7–32.3%), and CV (16.6–63%) concentrations and an increase in minimum ion concentrations (7.9–49.0%) (with some exceptions for SO42− and HCO3) in the river from the upstream to the downstream of the dam was found (Table 5). The greatest decreases in the maximum concentrations were shown for Cl (~40%) and Na+ (50%) in the HD years. As a result, in the river below the dam, the concentration ranges of certain ions considerably decreased in the HD (Cl, 3.2 times; other ions, 2–2.5 times) and HA (Ca2+, K+, Mg2+, and Na+, 2–2.5 times) years. In the HW years, the trend of changes in the maximum and minimum concentrations and CVs from the upstream to the downstream of the dam was different for various ions, and only the median decreased (6.4–19.1%) for most ions (with the exception of Cl) (Hypothesis 3).
The results of the principal component analysis (PCA) are presented in Table 6. For the river above and below the dam, only Factor 1 was significant, and it accounted for ~72% and 37% of the total variance, respectively. In the river above the dam, Factor 1 indicates a strong positive association with the flow and a negative one with all the studied ions. In the river below the dam, Factor 1 indicates strong negative associations with HCO3, Ca2+, and Mg2+ (Table 5). The relationships between the studied parameters in the hydrological years (the Spearman correlation coefficients) are given in Table 7. In the river above the dam, ion concentrations were negatively correlated with flow in all hydrological years (with the exception of Ca2+ in the HA and HW years and K+ in the HW years). Moreover, most ions showed mutual positive correlations: Mg2+–Na+–K+–ClSO42− in the HD and HA years (with the exception of K+ in the HA years) and HCO3Ca2+–Mg2+ in all hydrological years (Table 7). In the river below the dam, only Cl, Na+, and K+ concentrations show correlations with flow in some hydrological years (Table 7). Mutual correlations between ions were fewer or weaker, although they still occurred for HCO3–Ca2+–Mg2+, as well as Na+–Cl, in all hydrological years.

4. Discussion

4.1. The Raba River above the Reservoir

The concentrations of major ions in the Raba River are typical for the Carpathian rivers in Poland [33,39,40]. The obtained result demonstrated that flow was a crucial factor determining changes in major ion concentrations in the mountain-located Raba River water, as in other rivers [1,4]. The higher major ion concentrations occurred in the Raba River at low flow, when the ions were concentrated, and the lower ones at higher flow, when they were diluted by spring thaw and by more frequent, prolonged rains. This was expected, as the main ion sources in the Raba River and other Carpathian rivers are mainly sewage from small towns and villages located in the catchment area, as well as groundwater inflow [24,31,33]. The obtained mutual positive correlations between Na+, K+, Cl, SO42−, and Mg2+ concentrations may also indicate the high importance of point source in the pollution of the Raba River’s waters in the HD and HA years, as rivers flowing through urban areas have usually higher concentrations of Na+, K+, Cl, and SO42− [29,34]. In the water of the Upper Raba River, considerably higher concentrations of Na+, K+, Ca2+, Mg2+, and, in particular, Cl and SO42− were found near dense built-up and urbanised areas than near permanent grassland areas [30]. The insignificant relationship between the K+ concentration and flow in the Raba River in the HW years, as also observed in other Carpathian river [33], was probably related to its flushing during rain storms from land previously fertilised with mineral fertilisers (PKN) and animal excrement [41]. Nitrogen, phosphorous, and potassium (NPK) fertilisers were used intensively on cultivated fields and grasslands in the mountainous area of the Polish Carpathians up until the 1990s, and the fertiliser application rates were at the level of several hundred kg/ha of NPK. Despite significant recession in fodder management in grasslands since the 1990s, the K+ concentrations in water runoff remain at a similar level to those in the period of intensive grassland management [31,42].
The ions HCO3, Ca2+ and Mg2+, showing mutual positive correlations in all hydrological years, in the waters of the Raba River came mainly from a geochemical background [41,43]. The ions HCO3 and Ca2+ form the bicarbonate–calcium type of Carpathian running waters [33,44]. Strong mutual positive correlations between ions and a negative correlation with flow are typical of geologically controlled ions [45], although some part of Ca2+ and Mg2+ may also have originated from agricultural areas in the Raba River catchment [38], as in other rivers [6,29].
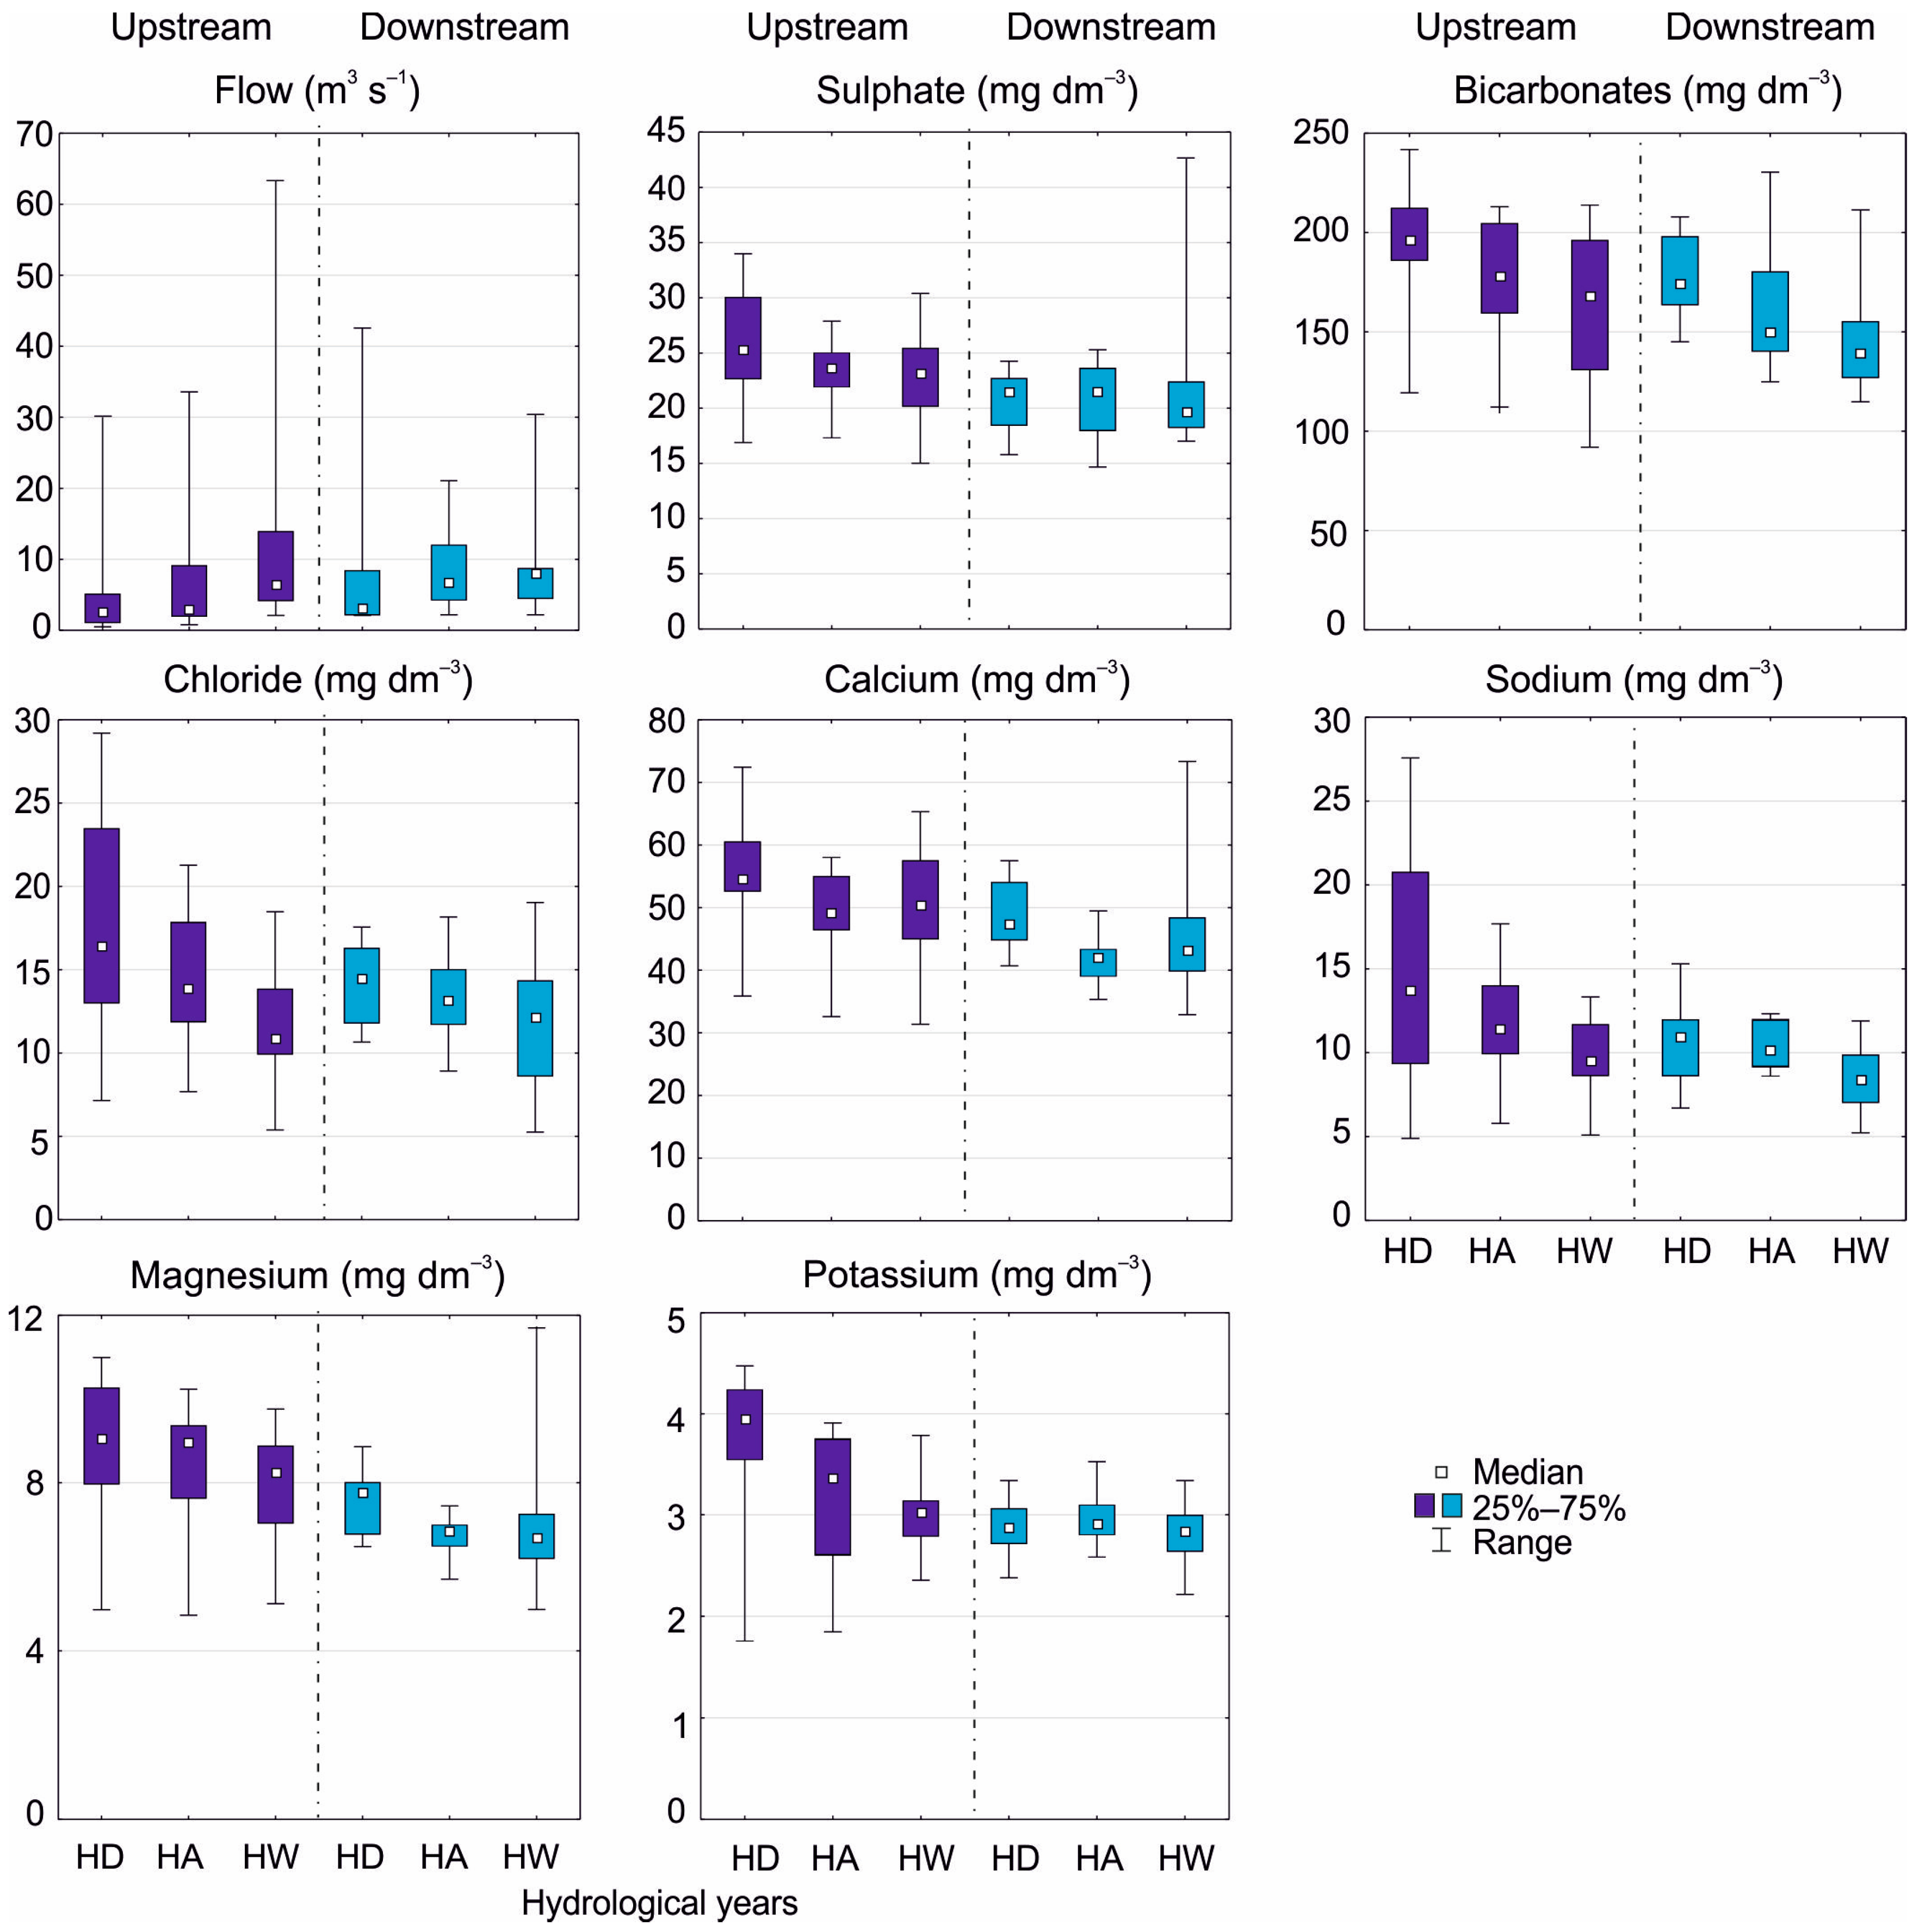
As expected, the flow prevailing in a given year determined the differences in the major ion concentrations in the Raba River water between the HD, HA, and HW years (with the exception of SO42−) (Hypothesis 1), as expressed by their highest median in the HD years with the lowest mean flow compared to the HA and HW years. The similar SO42 concentrations in water in the studied hydrological years probably resulted from the complex impact of point and diffuse pollution sources. Despite municipal sewage, other important sources of SO42− in the Raba catchment were precipitation (dry and wet) and admixtures of mineral and organic fertilisers [41,43]. Improper soil fertilisation has been identified as a significant source of SO42− in various freshwater environments, for instance, in Central Croatia [46].
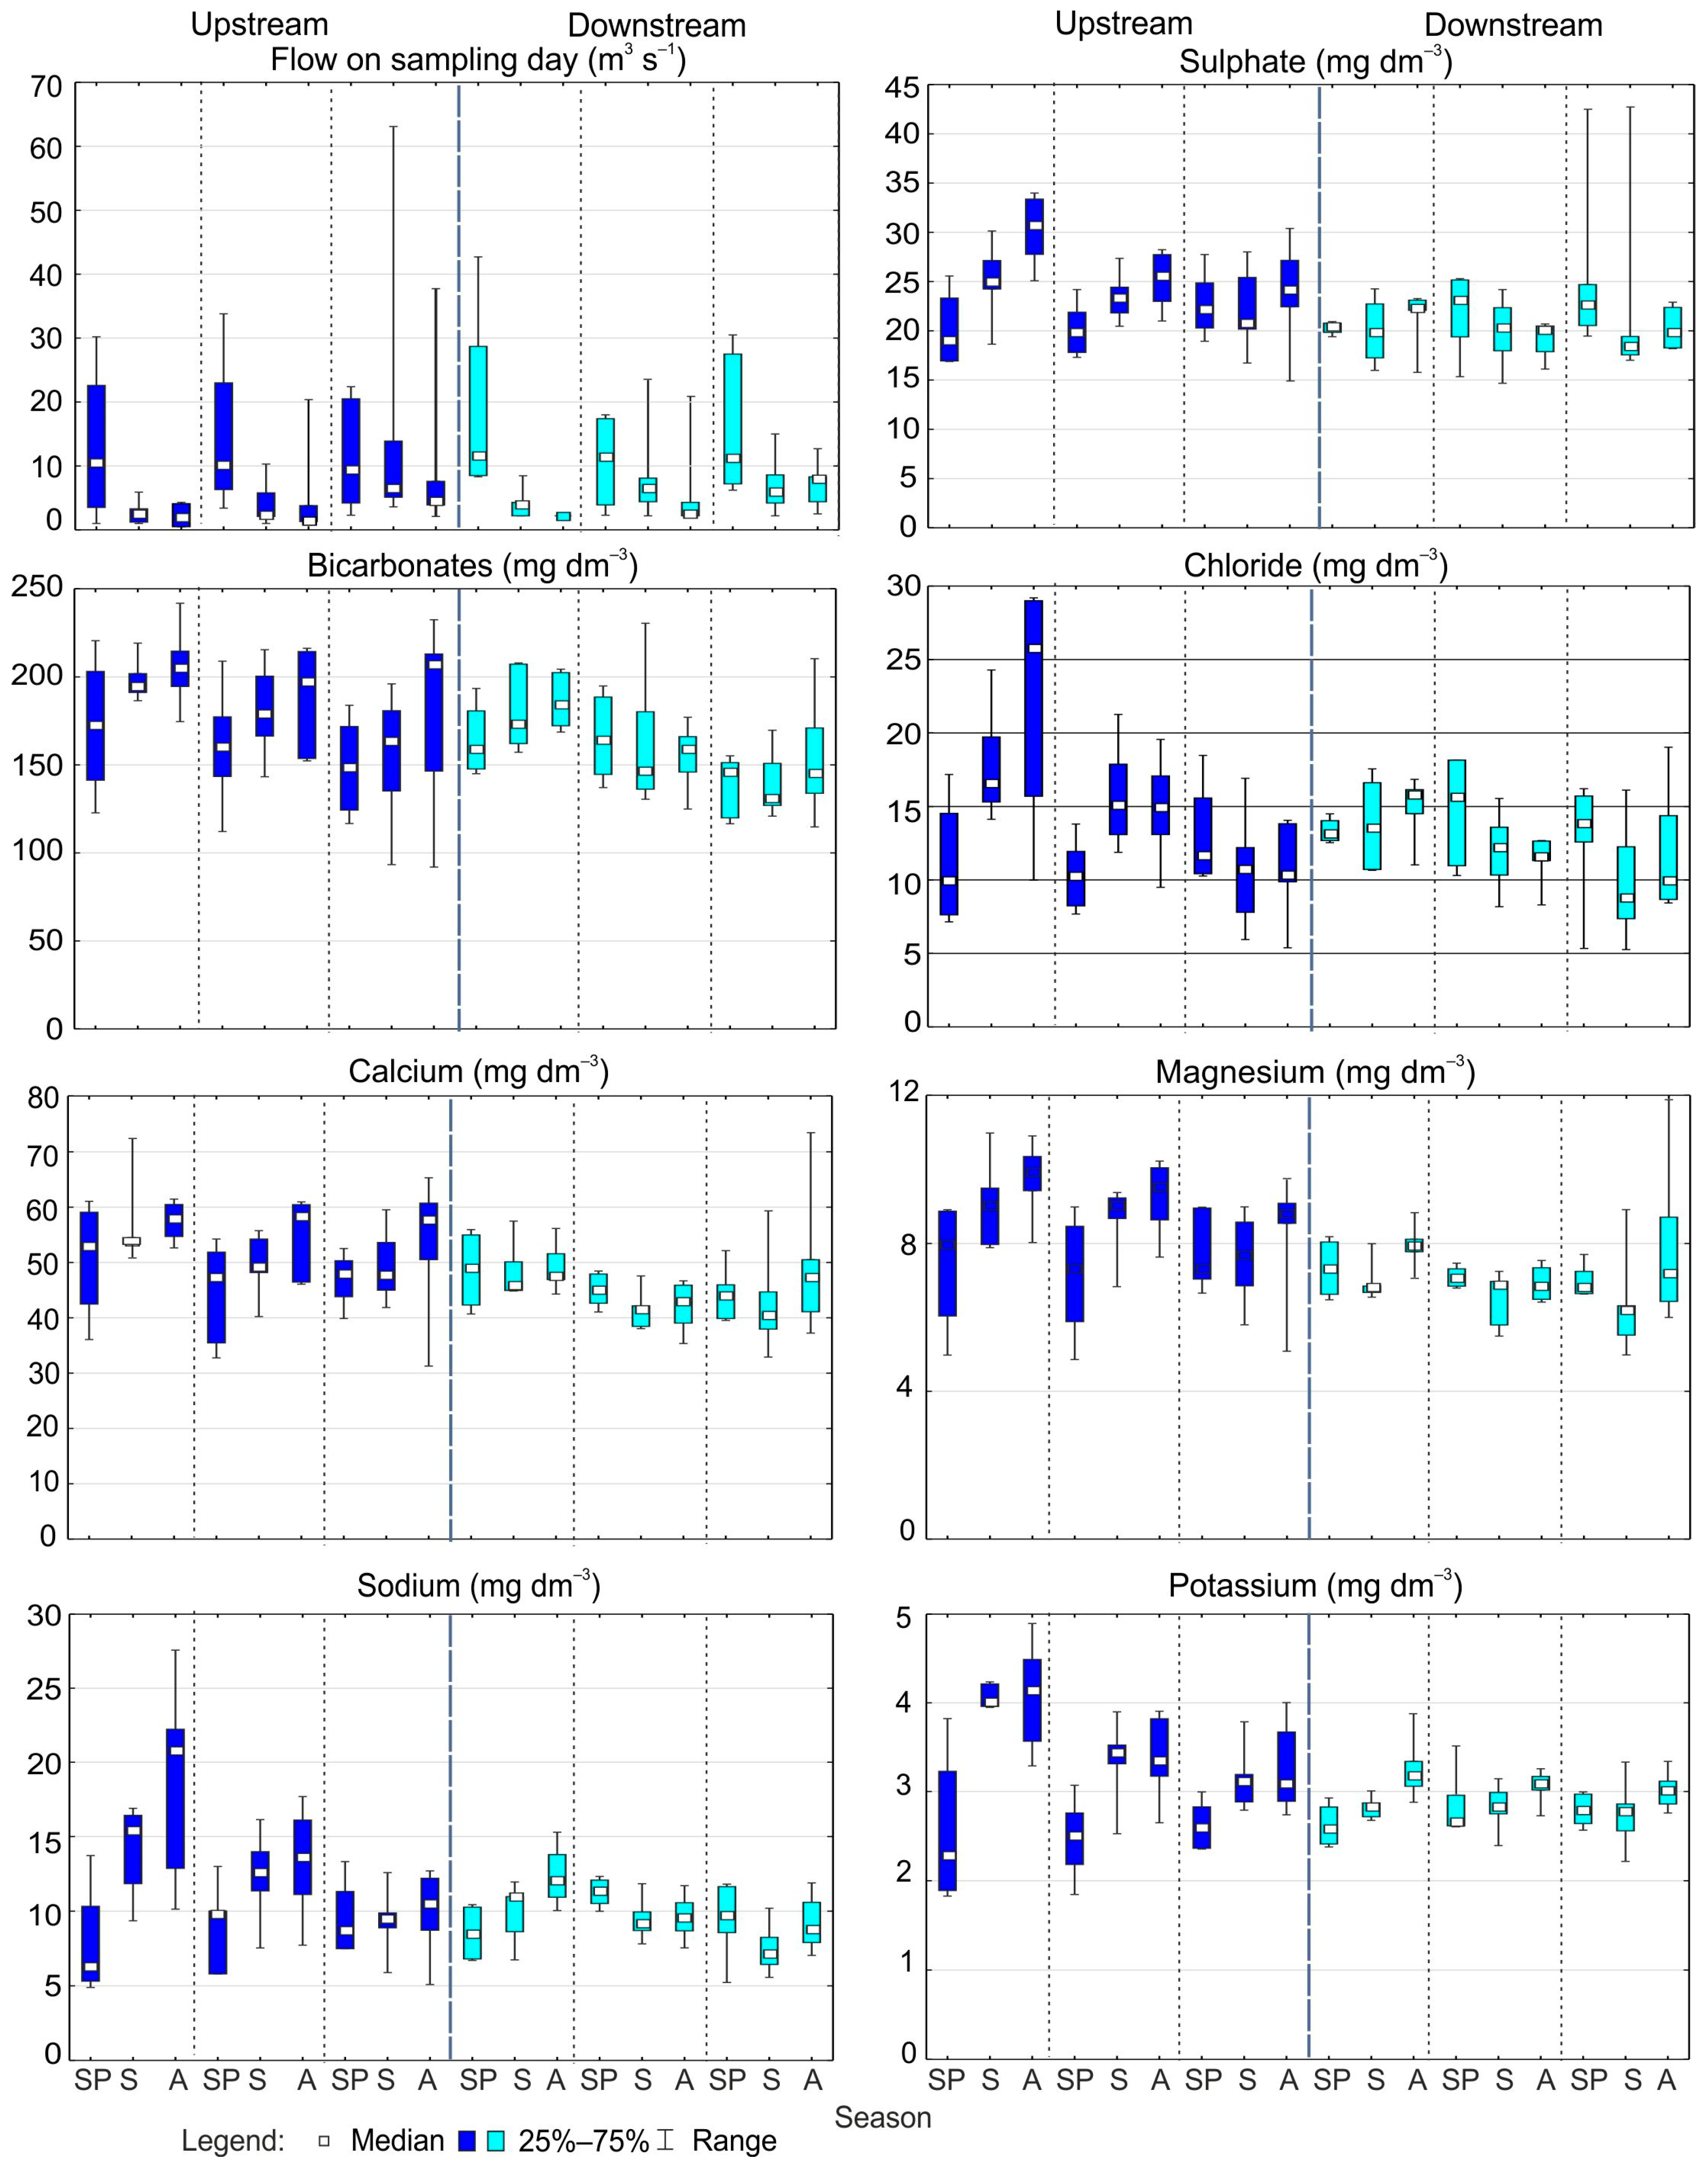
The obtained results showed an increase in median Na+, K+, Mg2+, Cl, and SO42− concentrations, originating mainly from point sources of pollution, in the Raba River water from spring to autumn in the HD (the highest) and HA years but not in the HW years characterised by higher flow fluctuation (Hypothesis 2). Concentrations of Cl and Na+ were the most sensitive to flow changes, and a prolonged period of low flows in summer and autumn enabled their greatest increase in the river water. This is important as higher concentrations of SO42− (up to 68.8 mg dm−3) and Cl (up to 18.3 mg dm−3) had a detrimental effect on the diversity of ephemeropteran communities in a medium-sized Carpathian river (Timiş River, Romania) [13]. As was mentioned above, elevated Cl and Na+ concentrations in running water were mainly associated with urbanisation [6,29,31], and the Cl concentration was up to 100 times higher in streams flowing through urban and suburban areas than through forested ones in the northeastern United States [47]. An increase in salinity can result in the massive growth of species new to the habitat, such as Prymnesium parvum Carter, the blooms of which cause fish die-off worldwide [8]. This species caused an ecological disaster, a mass die-off of fish and mussels in the Oder River in Poland in 2022, facilitated by a prolonged period of low flows and high water temperature (>24 °C), salinity (maximum 1.4 g dm−3), and ammonia concentration (>4 mg dm−3) [17]. Therefore, our findings indicating conditions favouring high concentrations of major ions in mountain rivers may also be an important indication for other rivers. Concentrations of HCO3 and Ca2+ originated mainly from geochemical sources, showing smaller fluctuations in the Raba River than the other ions.

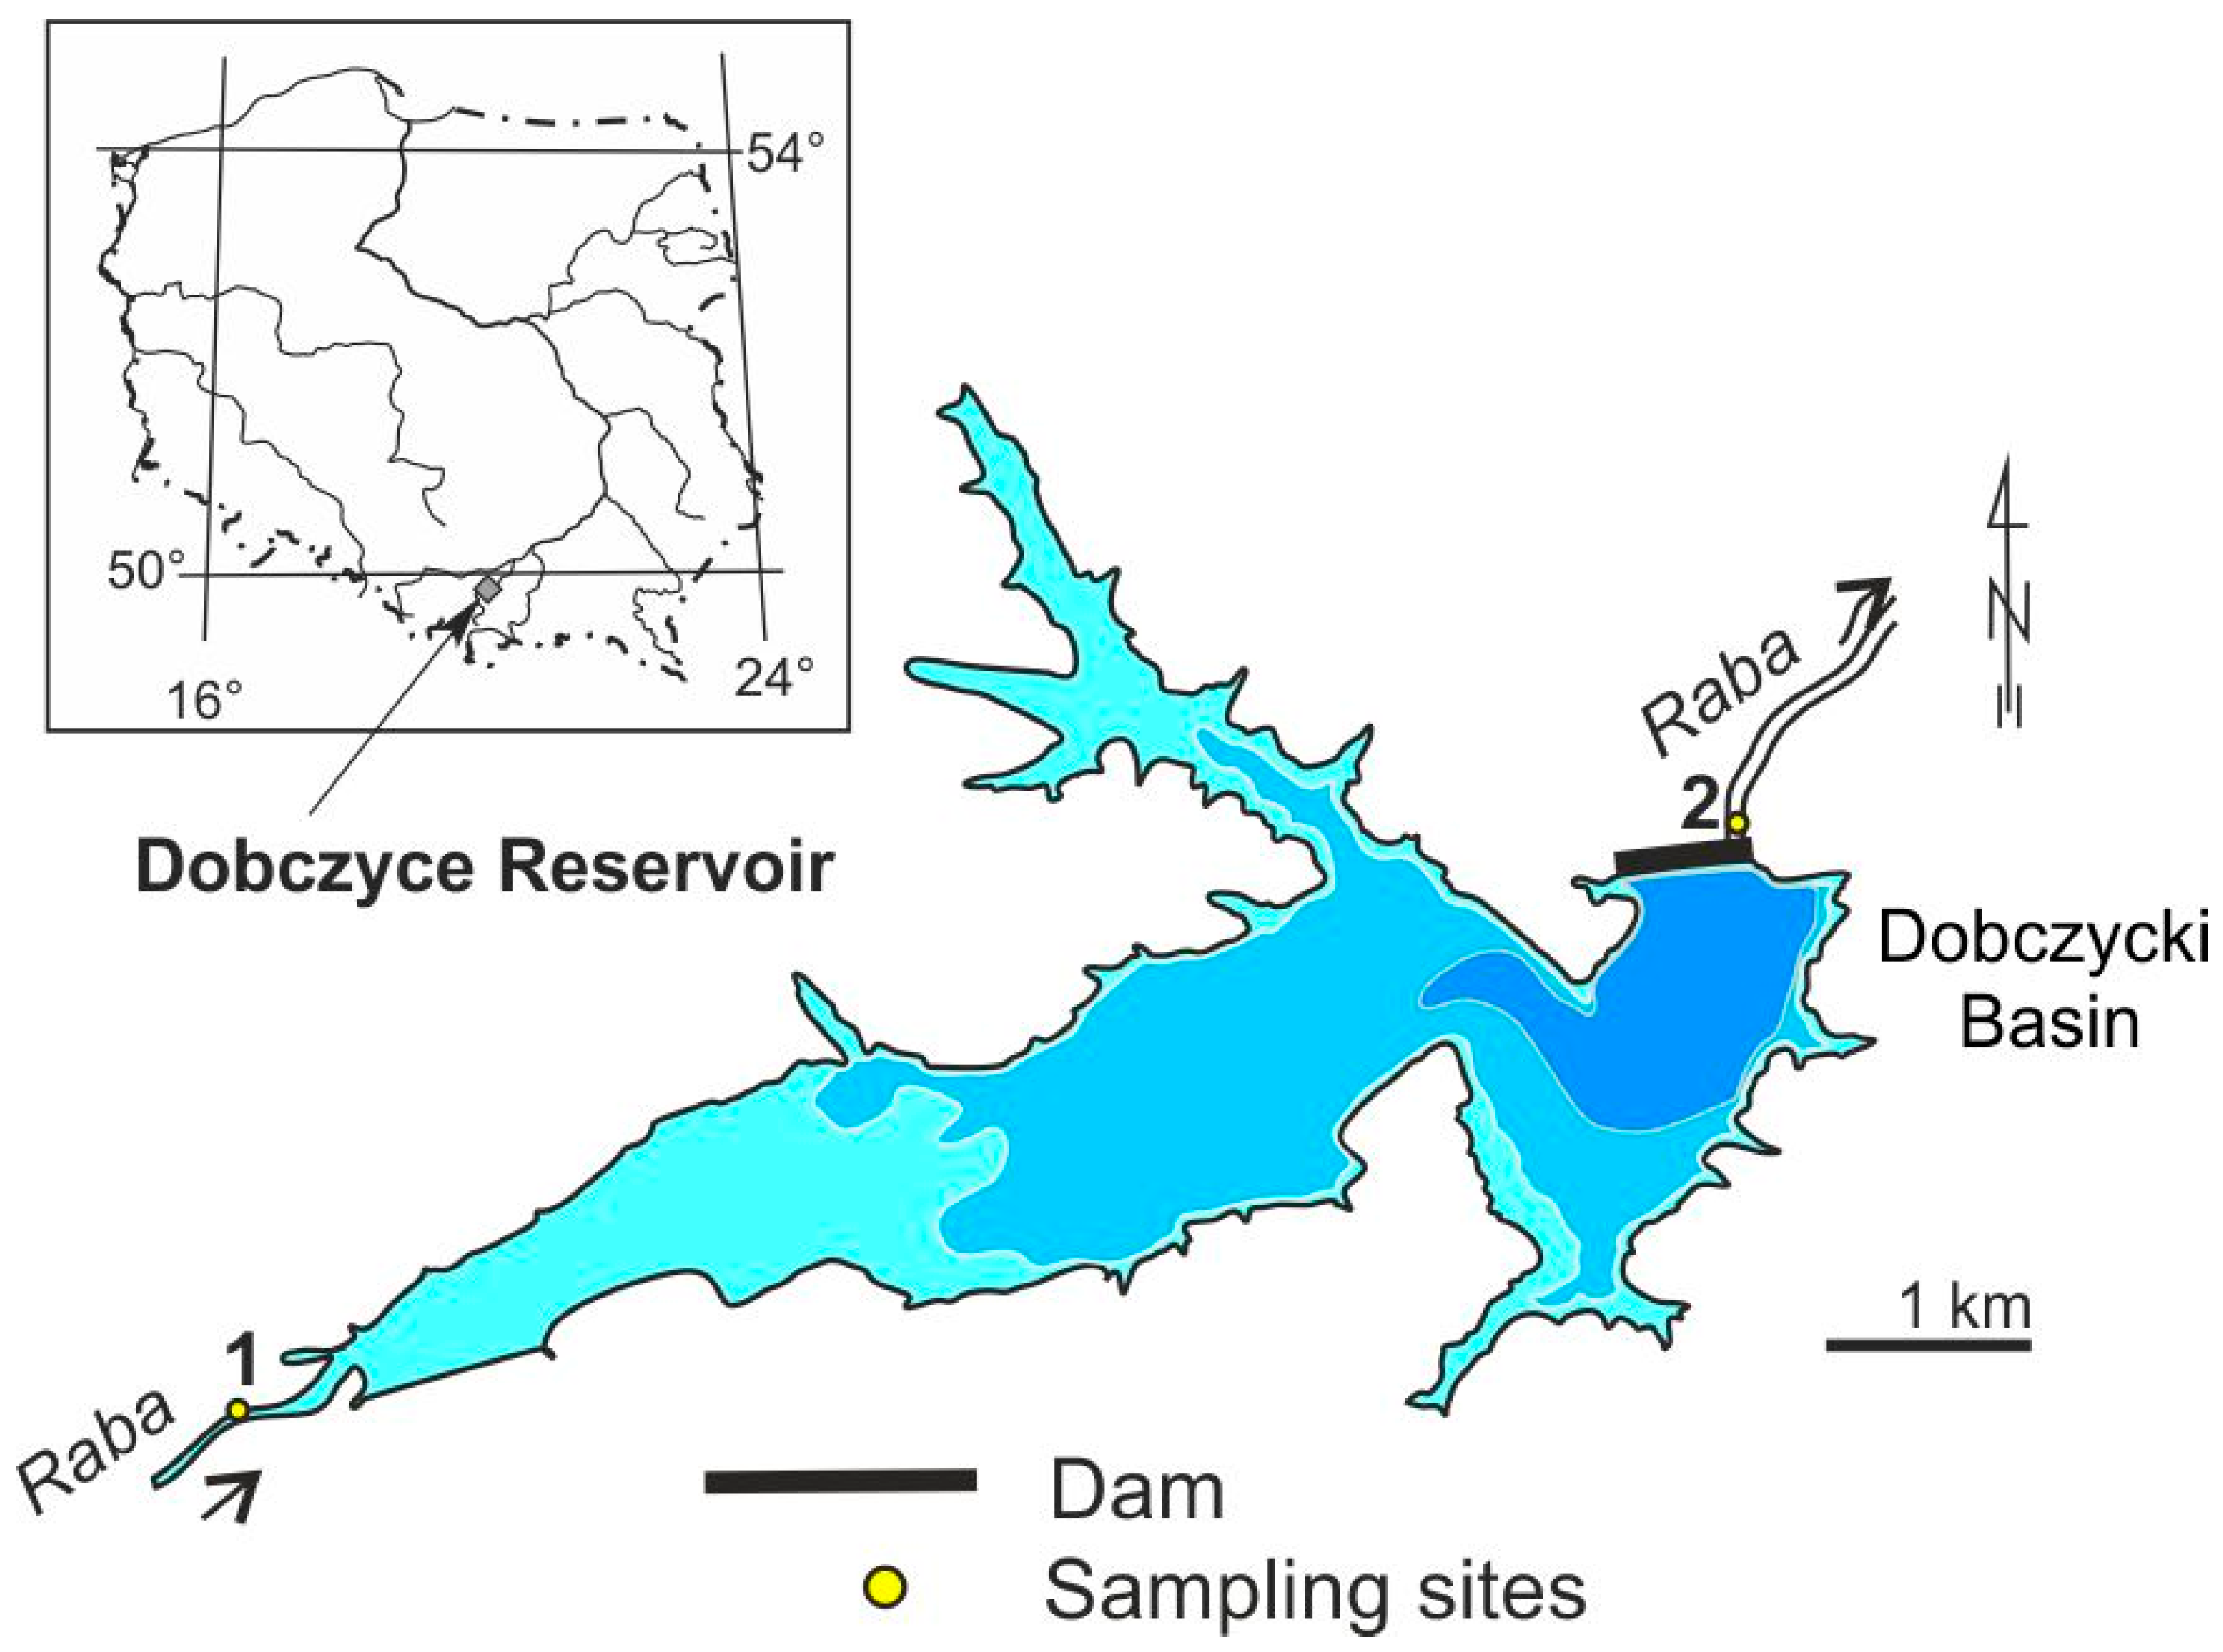
4.2. The Effect of Reservoir on Water Chemistry

The deep limnetic Dobczyce Reservoir had a strong influence on the major ion concentrations in the downstream section of the river. It significantly decreases the major ion concentrations (with the exception of Cl) in the Raba River from upstream to downstream of the dam, taking into account all the data. A similar phenomenon for some ions was also found in other rivers below the mountain and shallow lowland dam reservoirs [23,25,27]. For example, decreases in concentrations of SO42− and Cl (6.7%, 6.6%, 17.5%, respectively) were found in the Mała Panew River below the Turawa Reservoir (South Poland) [27], Cl in the Nysa Szalona River below the Słup Reservoir [23], and SO42−, Cl, Ca2+, and Mg2+ in the Vistula River below the Goczałkowice Reservoir [25]. Such decreases were mainly related to the storing of water with low conductivity originating from spring thaws and summer storm water in reservoirs and then gradually releasing the water from the reservoir during the year [48]. However, changes in ion concentrations (increase, decrease) may result from other factors, such as the water residence time, thermal stratification, phytoplankton dynamics, the inflow of other tributaries with different chemical compositions, the geochemical processes taking place in the reservoir, and the level of water outflow from the dam [7,24,26,28,49].
The deep mountain dam reservoir modified the major ion concentrations in the Raba River differently across various hydrological years (Hypothesis 3). It only caused significant reductions in all major ion concentrations in the HD years, which was facilitated by high ion concentrations at low flow in the river section above the dam. In the HA and HW years, when higher flows or floods caused greater fluctuations in Na+, K+, Mg2+, Cl, and SO42− concentrations in the water, the differences in their concentrations between the studied sites were insignificant. This phenomenon was also favoured by the short water residence time in the Dobczyce Reservoir during flood [7]. Other authors [26,49] also note the occurrence of higher or similar concentrations of some ions in other rivers from upstream to downstream of the dam. Only Ca2+, Mg2+, or HCO3 concentrations decreased (up to 1.4 times) in the Raba River from upstream to downstream of the dam in all hydrological years, which may be linked to their deposition in the reservoir bottom, as the pH (up to 9.2) and good oxygenation of epilimnion water favoured carbonate precipitation [24]. However, an increase in HCO3 concentrations in the Raba River below the dam (like between July–September 2015) may also be explained by the carbon cycle in the Dobczyce Reservoir. During summer stagnation, the highest HCO3 concentration occurs in the near-bottom water of the reservoir [7]. During low flows, the use of the bottom release of water from the dam promoted its higher concentration in the river below the dam. The relationship between the Ca2+ concentration in the river below the reservoirs with a longer residence time and the carbon cycle in the reservoir was also indicated in the upper reaches of the Wujiang River (China) [49].
Moreover, the Dobczyce Reservoir reduced the concentration ranges of all major ions in the HD (up to 3.2 times) and some ions in the HA (Ca2+, K+, Mg2+, and Na+ up to 2.5 times) and HW (HCO3, Na+ and K+ up to 1.5 times) years in the Raba River below the dam. A similar phenomenon in the case of conductivity (decrease by 200–300 μS cm−1) in the water of another Carpathian river (southern Poland) was indicated by Soja and Wiejaczka [48].
The major ion concentrations in the river section downstream of the dam were strongly influenced by the Dobczyce Reservoir, as well as the changes in the river hydrological regime below the reservoir. Pociask-Karteczka et al. [19] indicated an increase in the mean minimum and maximum monthly discharge, a decrease in mean monthly discharge, and changes in the seasonal variability in the runoff of the Raba River below the reservoir. Here, the major ion concentrations were not related to the flow that resulted in insignificant differences between the studied hydrological years (with the exception of HCO3, Ca2+, Cl) and seasonal changes different from those in the river section above the dam. Higher HCO3 and Ca2+concentrations in the HD years, compared to the HA or HW years, were probably mainly related to the above-mentioned carbon cycle in the reservoir, which, in the HD years, was undisturbed by increased flows.

5. Conclusions

The obtained results indicate that the flow prevailing in a given year strongly influenced the major ion concentrations (Na+, K+, Ca2+, Mg2+, HCO3, Cl, SO42−) in a medium-sized mountain river in southern Poland. In the river section above the dam, it caused significant differences in ion concentrations between the hydrologically dry (HD), average (HA), and wet (HW) years (except for SO42−) and between seasons in the HD and HA years (with the exception of HCO3 and Ca2+). The highest concentrations of all ions (as well as median and maximum) and their the highest seasonal changes were found in the HD years, when higher flows occurred mainly in spring, which favoured an increase in ion concentrations in water in summer and autumn. The ions K+, SO42−, and, in particular, Cl and Na+, mainly associated with point source pollution, were more sensitive to flow changes than HCO3, Ca2+, and Mg2+, mainly associated with the geochemical environment of the Raba River catchment. This was expressed in smaller changes in HCO3, Mg2+, and Ca2+ concentrations in the river water.
The Dobczyce Reservoir strongly modified major ion concentrations in the river downstream. It caused a decrease in all major ion concentrations only in the HD years, when their concentrations in the river section upstream of the reservoir were high, as well as in the concentrations of HCO3, Ca2+, and Mg2+ in all hydrological years. In the river section downstream of the reservoir, major ion concentrations were not related to flow, showed no differences between the studied hydrological years (with the exception of HCO3, Ca2+ and Cl), and showed different seasonal changes compared to those in the river section upstream of the dam. Higher HCO3 and Ca2+ concentrations in the water in the HD years than in the HA or HW years were mainly related to carbon cycling in the reservoir.
The obtained results are important for Carpathian and other running water, as they allow for predicting conditions favouring an increase in water salinity. As such, they are important for the appropriate management of mountain rivers and water use opportunities. Moreover, they expand current knowledge regarding the influence of a deep limnetic dam reservoir on the major ion concentrations in a mountain river.

Funding

This research was funding by the Institute of Nature Conservation, Polish Academy of Sciences, Krakow, Poland.

Data Availability Statement

Restrictions apply to the availability of these data. The data of mean daily flow of the Raba River upstream and downstream of the Dobczyce Reservoir were obtained from the Regional Water Management Board in Krakow, Poland. Data of major ion concentrations in the Raba River water belong to the Institute of Nature Conservation, Polish Academy of Sciences, Karol Starmach Department of Freshwater Biology in Krakow, Poland. Above data are available from the author with the permission of mentioned above Institutions.

Acknowledgments

I sincerely thank all employees of the Institute of Freshwater Biology PAS who took part in the sampling and laboratory analyses.

Conflicts of Interest

The author declare no conflict of interest.

References

  1. Nilsson, C.; Renöfält, B.M. Linking flow regime and water quality in rivers: A challenge to adaptive catchment management. Ecol. Soc. 2008, 13, 18. [Google Scholar] [CrossRef]
  2. Webb, B.W.; Hannah, D.M.; Moore, R.D.; Brown, L.E.; Nobilis, F. Recent advances in stream and river temperature research. Hydrol. Process. 2008, 22, 902–918. [Google Scholar] [CrossRef]
  3. Bowes, M.J.; Jarvie, H.P.; Halliday, S.J.; Skeffington, R.A.; Wade, A.J.; Lowenthal, M.; Gozzard, E.; Newman, J.R.; Palmer-Felgate, E.J. Characterising phosphorus and nitrate inputs to a rural river using high frequency concentration-flow relationships. Sci. Total Environ. 2015, 511, 608–620. [Google Scholar] [CrossRef] [PubMed]
  4. Chen, J.; Wang, F.; Xia, X.; Zhang, L. Major element chemistry of the Changjiang (Yangtze River). Chem. Geol. 2002, 187, 231–255. [Google Scholar] [CrossRef]
  5. Chang, H.; Carlson, T.N. Water quality during winter storm events in Spring Creek, Pennsylvania USA. Hydrobiologia 2005, 544, 321–332. [Google Scholar] [CrossRef]
  6. Boyacioglu, H. Surface water quality assessment using factor analysis. Water SA 2006, 32, 389–393. [Google Scholar] [CrossRef]
  7. Szarek-Gwiazda, E.; Mazurkiewicz-Boroń, G.; Wilk-Woźniak, E. Changes of physicochemical parameters and phytoplankton in water of a submountain dam reservoir—Effect of late summer stormflow. Arch. Environ. Prot. 2009, 35, 79–91. [Google Scholar]
  8. Svendsen, M.B.S.; Andersen, N.R.; Hansen, P.J.; Steffensen, J.F. Effects of harmful algal blooms on fish: Insights from Prymnesium parvum. Fishes 2018, 3, 11. [Google Scholar] [CrossRef]
  9. Kumar, A.; Tripathi, V.K.; Sachan, P.; Rakshit, A.; Singh, R.M.; Shukla, S.K.; Pandey, R.; Vishwakarma, A.; Panda, K.C. Sources of ions in the river ecosystem. In Ecological Significance of River Ecosystems: Challenges and Management Strategies; Elsevier: Amsterdam, The Netherlands, 2022; pp. 187–202. [Google Scholar]
  10. Williams, W.D. Salinization of rivers and streams: An important environmental hazard. Ambio 1987, 16, 181–185. [Google Scholar]
  11. Mirabdullayev, I.M.; Joldasova, I.M.; Mustafaeva, Z.A.; Kazakhbaev, S.; Lyubimova, S.A.; Tashmukhamedov, B.A. Succession of the ecosystems of the Aral Sea during its transition from oligohaline to polyhaline water body. J. Mar. Syst. 2004, 47, 101–107. [Google Scholar] [CrossRef]
  12. Zinchenko, T.D.; Golovatyuk, L.V. Salinity tolerance of macroinvertebrates in stream waters. Arid Ecosyst. 2013, 3, 113–121. [Google Scholar] [CrossRef]
  13. Curtean-Bănăduc, A.; Olosutean, H.; Bănăduc, D. Influence of environmental variables on the structure and diversity of Ephemeropteran communities: A case study of the Timiş River, Romania. Acta Zool. Bulg. 2016, 68, 215–224. [Google Scholar]
  14. Cañedo-Argüelles, M.; Kefford, B.J.; Piscart, C.; Prat, N.; Schäfer, R.B.; Schulz, C.J. Salinisation of rivers: An urgent ecological issue. Environ. Pollut. 2013, 173, 157–167. [Google Scholar] [CrossRef] [PubMed]
  15. Hart, B.T.; Bailey, P.; Edwards, R.; Hortle, K.; James, K.; McMahon, A.; Meredith, C.; Swadling, K. A review of the salt sensitivity of the Australian freshwater biota. Hydrobiologia 1991, 210, 105–144. [Google Scholar] [CrossRef]
  16. Tavares-Dias, M. Toxicity, physiological, histopathological, handling, growth and antiparasitic effects of the sodium chloride (salt) in the freshwater fish aquaculture. Aquac. Res. 2022, 53, 715–734. [Google Scholar] [CrossRef]
  17. Sługocki, Ł.; Czerniawski, R. Water quality of the Odra (Oder) River before and during the ecological disaster in 2022: A warning to water management. Sustainability 2023, 15, 8594. [Google Scholar] [CrossRef]
  18. Materek, E. Hydrology of tributaries and reservoir. In Dobczyce Reservoir Ecology–Eutrophication–Conservation; Starmach, J., Mazurkiewicz-Boroń, G., Eds.; Institute of Freshwater Biology PAS: Kraków, Poland, 2000; pp. 15–31, (In Polish with English Summary). [Google Scholar]
  19. Pociask-Karteczka, J.; Czulak, J.; Niedbała, J.; Niedbała, J. Model assessing changes of the Raba River runoff caused by the Dobczyce Reservoir (Poland). Pol. J. Environ. Stud. 2003, 12, 485–488. [Google Scholar]
  20. Osuch, M.; Lawrence, D.; Meresa, H.K.; Napiorkowski, J.J.; Romanowicz, R.J. Projected changes in flood indices in selected catchments in Poland in the 21st century. Stoch. Environ. Res. Risk Assess. 2017, 31, 2435–2457. [Google Scholar] [CrossRef]
  21. Wilk-Woźniak, E.; Krztoń, W.; Górnik, M. Synergistic impact of socio-economic and climatic changes on the ecosystem of a deep dam reservoir: Case study of the Dobczyce dam reservoir based on a 30-year monitoring study. Sci. Total Environ. 2021, 756, 144055. [Google Scholar] [CrossRef]
  22. Jeppesen, E.; Brucet, S.; Naselli-Flores, L.; Papastergiadou, E.; Stefanidis, K.; Noges, T.; Noges, P.; Attayde, J.L.; Zohary, T.; Coppens, J.; et al. Ecological impacts of global warming and water abstraction on lakes and reservoirs due to changes in water level and related changes in salinity. Hydrobiologia 2015, 750, 201–227. [Google Scholar] [CrossRef]
  23. Wiatkowski, M. Influence of Słup dam reservoir on flow and quality of water in the Nysa Szalona river. Pol. J. Environ. Stud. 2011, 20, 469–478. [Google Scholar]
  24. Szarek-Gwiazda, E. Factors influencing the concentrations of heavy metals in the Raba River and selected Carpathian dam reservoirs. Stud. Naturae 2013, 60, 1–146, (In Polish with English Summary). [Google Scholar]
  25. Bogdał, A.; Kowalik, T.; Witoszek, K. Effect of the Goczałkowice Reservoir on the changes of water quality in the Vistula River. Ecol. Eng. 2015, 45, 124–134, (In Polish with English Summary). [Google Scholar] [CrossRef] [PubMed]
  26. Wang, X.; Yang, S.; Ran, X.; Liu, X.-M.; Bataille, C.P.; Su, N. Response of the Changjiang (Yangtze River) water chemistry to the impoundment of Three Gorges Dam during 2010–2011. Chem. Geol. 2018, 487, 1–11. [Google Scholar] [CrossRef]
  27. Wiatkowski, M.; Wiatkowska, B. Changes in the flow and quality of water in the dam reservoir of the Mała Panew catchment (South Poland) characterized by multidimensional data analysis. Arch. Environ. Prot. 2019, 45, 26–41. [Google Scholar] [CrossRef]
  28. Kasza, H. (Ed.) Dam Reservoirs. Importance–Eutrophication–Protection; Wydawnictwa Akademii Techniczno-Humanistycznej: Bielsko-Biała, Poland, 2009; pp. 1–366. (In Polish) [Google Scholar]
  29. Fitzpatrick, M.L.; Long, D.T.; Pijanowski, B.C. Exploring the effects of urban and agricultural land use on surface water chemistry, across a regional watershed, using multivariate statistics. Appl. Geochem. 2007, 22, 1825–1840. [Google Scholar] [CrossRef]
  30. Cooper, S.D.; Lake, P.S.; Sabater, S.; Melack, J.M.; Sabo, J.L. The effects of land use changes on streams and rivers in Mediterranean climates. Hydrobiologia 2013, 719, 383–425. [Google Scholar] [CrossRef]
  31. Kopacz, M.; Twardy, S. An analysis of changes in the Carpathian permanent grasslands based on the upper Dunajec and Raba river basins. Water Environ. Rural Areas 2013, 13, 91–103, (In Polish with English Summary). [Google Scholar]
  32. Kaushal, S.S.; Duan, S.; Doody, T.R.; Haq, S.; Smith, R.M.; Johnson, T.A.N.; Newcomb, K.D.; Gorman, J.; Bowman, N.; Mayer, P.M.; et al. Human-accelerated weathering increases salinization, major ions, and alkalinization in fresh water across land use. Appl. Geochem. 2017, 83, 121–135. [Google Scholar] [CrossRef]
  33. Szarek-Gwiazda, E.; Mazurkiewicz-Boroń, G.; Gwiazda, R.; Urban, J. Chemical variability of water and sediment over time and along a mountain river subjected to natural and human impact. Knowl. Manag. Aquat. Ecosyst. 2018, 419, 5. [Google Scholar] [CrossRef]
  34. Wayland, K.G.; Long, D.T.; Hyndman, D.W.; Pijanowski, B.C.; Woodhams, S.M.; Haack, S.K. Identifying relationships between baseflow geochemistry and land use with synoptic sampling and R-mode factor analysis. J. Environ. Qual. 2003, 32, 180–190. [Google Scholar] [PubMed]
  35. Pasternak, K. A geological and pedological sketch of the river Raba catchment basin. Acta Hydrobiol. 1969, 11, 407–422. [Google Scholar]
  36. Mazurkiewicz-Boroń, G. Factors of eutrophication processes in sub-mountain dam reservoirs. Suppl. Acta Hydrobiol. 2002, 2, 1–68, (In Polish with English summary). [Google Scholar]
  37. Wilk-Woźniak, E. Population changes in the communities of planktonic algae and their life strategies under the conditions of artificially altered aquatic ecosystems. Stud. Nat. 2009, 55, 1–132, (In Polish with English Summary). [Google Scholar]
  38. Szarek-Gwiazda, E.; Gwiazda, R. Impact of flow and damming on water quality of the mountain Raba River (southern Poland)—Long-term studies. Arch. Environ. Prot. 2022, 48, 31–40. [Google Scholar]
  39. Kownacki, A.; Szarek-Gwiazda, E.; Ligaszewski, M.; Urban, J. Communities of freshwater macroinvertebrate and fish in mountain streams and rivers of the Upper Dunajec Catchment (Western Carpathians) including long-term human impact. In Polish River Basins and Lakes—Part II: Biological Status and Water Management; Korzeniewska, E., Hamisz, M., Eds.; Handbook of Environmental Chemistry Series; Springer: Cham, Switzerland, 2020; Volume 87, pp. 269–294. [Google Scholar]
  40. Kownacki, A.; Szarek-Gwiazda, E. The impact of pollution on diversity and density of benthic macroinvertebrates in mountain and upland rivers. Water 2022, 14, 1349. [Google Scholar] [CrossRef]
  41. Pawlik-Dobrowolski, J. Attempt of evaluate proportion of non-point pollution in the total load of chemical substances. In Raba Catchment as an Area of Water Alimentation and Pollution for the Retention Reservoir in Dobczyce; Politechnika Krakowska Monography; Cracow University of Technology: Krakow, Poland, 1993; Volume 145, pp. 241–252, (In Polish with English Summary). [Google Scholar]
  42. Jaguś, A. Qualitative changes of soil water outflows in the conditions of reduced range of fertilizers (on an example of grasslands located in the mountainous area). Monit. Sr. Przyr. 2008, 9, 63–69, (In Polish with English Summary). [Google Scholar]
  43. Pawlik-Dobrowolski, J. Evaluation of the quality of surface waters in the Raba catchment on the background of pollution sources. In Raba Catchment as an Area of Water Alimentation and Pollution for the Retention Reservoir in Dobczyce; Politechnika Krakowska Monography; Cracow University of Technology: Krakow, Poland, 1993; Volume 145, pp. 131–155, (In Polish with English Summary). [Google Scholar]
  44. Szarek-Gwiazda, E.; Mazurkiewicz-Boroń, G. A comparison between the water quality of the main tributaries to three submontane dam reservoirs and the sediment quality in those reservoirs. Oceanol. Hydrobiol. Stud. 2010, 39, 55–63. [Google Scholar] [CrossRef]
  45. Caissie, D.; Pollock, T.L.; Cunjak, R.A. Variation in stream water chemistry and hydrograph separation in a small drainage basin. J. Hydrol. 1996, 178, 137–157. [Google Scholar] [CrossRef]
  46. Mesić, M.; Kisić, I.; Bašić, F.; Butorac, A.; Zgorelec, Ž.; Gašpar, I. Losses of Ca, Mg and SO42−-S with drainage water at fertilisation with different nitrogen rates. Agric. Conspec. Sci. 2007, 72, 53–58. [Google Scholar]
  47. Kaushal, S.S.; Groffman, P.M.; Likens, G.E.; Belt, K.T.; Stack, W.P.; Kelly, V.R.; Band, L.E.; Fisher, G.T. Increased salinization of fresh water in the northeastern United States. Proc. Natl. Acad. Sci. USA 2005, 102, 13517–13520. [Google Scholar] [CrossRef] [PubMed]
  48. Soja, R.; Wiejaczka, Ł. The impact of a reservoir on the physicochemical properties of water in a mountain river. Water Environ. J. 2014, 28, 473–482. [Google Scholar] [CrossRef]
  49. Gao, Y.; Wang, B.; Liu, X.; Wang, Y.; Zhang, J.; Jiang, Y.; Wang, F. Impacts of river impoundment on the riverine water chemistry composition and their response to chemical weathering rate. Front. Earth Sci. 2013, 7, 351–360. [Google Scholar] [CrossRef]
Figure 1. Location of the study sites on the Raba River.
Water 16 01096 g001
Figure 2. Flow and major ion concentrations in the Raba River upstream and downstream of the Dobczyce Reservoir in hydrologically dry (HD), average (HA), and wet (HW) years.
Water 16 01096 g002
Figure 3. Flow and major ion concentrations in the Raba River upstream and downstream of the Dobczyce Reservoir in spring (SP), summer (S), and autumn (A) in hydrologically dry (HD), average (HA), and wet (HW) years.
Water 16 01096 g003
Table 1. Flow (average annual, N = 12; for the period April–October, N = 7; standard deviation) of the Raba River upstream and downstream of the dam in hydrologically dry (HD), average (HA), and wet (HW) years.
Hydrological YearsYearsMean Flow (m3 s−1)
Upstream Downstream
AnnualApril–OctoberAnnualApril–October
HD20126.0 ± 8.64.6 ± 4.54.4 ± 4.75.0 ± 4.1
20157.4 ± 10.35.4 ± 5.46.0 ± 5.85.8 ± 4.6
HA20139.0 ± 12.99.4 ± 8.36.8 ± 7.59.0 ± 6.0
201610.0 ± 13.09.3 ± 6.47.7 ± 5.97.6 ± 3.7
HW201023.6 ± 69.734.4 ± 29.421.3 ± 50.932.4 ± 25.3
201411.7 ± 38.116.6 ± 16.910.5 ± 29.315.3 ± 16.2
201711.6 ± 18.213.0 ± 10.110.3 ± 12.211.0 ± 7.5
Table 2. Significance differences in the flow (on the sampling day) and major ion concentrations in the Raba River water upstream (site 1) and downstream (site 2) of the dam between the hydrologically dry (HD), average (HA), and wet (HW) years (Mann–Whitney test; N—number of samples; p—significance level; Z—statistic value, ns—not significant).
Hydrological Years
ParameterSiteNHD-HAHD-HWHA-HW
HD, HA, HWZpZpZp
Flow 114, 14, 21 ns−2.950.003 ns
214, 14, 21 ns ns ns
Cl114, 14, 21 ns2.980.003 ns
214, 14, 21 ns1.970.049 ns
HCO3114, 14, 212.100.0362.610.009 ns
214, 14, 212.230.0263.450.001 ns
Ca2+113, 14, 212.690.0072.160.031 ns
213, 14, 213.660.000 ns ns
Mg2+113, 14, 21 ns2.340.019 ns
213, 14, 21 ns ns ns
Na+113, 14, 21 ns2.130.033 ns
213, 14, 21 ns ns ns
K+113, 14, 212.160.0312.620.009 ns
213, 14, 21 ns ns ns
Table 3. Significance differences in the flow (on the sampling day) and major ion concentrations in the Raba River water between spring (SP), summer (S), and autumn (A) in the hydrologically dry (HD), average (HA), and wet (HW) years (Mann–Whitney test; p—significance level; Z—statistic value, ns—not significant). Only significant differences are given.
Above the Dam Below the Dam
ParameterSeasonHD HA HW HD HA HW
ZpZpZpZpZpZp
Flow SP-S ns2.240.025 ns2.240.0252.240.03 ns
SP-A ns ns ns2.170.030 ns ns
ClSP-S ns−2.450.014 ns ns2.240.030 ns
SP-A−2.170.030 ns ns ns2.170.030 ns
S-A−2.240.025 ns ns ns ns ns
SO42−SP-S ns ns ns ns ns2.060.04
SP-A−2.170.030 ns ns ns2.170.030 ns
S-A−2.240.025 ns ns ns ns ns
Mg2+SP-S ns−2.240.025 ns ns ns2.180.03
SP-A−2.170.030 ns ns ns ns ns
Na+SP-S ns−2.450.014 ns ns2.030.04 ns
SP-A−2.170.030 ns ns ns ns ns
S-A−2.330.020 ns ns ns ns ns
K+SP-S−2.330.020−2.450.014−2.650.008 ns ns ns
SP-A ns ns−2.160.031 ns ns ns
S-A ns ns ns ns ns ns
Table 4. Significance differences in the major ion concentrations in the Raba River between sites 1 (upstream) and 2 (downstream) in the hydrologically dry (HD), average (HA), and wet (HW) years (Wilcoxon test; p—significance level; Z—statistic value; ns—not significant). Only significant differences are given.
IonAll DataHD HA HW
ZpZpZpZp
Cl ns2.100.035 ns ns
SO42−2.990.0032.480.013 ns ns
HCO33.790.0002.350.019 ns2.420.016
Ca2+4.170.0002.690.0072.350.0192.420.016
Mg2+4.380.0002.690.0072.790.0052.240.025
Na+3.050.0022.410.016 ns ns
K+3.090.0022.480.013 ns ns
Table 5. Percentage changes (“−” decrease and “+” increase) in median, minimum, maximum, and coefficient of variation (CV) of the major ion concentrations in the Raba River from the upstream to the downstream of the dam.
IonMedian Min Max CV
Years
HDHAHWHDHAHWHDHAHWHDHAHW
Cl−19.6−6.7+11.0+49.0+16.8−2.3−39.9−14.6+3.0−55.0−30.2+13.6
SO42−−17.8−8.5−11.3−6.5−15.2+13.3−28.6−8.8+52.5−40.4+28.0+96.5
HCO3−11.1−16.3−14.6+18.1+11.4+24.8−14.0+8.3−1.3−16.6+15.1−31.5
Ca2+−14.3−14.9−14.9+12.8+7.9+4.9−20.7−17.0+21.0−29.4−49.9+32.8
Mg2+−21.8−23.6−15.7+30.1+18.7−2.7−25.5−27.0+21.7−51.2−60.6+35.1
Na+−32.3−11.2−9.9+37.0+48.4+2.7−50.0−30.3−10.7−54.0−56.5+3.2
K+−27.3−11.8−6.2+30.1+41.6−5.9−25.6−9.8−12.1−63.0−30.2+13.6
Table 6. Principal component analysis (PCA) of the studied parameters in the Raba River water upstream and downstream of the dam.
ParameterUpstreamDownstream
PC1PC1PC2
Flow on the day0.790.220.41
Cl−0.88−0.55−0.63
SO42−−0.90−0.340.61
HCO3−0.83−0.790.04
Ca2+−0.77−0.780.49
Mg2+−0.90−0.850.35
Na+−0.87−0.56−0.69
K+−0.83−0.48−0.18
Eigenvalue5.722.991.80
Total variance (%)71.637.322.50
Table 7. The Spearman correlation coefficients between the studied parameters in the Raba River water in the studied hydrological years. Only significant differences are given (p < 0.05).
Upstream Downstream
ParameeterFlowClSO42−HCO3Ca2+Mg2+Na+FlowClSO42−HCO3Ca2+Mg2+Na+
Hydrologically dry years
Cl−0.79 ns
SO42−−0.760.75 ns0.76
HCO3−0.450.520.57 nsnsns
Ca2+−0.510.540.470.86 nsnsns0.64
Mg2+−0.820.710.670.690.75 nsnsns0.540.79
Na+−0.810.880.75nsns0.63 −0.570.680.73nsnsns
K+−0.640.650.65nsns0.500.63−0.70nsns0.550.480.70ns
Hydrologically average years
Cl−0.80 −0.40
SO42−−0.730.72 ns0.52
HCO3−0.460.510.43 ns0.680.62
Ca2+nsns0.480.54 nsns0.660.64
Mg2+−0.850.750.710.49ns nsns0.890.760.75
Na+−0.900.790.710.54ns0.91 ns0.96ns0.56ns0.46
K+−0.75nsnsnsns0.630.74ns0.520.500.47ns0.670.57
Hydrologically wet years
Cl−0.65 −0.54
SO42−−0.740.71 nsns
HCO3−0.75ns0.57 nsns0.63
Ca2+nsnsns0.93 nsns0.860.93
Mg2+−0.84ns0.810.720.61 nsns0.900.980.98
Na+−0.95ns0.740.860.710.89 −0.710.93nsnsnsns
K+nsnsns0.71nsnsnsnsnsnsnsnsnsns
Disclaimer/Publisher’s Note: The statements, opinions and data contained in all publications are solely those of the individual author(s) and contributor(s) and not of MDPI and/or the editor(s). MDPI and/or the editor(s) disclaim responsibility for any injury to people or property resulting from any ideas, methods, instructions or products referred to in the content.

