1. Introduction
Pumped storage power stations utilizing natural alpine basins face unique challenges due to their specific external conditions and functional designs, distinguishing from conventional river dams. In these settings, issues related to the seepage prevention of reservoir basin are more pronounced and necessitate stringent seepage control measures [
1]. Leakage can prevent the reservoir from reaching its normal storage level, thereby impairing its functionality, diminishing the project’s benefits, and potentially jeopardizing both production safety and public safety. This is particularly true for basins with inadequate seepage prevention capabilities, especially those characterized by karst formations and complex geological conditions. Consequently, the identification of leakage passages beneath the reservoir basin, assessment of the seepage pathways in fractured networks, analysis of the underground hydraulic connections, and the development of an effective seepage prevention strategy are critical for ensuring judicious investment management [
2,
3]. Comprehensive investigation of the complex hydrogeological conditions for the reservoir, determination of groundwater hydraulic connections, and identification of potential leakage passages are essential. These efforts provide a solid foundation for the hydrogeological surveys in water conservancy and hydropower projects, and inform the design of effective seepage prevention measures for the reservoir [
4].
The main methods of reservoir leakage detection include abnormal flow field analysis, borehole geophysical exploration, the seismic surface wave method, GIS, hydrochemical analysis, the tracer test, and other geophysical methods [
5,
6,
7,
8,
9,
10,
11]. Among these, the groundwater tracer test represents a crucial methodology for elucidating flow systems, and is extensively applied in hydrogeological surveys and the identification of leakage within the hydraulic structures [
12]. The tracer test is a detection method that places a source of material including solid particles, solutes, gases, and physical parameters like temperature and pressure [
13], that can move with groundwater in a certain part of the groundwater system, and detect it at the expected location. Based on the detection results, the characteristics of the media and potential fields are comprehensively analyzed to obtain the hydrodynamic characteristics of the natural flow field of the groundwater system. By injecting tracers at the injection point and analyzing water samples at the reception point, hydrogeological parameters such as velocity of groundwater and permeability coefficient can be determined. The recharge, runoff, and discharge between the adjacent groundwater flow systems can be detected, and the location of groundwater watersheds and the connectivity, extension, and distribution of underground rivers can be determined. This helps in speculation about the relationship between groundwater and surface water, as well as the leakage pathways of the reservoir, which can provide a scientific basis for the division, resource evaluation, and pollution prevention of groundwater flow systems.
Lorenzi et al. [
14] explored the flow pathways within karst systems using isotopic tracer tests and hydrogeochemical monitoring, subsequently developing a conceptual model that delineates spring recharge processes and demonstrates the overlay of karst networks upon regional base flows. Aquilanti et al. [
15] employed DNA and fluorescein tracer tests to investigate the water cycle within the unsaturated zone in the Umbria-Marche limestone ridge and validated the efficacy of DNA tracers in such environments. Through a comprehensive analysis of multiple tracer test datasets, 3D seismic imagery, and well flow metrics, Bodin et al. [
16] examined the karst conduit network employing a multi-path search algorithm, confirming their findings within the karst aquifer at the Hydrogeological Experimental Site (HES). Nanni et al. [
17] utilized tracer tests to ascertain that the seismic events of 2016/2017 in central Italy enhanced the hydraulic conductivity of the basal aquifer, significantly altering groundwater circulation patterns. Martín-Rodríguez et al. [
18] demonstrated how geometric factors, such as aquifer structure and the anisotropy of the drainage network, can skew the predominant drainage pathways within karst aquifers, as evidenced by dye tracer tests and response time disparities. Ren et al. [
19] undertook a study on a complex karst aquifer in Southwest China, integrating multiple tracer tests, and chemical and isotope analyses, aiming for a rapid and effective method to pinpoint and identify pollution sources within intricate karst systems.
In recent years, the tracer technique has been gradually applied in the seepage detection of the reservoir dams. Qiu et al. [
20] implemented an enhanced tracer test methodology, integrating both natural and artificial salt tracers, to quantitatively assess the leakage at Wanyao Dam, and conducted a detailed analysis of the leakage rate. Hua et al. [
21] developed an innovative dimension reduction model (DRM) based on tracer test results, which effectively characterizes fractured networks and predicts the flow and transport within the fractured aquifers, further demonstrating its applicability to fractured network characterization at the field scale. Dogančić et al. [
22] established the hydraulic connectivity between Shahneshin North and Dashtak North through the use of stable isotope analysis (δD and δ
18O) alongside multiple tracer tests.
In the realm of water conservancy and hydropower engineering, accurately identifying the complex subterranean karst conduit systems, determining the seepage parameters of fractured rock masses, and pinpointing large-scale water-conducting fracture zones and leakage passages are critical for the design of the selection of anti-seepage strategies. Currently, the single-hole dilution method is predominantly applied in aquifer studies but is seldom utilized in detecting leakage and quantifying groundwater parameters in dams and other hydraulic structures [
23,
24]. Furthermore, conservative tracer tests [
25] are mainly employed to explore hydraulic connections within fracture networks and karst conduits, yet they often lack in-depth quantitative analysis. This paper introduces a novel quantitative approach for measuring the permeability parameters of rock masses and the dimensions of leakage passages via tracer tests. Additionally, it presents a new technique for assessing the flow rate and direction of groundwater in a single hole [
26], which was successfully validated through engineering applications at the Yongxin Pumped Storage Power Station (YXPSPS). This method provides a solid foundation for future anti-seepage designs and seepage control measures.
3. Case Study
3.1. Project Overview
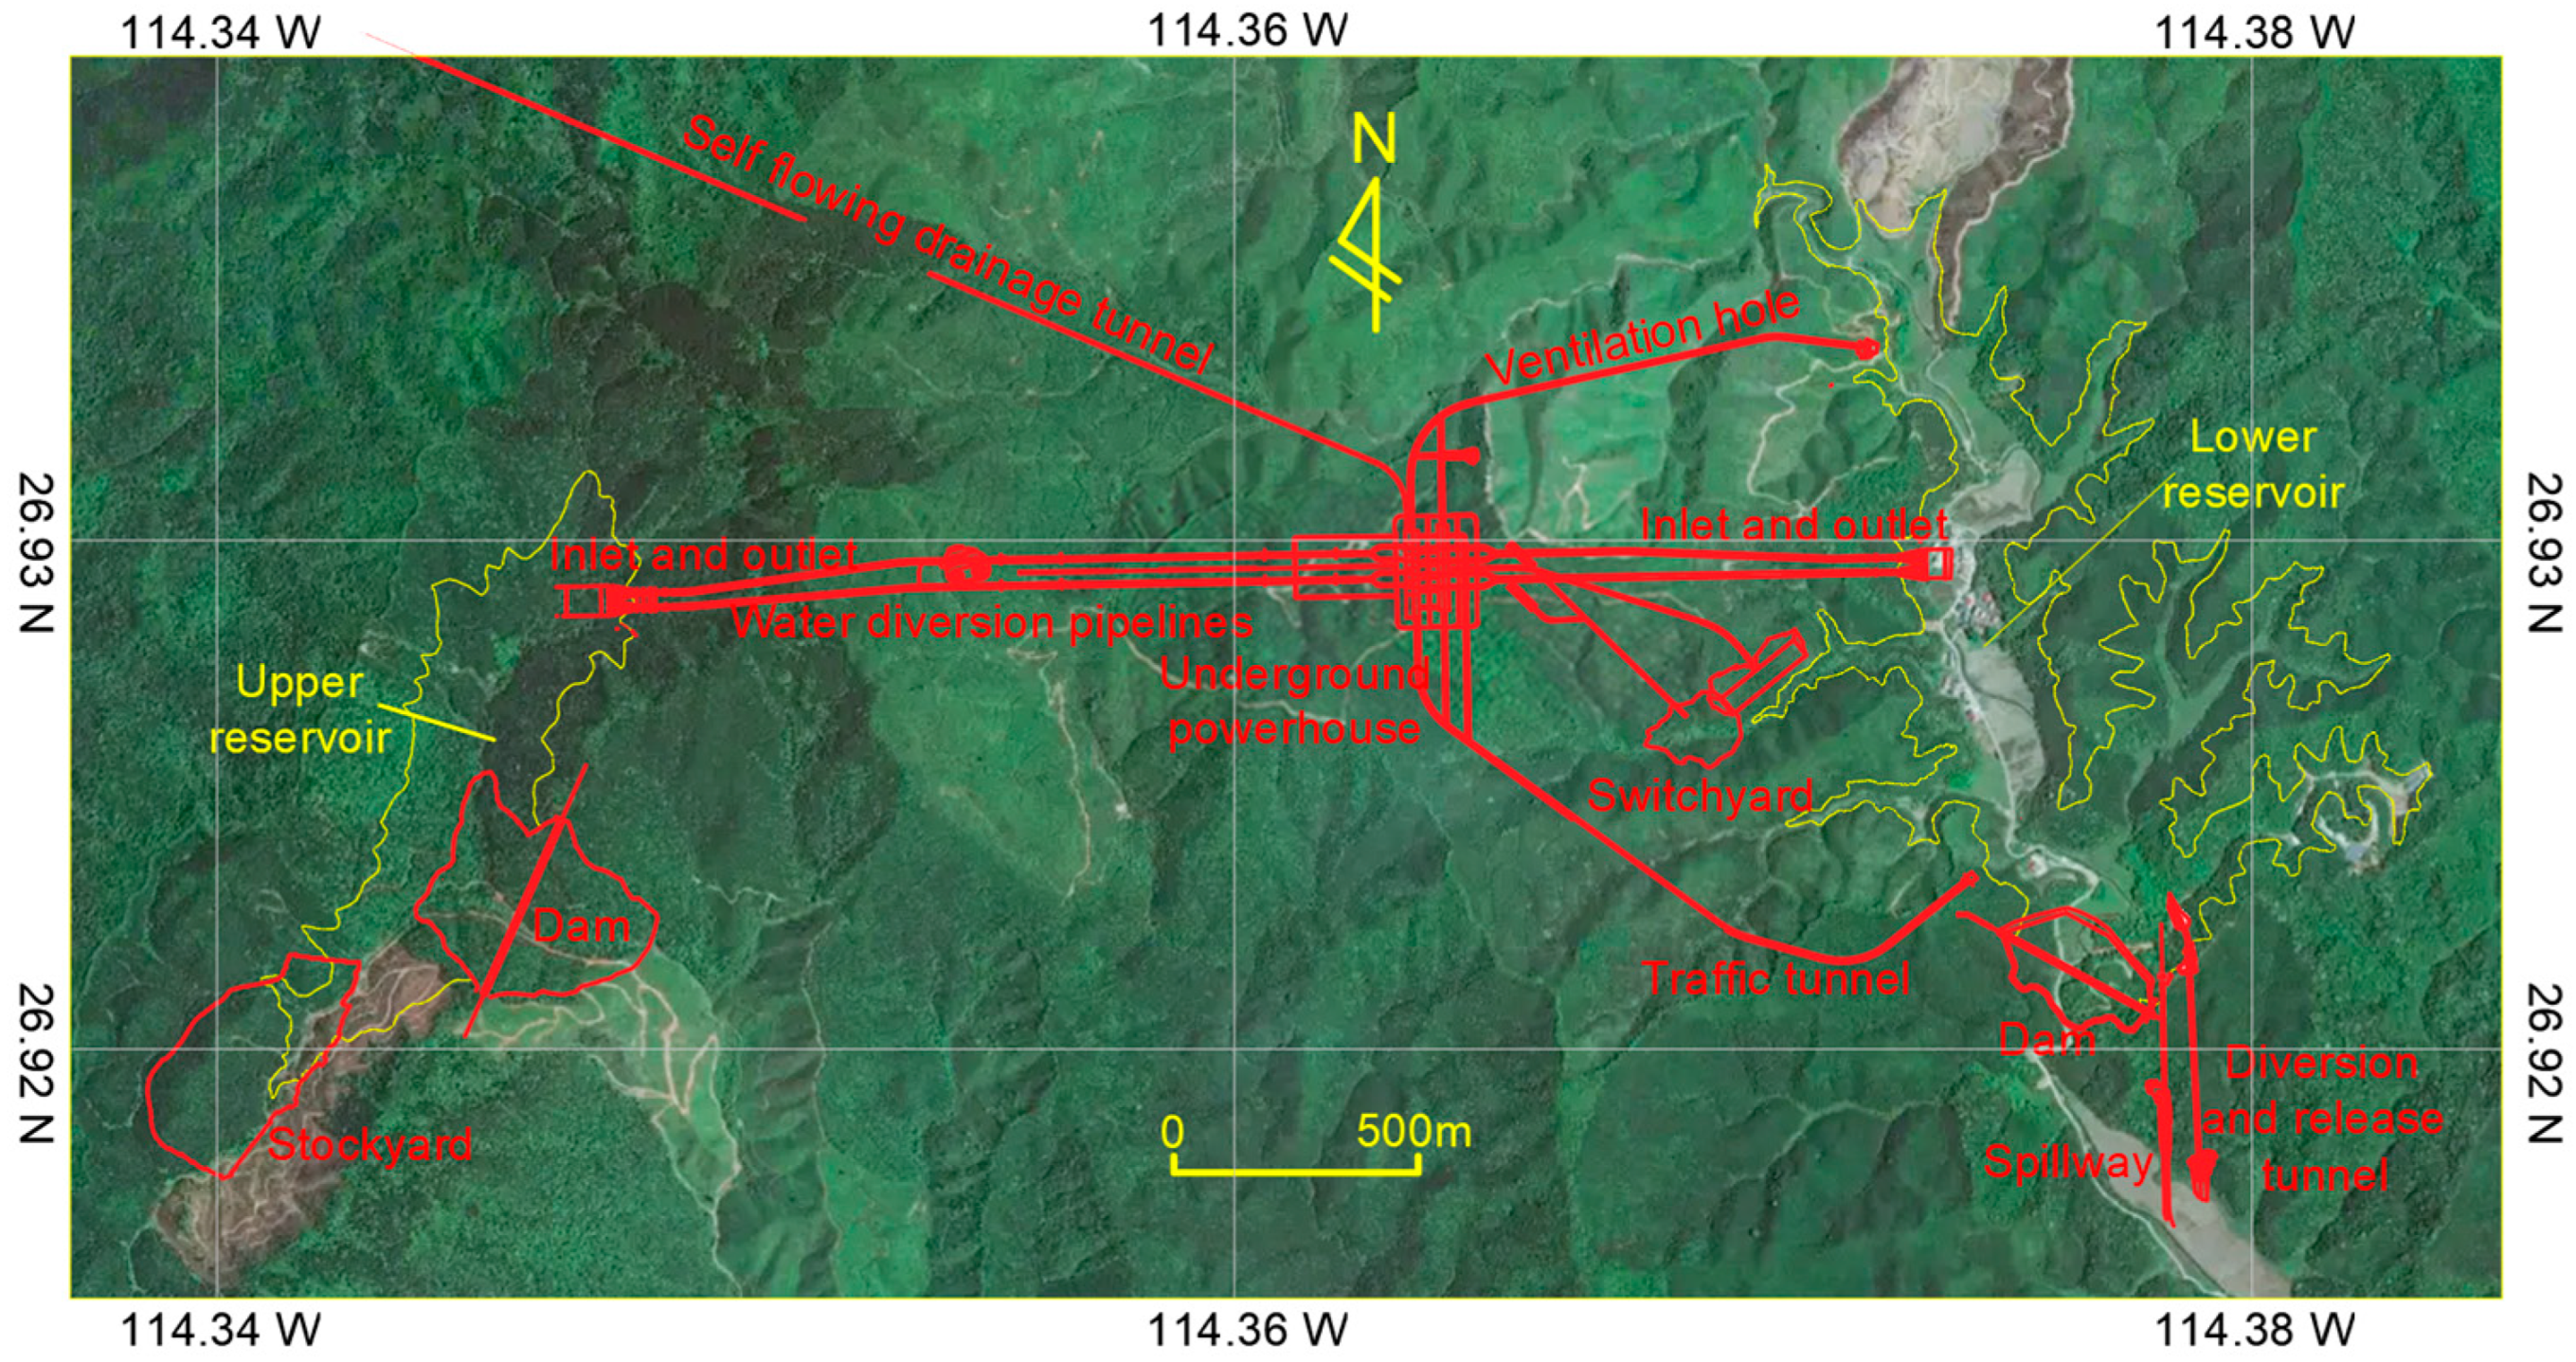
The upper reservoir of Yongxin Pumped Storage Power Station (YXPSPS) is located in Gongyi Village, Aonan Town, Yongxin County, Ji’an City, Jiangxi Province, China. It is a valley-type reservoir constructed using a T-shaped valley formed by the intersection of Tongluoping and Daijiaoling Gullies with Yisong Gully. The Tongluoping Gully flows from northeast to southwest with a V-shaped valley and a longitudinal slope of about 5–10° at the bottom. The ground elevation at the end of the reservoir is about 722 m. Daijiaoling Gully flows from southwest to northeast with a V-shaped valley and a longitudinal slope of about 5–10° at the bottom. The gully flows year-round, and the ground elevation at the end of the reservoir is about 707 m. The intersection of Tongluoping and Daijiaoling Gullies leads to the Yisonggou dam site area with a ground elevation of approximately 553 m.
The total installed capacity of YXPSPS is 1200 MW (4 × 300 MW). The power station is composed of the upper reservoir, lower reservoir, water conveyance system, underground power plant, and other buildings. After it is finished, it will supply power to the Jiangxi power grid and undertake tasks such as peak shaving, valley filling, energy storage, frequency regulation, phase regulation, and backup. It will play an important role in maintaining the safety, economy, and stable operation of the power grid. The normal water level of the upper reservoir is 646 m and the dead water level is 609 m. The regulating capacity of the reservoir is 10.92 million m3. The catchment area of the dam site is 1.37 km2.
The main structures of the upper reservoir include the asphalt concrete face rockfill dam, the stone material yard inside the reservoir, the anti-seepage of the reservoir basin, and the road on the reservoir bank. The dam type of the upper reservoir is an asphalt concrete face rockfill dam with a crest elevation of 649 m, a maximum dam height of 105.5 m, and a crest length of 360 m. The anti-seepage of the upper reservoir basin adopts a horizontal anti-seepage type. Except for the stone yard area inside the Daijiaoling Gully reservoir, the reservoir basin adopts the anti-seepage type of asphalt concrete panel around the reservoir and a geotextile membrane at the bottom of the reservoir (
Figure 2).
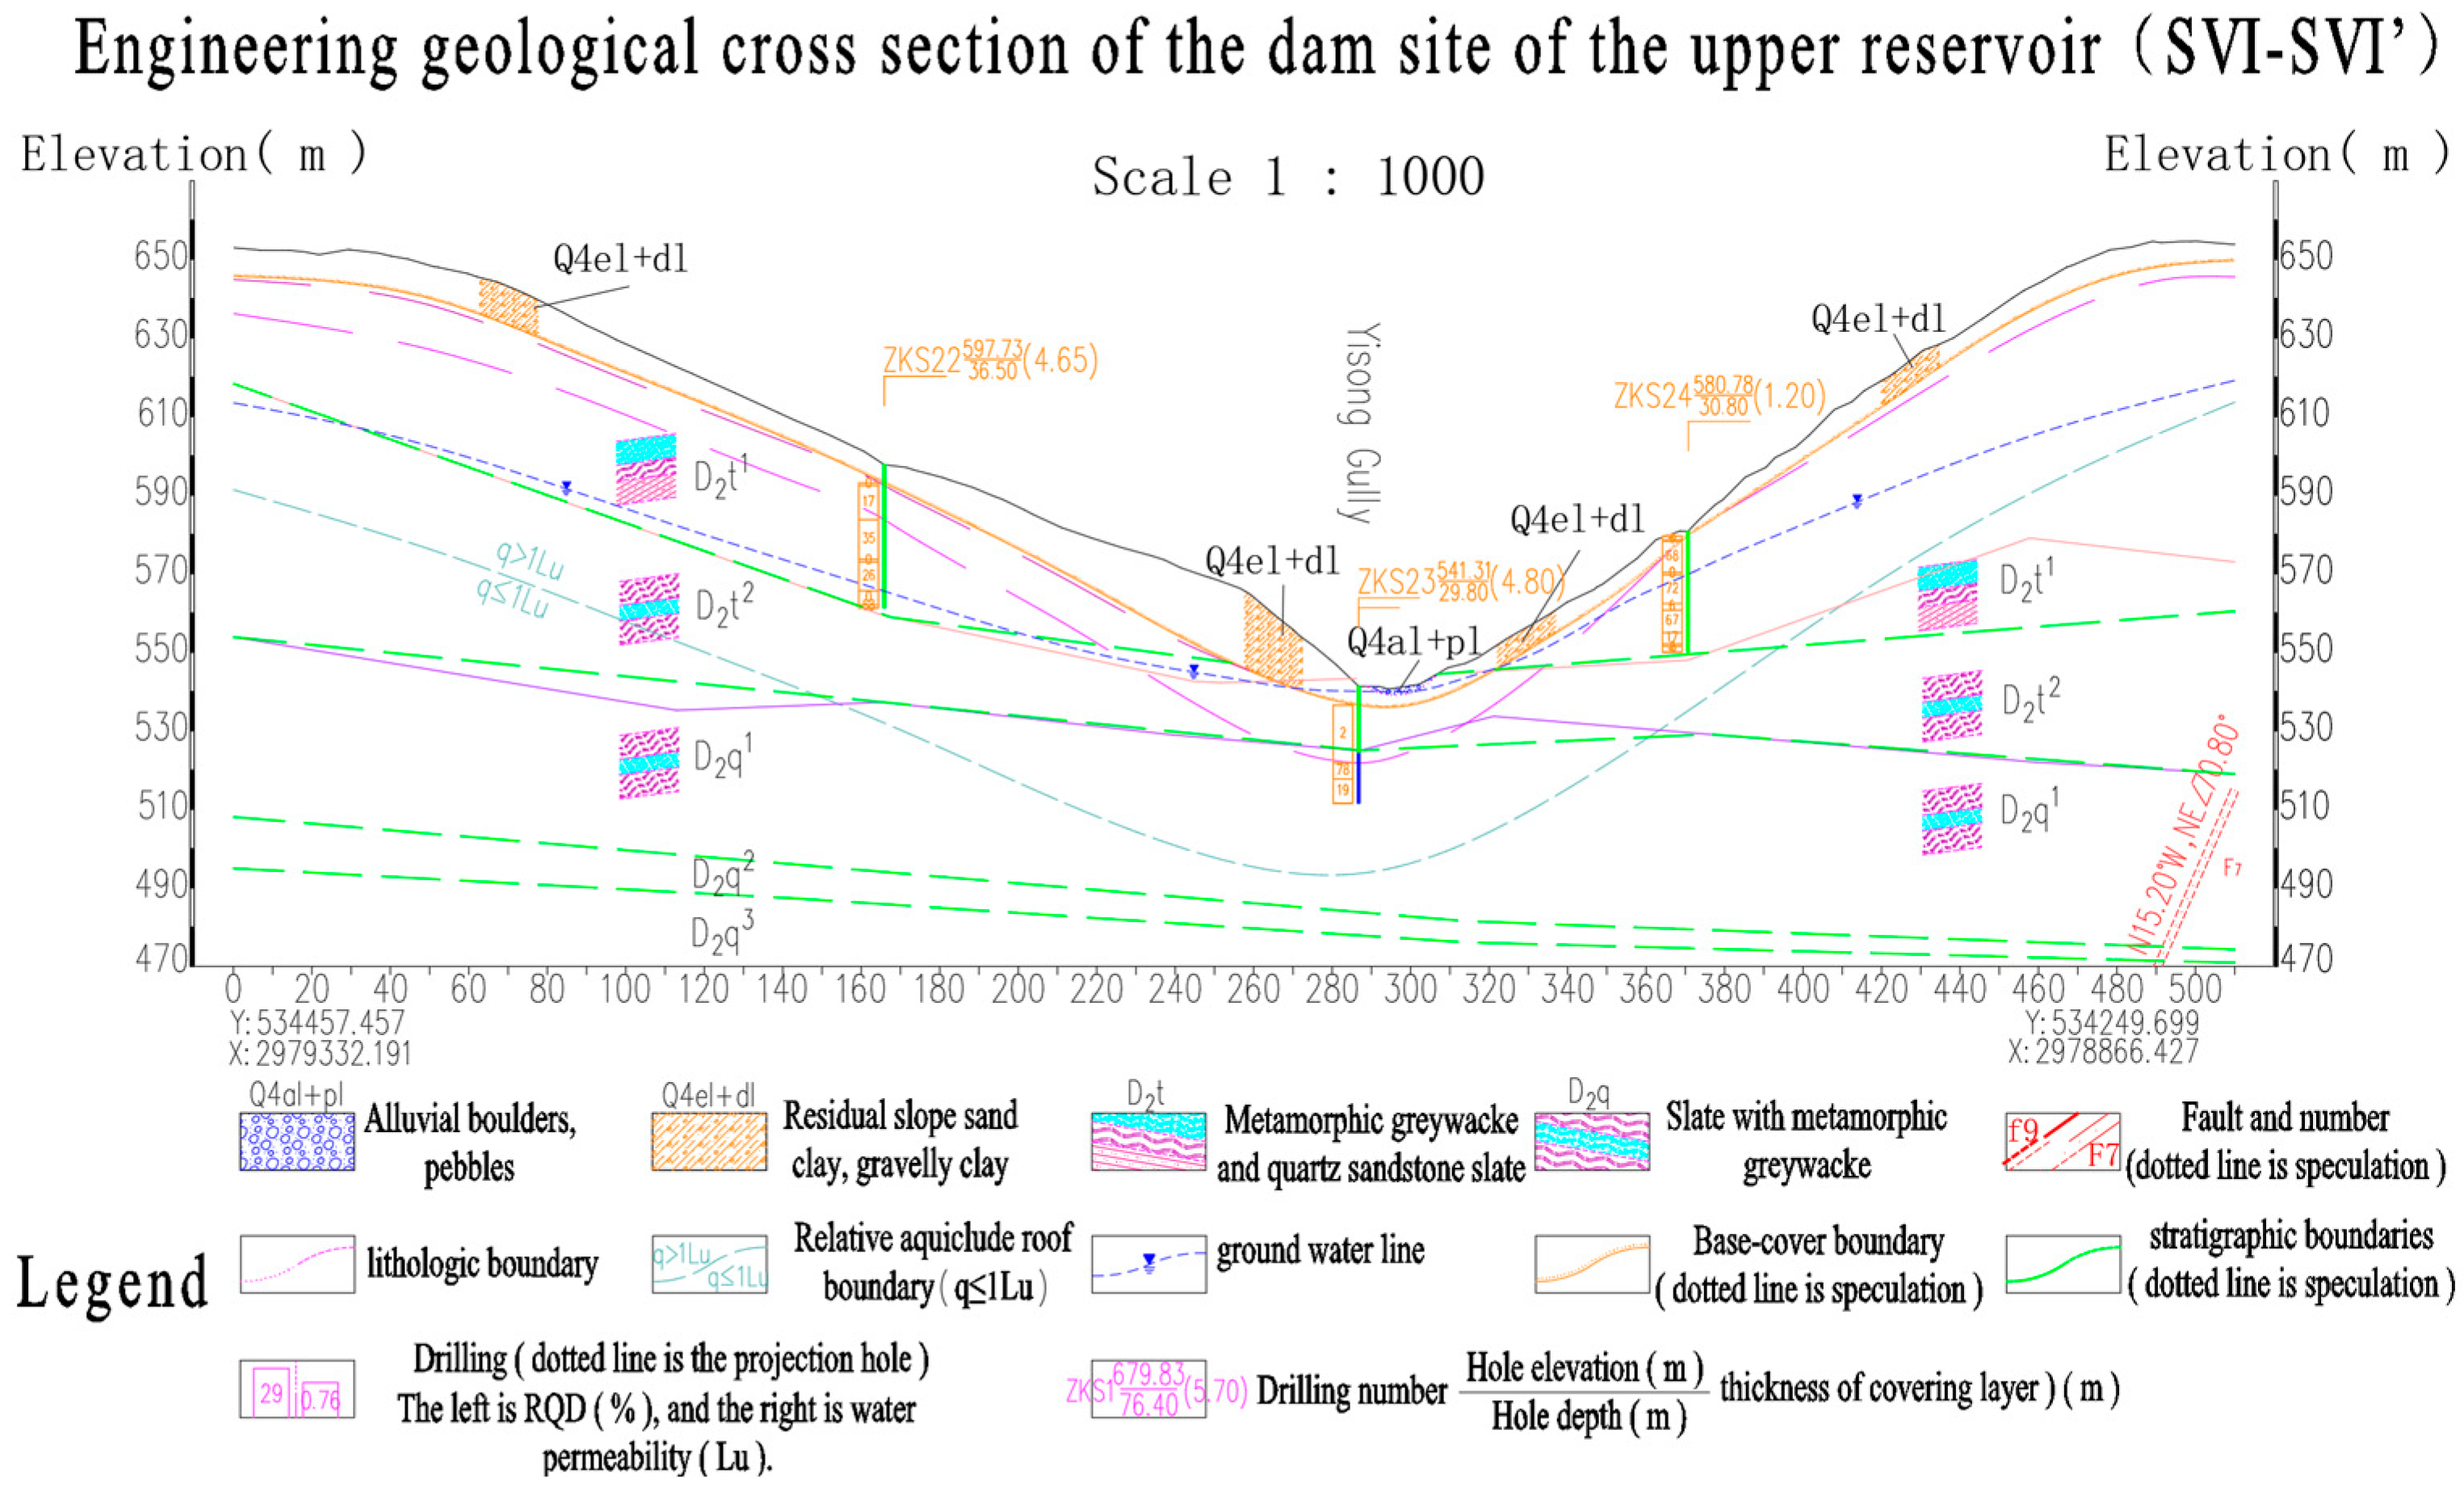
3.2. Lithology
The lithology of the exposed strata in the engineering area is relatively complex. The bedrock mainly consists of metamorphic sandstone interbedded with slate in the Lower Paleozoic Cambrian (∈
1n), metamorphic sandstone interbedded with slate (∈
2gt, ∈
3s
2), quartzite and quartz sandstone interbedded with a small amount of slate (∈
3s
3), metamorphic sandstone and quartz sandstone interbedded with slate (D
2t lower section) of the Upper Paleozoic Devonian (D), slate interbedded with metamorphic sandstone (D
2t upper section), calcareous sandstone and slate interbedded with metamorphic sandstone (D
2q middle lower section), metamorphic sandstone and calcareous sandstone interbedded with limestone (D
2q upper section), metamorphic sandstone interbedded with a small amount of sericite slate (D
3s), and quartz sandstone interbedded with slate (D
3x). The covering layer mainly consists of the residual slope layer (Q
4el+dl), alluvial flood layer (Q
4al+pl), colluvial slope layer (Q
4col+dl), and artificial accumulation layer (Q
4s) of the Quaternary Holocene (Q
4) in the Cenozoic era (
Figure 3).
3.3. Groundwater Types
According to the burial conditions and occurrence forms of groundwater, the types of groundwater in the engineering area can be divided into pore water, fracture water, and karst water. (i) Pore water is mainly distributed on the surface of the Quaternary cover layer and fully weathered layer, directly supplied by atmospheric precipitation, partially supplied by underlying bedrock fracture water, and discharged into low-lying terrain. The amount of water varies greatly due to seasonal influences. (ii) Fracture water is mainly distributed in bedrock joints, fractures, and fault zones, and is recharged by atmospheric precipitation and pore water. Its water-bearing capacity is mainly controlled by faults and fractures, and it is distributed in a vein and belt with significant spatial distribution differences and characteristics of non-uniformity and anisotropy. (iii) Karst water is distributed in carbonate rock layers, and there are three soluble rock bands (KRY1~KRY3) developed in the upper reservoir. The soluble rock bands are mainly calcareous sandstone with a small amount of limestone interlayers developed in deeper areas. Boreholes ZKS4 and ZKS57, and adit PD3, reveal karst caves. The water inrush phenomenon was found in boreholes ZKS4, ZKS18, ZKS57, and ZKS51, and adit PD3, in the dam site area. It is recharged by atmospheric precipitation, pore water, and fracture water, and the water-bearing capacity is mainly controlled by fractures, caves, and faults. It is distributed in a layer, vein, and belt, with significant spatial distribution differences and characteristics of non-uniformity and anisotropy. According to drilling data, the burial depth of groundwater in the dam axis of the upper reservoir is 59–91 m on the left bank, 0–3 m at the bottom of the gully, and 44–91 m on the right bank.
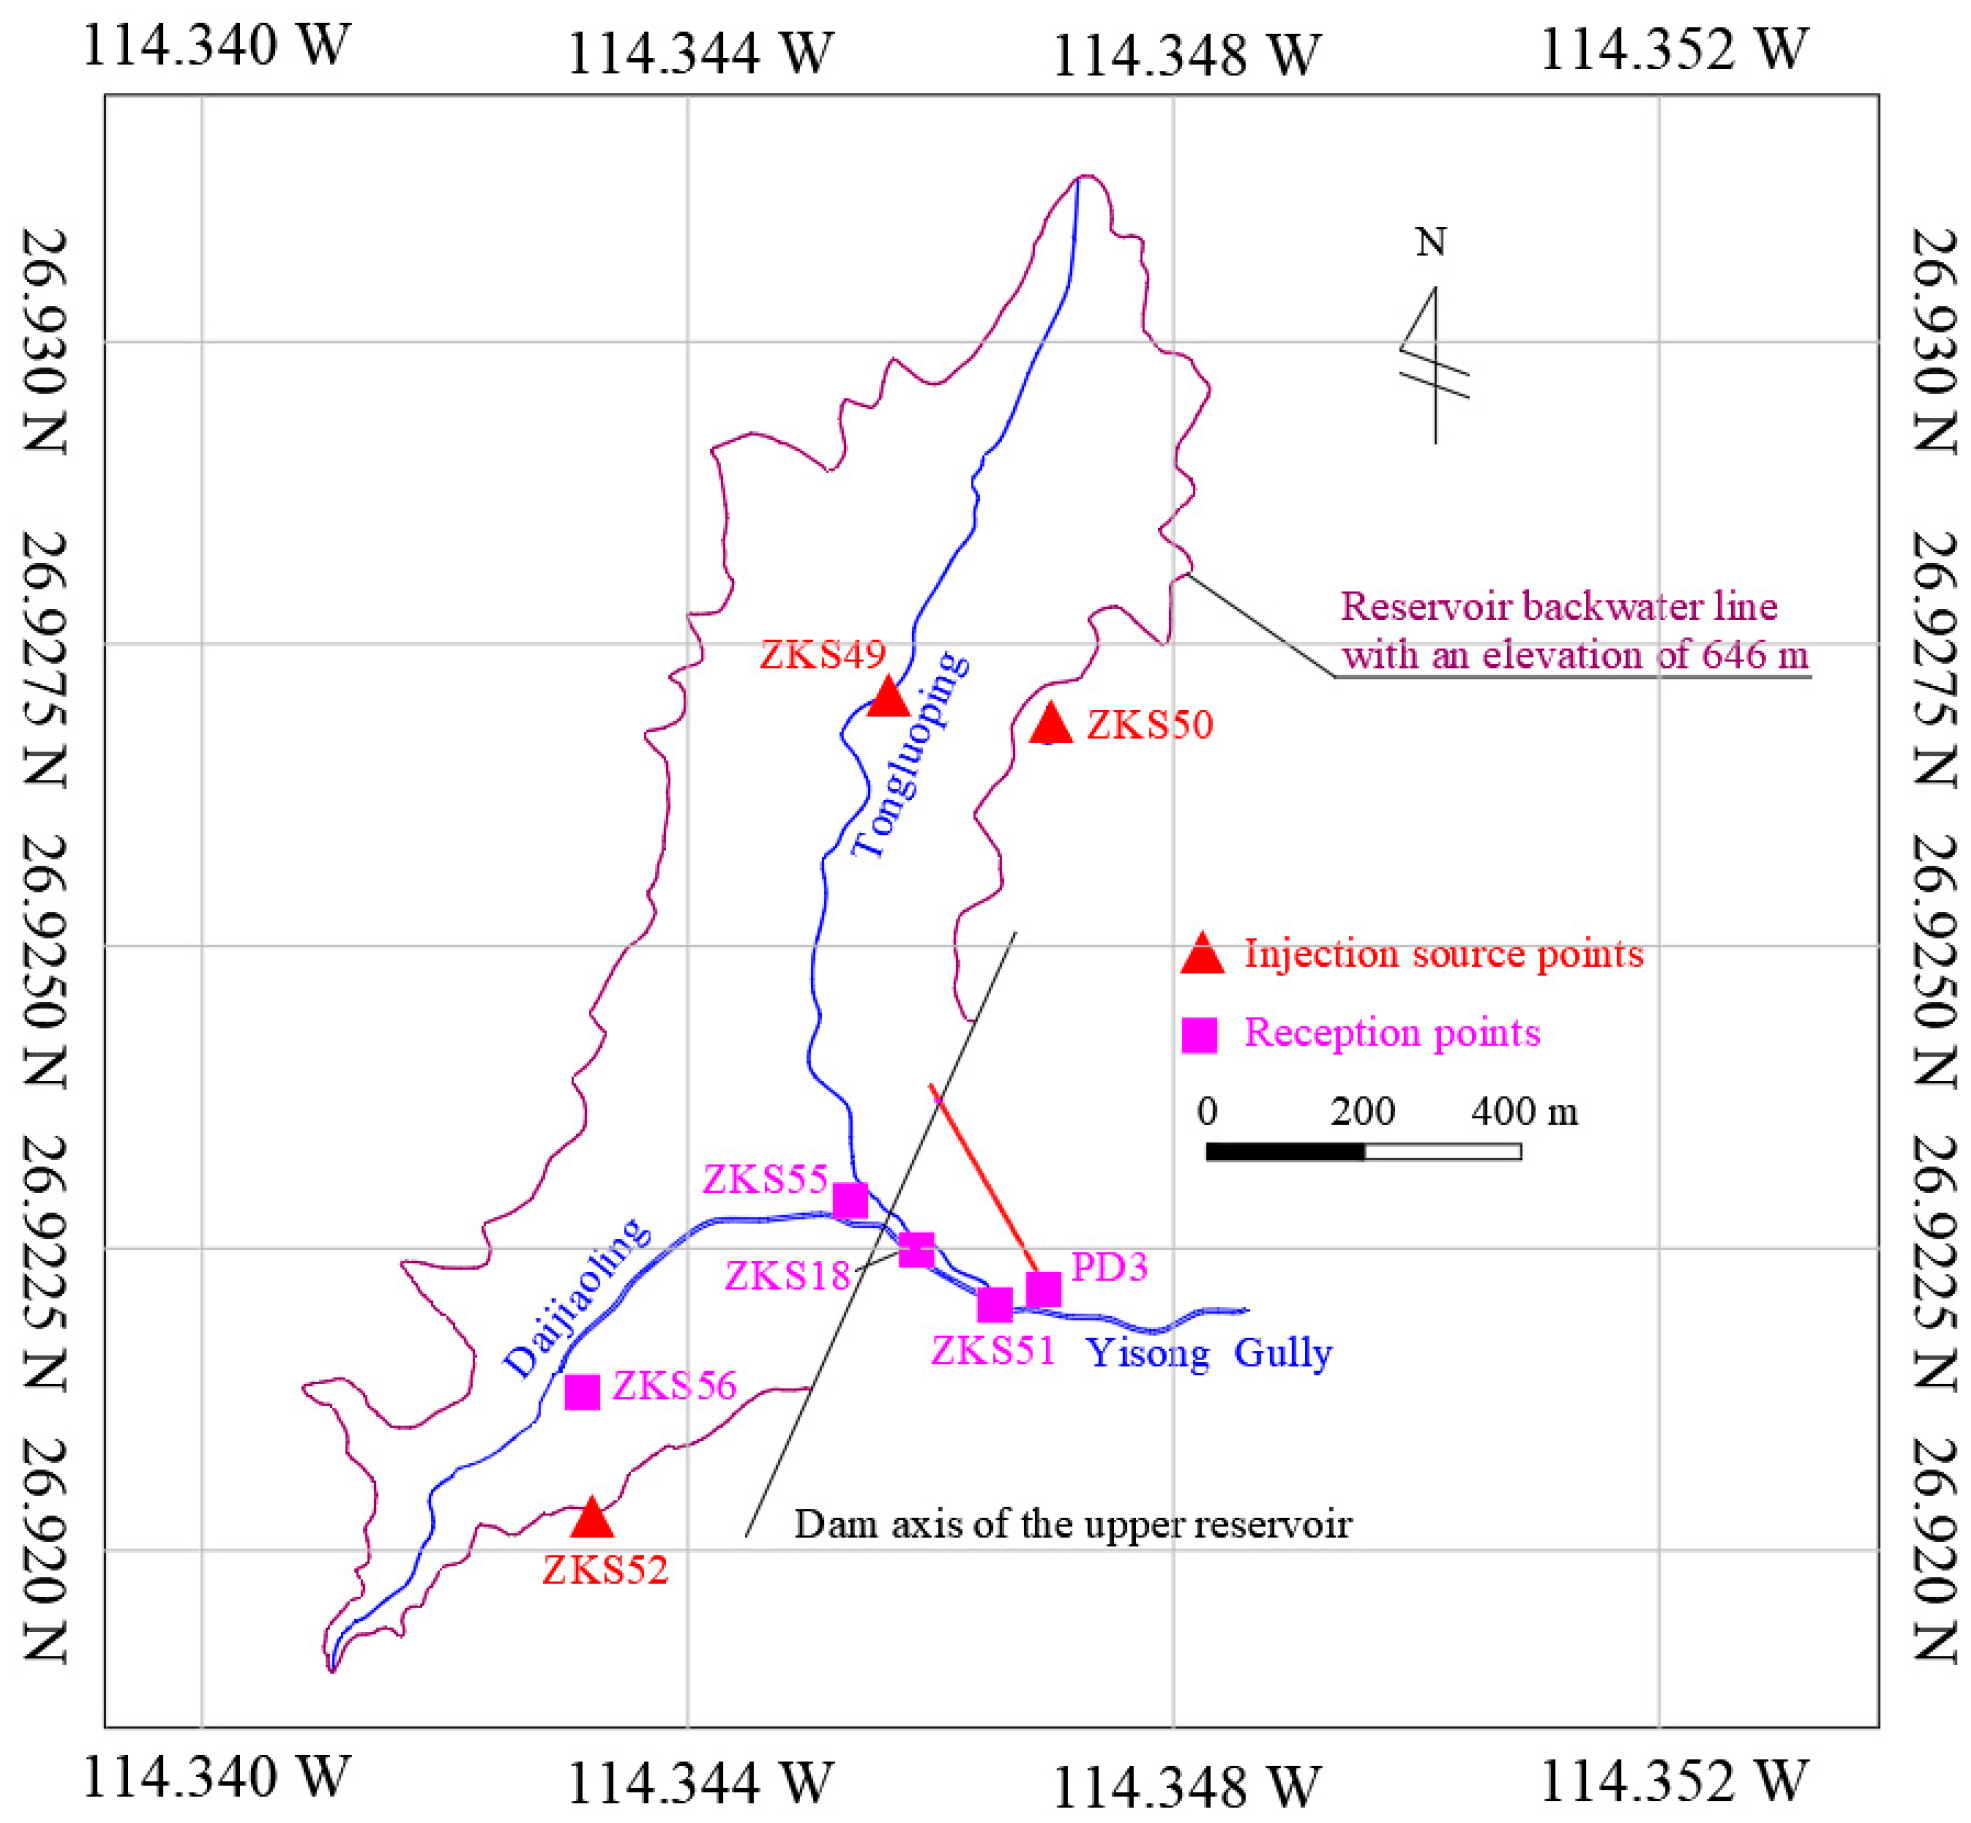
3.4. Process of the Tracer Tests
The tracer test was conducted from 29 April 2023 to 10 May 2023, with a total of three sets of tests. The injection source points were ZKS52, ZKS49, and ZKS50, respectively. There were a total of six reception points, namely ZKS18, ZKS49, ZKS51, ZKS55, ZKS56, and PD3. The location of the source and reception points is shown in
Figure 4. The detailed test process is shown in
Table 1.
4. Results
4.1. Identification of Multiple Leakage Paths in Complex Fracture Networks
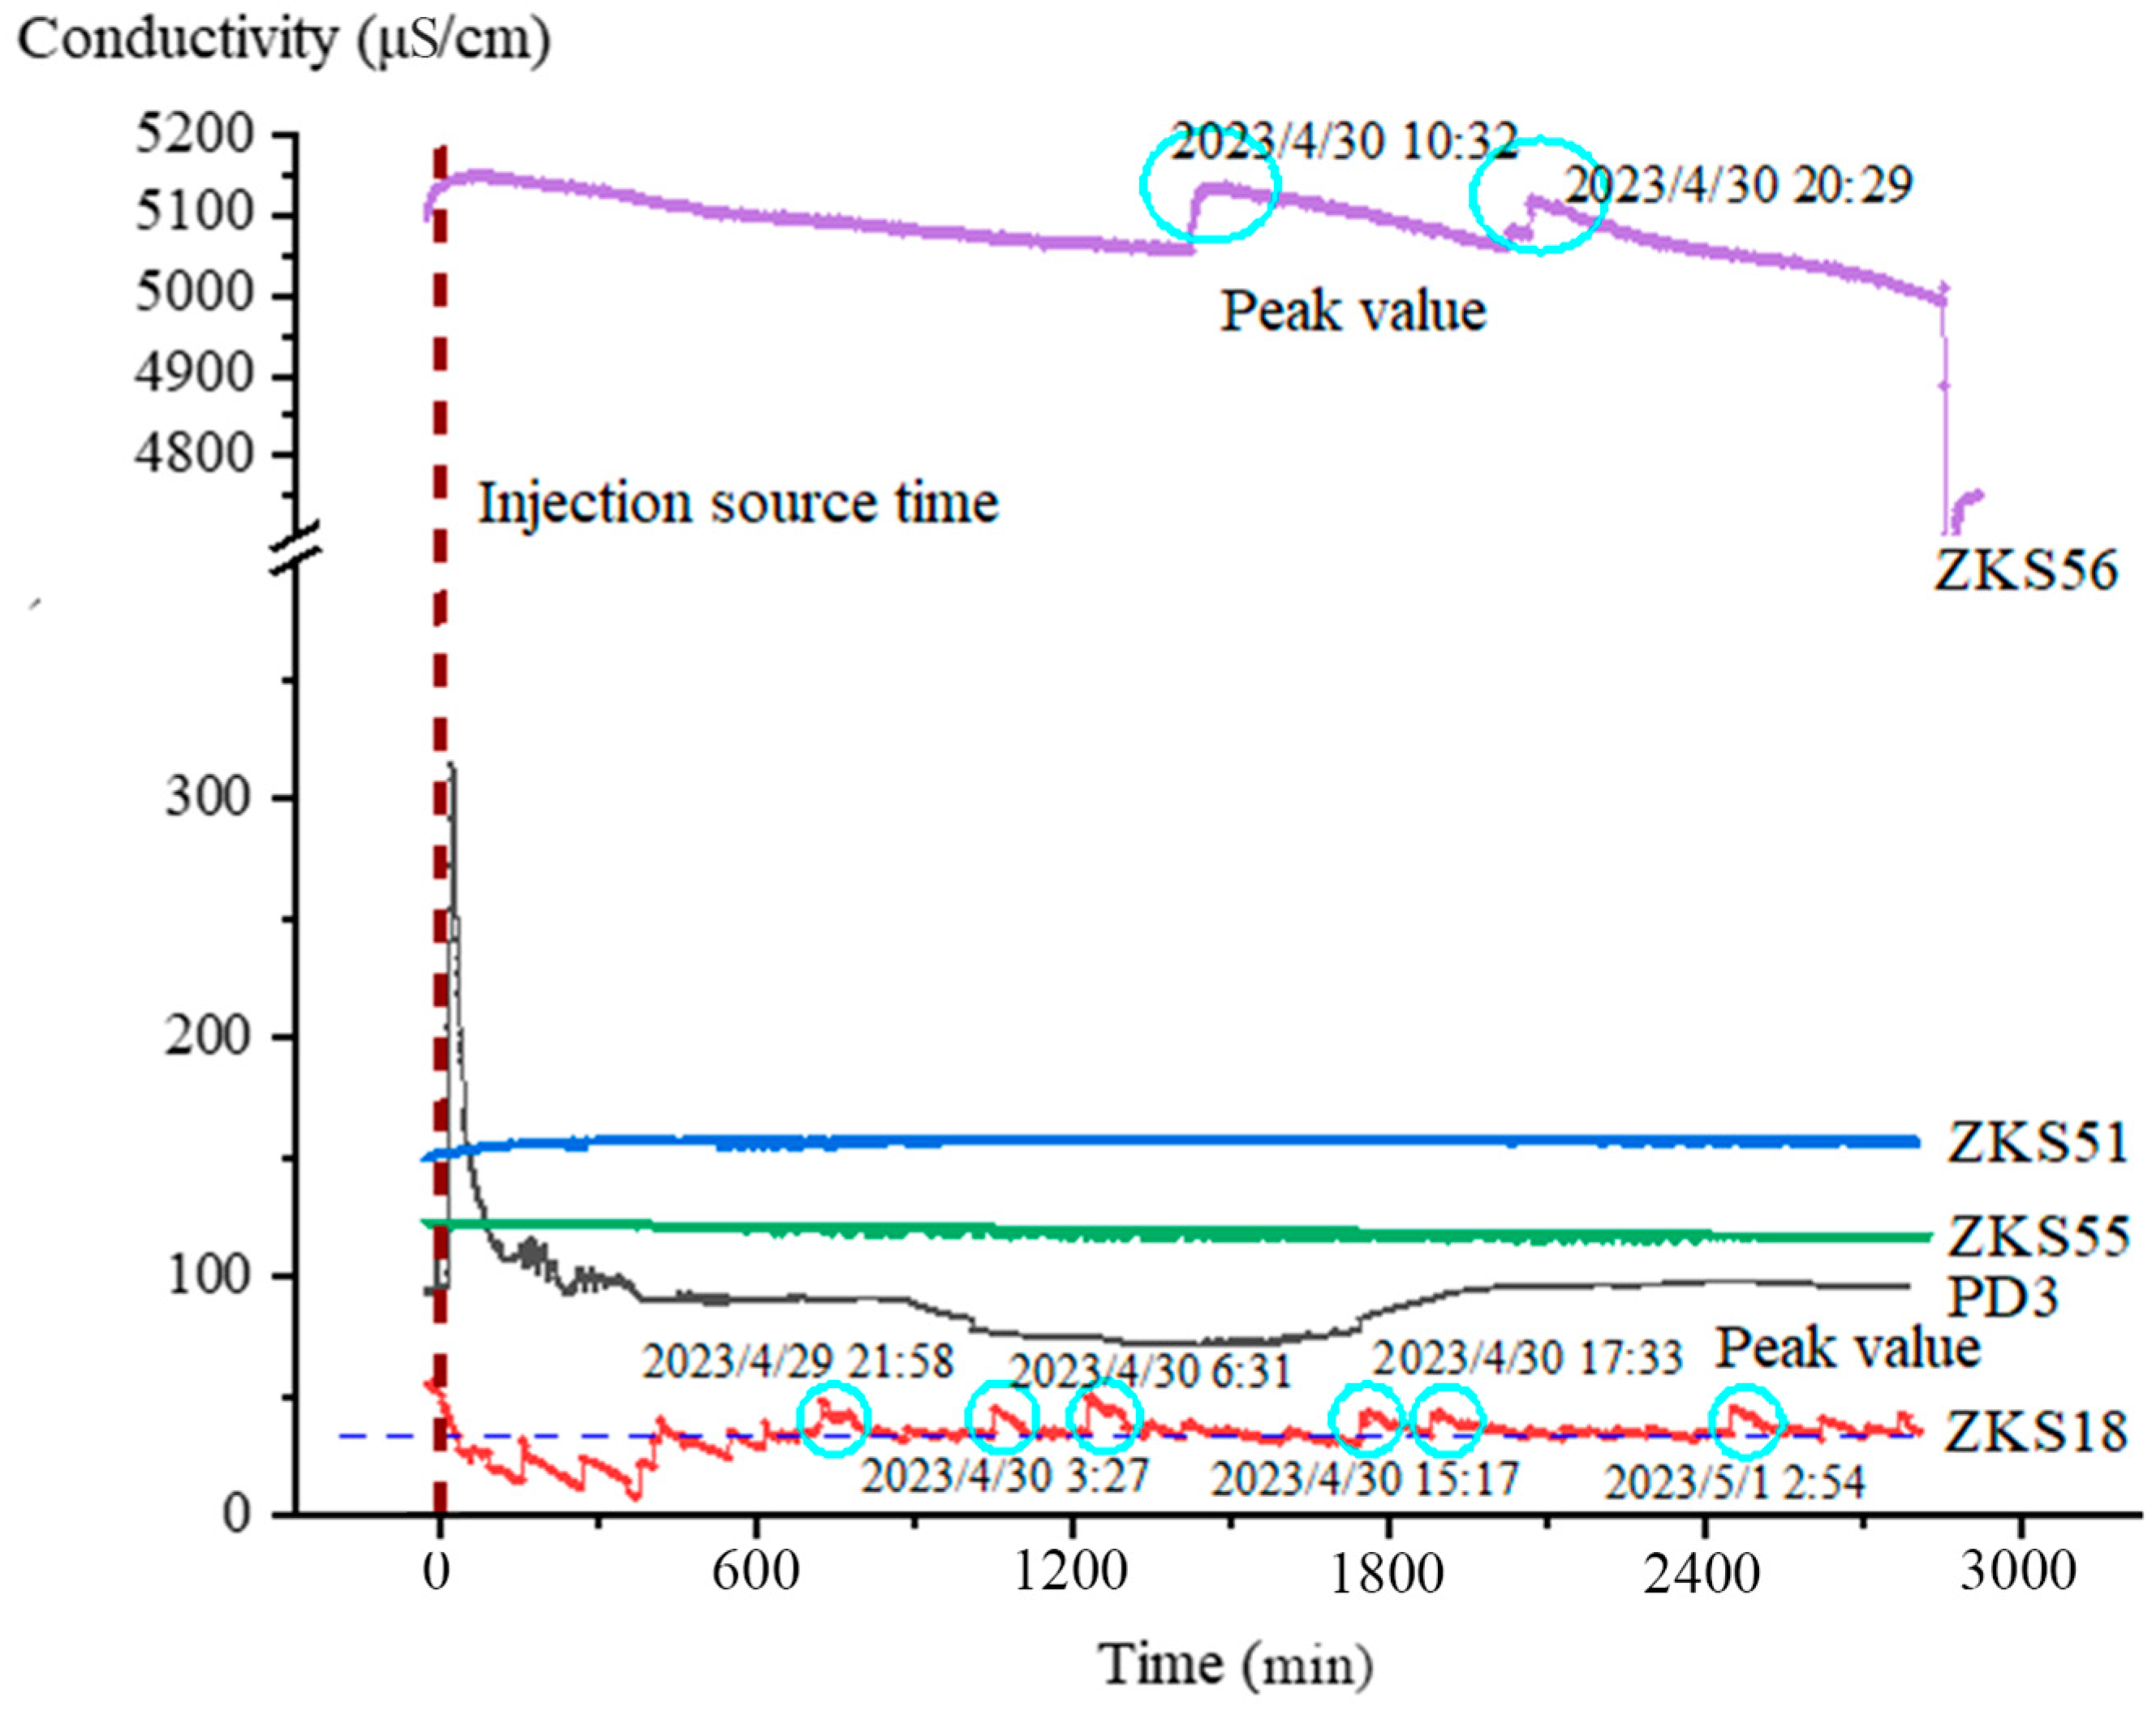
The tracer test was conducted from 9:40 on 29 April 2023 to 8:30 on 1 May 2023. The injection point of the tracer was ZKS52 with an elevation of 656 m. There are five reception points, namely ZKS18, ZKS51, ZKS55, ZKS56, and PD3 (
Figure 4). The results of conductivity over time at reception points are shown in
Figure 5.
It can be seen from
Figure 5 that the conductivity of ZKS18 fluctuated irregularly after the tracer was injected, and did not exceed the background value of conductivity. After 12.2 h, the conductivity began to show a clear breakthrough curve with a total of six obvious peaks during the entire test period. The tracer was received in ZKS18 at 21:52 on 29 April. The conductivity exceeded 34.9 μS/cm and reached the first peak of 47.8 μS/cm at 21:58, and then the conductivity gradually decreased. On 30 April at 3:12, the conductivity reached the second peak of 44.7 μS/cm at 3:27, and the conductivity gradually decreased thereafter. The conductivity exceeded 34.8 μS/cm and reached the third peak of 49.6 μS/cm at 6:31 on 30 April. At 15:17 on 30 April, the conductivity reached the fourth peak of 43.9 μS/cm. At 17:33 on 30 April, the conductivity reached the fifth peak of 43.1 μS/cm, and at 2:48 on 1 May, the conductivity reached the sixth peak of 45.4 μS/cm. It can be inferred that the tracer from ZKS52 was received in ZKS18, and there may be multiple leakage passages. Due to the fact that ZKS18 is pressurized water and the water level at the drilling site is higher than the surface, there may be multiple leakage points in ZKS18, which results in multiple peaks. According to Equations (2)–(4), the groundwater flow rates for the six leakage passages are 0.499 m/min, 0.343 m/min, 0.294 m/min, 0.208 m/min, 0.192 m/min, and 0.148 m/min, respectively. The difference in groundwater level between ZKS18 and ZKS52 is about 64.74 m, so the hydraulic gradient is 0.177. The permeability coefficients of the six main leakage passages are 2.819 m/min, 1.936 m/min, 1.66 m/min, 1.174 m/min, 1.087 m/min, and 0.837 m/min, respectively. Therefore, the calculated sizes of the six main leakage passages are 0.267 mm, 0.221 mm, 0.205 mm, 0.172 mm, 0.166 mm, and 0.145 mm, respectively.
The background value of the conductivity for ZKS56 is relatively high, which may be due to the short completion time of the hole, incomplete well washing, and certain contamination of groundwater in the hole. During the tracer test, we considered the relative conductivity, so high background values do not affect the results of the tracer test. A rapid increase in conductivity was seen within 20 min after the tracer was injected, and a slow decrease within the next 24 h. Therefore, the background value of conductivity is about 5060 μS/cm. After injecting the tracer from 9:40 to 9:50 on 29 April, the tracer was received at ZKS56 at 9:41 on 30 April. The conductivity exceeded 5054.1 μS/cm and reached the first peak of 5136.2 μS/cm at 10:32. On 30 April at 19:42, the conductivity reached the second peak of 5121.2 μS/cm at 20:29, and then the conductivity gradually decreased and remained stable overall. Two obvious breakthrough curves appeared after 24 h and 34 h, which indicates that ZKS56 received the tracer from ZKS52, and there may be two main leakage passages.
The receipt of the tracers at ZKS18 and ZKS56 indicates the possible fracture or fault passages between ZKS18, ZKS56, and ZKS52. The groundwater flow direction is from ZKS52 to ZKS18 and ZKS56, which also indicates that there is a hydraulic connection between the groundwater on the right bank of the upper reservoir and at the bottom of the Yisonggou Gully. The groundwater on the right bank recharges the water in the Yisonggou Gully. At the same time, there is a hydraulic connection between the groundwater on the right bank of the reservoir and the bottom of the Dajiaoling Gully, and the groundwater on the right bank recharges the water of the Dajiaoling Gully.
The conductivity of ZKS51 and ZKS55 remained unchanged during the entire test, which indicates that no tracer was received. The conductivity of PD3 increased rapidly within half an hour after the tracer injection, then decreased rapidly and showed a clear breakthrough curve. However, based on on-site shooting records and analysis of temperature changes at PD3 monitoring points, PD3 fired around 10 o’clock that day, which is consistent with the time of the peak. At the same time as the peak appeared, the water temperature at the PD3 also increased. Therefore, it is inferred that the breakthrough curve of PD3 may have been formed due to the influence of blasting during tunnel construction.
4.2. Estimation of Hydrogeological Parameters and Leakage Passage Size for Rock Mass
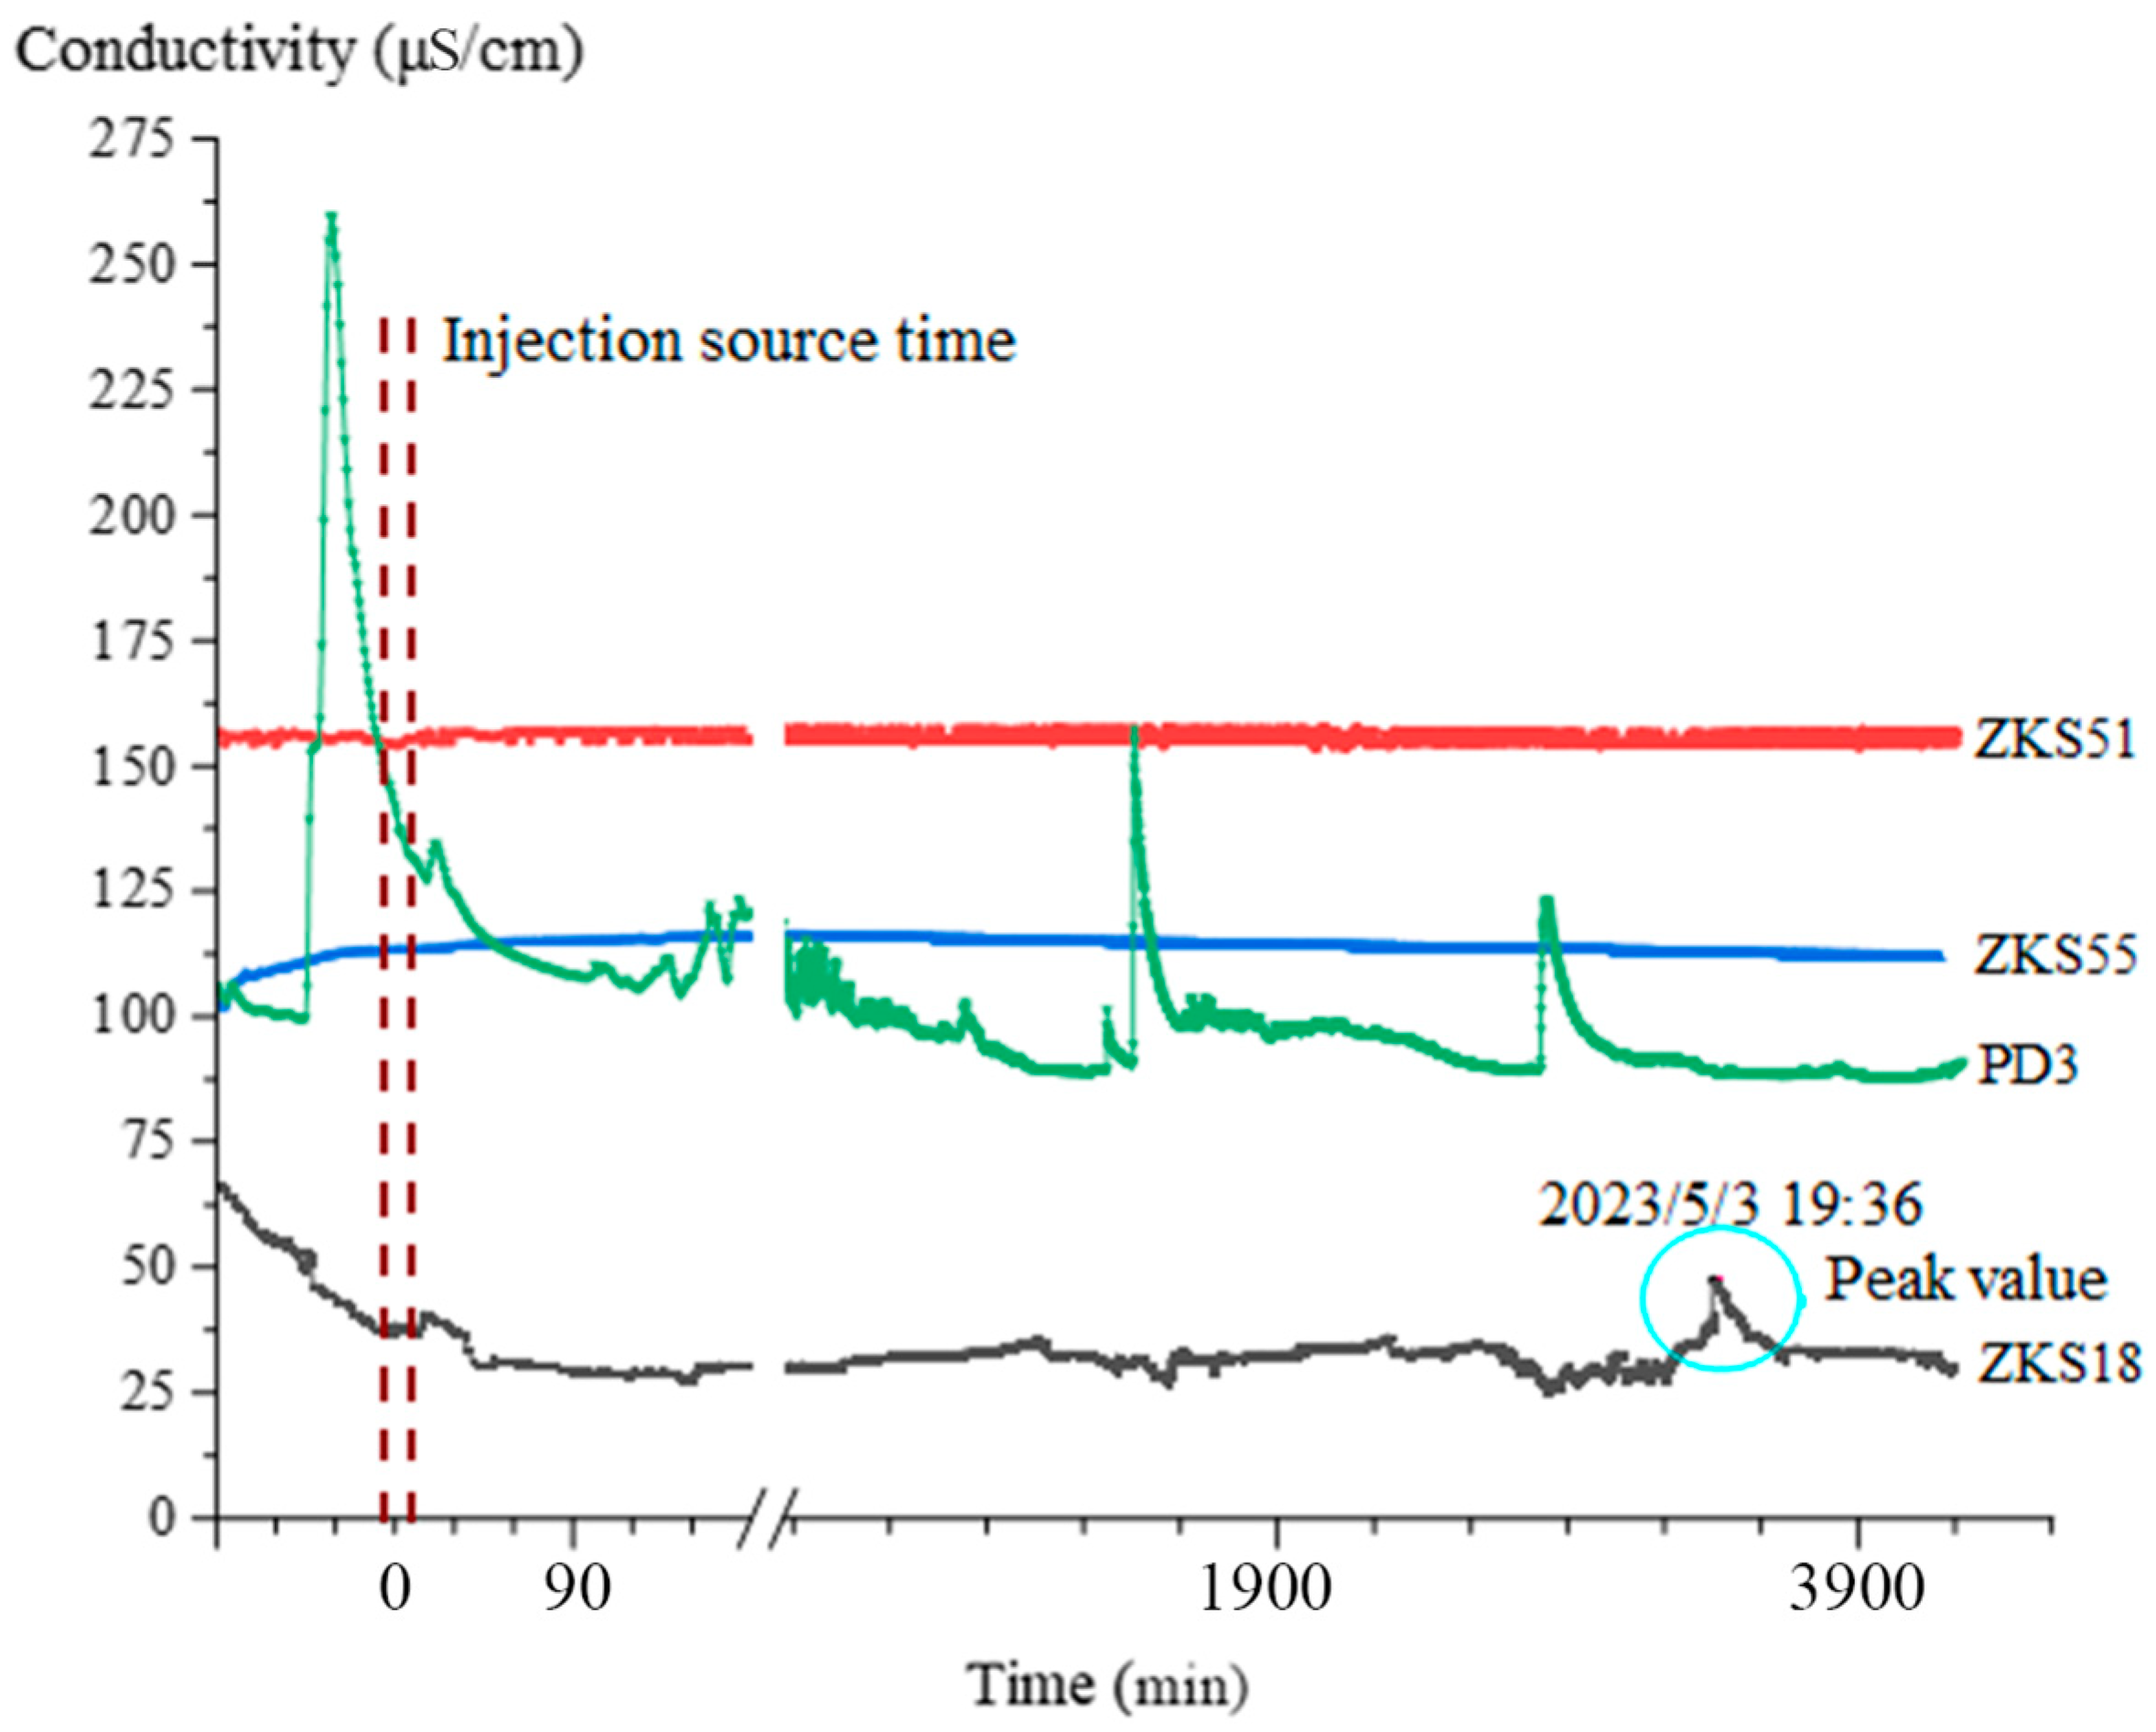
The tracer test was conducted from 10:46 on 1 May 2023 to 8:30 on 4 May 2023, with the injection point of ZKS49 at an elevation of 584 m. There were four reception points, namely ZKS18, ZKS51, ZKS55, and PD3 (
Figure 4). The results of conductivity changes over time at five monitoring points are shown in
Figure 6.
It can be seen from
Figure 6 that the conductivity of ZKS18 showed irregular fluctuations after the tracer was injected, and basically did not exceed the background value of conductivity. After 54.2 h, the conductivity began to show a clear breakthrough curve. The tracer was received at ZKS18 at 16:59 on 3 May with a conductivity exceeding 30.9 μS/cm, reaching a peak of 47.6 μS/cm at 19:36. Then the conductivity gradually decreased and remained relatively stable. It can be inferred that the tracer from ZKS49 was received at ZKS18. Because the well screen at ZKS49 is arranged in the stratigraphic section exposed by the fully weathered interlayer QJ
2 (56–69 m), ZKS18 also exposed the fully weathered interlayer QJ
2 at the depth of 80 m. Therefore, it can be inferred that the tracer at ZKS49 was received through the leakage of the fully weathered interlayer QJ
2 layer by layer. Due to the long reception time, the hydraulic connection of the fully weathered interlayer QJ
2 is relative weak. The direction of groundwater flow is from ZKS49 to ZKS18 through the fully weathered interlayer QJ
2.
The receipt of the tracer at ZKS18 and the location of exposed strata indicate the presence of a completely weathered interlayer QJ2 between ZKS18 and ZKS49. The size of the leakage passage can be estimated by the migration time of the tracer, the distance, and the groundwater level difference between the source and reception points. The distance between ZKS18 and ZKS49 is approximately 457.01 m. The migration time is 3253 min, so the groundwater flow rate is 0.14 m/min. The groundwater level difference between ZKS18 and ZKS49 is about 11.55 m, so the hydraulic gradient is 0.025 and the permeability coefficient is 5.559 m/min. According to Equation (4), the size of the leakage passage is calculated to be 0.375 mm.
The conductivities of ZKS51 and ZKS55 remained basically unchanged during the entire test, which indicates that no tracer was received. The conductivity of PD3 showed three significant peaks after the tracer was injected. However, based on the on-site records of PD3 blasting in the adit and the analysis of temperature changes at PD3 monitoring points, PD3 was fired around 11:30 noon on 1 May, 10:00 a.m. on 2 May, and 10:30 a.m. on 3 May, which was consistent with the peak time. At the same time, the water temperature at PD3 also increased. Therefore, it is inferred that the three breakthrough curves of PD3 in this test may have been formed due to the influence of blasting during the tunnel construction.
4.3. Determination of the Relationship between Groundwater Recharge, Runoff, and Discharge
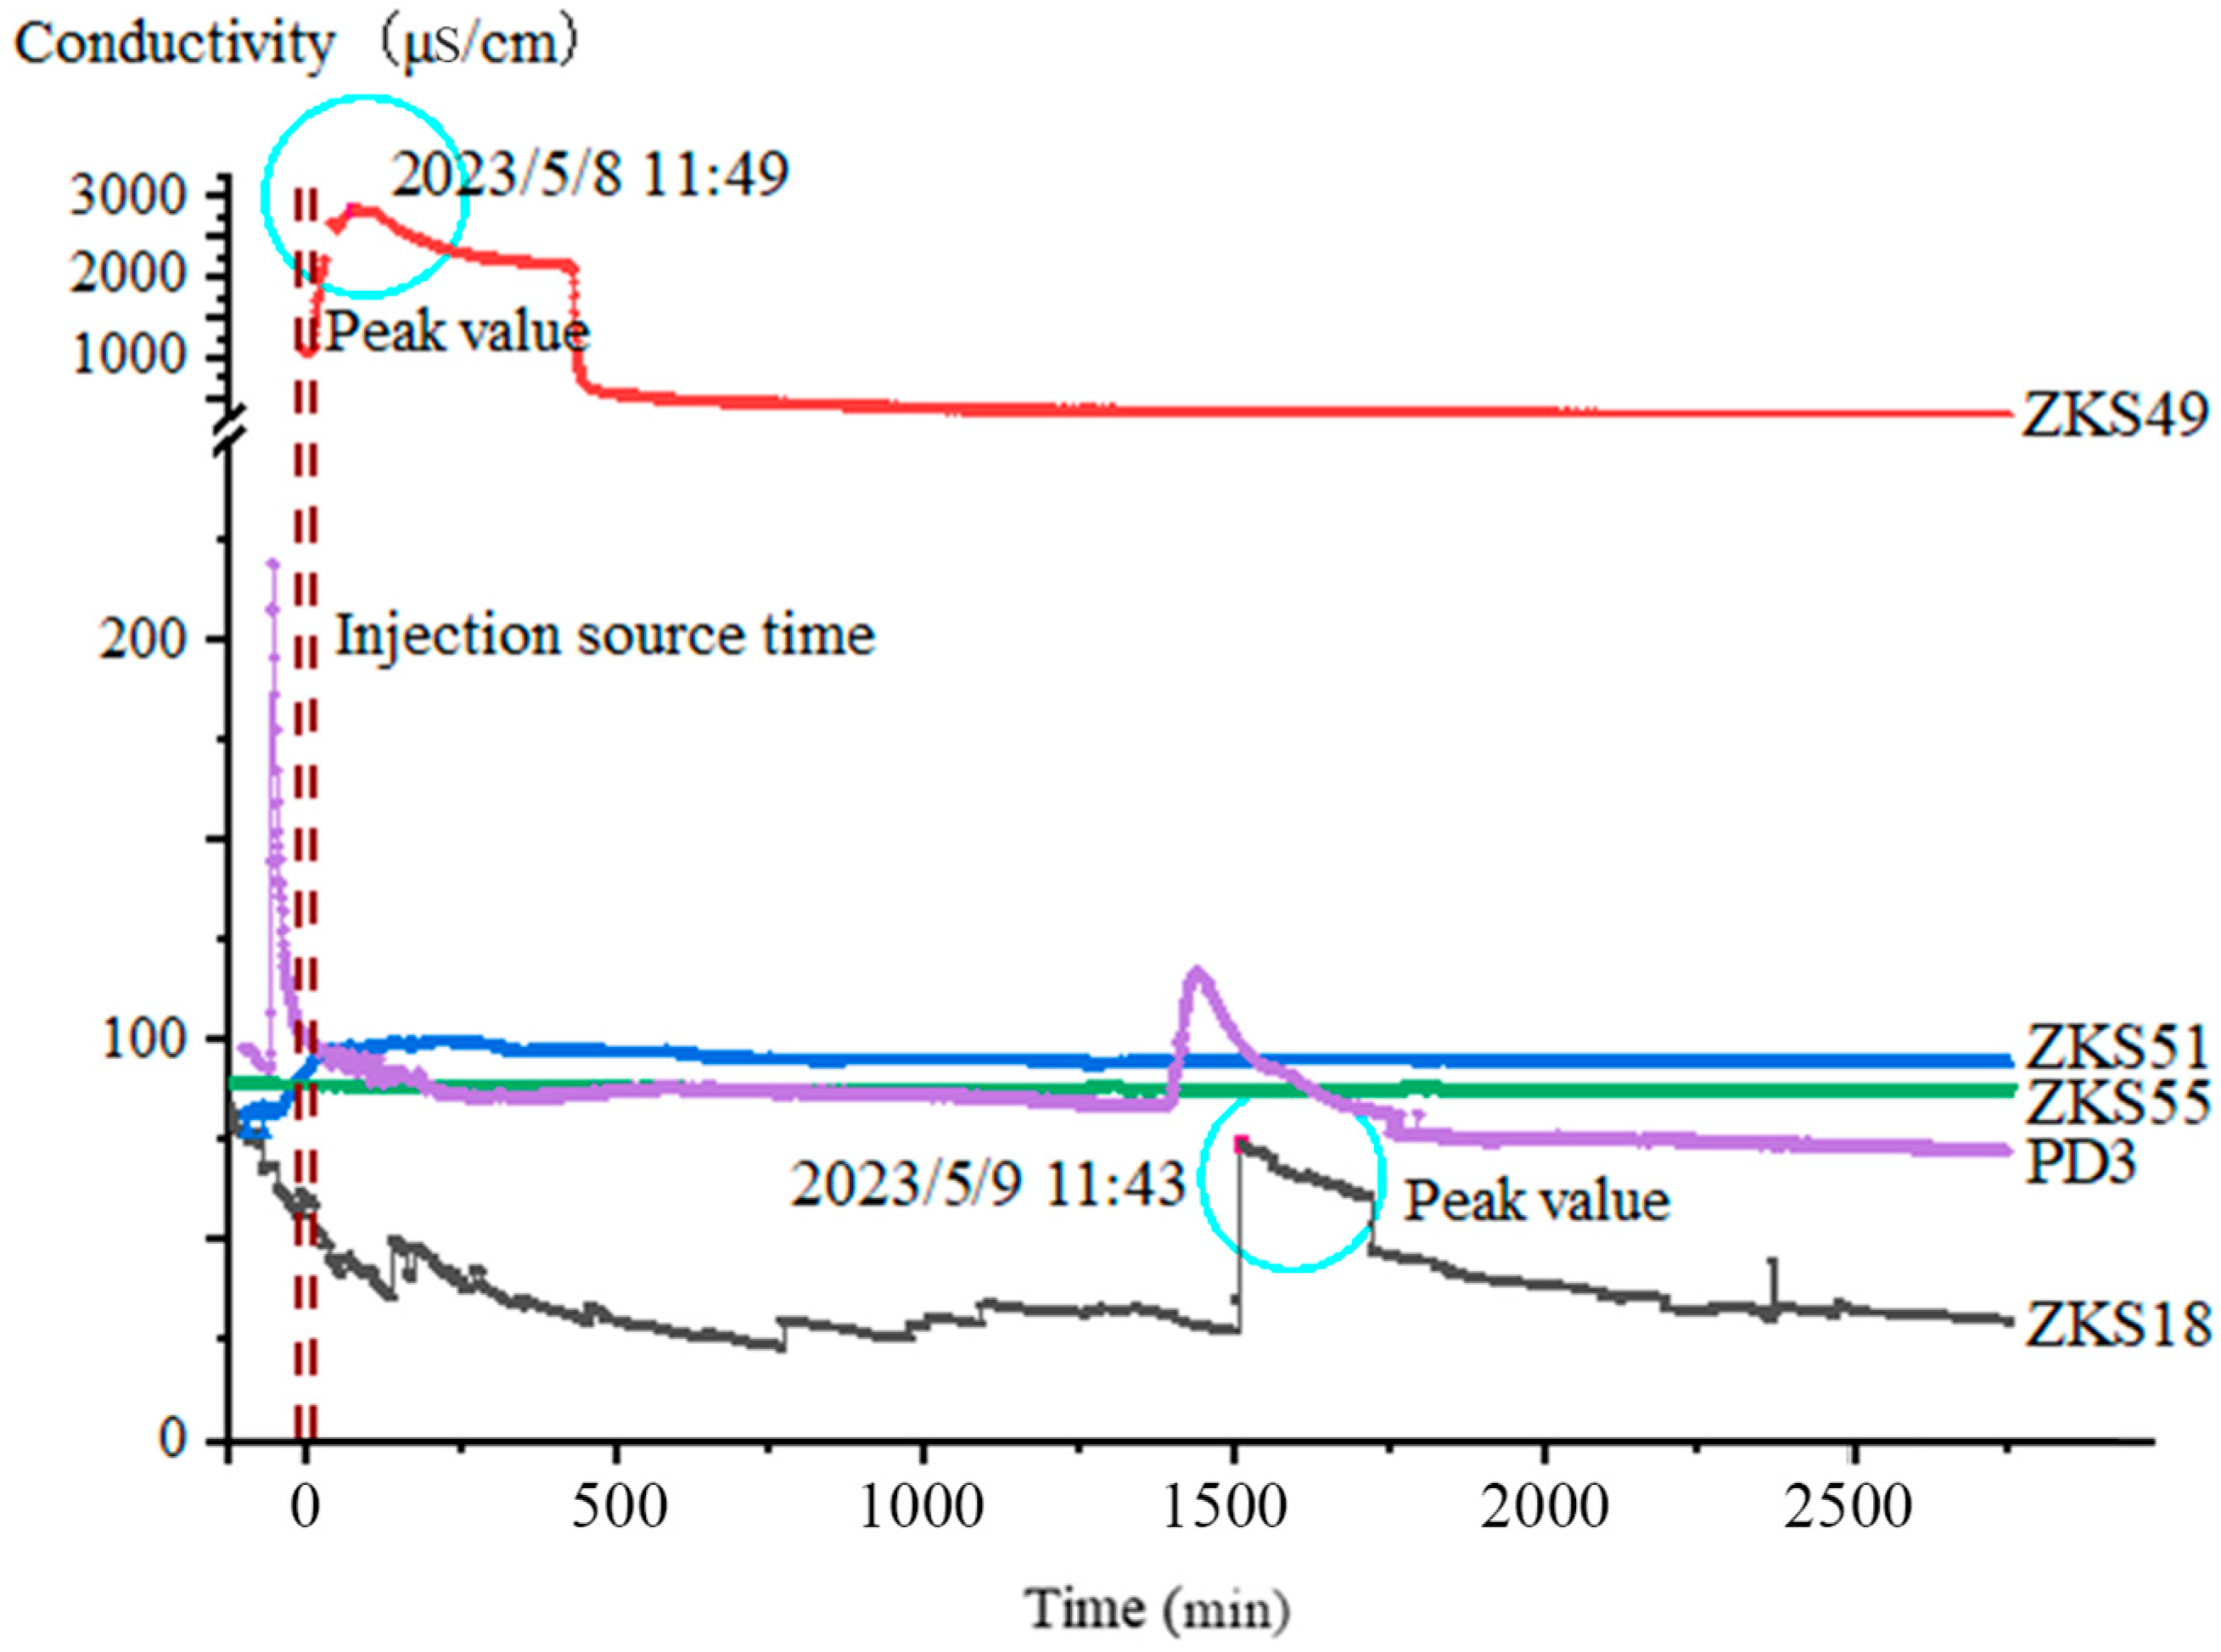
The tracer test was conducted from 10:19 on 8 May to 8:20 on 10 May 2023 with the injection source point of ZKS50 and the elevation of 658 m. There were five reception points, namely ZKS18, ZKS49, ZKS51, ZKS55, and PD3 (
Figure 4). The results of the conductivity changes over time at the five monitoring points are shown in
Figure 7.
It can be seen from
Figure 7 that the conductivity of ZKS18 fluctuates irregularly after the tracer was injected. After 25.3 h, the conductivity begins to show a clear breakthrough curve with a total of one obvious peak during the entire test period. The conductivity results showed that from 10:19 to 10:40 on 8 May, the tracer began to be received at ZKS18 at 11:35 on 9 May, and it reached a peak of 73.6 μS/cm at 11:43; thereafter, the conductivity gradually decreased and remained stable, which indicates that a tracer from ZKS50 was received at ZKS18. The distance between ZKS18 and ZKS50 is approximately 447.16 m with a reception time of 1516 min, resulting in a groundwater flow rate of 0.295 m/min. The groundwater level difference between ZKS18 and ZKS50 is about 30.07 m, so the hydraulic gradient is 0.067 and the permeability coefficient is 4.386 m/min. The size of the leakage passage can be calculated as 0.333 mm based on Equation (4).
Due to the flow rate test conducted in ZKS49 on 8 May from 9 am to 11 am, during the tracer test, the initial conductivity value of ZKS49 was much higher than that of the other four reception points. When conducting a tracer test, the conductivity of ZKS49 slowly decreased. After 15 min, the conductivity value began to rapidly increase, reached its peak, and showed a clear breakthrough curve. On 8 May, after the tracer was injected at ZKS50, the tracer began to be received at ZKS49 at 10:34, and the conductivity reached a peak of 2829 μS/cm at 11:49. It can be inferred that a tracer from ZKS50 was received at ZKS49. The above analysis indicates that the direction of groundwater flow is from ZKS50 to ZKS18 and ZKS49, which implies that there is a hydraulic connection between the groundwater on the left bank of the reservoir and the groundwater in Yisonggou and Tongluoping Gullies.
The conductivities of ZKS51 and ZKS55 remained basically unchanged during the entire test, which indicates that no tracer was received. The conductivity of PD3 rapidly increased to its peak after 24.3 h, and then rapidly decreased, which shows a clear breakthrough curve. However, according to on-site shooting records and analysis of temperature changes at PD3 monitoring points, PD3 fired around 9 a.m. on 9 May, which was consistent with the time of peak occurrence. At the same time, as the peak appeared, the water temperature at PD3 also increased. Therefore, it is inferred that the breakthrough curve of PD3 in this test may have been formed by the influence of firing.
Based on the above analysis, the groundwater in the upper reservoir is mainly discharged from the mountains on both banks to the bottom of the gullies. The groundwater on the left bank is mainly discharged towards the Tongluoping Gully, while the groundwater on the right bank is mainly discharged towards the Daijiaoling Gully, and finally converges and discharges towards the Yisong Gully. The mechanism of recharge and discharge near Tongluoping Fully is that rainfall infiltrates into the cover layer and bedrock, and forms a quantity of upper stagnant water in the cover layer. Some of the water in the cover layer recharges groundwater, while other water is directly discharged or exposed as spring water to recharge surface water. The water in the bedrock mainly recharges groundwater. Based on the groundwater levels of ZKS49, it can be seen that the water level at the bottom of Tongluoping Gully is significantly lower than that of the gully, and there is a ‘disconnection’ phenomenon between the gully water and groundwater. Therefore, the relationship between surface water and groundwater at the bottom of Tongluoping Gully is that surface water recharges groundwater. The relationship near Yisong Gully is that rainfall infiltrates into the cover layer and bedrock, and forms upper stagnant water in the cover layer. Part of the water in the cover layer recharges groundwater, while the other water directly recharges surface water. Due to the exposure of three layers of soluble rock formations at the dam foundation, and considering the relatively low permeability of the fully weathered interlayer QJ2, which serves as a relatively impermeable layer, there are at least two confined aquifers in the Yisong Gully dam site area. These mainly receive recharge from rainfall and groundwater from the mountains on both banks, and discharge into the groundwater and surface water.
4.4. Determination of Groundwater Flow Rate and Direction
Single-hole tracer tests were conducted on boreholes ZKS49, ZKS50, ZKS52, and ZKS55 (
Figure 4). Three different depths were determined for each test hole, and a total of 12 sets of tests were conducted. The calculation results are shown in
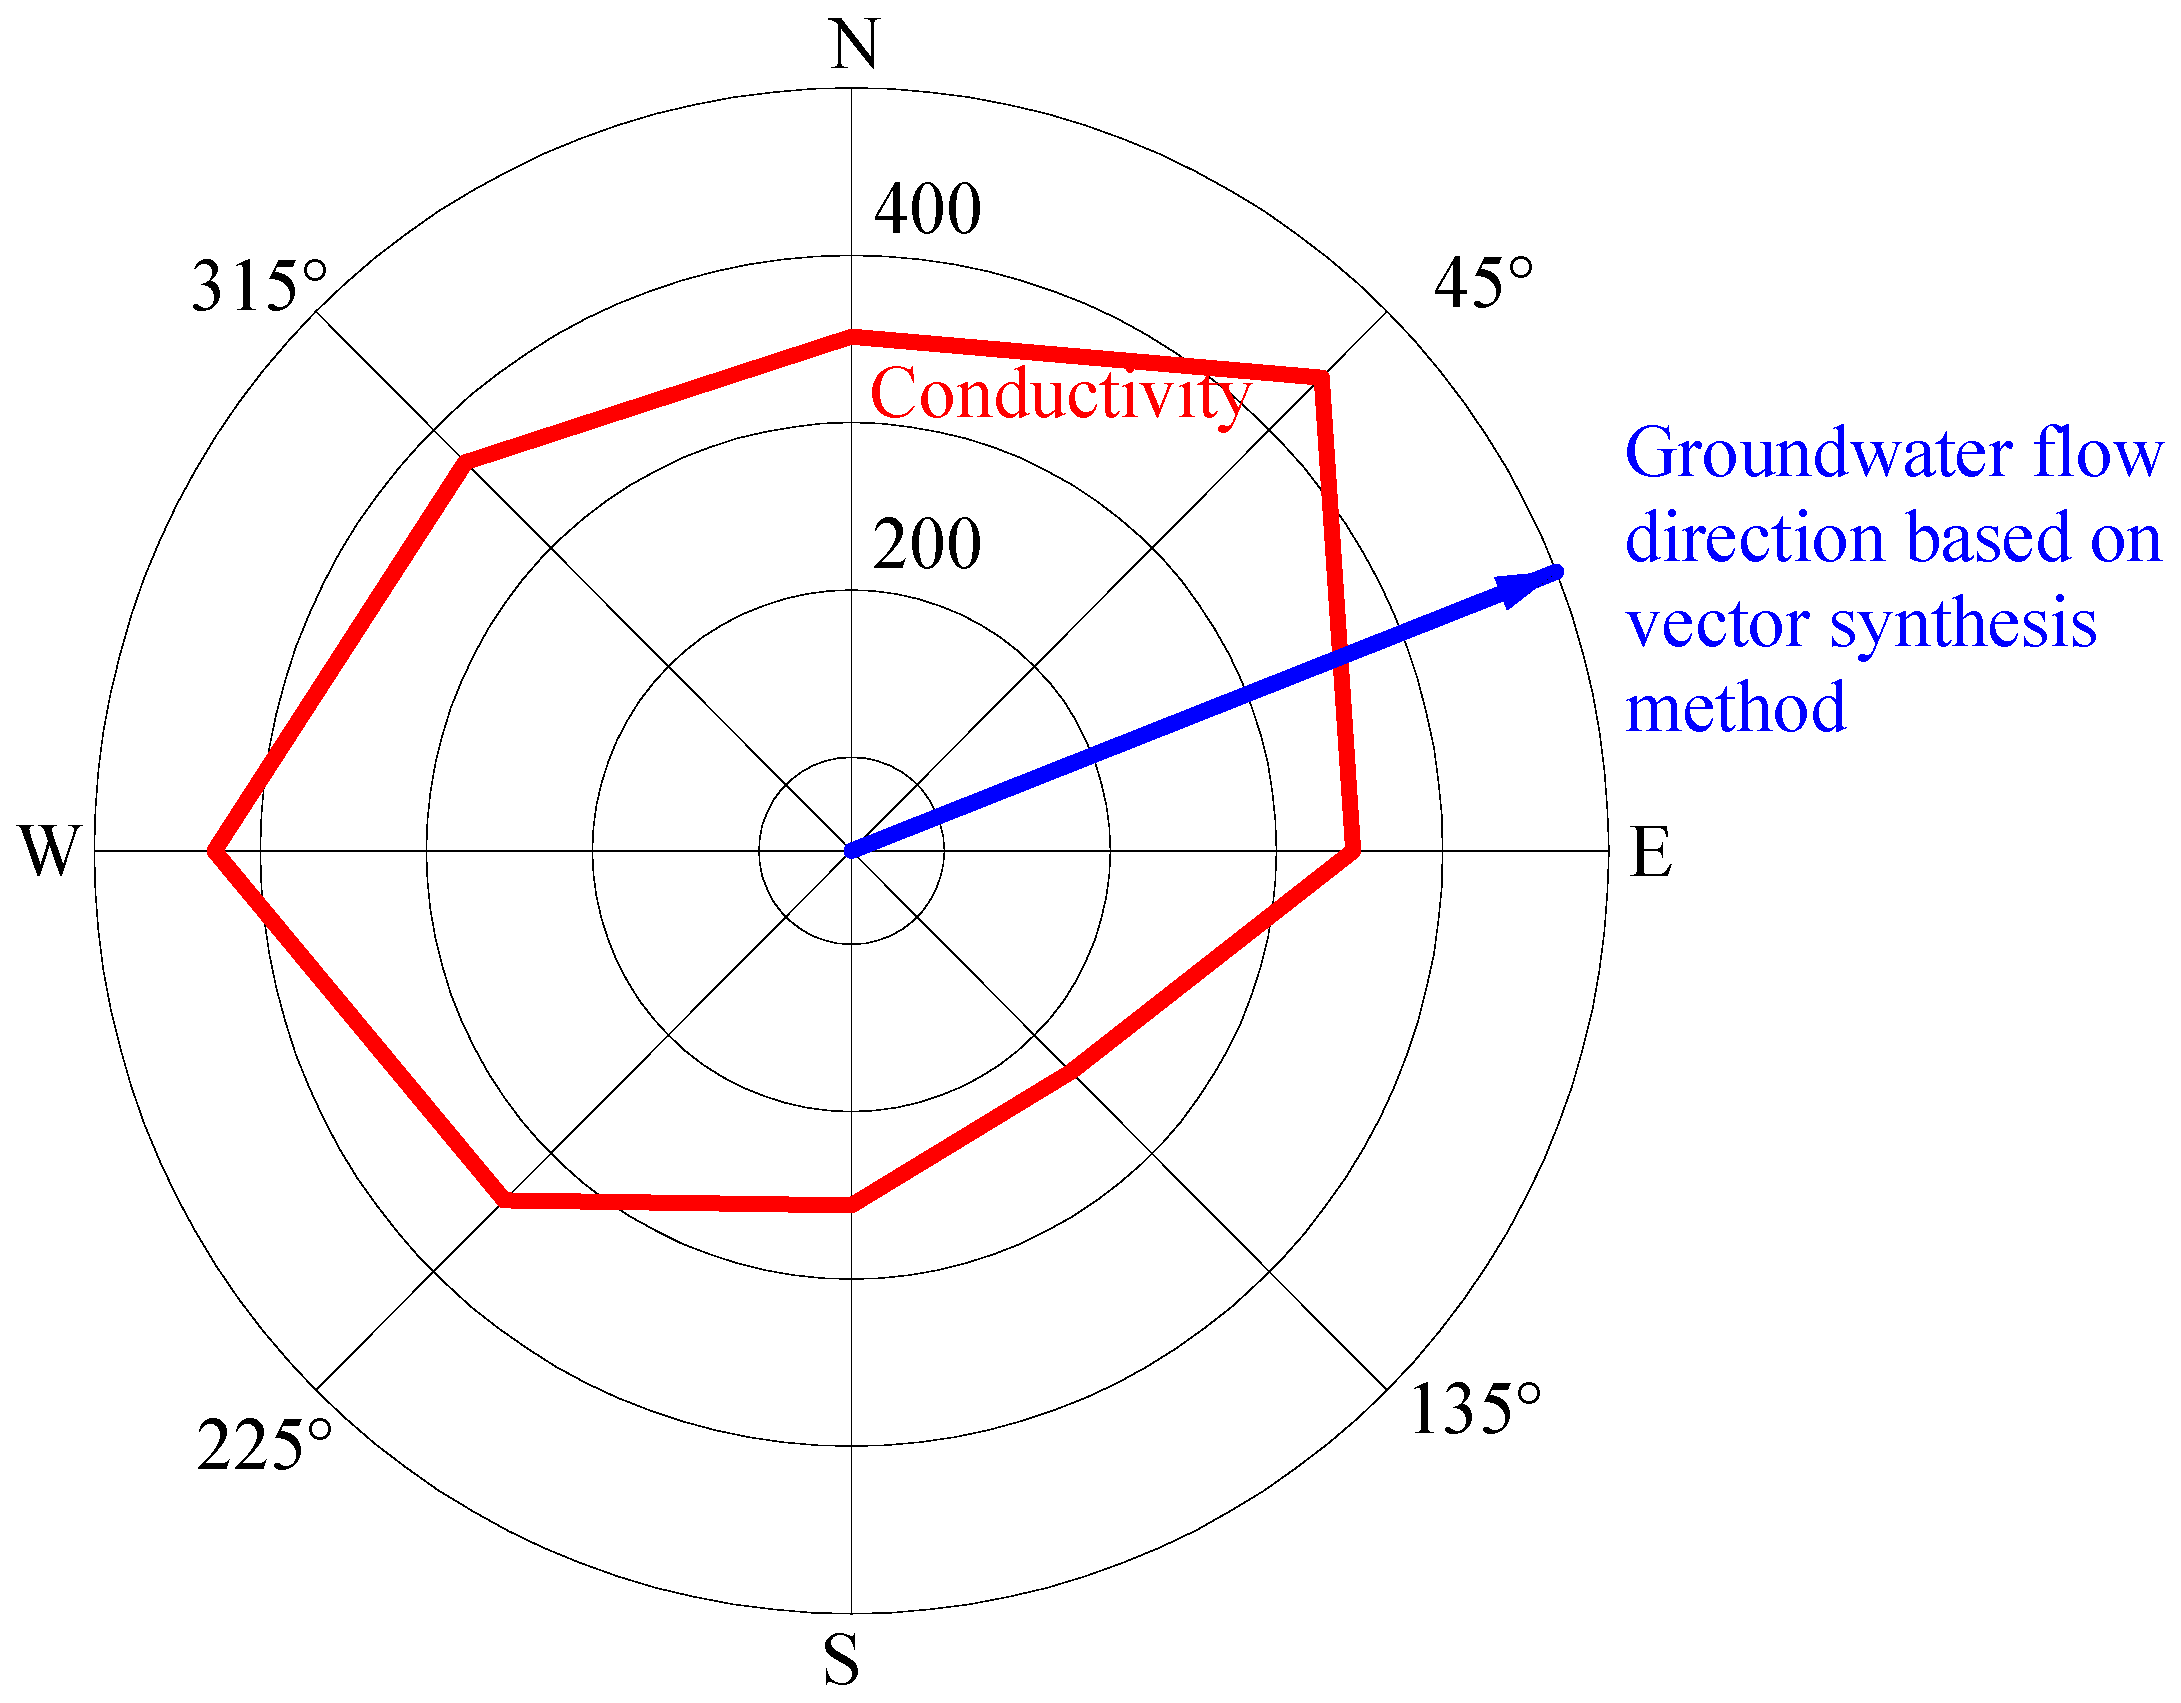
Table 2. It can be seen from
Table 2 that as the depth increases, the groundwater flow rate increases. Among them, borehole ZKS49 has a significant difference in the direction of groundwater flow at different depths, while the other boreholes have little difference in the direction of groundwater flow at different depths. This may be due to the presence of fractures or faults in the test sections, which causes the local groundwater flow direction to be inconsistent with the overall groundwater flow direction. The groundwater flow rate and direction calculated by the vector synthesis method are basically consistent with that using the three-hole method, which indicates that the vector synthesis method in the single hole can be used for determining the flow rate and direction of groundwater flow.


