1. Introduction
Throughout the past century, the Earth’s climate system has undergone significant regional and global changes, with ongoing shifts anticipated in response to escalating concentrations of greenhouse gases. The rise in average annual air temperature precipitates alterations in precipitation patterns, moisture distribution within regions, and the hydrological dynamics of water bodies. These climatic shifts exert pronounced effects on the properties of snow cover and glaciers, with observable reductions in their mass worldwide [
1].
The diminishment of glacial masses, while potentially augmenting river flows in the short term, presents long-term challenges for water supply and management. It is increasingly imperative to comprehend evolving climate patterns and their repercussions on glacial and snow runoff components for accurate water-resource forecasting and management. Incorporating considerations of non-stationarity and inhomogeneity in statistical series characterizing river runoff indicators is indispensable for devising effective adaptation strategies to ensure the sustainable utilization of the country’s water resources.
Situated at a considerable distance from the ocean and positioned centrally within the Eurasian continent, Kazakhstan is experiencing accelerated warming compared to the global average. During the period 1976–2022, the average annual air temperature in Kazakhstan increased at a rate of 0.32 °C every 10 years, surpassing the global average of 0.18 °C every 10 years [
2,
3]. These pronounced alterations in climatic conditions have led to substantial modifications in the water regime of surface runoff in Kazakhstan’s rivers [
4,
5,
6].
In contemporary water-resource assessment, the traditional approach, which relies on the assumption of stationarity or quasi-stationarity of hydrological processes, is no longer tenable [
7]. Neglecting potential violations of the homogeneity of analyzed hydrological series may result in erroneous and suboptimal decisions. The formal utilization of analytical distribution curves, without accounting for this factor, can lead to both overestimation and underestimation of calculated river-flow characteristics [
8]. Consequently, adaptation measures to climate change are indispensable when addressing practical hydrological challenges.
The results presented in this investigation align with those of previous studies examining the distribution of minimum flow and its dependency on glaciers in the Buktyrma River. These studies also offer a long-term forecast, projecting an increase in flow over the next 30–40 years [
9].
The contemporary intra-annual distribution of water flow in the Buktyrma River basin was analyzed by [
10], considering the meteorological characteristics of the runoff formation zone where the impacts of global climate change are evident. This research represents a significant scientific and practical endeavor within the realm of environmental management, aimed at optimizing organizational activities for economically efficient and environmentally sustainable water utilization across various sectors of the regional economy. Furthermore, investigations into changes in the timing of flood-wave occurrences, as a consequence of climate warming in the Buktyrma River, have been conducted [
11]. Recent decades have witnessed an increase in the maximum flow of the Buktyrma River, accompanied by a shift in the timing of peak water flows. These alterations are likely attributable to the influence of climate change on river dynamics.
The present study delves into the impact of changing climatic variables, such as air temperature and precipitation, on the water resources of the Buktyrma River and its tributaries. These rivers primarily derive their flow from snow cover and glaciers in the ridges of the western slope of Altai. Their hydrological regime is deemed conditionally natural, owing to minimal anthropogenic water consumption and management practices.
2. Materials and Methods
2.1. Description of Study Area
The Buktyrma River originates from a small moraine lake located on the slopes of Ontustik Altai. It is a fully flowing watercourse, deriving its waters from both glaciers and snow. The main reason for selecting the Buktyrma River as a research subject was the accessibility of instrumental observation data pertaining to crucial parameters, such as water flow, air temperature, and precipitation. Furthermore, the Buktyrma River basin experiences minimal influence from anthropogenic activities, thus ensuring the integrity of runoff dynamics. The primary rationale behind the choice of this river lies in the glaciers within its basin serving as robust indicators of regional climate change. Additionally, the upper reaches of the river exhibit notable sensitivity to glacier melt, amplifying its significance for research purposes.
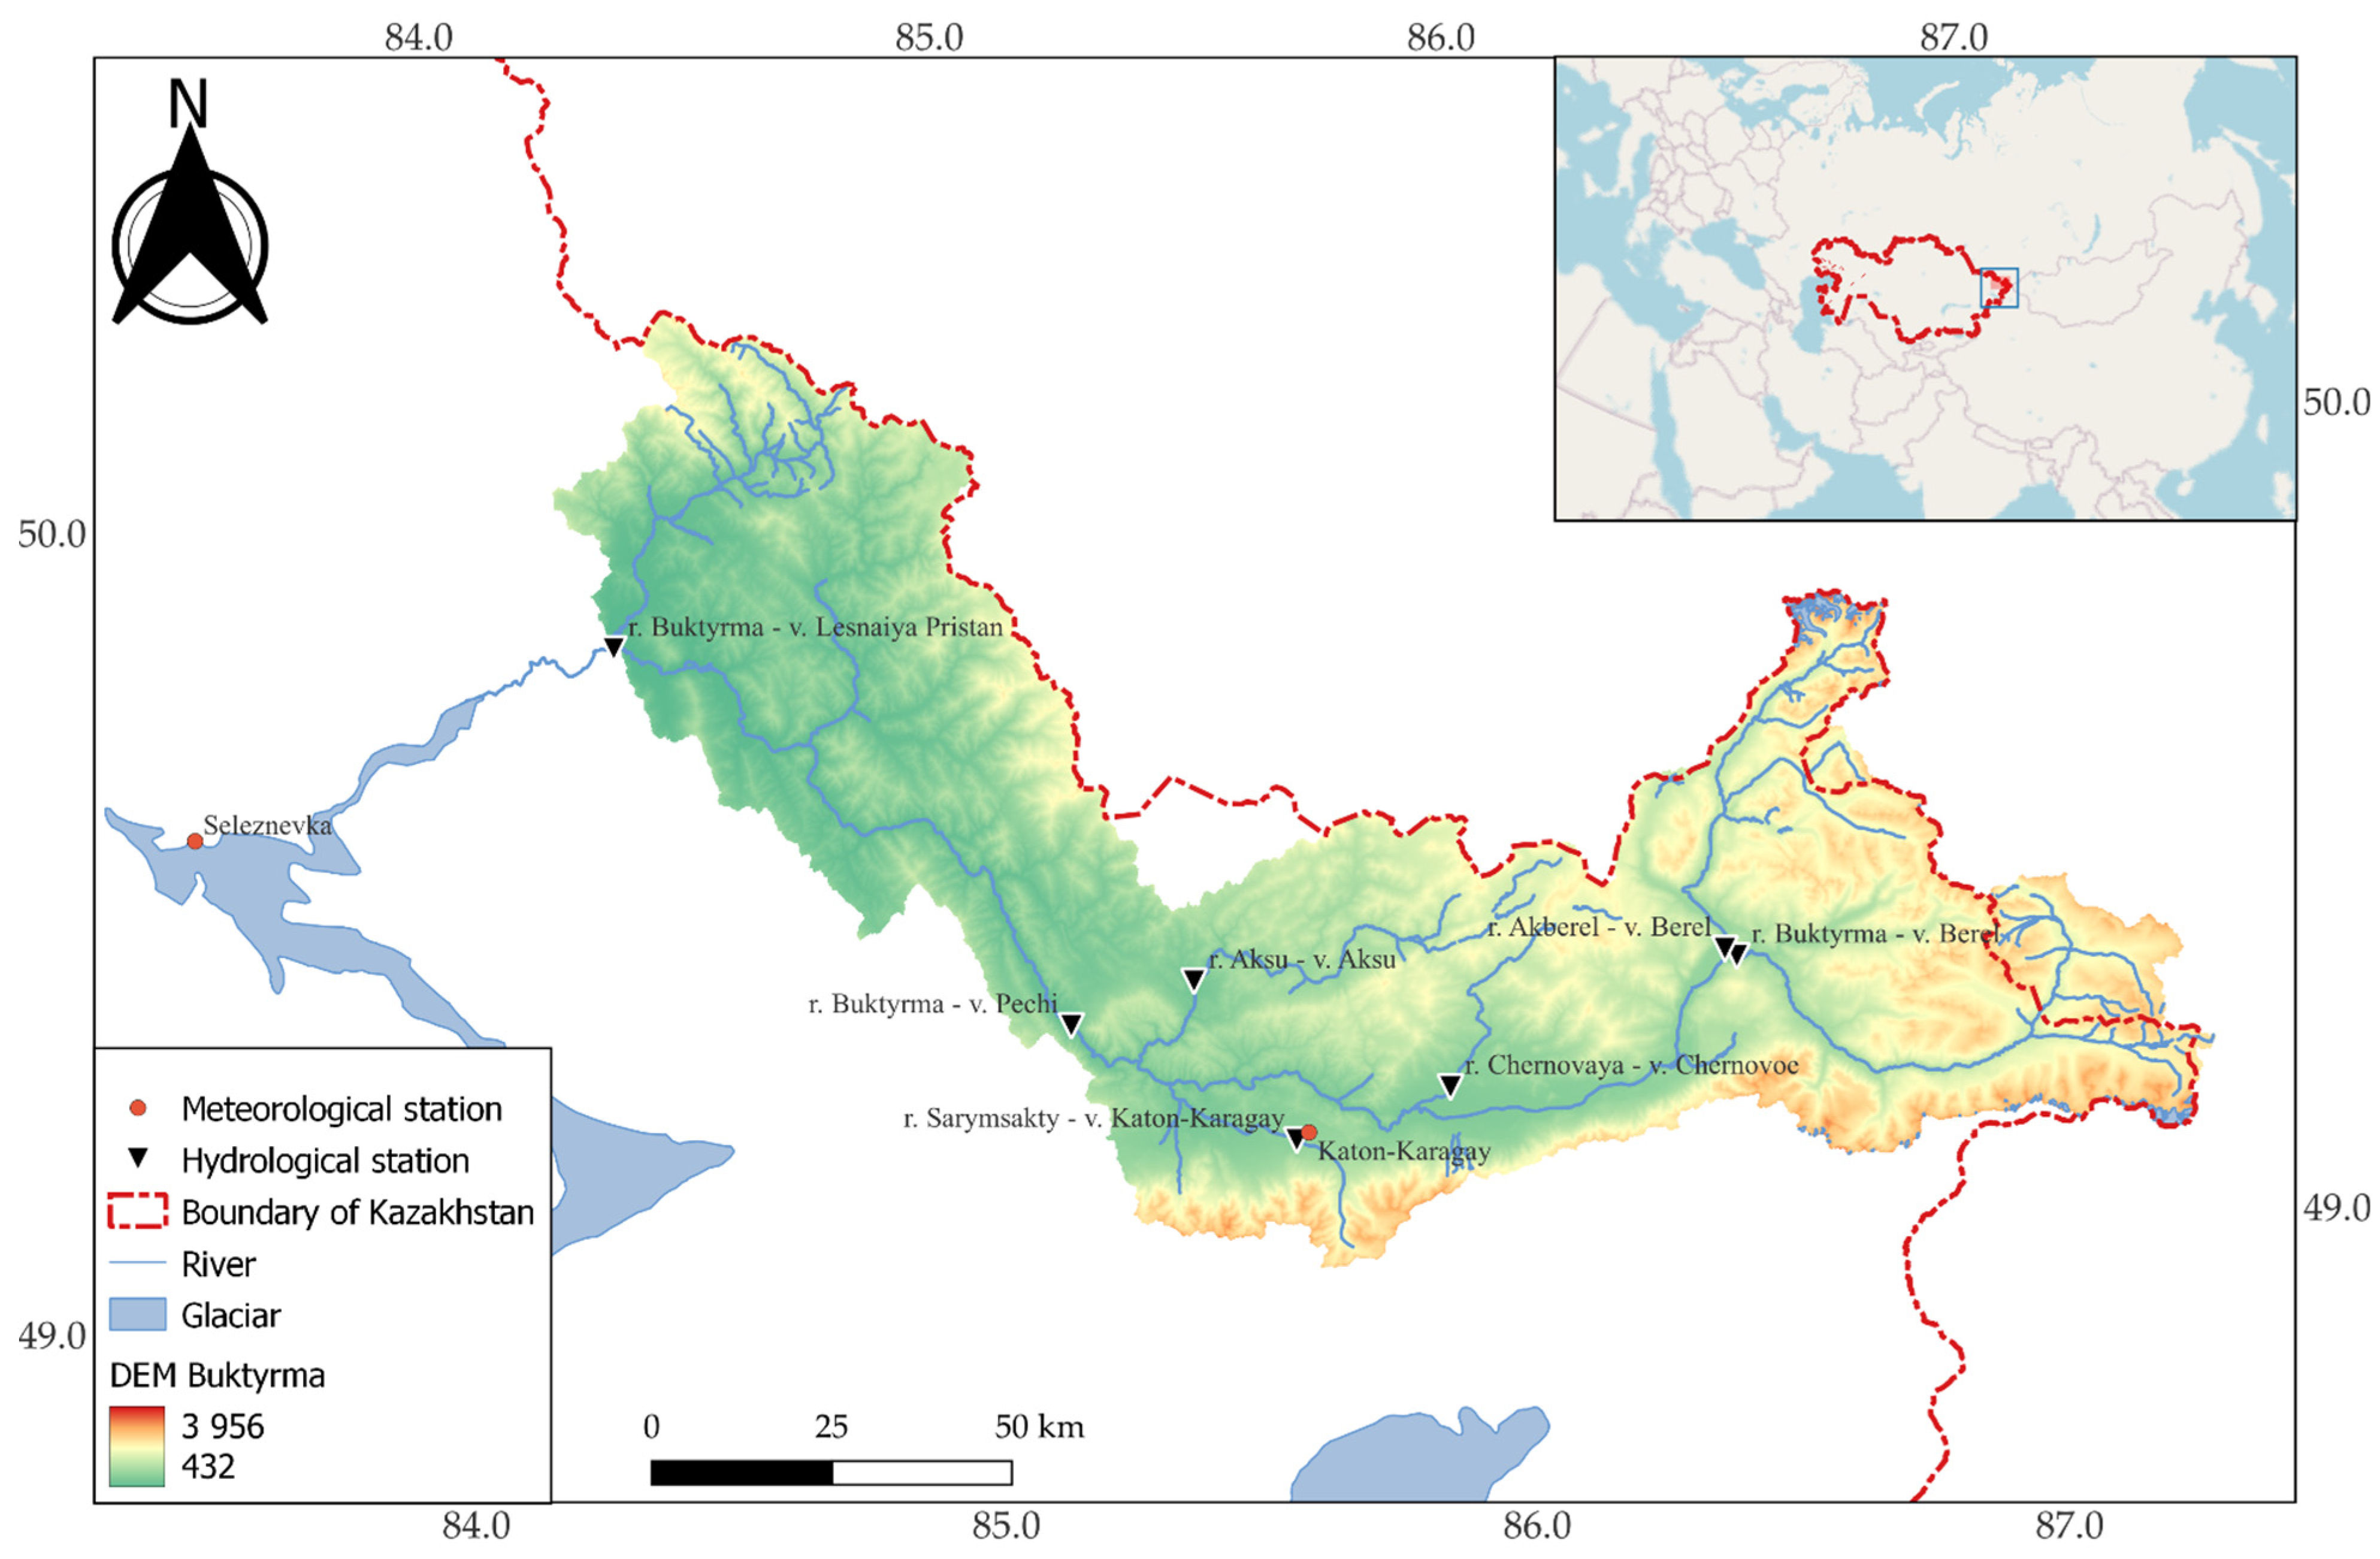
Figure 1 shows the location of river catchments, indicating locations of flow monitoring and meteorological characteristics. Before reaching the Buktyrma Reservoir, it is fed by several tributaries, including Ak Berel, Chernovaya, Sarymsakty, Belaya, Cheremoshka, Khamir, and Berezovka, as outlined in
Table 1.
The Buktyrma River exhibits a rapid flow and experiences its peak abundance during the spring–summer period, spanning from April to July. It falls into the category of rivers characterized by spring–summer floods, predominantly fueled by a combination of snowmelt and rainfall, supplemented by glacial inputs.
The Buktyrma River basin displays elongated and multi-staged characteristics, extending for 75–80 days. The duration of the warm and low-water period of the Buktyrma River varies from 60–80 to 50–40 days, contingent upon the average elevations of the catchment area. Similarly, the duration of the winter low-water period of the Buktyrma River is influenced by altitude positioning, with minimum flows typically observed during February–March [
12].
2.2. Datasets
The primary source of historical data on glaciers in the upper reaches of the Buktyrma River is the comprehensive Catalog of Glaciers of Kazakhstan, which provides detailed descriptions of glacier characteristics [
13].
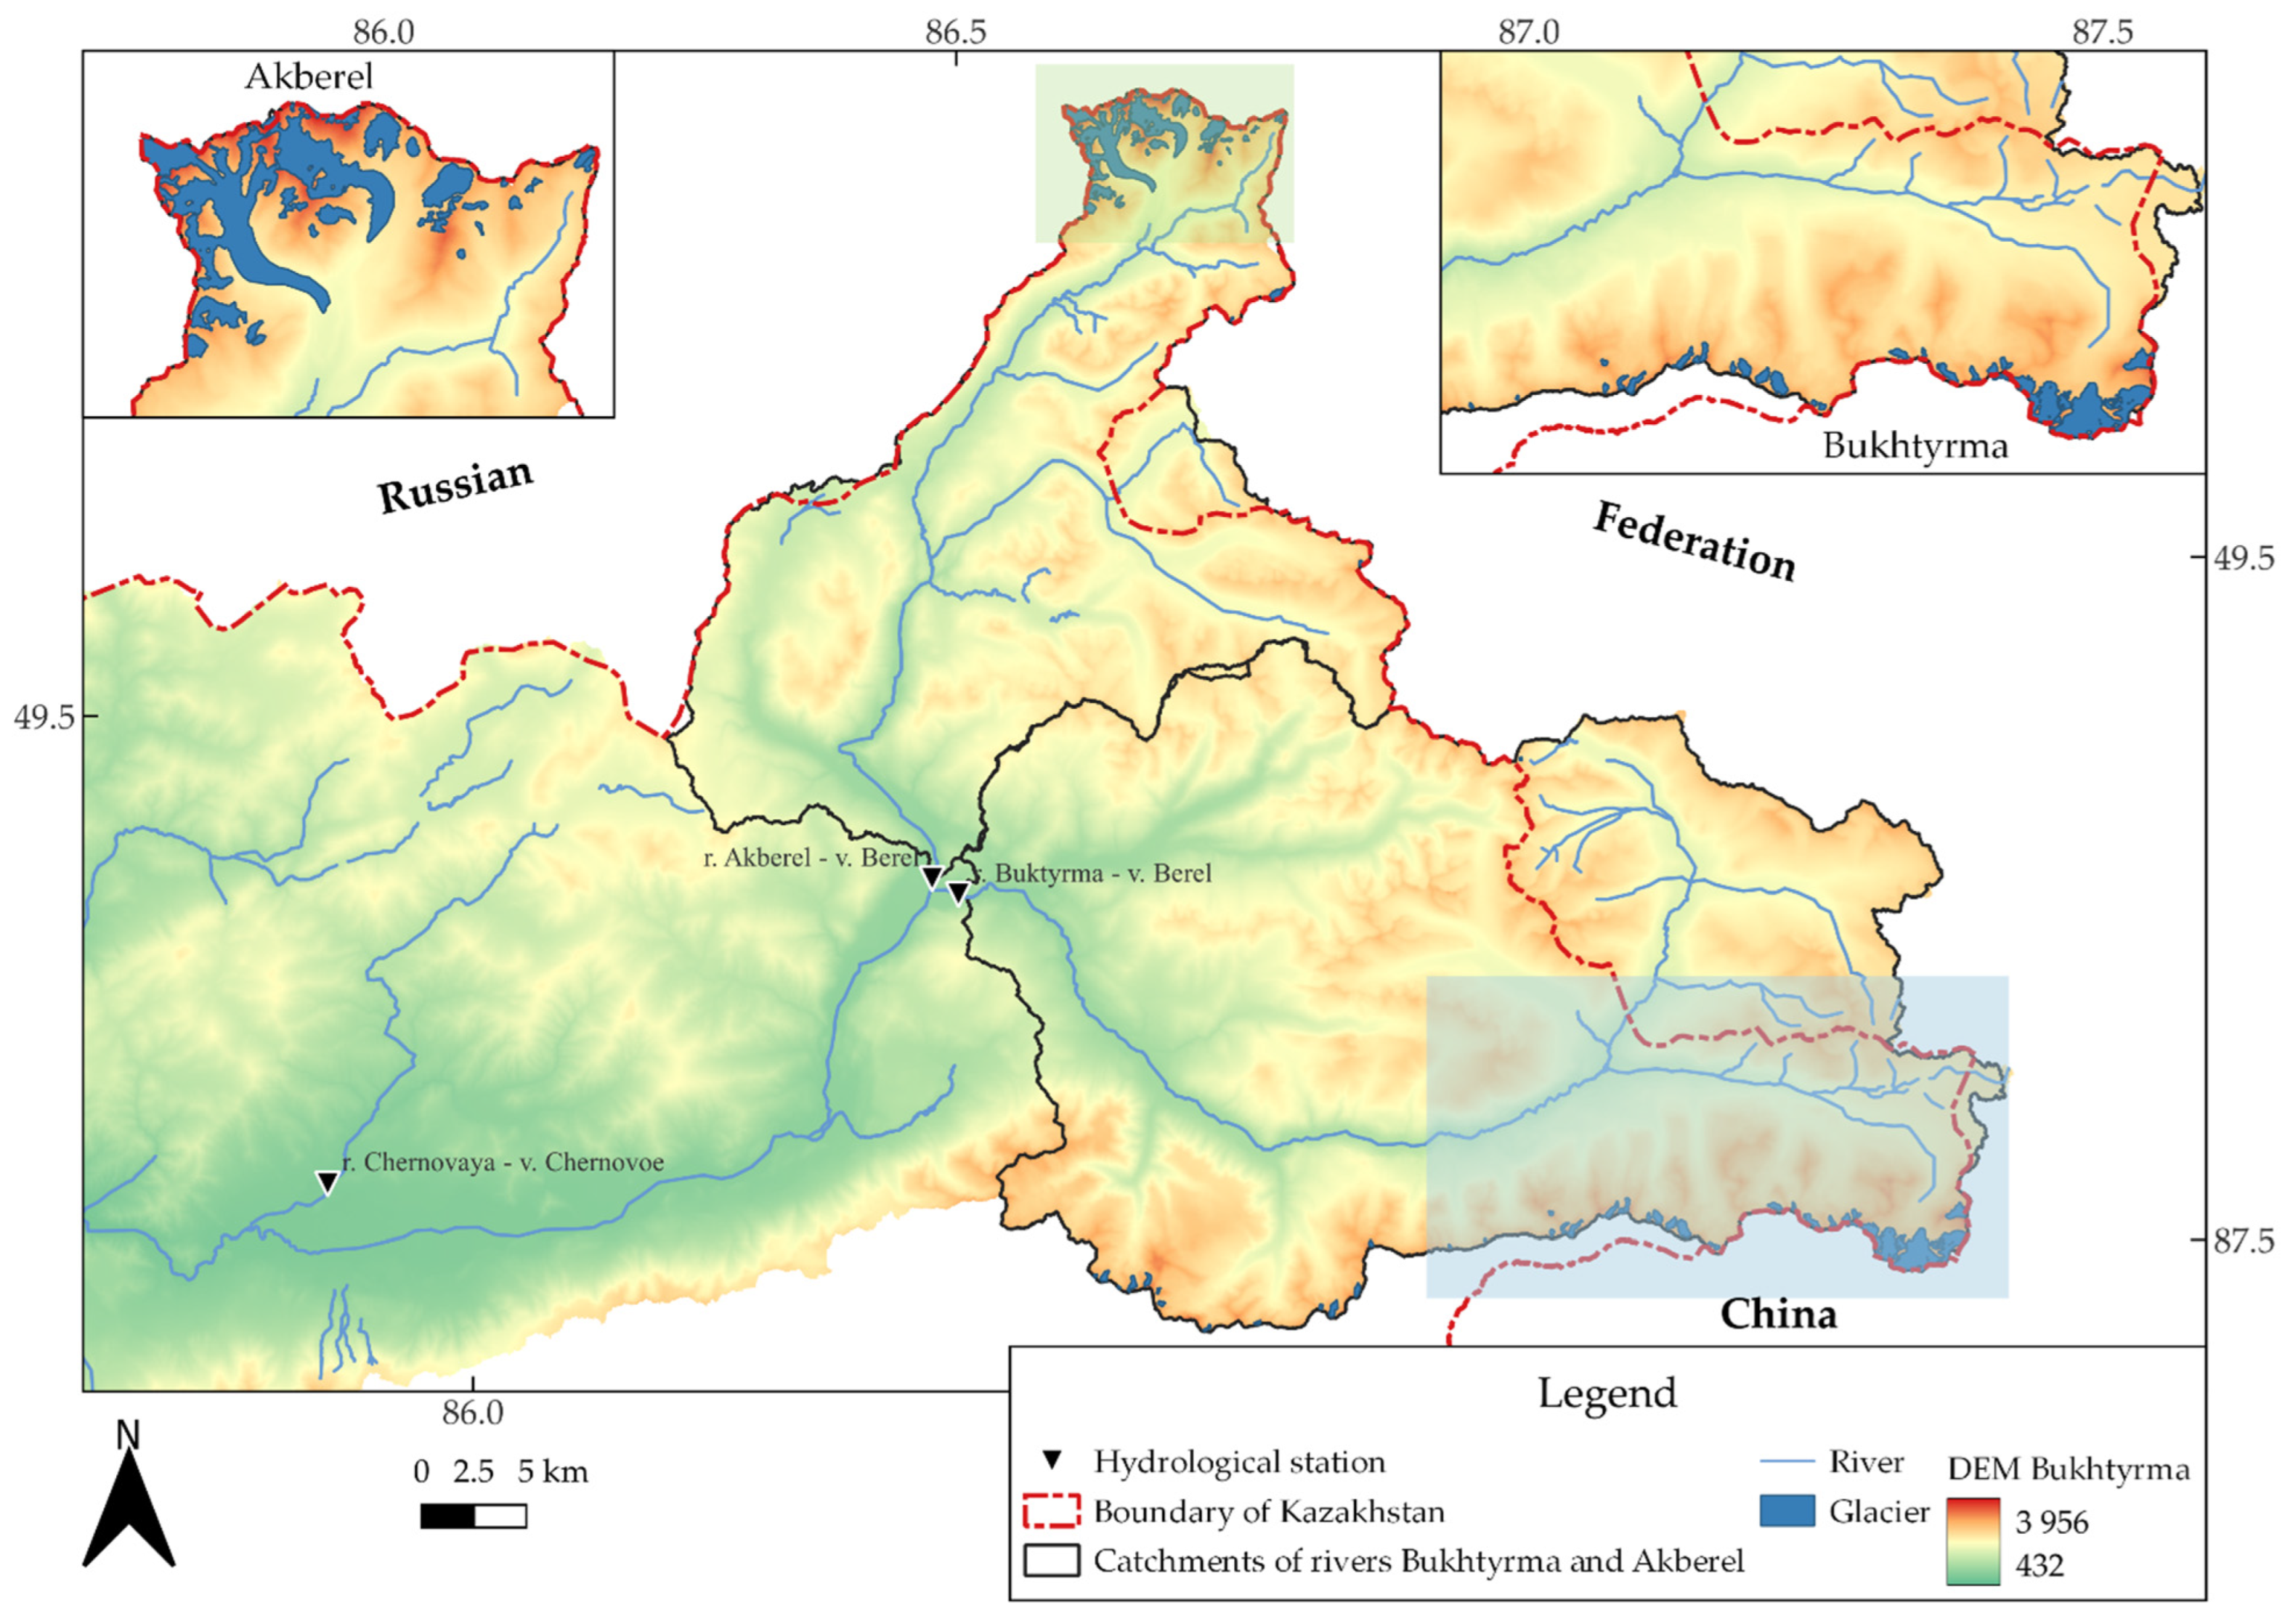
Current information on the state of glaciation in the area is derived from GLIMS (Global Land Ice Measurements from Space) [
14]. GLIMS utilizes data from the LANDSAT satellite system, which has been operational for over 40 years [
15], along with contributions from numerous glaciological institutions worldwide, ensuring ongoing updates. GLIMS data for the Buktyrma River basin were released in 2015. The geographical distribution of glaciers in the basin, as per GLIMS data, is illustrated in
Figure 2.
Climatic data regarding air temperature and precipitation were analyzed using records from the Katon-Karagay and Seleznevka meteorological stations, both part of the State Climate Cadastre. The Katon-Karagay meteorological station, situated at an elevation of 1067 m above sea level in the middle of the river, has been conducting observations since 1932. Conversely, the Seleznevka meteorological station is positioned in the lower section of the basin, adjacent to the Buktyrma reservoir. Observations at this station have been ongoing since 1967 and continue to the present day, as documented in
Table 2.
Data on the average annual water flows from various gauging stations were utilized, including Akberel–Berel, Chernovaya–Chernovaya, Sarymsakty–Sogornoye, Aksu–Aksu, Buktyrma–Berel, Buktyrma–Barlyk (Pechi), and Buktyrma–Lesnaya Pristan [
16,
17,
18,
19]. Instrumental observations of runoff in the river basin commenced in 1926 at the Buktyrma River station, specifically at Lesnaya Pristan, and have continued to the present day under the auspices of the hydrometeorological service of the Republic of Kazakhstan. However, observations experienced interruptions and cessations due to various issues during the period 1992–2005. Currently, efforts are underway to resume flow monitoring processes for these rivers. General information regarding the data is provided in
Table 3.
2.3. Methods
Changes in climate characteristics, such as average annual air temperature and precipitation, over long-term periods, were assessed by linear trend coefficients determined using the least squares method. A measure of the significance of the trend, the coefficient of determination (D), characterizes the contribution of the trend component to the total dispersion of the climate variable over the period of time under consideration (in percentage).
To restore gaps in the hydrological series of average annual runoff, the analogy method was used:
between rivers with high correlations;
by correlation dependencies between the flow of adjacent months of the river itself or analog rivers;
interpolation method in cases of missing observations for several days a year (reconstruction table in Excel version 16.83A).
Since observations on the Buktyrma River near the village of Berel commenced in 1958 and continue to the present, 1958 was selected as the starting point for the calculation period to ensure spatiotemporal analysis uniformity across all rivers in the basin.
A genetic analysis of the hydrological series was conducted utilizing difference and total integral curves (DIC and TIC) along with chronological graphs depicting long-term fluctuations [
20,
21]. Analyses for homogeneity and stationarity were performed employing Student’s and Fisher’s tests utilizing StokStat software version 1.2 [
22]. The Student’s
t-test and Fisher’s statistics for assessing the homogeneity of variances for two consecutive parts of the series were calculated.
Spatiotemporal characteristics of hydrological series, such as average long-term or normal runoff, coefficient of variation or runoff variability, and coefficient of asymmetry of annual runoff, were computed using a Pearson type-III distribution curve. Subsequently, the coordinates of a smoothed theoretical curve within the required availability limits were determined [
23]. Additionally, the method of calculating the distribution curve utilizing composite homogeneous populations for heterogeneous series was employed [
20]. Flow estimations were made using reduction coefficients (K). These coefficients represent the ratio of the flow of the river under study to the flow of the analogous river during parallel observation periods [
23]. Equations (1)–(3) show the expressions to compute the reduction coefficients.
where:
: reduction coefficients;
: the average flow value of the river under study for a parallel period of observation with the analog river;
: average flow value of the analog river for a parallel period of observation with the river under study;
: reduction coefficients for the period 1958–1980;
average flow value of the analog river for 1958–1980;
: reduction coefficients for the period 1981–2021;
: average flow value of the analog river for 1981–2021.
The distribution curve for composite homogeneous populations was calculated using Equation (4) [
20]:
where n
1 and n
2 are the number of members in each of two homogeneous populations, and P
1 and P
2 are the probabilities taken from the corresponding theoretical curves.
3. Results
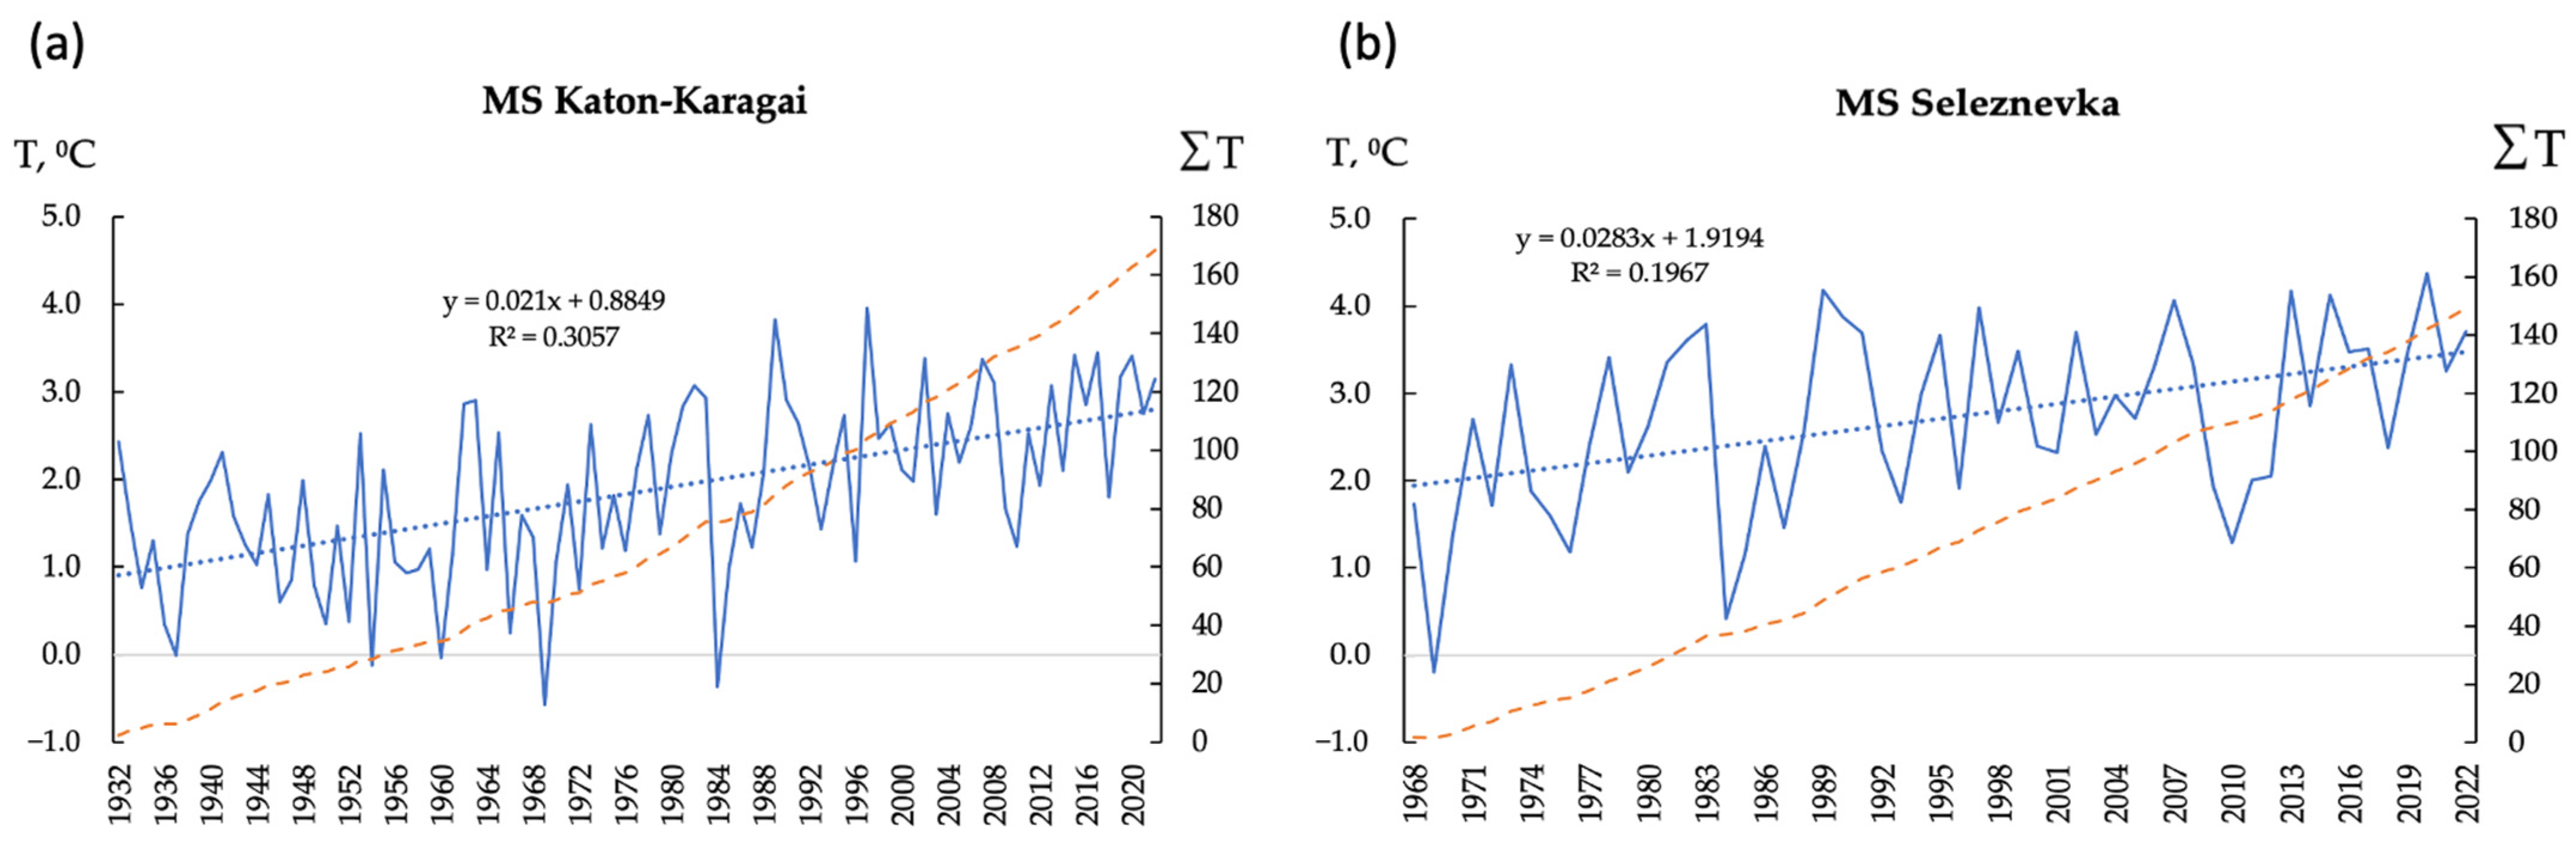
Changes in average annual air temperature and annual precipitation within the considered basin were assessed at two meteorological stations: MS Katon-Karagay MS and MS Seleznevka. Graphs illustrating the total integral curves of average annual air temperatures reveal a noticeable upward trend, particularly prominent since the early 1980s (
Figure 3).
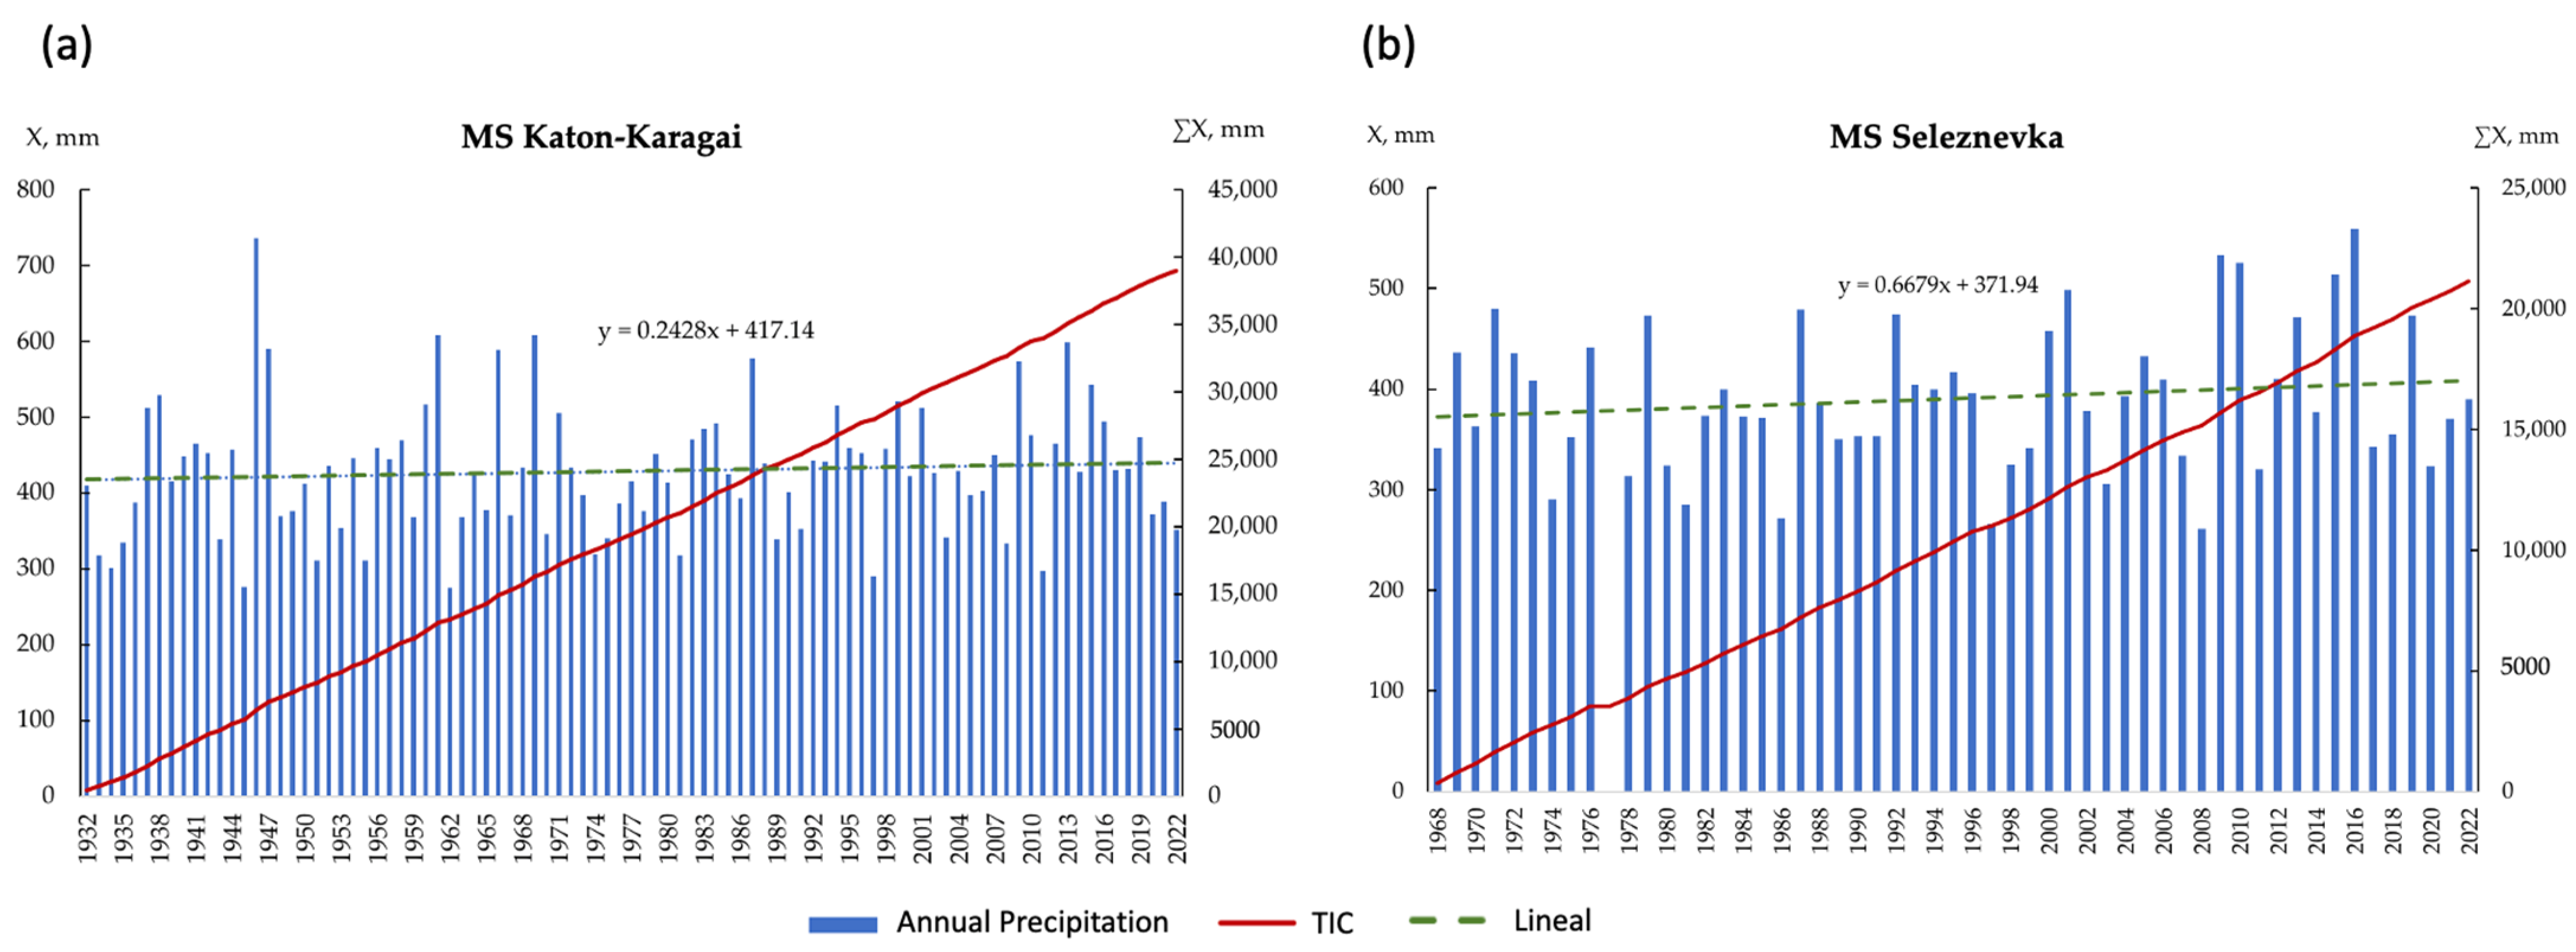
The total integral curves of annual precipitation for the same two meteorological stations also indicate, albeit to a slight extent, an increase in precipitation since the early 1980s (
Figure 4). Since 1981, the long-term average annual precipitation at the Katon-Karagay meteorological station has risen by 14 mm, while at the Seleznevka weather station, it has increased by 4 mm compared to the preceding period up to 1980.
Table 4 presents changes in the characteristics of glaciers situated in the central part of the Katun ridge and on the northern slope of the Southern Altai, within the upper reaches of the river basin, specifically the Buktyrma village near Berel and its right tributary Akberel. These changes are documented for the periods prior to 1969 and up to 2015, during which there has been an almost twofold reduction in their areas due to the intense melting attributed to rising temperatures. Furthermore, in the upper reaches of the Sarymsakta tributary, complete disappearance of glaciation has been observed.
Genetic and statistical analyses of the homogeneity of the hydrological series of average annual runoff were conducted solely at three sections of the Buktyrma River: near the village of Berel, the village of Pechi, and the village of Lesnaya Pristan, as well as along the Aksu tributary, which is currently operational.
The genetic analysis utilized chronological graphs depicting long-term fluctuations and total-integral curves.
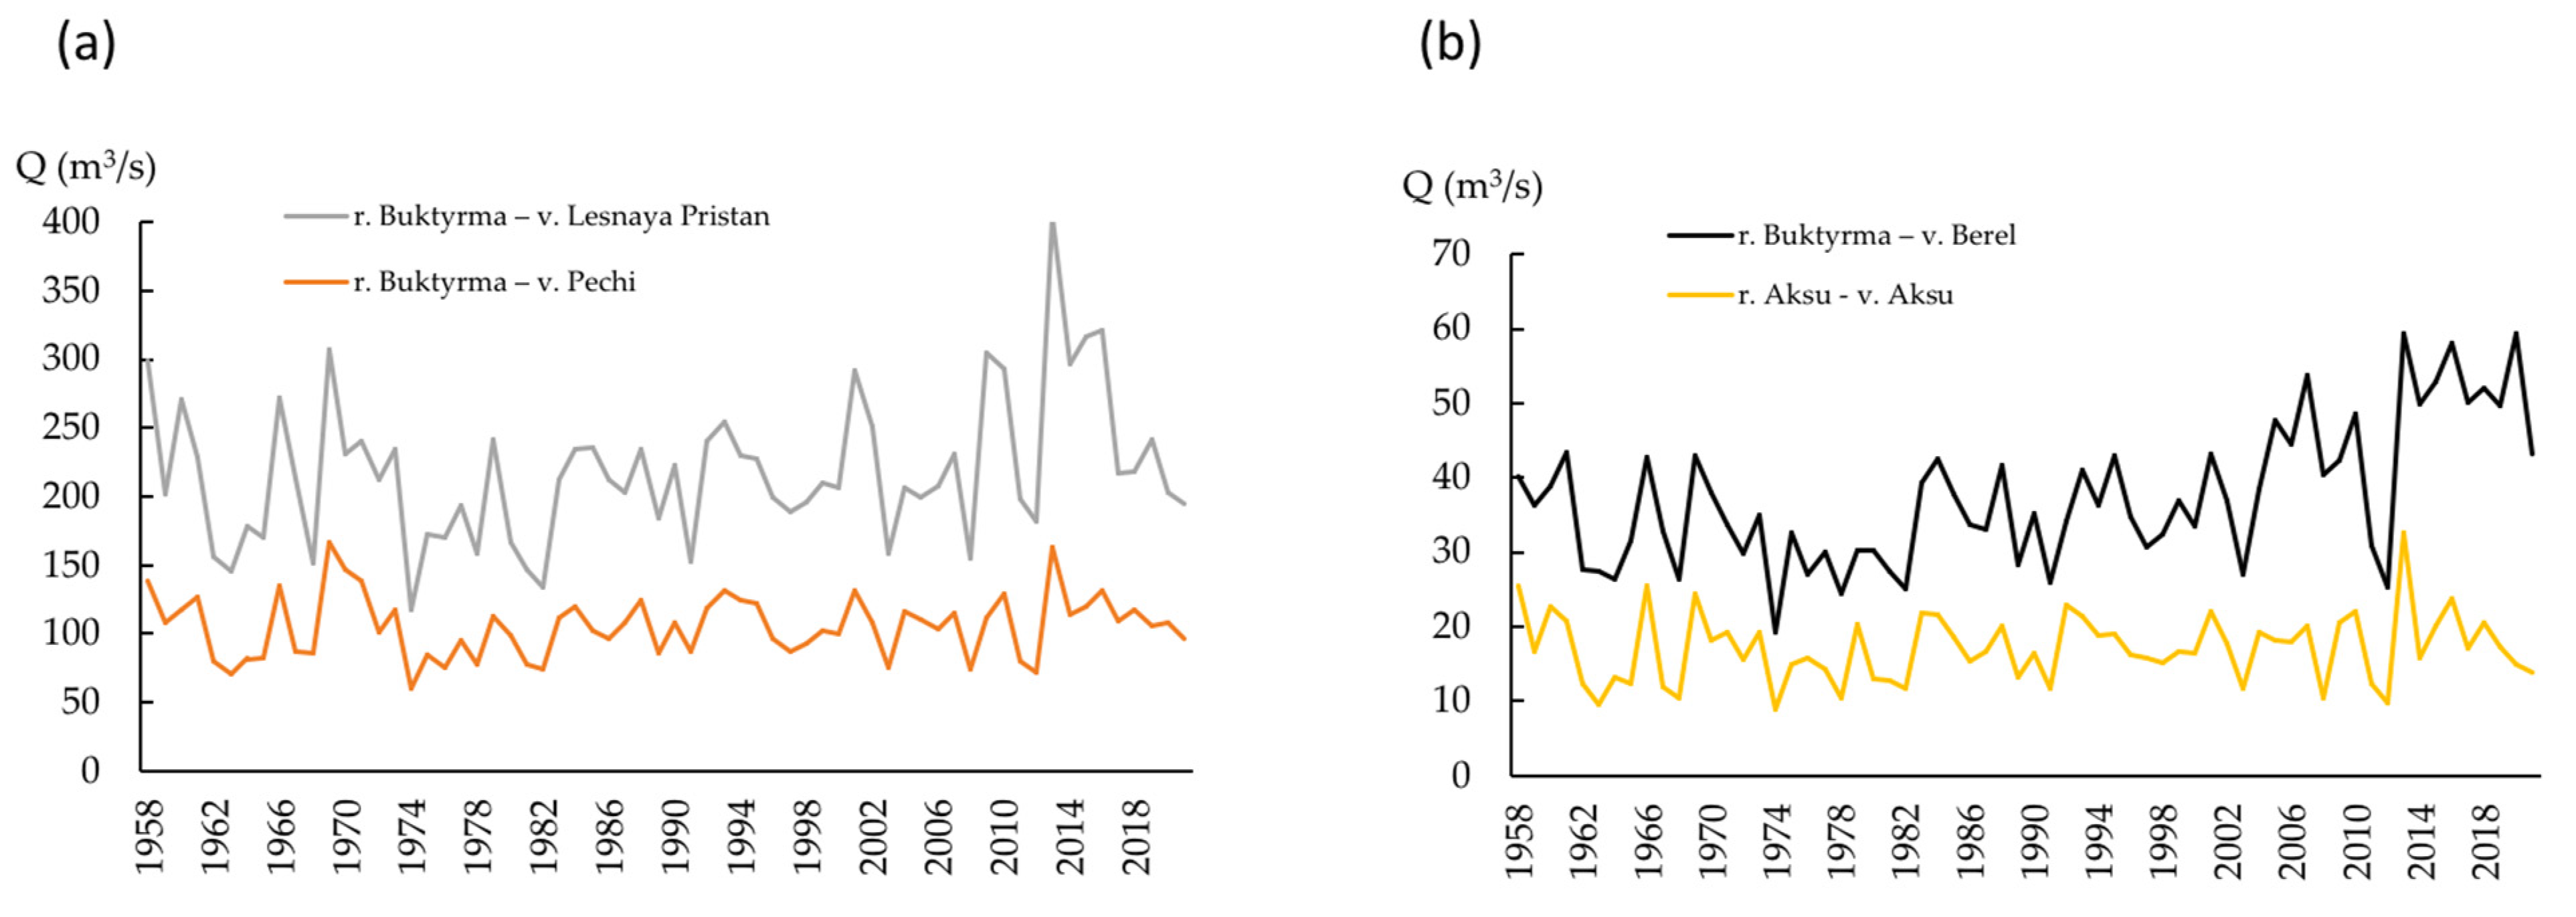
The analysis of the dynamics of long-term fluctuations in the average annual water flow of the Buktyrma River at the sections of the village of Pechi, the village of Lesnaya Pristan, and the right tributary Aksu indicate a generally insignificant trend in runoff growth (
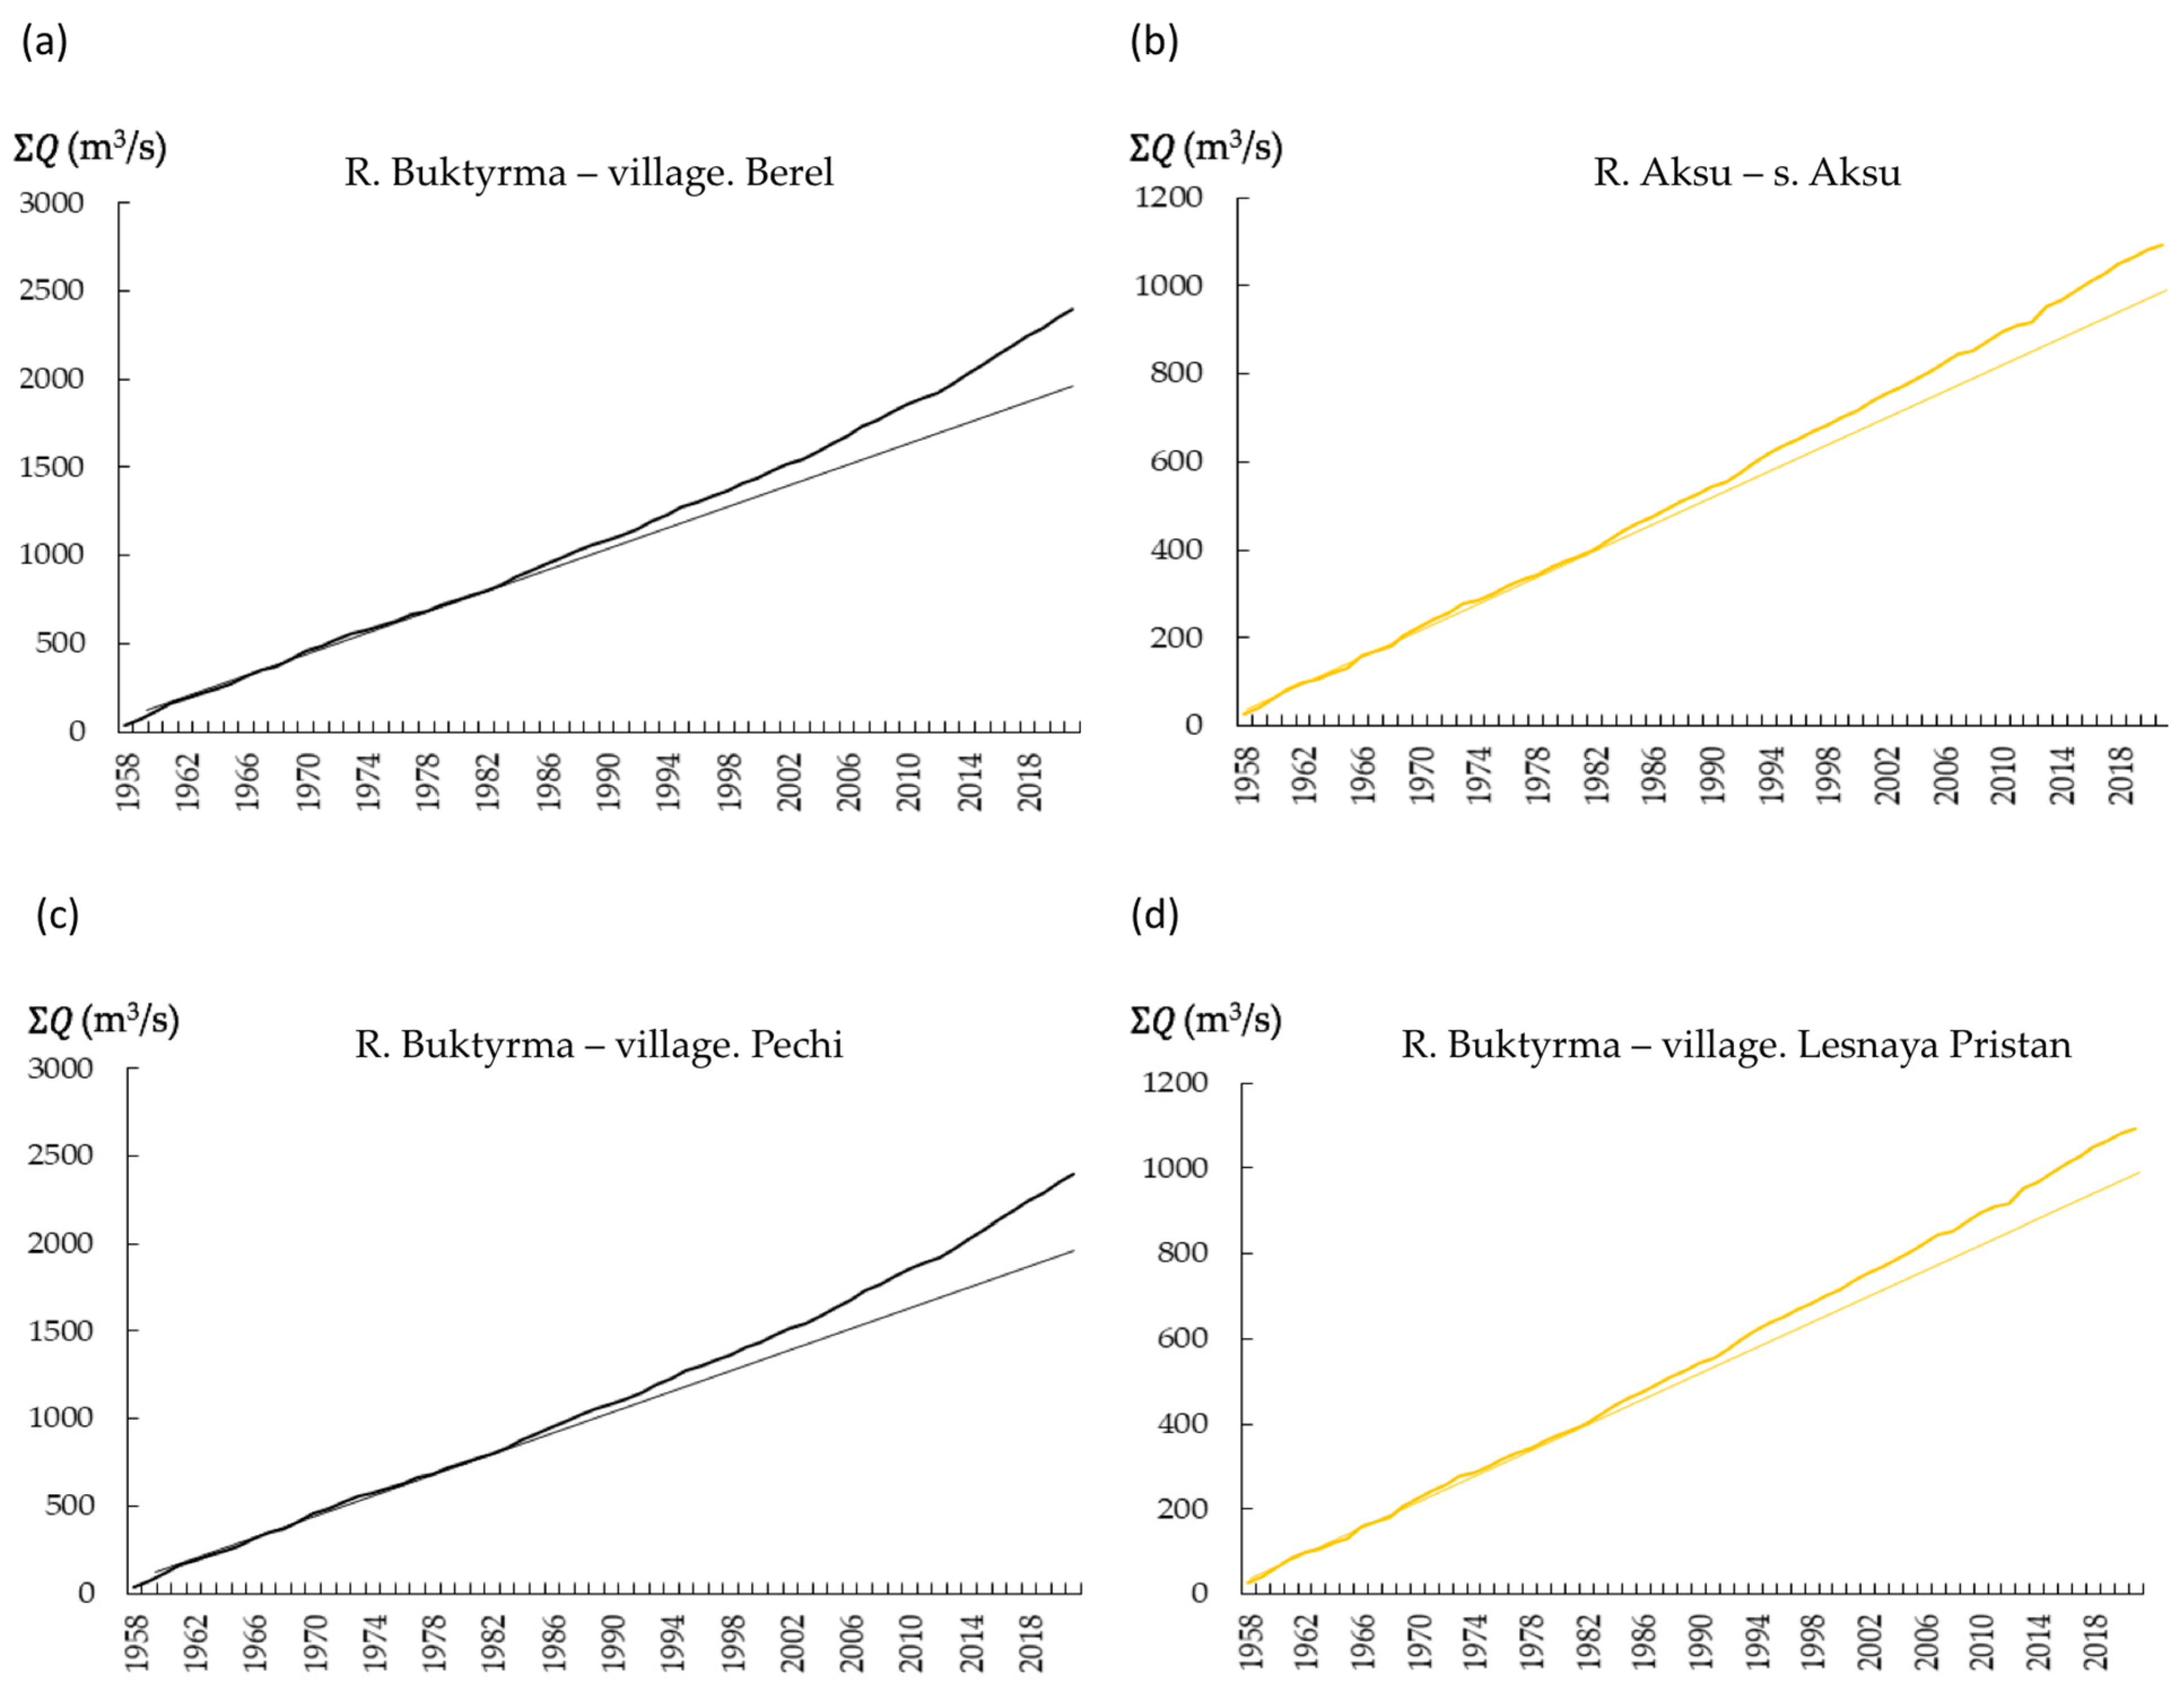
Figure 5). The calculated trends in fluctuations in the average annual runoff, as per the equations, did not demonstrate high significance. An analysis of the homogeneity of a series of average annual water flows using summary integral curves provides a clearer identification of homogeneous periods characterized by stationary indicators of runoff series, primarily norms (
Figure 6).
The total integral curves reveal trends in the long-term water content of the studied rivers. Changes in the homogeneity of the annual runoff series, based on the slope determining fluctuations in water-content phases, occurred as follows: for the Aksu and Buktyrma rivers near the village of Berel around 1980, for the Buktyrma River near Pechi around 1990, and for the Buktyrma River near Lesnaya Pristan around 2000.
Statistical analysis of the homogeneity of the corresponding selected periods, based on the total integral curves of the annual runoff of the studied rivers, utilized parametric criteria widely used in hydrology, such as the Student’s t-test (Ct) and Fisher’s F-test (F).
The hypothesis regarding the homogeneity of the studied samples of annual runoff series, based on the norm (Ct) and the standard deviation (F), is confirmed only for the average annual water flows of the Buktyrma River tributary the Aksu River, near the village of Aksu. However, the remaining calculated series of average annual flow for the Buktyrma River at the sections near the village of Berel, the village of Pechi, and the village of Lesnaya Pristan, characterized by relatively natural water regimes, exhibit heterogeneity of samples in accordance with the identified climatic periods (
Table 5).
The results presented in
Table 5 indicate that the hypothesis regarding the homogeneity of the studied samples of annual runoff series, based on the norm (Ct) and the standard deviation (F), is confirmed solely for the average annual water flows of the Buktyrma River tributary the Aksu River, near the village of Aksu. However, the calculated series of average annual flow for the Buktyrma rivers at the sections near the village of Berel, the village of Pechi, and the village of Lesnaya Pristan, characterized by relatively natural water regimes, exhibit heterogeneity of samples in accordance with the identified climatic periods (
Table 4).
Consequently, the calculation of the statistical parameters of the annual flow probability curves for the studied rivers was conducted for periods of varying climatic conditions. Each fragmented segment was further delineated as conditionally homogeneous (stationary) periods (
Table 6).
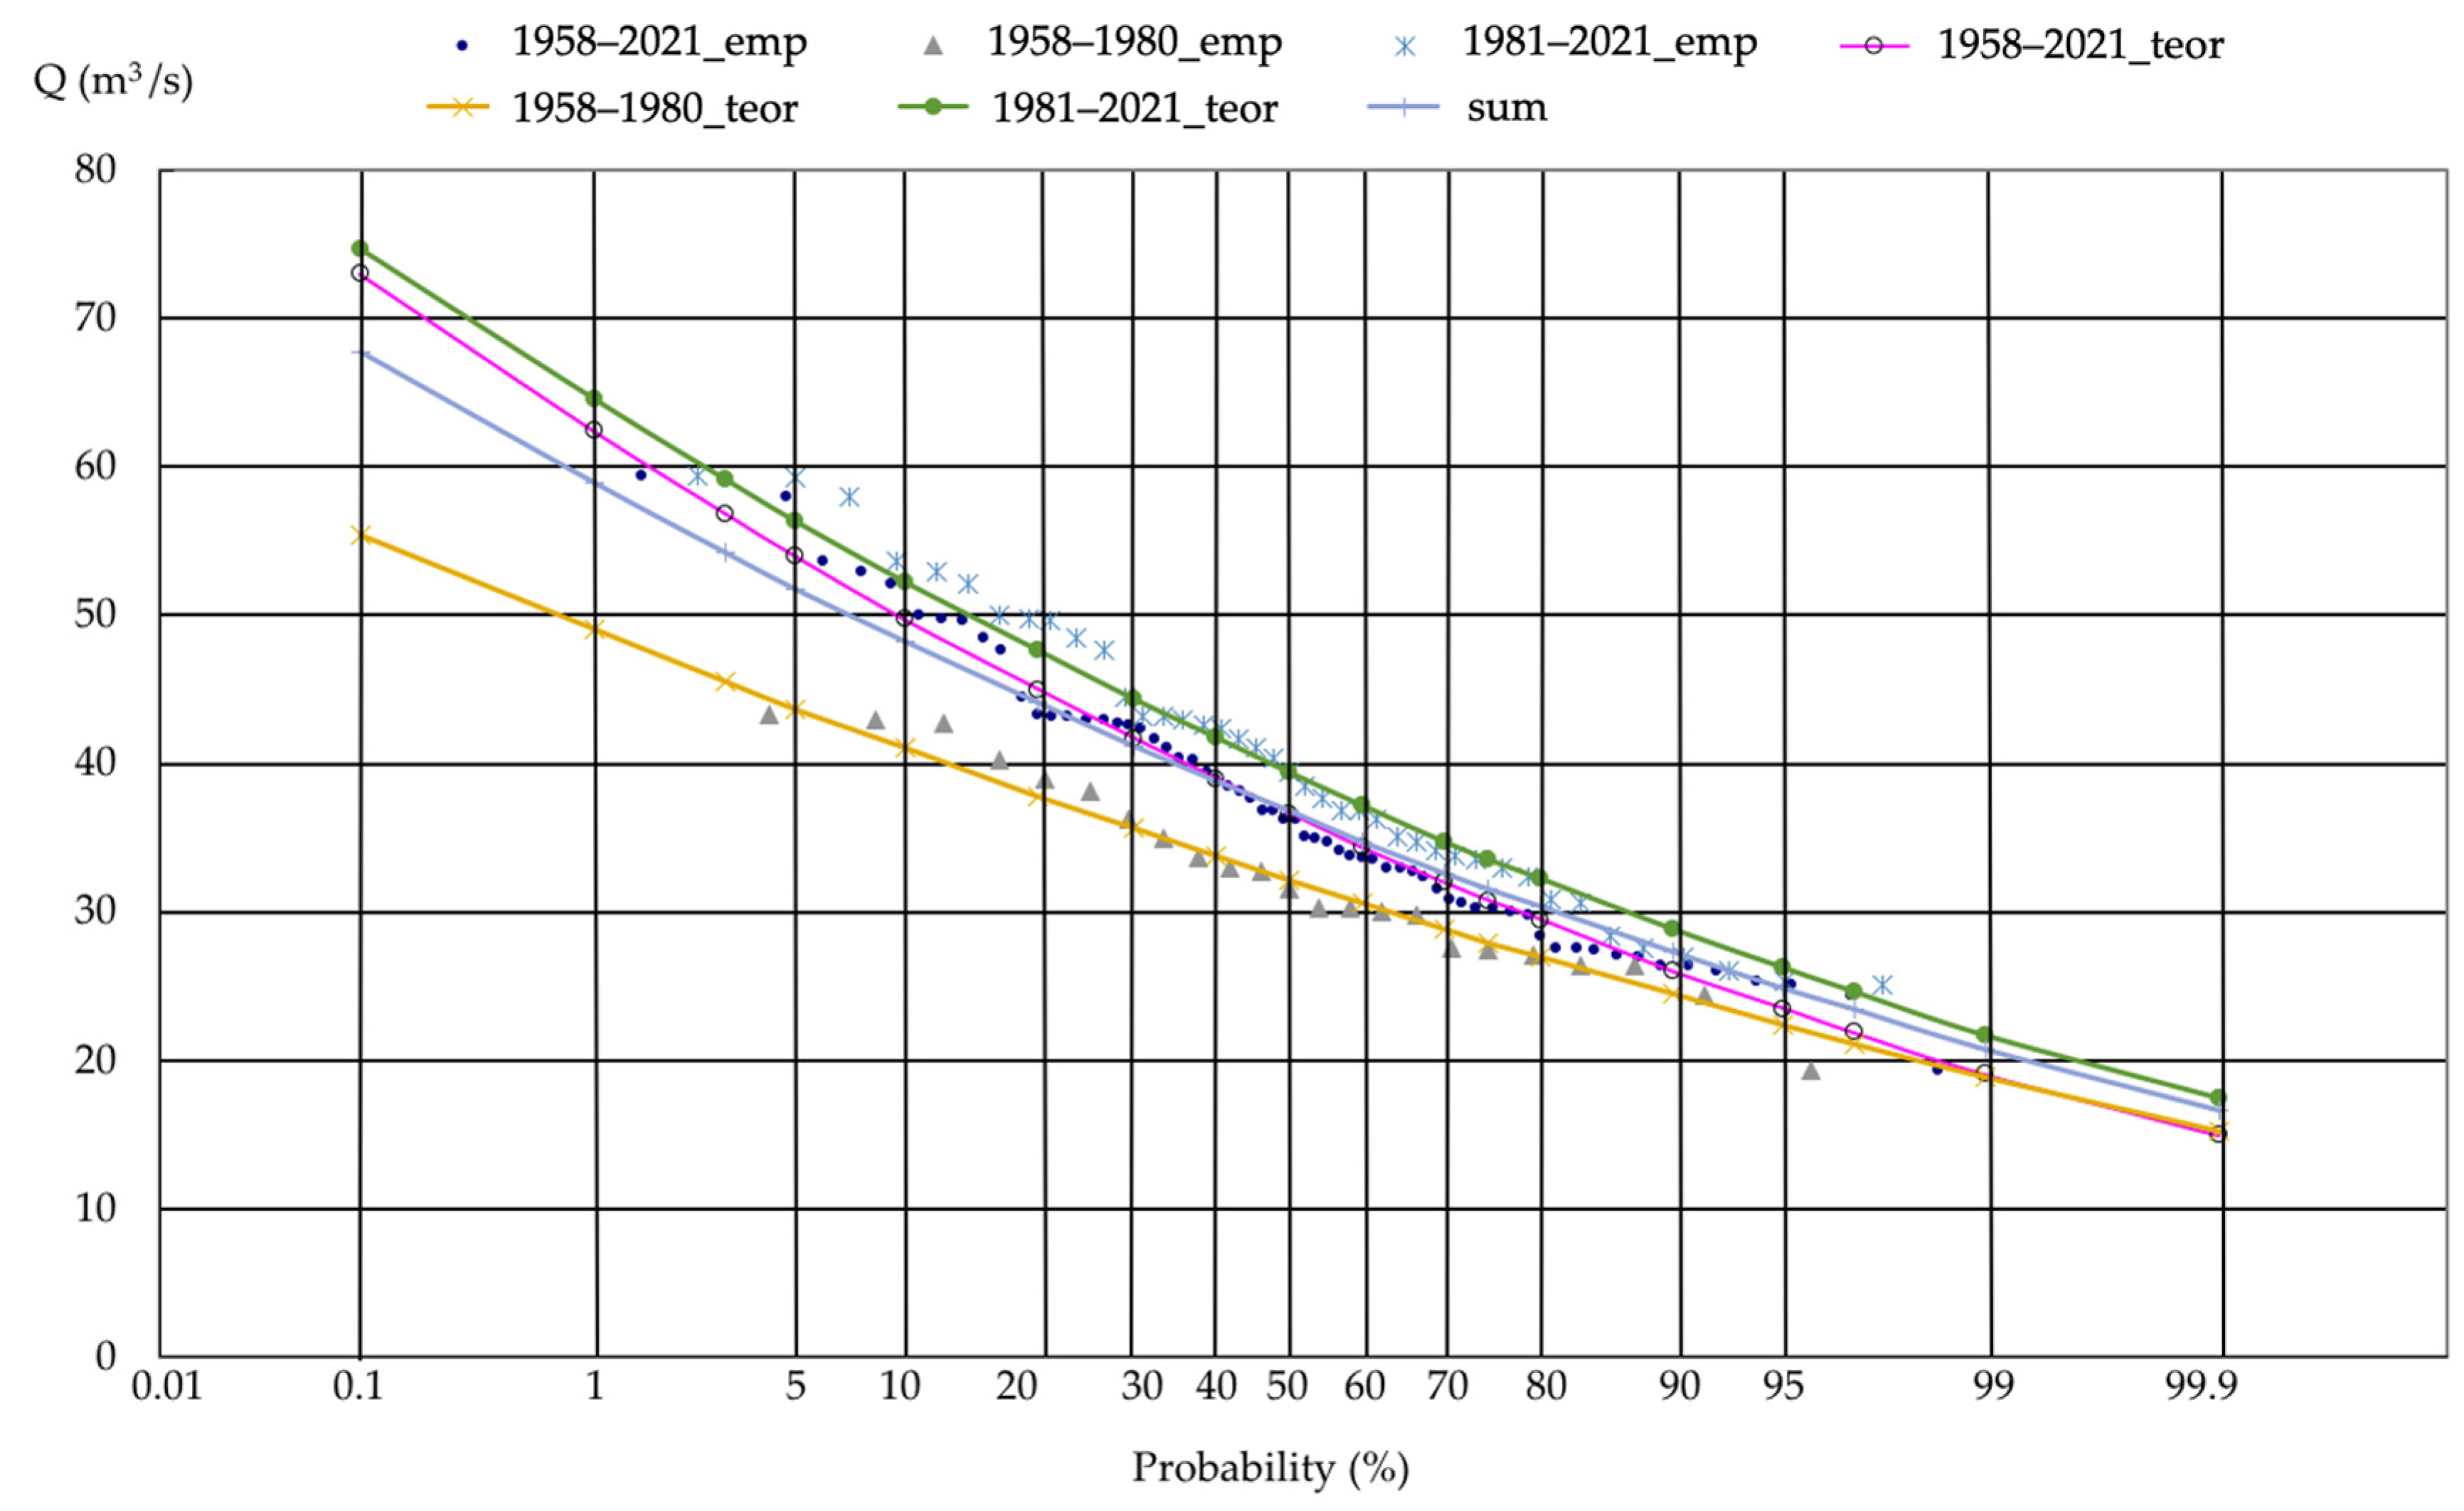
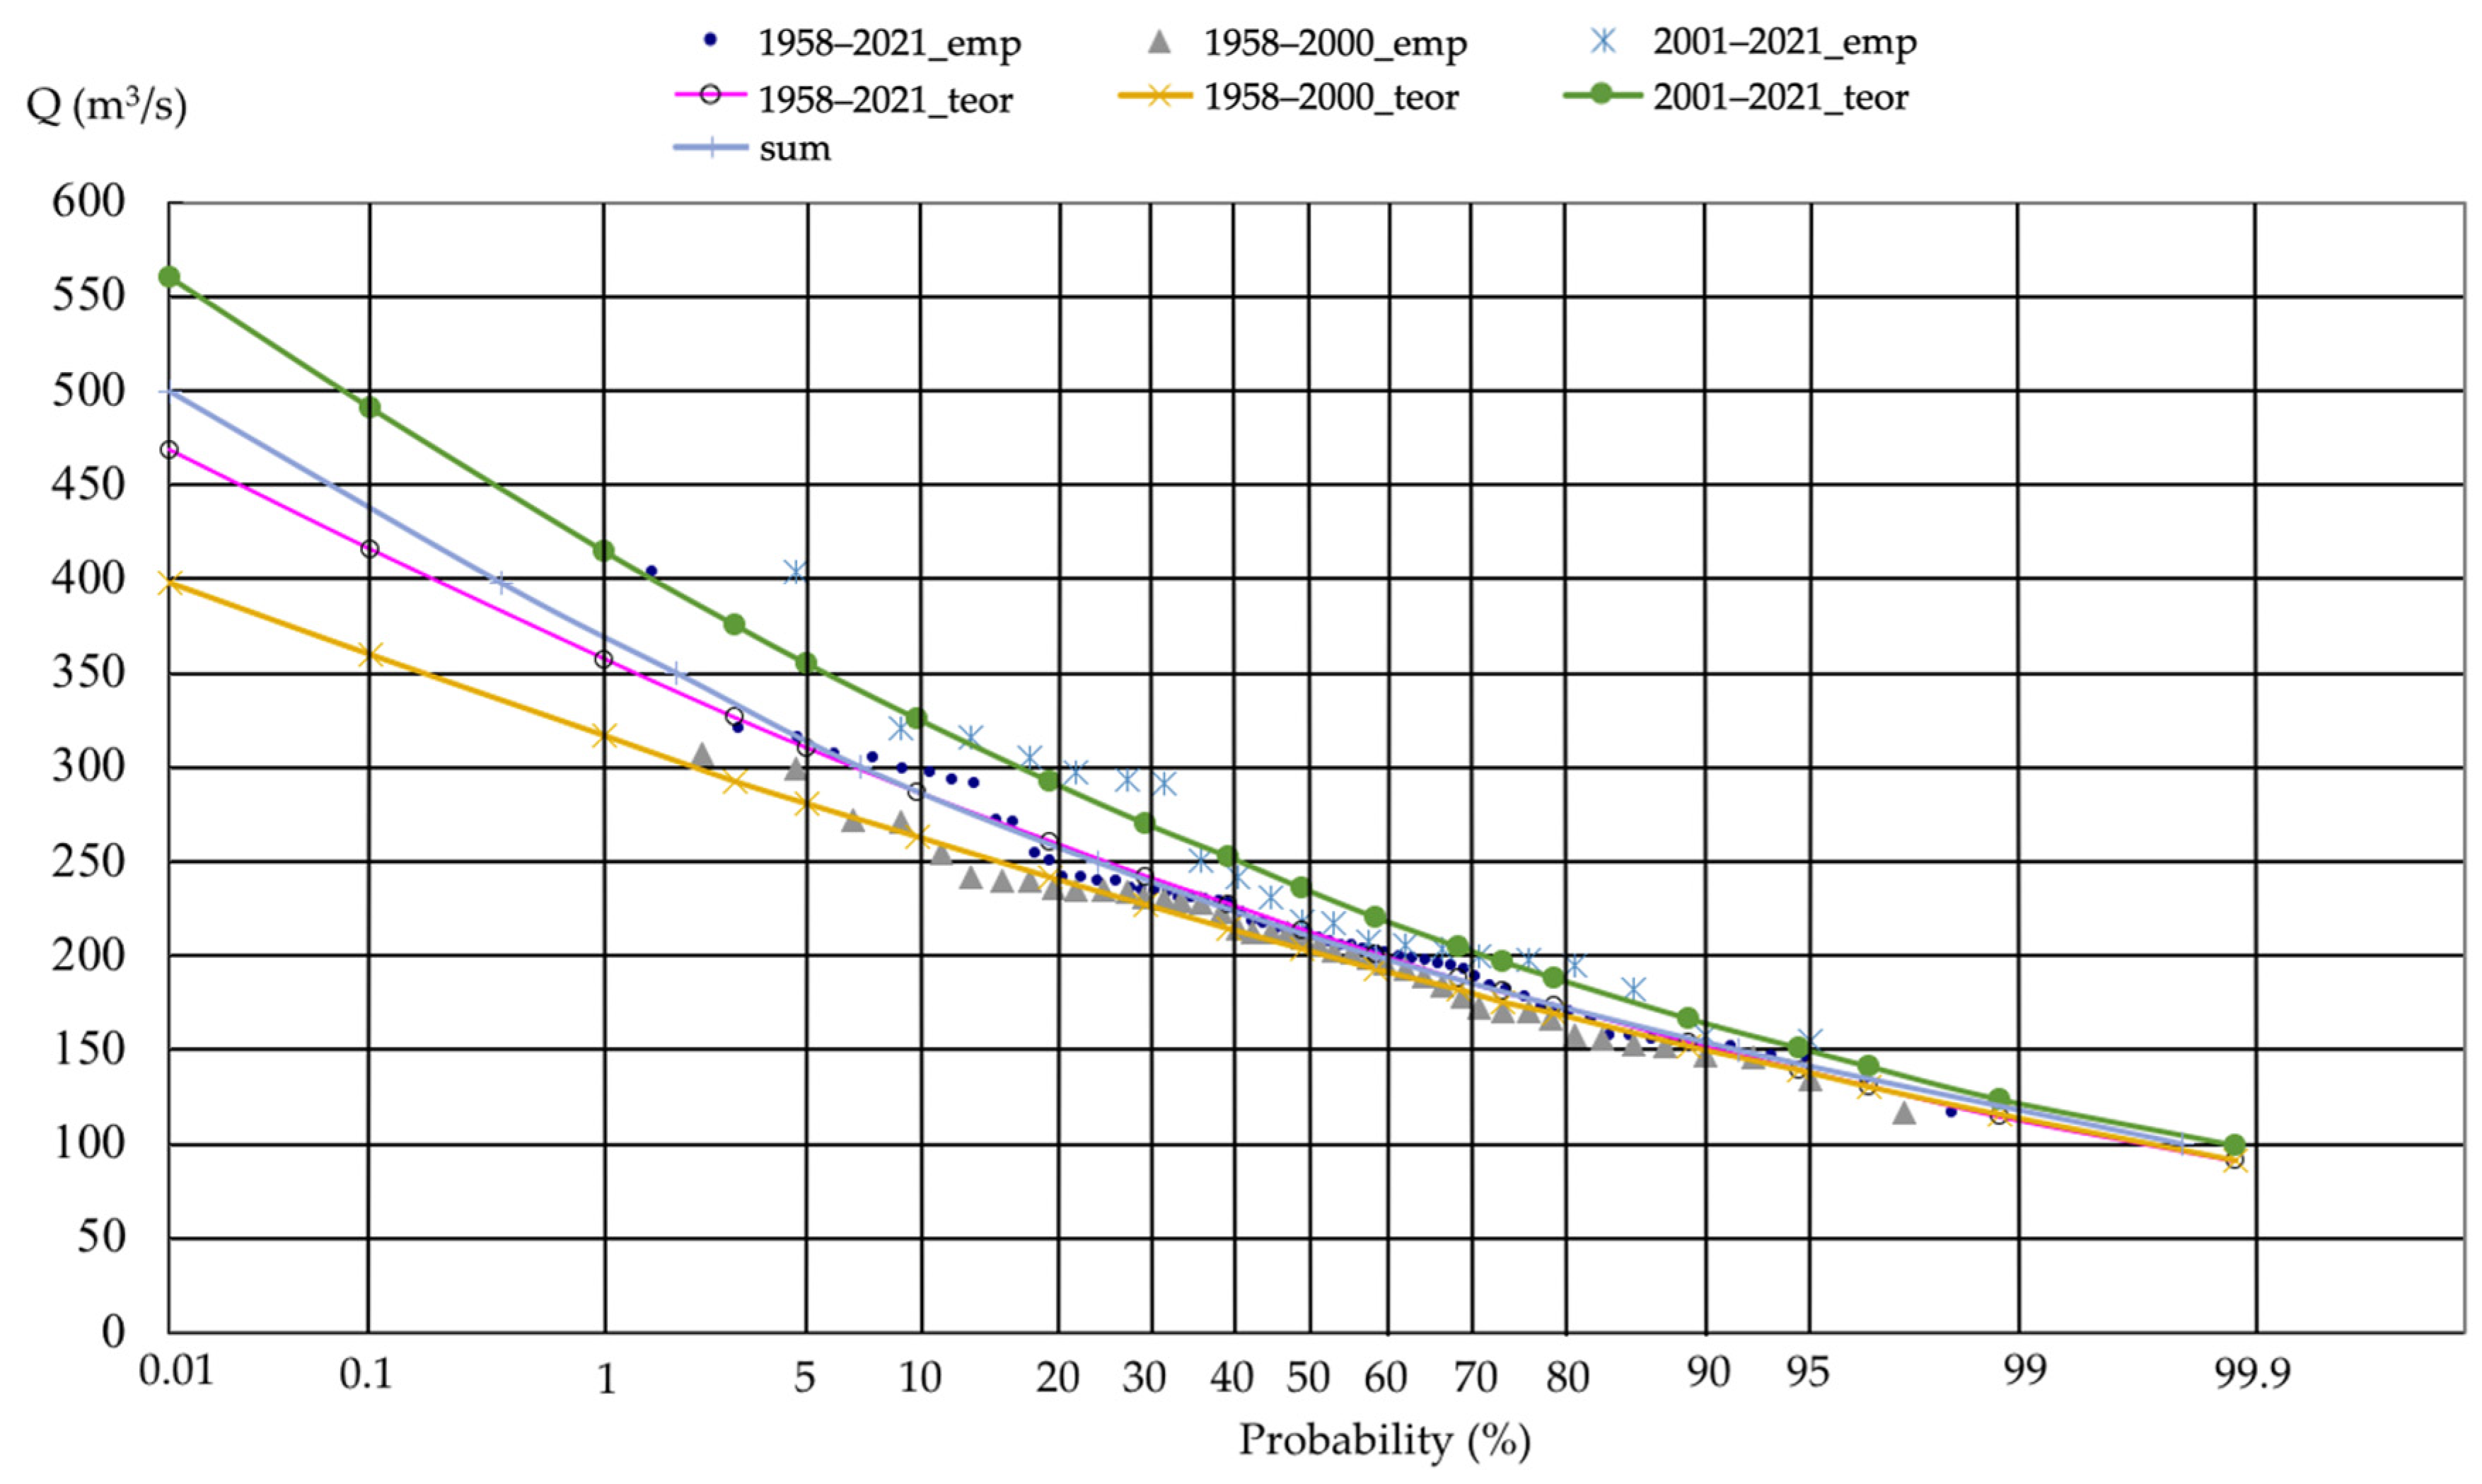
Total (composite) distribution curves were then computed, taking into account weighting coefficients (
Figure 7 and
Figure 8).
4. Discussion
An analysis of the total integral curves of average annual air temperatures at the Katon-Karagay and Seleznevka meteorological stations reveals intensive warming since the early 1980s. The coefficients of determination of air-temperature trends also indicate significant increases in average annual air temperatures. Specifically, compared to the period before 1980, average annual air temperatures increased by 1.0 °C at Katon-Karagai and 0.9 °C at Seleznevka.
While the amount of precipitation recorded at a specific observation point is influenced by various factors such as general circulation processes, cyclonic activity intensity, terrain affecting moisture movement, and sedimentation processes, the long-term regime changes in precipitation are ambiguous. Although the coefficients of determination for trends in annual precipitation amounts are insignificant, a positive trend is observed.
Intense increases in air temperatures in the Buktyrma River basin contribute to significant glacier degradation. Notably, glaciers in the Sarymsakty River basin have completely disappeared, while those in the Buktyrma and Akberel basins have experienced substantial reductions in area since the 1960s, leading to increased runoff in the modern period.
Table 7 demonstrates the most significant increases in average annual water flows for selected periods occurring in the upper reaches of the Buktyrma River in the Berel section (by 24%) and in the right tributary of the Buktyrma on the Akberel River near the village of Berel. These areas are particularly sensitive to intense glacier melting due to their proximity to the glaciers at an altitude of 2100 m. Additionally, the complete melting of a glacier with an area of 7 km
2 in the left tributary of the Buktyrma River, the Sarymsakty near the village of Sogorny, increased the average annual flow by 16%. The increase in average annual flow in the outlet section of the Buktyrma at Lesnaya Pristan by 18% approximately aligns with the average change in other upstream tributaries of 20.2%. Any deviation of 5% can be attributed to errors in the methods employed.
Analysis of the distribution-curve parameters revealed ambiguous changes in their values over different periods. For instance, the coefficient of variation increased at the Berel site near the Buktyrma River but decreased near the village of Pechi. This diversity in changes may be attributed to the uneven spatial distribution of precipitation, which plays a significant role in shaping river flow patterns.
The conclusions drawn from prior studies regarding the influence of climate change on river flow in the Altai Mountains, encompassing the catchment area of the Buktyrma River, align with the findings presented in
Table 7. The observed trend of flow variations in this region, along with the quantitative assessments of these changes, closely correspond to the outcomes of this research. Specifically, the data indicate a notable increase in river flows within the Russian sector of the Altai Mountains, estimated to be approximately 15% [
24,
25,
26].
5. Conclusions
Climatic changes affecting the water and heat balance in the Buktyrma River basin are driving an increase in its annual flow. However, the rate of increase in average annual values of the rivers in the basin begins to decline, depending on their altitudinal location, with notable shifts observed around 1980, 1990, and 2000.
The influence of meltwater from glaciers and snowfields in high mountain zones necessitates more detailed studies and assessment of changes in their intra-annual runoff values. Moreover, the rise in average annual air temperature in the high-mountainous parts of the basin may lead to the complete disappearance of glaciers, as observed in the case of the Sarymsakty glacier, thereby altering the water regime.
Given the climate warming trend and the intensifying glacier melting in the Buktyrma River basin, it is reasonable to anticipate a further increase in river water content until the eventual disappearance of glaciers in the near future (projected within 30–40 years). Considering these conclusions, it is sufficient to approximate the empirical runoff distribution curve for the last conventionally stationary period and utilize this model to evaluate the calculated predictive characteristics.
Author Contributions
Conceptualization, S.B.S. and R.G.A.; methodology, S.B.S. and N.T.S.; software, N.T.S. and S.B.S.; formal analysis, S.B.S. and R.G.A.; investigation, N.T.S. and J.R.-I.; resources, S.B.S. and J.R.-I.; data curation, S.B.S. and N.T.S.; writing—original draft preparation, S.B.S. and J.R.-I.; writing—review and editing, J.R.-I. and M.-E.R.-C.; visualization, J.R.-I. and M.-E.R.-C.; supervision, S.B.S. and R.G.A.; project administration, S.B.S. All authors have read and agreed to the published version of the manuscript.
Funding
This research received no external funding.
Data Availability Statement
Data used in this study were obtained from the national hydrometeorological service the Republican State Enterprise “Kazhydromet” with the author’s participation.
Conflicts of Interest
The authors declare no conflicts of interest.
References
- Singh, P.; Arora, M.; Goel, N.K. Effect of climate change on the runoff of a glacierized Himalayan basin. Hydrol. Process. 2006, 20, 1979–1992. [Google Scholar] [CrossRef]
- Annual Bulletin of Monitoring the State and Climate Change in Kazakhstan. Kazhydromet, Astana, Republic of Kazakhstan. Available online: https://www.kazhydromet.kz/ru/klimat/ezhegodnyy-byulleten-monitoringa-sostoyaniya-i-izmeneniya-klimata-kazahstana (accessed on 29 February 2024).
- Sairov, B. Shygys Kazakhstan Bald Temperature Anomalies. Hydrometeorol. Ecol. 2010, 58, 174–178. [Google Scholar]
- Abdrakhimov, R.; Dzhaksykeldinov, A. Runoff in the upper reaches of the Ertis (Irtysh) River. Hydrometeorol. Ecol. 2013, 4, 61–67. Available online: https://journal.kazhydromet.kz/index.php/kazgidro/article/view/1038 (accessed on 29 February 2024).
- Shivareva, S.P.; Aznabakieva, M.M. Determining the influence of climate on river flow. Ertis (Irtysh) within Kazakhstan and China. Hydrometeorol. Ecol. 2014, 1, 55–67. Available online: https://journal.kazhydromet.kz/index.php/kazgidro/article/view/438 (accessed on 29 February 2024).
- Serikbay, N.T.; Tillakarim, T.A.; Rodrigo-Ilarri, J.; Rodrigo-Clavero, M.-E.; Duskayev, K.K. Evaluation of Reservoir Inflows Using Semi-Distributed Hydrological Modeling Techniques: Application to the Esil and Moildy Rivers’ Catchments in Kazakhstan. Water 2023, 15, 2967. [Google Scholar] [CrossRef]
- Gelfan, A.N. The influence of climate change on the annual and maximum flow of Russian rivers: Assessment and forecast. Fundam. Appl. Climatol. 2021, 36–79. [Google Scholar] [CrossRef]
- Dostai, Z.D. Water Resources of Kazakhstan: Assessment, Forecast, Management. T. II. Natural Waters of Kazakhstan: Resources, Regime, Quality and Forecast; Institute of Geography and Water Resources: Almaty, Kazakhstan, 2012; p. 330. ISBN 978-601-7150-29-7. [Google Scholar]
- Chigrinets, A.G.; Burlibaeva, S.M. Minimum River Flow in the Buktyrma River Basin. Bulletin of Kaznu. Geogr. Ser. 2018, 50, 24–37. [Google Scholar]
- Mustafaev, Z.S.; Kozykeeva, A.T.; Kasymbek, A.N. Modern Features of Intra-Annual Distribution of Hydrological Runnow of the Bukhtarma River; Graduate School Scientific Research, Interuniversity International Congress: Moscow, Russia, 2022. [Google Scholar]
- Galperin, R.I. Changes in the timing of the passage of the flood wave as a consequence of climate warming. Geogr. Water Resour. 2012, 3, 21–26. [Google Scholar]
- Dostay, Z.D.; Alimkulov, S.K.; Saparova, A.A. Water Resources of Kazakhstan: Assessment, Forecast, Management. T. VII. River Flow Resources of Kazakhstan. Book 2. Renewable Resources of Surface Waters in the South and South-East of Kazakhstan. 2011; p. 360. ISBN 978-601-7150-32-7. Available online: https://ingeo.kz/?p=5127 (accessed on 29 February 2024).
- Catalog of Glaciers of the USSR, Altai and Western Siberia. Gorny Altai and Upper Irtysh. Part 6. Chui River Basin, Volume 15, Issue 1, Gidrometeoizdat, Leningrad, USSR. 1974, p. 93. Available online: https://www.kazhydromet.kz/ru/gidrologiya/basseyny-rek-ertis-irtysh-esil-ishim-tobol-verhnee-techenie---mds-1938-2020 (accessed on 29 February 2024).
- GLIMS Consortium. GLIMS Glacier Database, Version 1 [Data Set]. Boulder, Colorado USA. NASA National Snow and Ice Data Center Distributed Active Archive Center. 2005. Available online: https://nsidc.org/data/nsidc-0272/versions/1 (accessed on 29 February 2024).
- Terekhov, A.G.; Sagatdinova, G.N.; Mukhamediev, R.I.; Savin, I.Y.; Amirgaliev, E.N.; Sairov, S.B. Prospects for the use of pseudo-color composites in the analysis of long-term time series of satellite data in the task of assessing the state of vegetation cover. Modern problems of remote sensing of the Earth from space. Remote Sens. 2023, 20, 51–66. [Google Scholar]
- Annual Data on the Regime and Resources of Land Surface Waters, Volume 6, Kara Sea Basin (Western Part), Issues 4–9, 1950–1979. Leningrad, USSR. Gidrometeoizdat, 1968. Available online: https://www.kazhydromet.kz/ru/gidrologiya/basseyny-rek-ertis-irtysh-esil-ishim-tobol-verhnee-techenie---mds-1938-2020 (accessed on 29 February 2024).
- Long-Term Data About the Regime and Resources of Surface Water on Land. Book 1, Issue 1. Almaty, Kazakhstan, 2002. Available online: https://www.kazhydromet.kz/ru/gidrologiya/basseyny-rek-ertis-irtysh-esil-ishim-tobol-verhnee-techenie---mds-1938-2020 (accessed on 29 February 2024).
- Annual Data on the Regime and Resources of Surface Water of Land. Issue 1. UST-Kamenogorsk, Kazakhstan, 2002–2021. Available online: https://www.kazhydromet.kz/ru/gidrologiya/basseyn-reki-ertis-2002-2021 (accessed on 29 February 2024).
- Available online: https://www.kazhydromet.kz/en/gidrologiya/gosudarstvennyy-vodnyy-kadastr-poverhnostnye-vody (accessed on 29 February 2024).
- STO GHI 52.08.41-2017; Basic Hydrological Characteristics with Non-Stationary Time Series Caused by the Influence of Climatic Factors. Recommendations for Calculations. Federal State Budgetary Institution GGI: St. Petersburg, Russia, 2017; 46p.
- Abdrakhimov, R.G.; Abirov, A.F.; Sairov, S.B. Annual runoff of rivers in the Oba basin and the northern slope of the Kalba ridge under conditions of climate change. Hydrometeorol. Ecol. 2024, 7–17. [Google Scholar]
- Magritsky, D.V. River Flow and Hydrological Calculations: Practical Work Performed Using Computer Programs; Triumph Ed.: Moscow, Russia, 2014. [Google Scholar]
- MSN 3.04-101-2005; Determination of the Main Calculated Hydrological Characteristics-Astana. Committee for Construction and Housing and Communal Services of the Ministry of Industry and Trade of the Republic of Kazakhstan: Astana, Kazakhstan, 2006.
- Kosheleva, E.D. Water Conditions of Rivers of the Altai Territory under Climate Change. News Altai Branch Russ. Geogr. Soc. 2023, 2, 5–16. [Google Scholar]
- Borisovna, M.N.; Petrovich, G.S.; Gennadievich, M.G.; Sergeevna, S.S. Study of the hydrological regime of rivers in the Altai Territory under changing climate conditions. Bull. Altai State Agrar. Univ. 2017, 6, 73–80. [Google Scholar]
- Goncharov, S.P.; Maksimova, N.B.; Semikina, S.S. Comparative Analysis of Hydrological Regimes of Mountain Rivers of the Altai Region under Conditions of Climate Fluctuations. Geogr. Environ. Manag. Sib. 2015, 20, 38–42. [Google Scholar]
Figure 1.
Study area. Location of rivers, meteorological and hydrological stations.
Figure 1.
Study area. Location of rivers, meteorological and hydrological stations.
Figure 2.
Location of glaciers according to GLIMS data.
Figure 2.
Location of glaciers according to GLIMS data.
Figure 3.
Dynamics of average annual air temperatures. (a) Katon-Karagai and (b) Seleznevka meteorological stations.
Figure 3.
Dynamics of average annual air temperatures. (a) Katon-Karagai and (b) Seleznevka meteorological stations.
Figure 4.
Dynamics of precipitation at the available meteorological stations. (a) Katon-Karagay and (b) Seleznevka.
Figure 4.
Dynamics of precipitation at the available meteorological stations. (a) Katon-Karagay and (b) Seleznevka.
Figure 5.
Dynamics of average annual river discharge. (a) Buktyrma village. Lesnaya Pristan and Pechi, and (b) Buktyrma village. Berel and Aksu.
Figure 5.
Dynamics of average annual river discharge. (a) Buktyrma village. Lesnaya Pristan and Pechi, and (b) Buktyrma village. Berel and Aksu.
Figure 6.
Buktyrma River dynamics (dashed) and total (solid) integral curves of average annual water flows. (a) Berel, (b) Aksu, (c) Pechi, and (d) Lesnaya Pristan.
Figure 6.
Buktyrma River dynamics (dashed) and total (solid) integral curves of average annual water flows. (a) Berel, (b) Aksu, (c) Pechi, and (d) Lesnaya Pristan.
Figure 7.
Supply curves for average annual water flows of the river. Buktyrma–village. Berel for different periods (emp—empirical curve, teor—theoretical curve).
Figure 7.
Supply curves for average annual water flows of the river. Buktyrma–village. Berel for different periods (emp—empirical curve, teor—theoretical curve).
Figure 8.
Supply curves for average annual water flows of the river. Buktyrma–village. Lesnaya Pristan for various periods (emp—empirical curve, teor—theoretical curve).
Figure 8.
Supply curves for average annual water flows of the river. Buktyrma–village. Lesnaya Pristan for various periods (emp—empirical curve, teor—theoretical curve).
Table 1.
Morphometric characteristics of rivers in the Buktyrma river basin.
Table 1.
Morphometric characteristics of rivers in the Buktyrma river basin.
| River | Length (km) | Area (km2) |
|---|
| Ak Berel | 57 | 1050 |
| Draft | 34 | 533 |
| Sarymsakty | 43 | 634 |
| White | 71 | 1130 |
| Cheremoshka | 31 | 452 |
| Khamir | 72 | 1050 |
| Berezovka | 39 | 1180 |
| Buktyrma | 336 | 12,660 |
Table 2.
Available meteorological data.
Table 2.
Available meteorological data.
| Meteorological Station | Observation Period | Elevation (m) |
|---|
| Katon-Karagay | 1932–today | 1067 |
| Seleznevka | 1967–today | 396 |
Table 3.
Available hydrological data.
Table 3.
Available hydrological data.
| No. | Hydropost | Elevation
(m) | Catchment Area
(km2) | Observation Period |
|---|
| 1 | r. Buktyrma–v. Berel | 1110 | 1850 | 1958–1995 and 2006–today |
| 2 | r. Buktyrma–v. Pechi | 627 | 6860 | 1940–1995 and 2006–today |
| 3 | r. Buktyrma–v. Lesnaya Pristan | 427 | 10,700 | 1926–2002 and 2004–today |
| 4 | r. Akberel–v. Berel | 1184 | 948 | 1958–1992 and 2020–today |
| 5 | r. Chernovaya–v. Chernovoe | 884 | 488 | 1954–1997 and 2020–today |
| 6 | r. Aksu–v. Aksu | 745 | 945 | 1952–1997 and 2006–today |
| 7 | r. Sarymsakty–v. Sogornoe | ~700 | 629 | 1963–1988 |
Table 4.
Glacier evolution, comparing the Glacier Catalog (1969) and GLIMS data (2015).
Table 4.
Glacier evolution, comparing the Glacier Catalog (1969) and GLIMS data (2015).
| | Glacier Catalog (1969) | GLIMS (2015) | Reduction on the
1969–2015 Period |
|---|
| River | Number of Glaciers | Number of Glaciers | Number of Glaciers Reduction |
| Akberel | 37 | 29 | 8 |
| Buktyrma | 74 | 38 | 36 |
| Sarymsakty | 49 | - | 49 |
| Glacier Area (km2) | Area Reduction (%) |
| Akberel | 31.9 | 20.7 | 35 |
| Buktyrma | 29.9 | 15.7 | 48 |
| Sarymsakty | 7.6 | - | 100 |
Table 5.
Assessment of annual runoff uniformity using Fisher and Student criteria.
Table 5.
Assessment of annual runoff uniformity using Fisher and Student criteria.
| Observation Period | Criteria |
|---|
| Fisher | Student’s Test |
|---|
| R. Buktyrma–village Berel |
| 1958–1980 | F = 2.167 | t = 3.413 |
| 1981–2021 | Fa = 1.963 | ta = 1.995 |
| | heterogeneous | heterogeneous |
| R. Buktyrma–village Pechi |
| 1958–1990 | F = 2.128 | t = 0.201 |
| 1991–2021 | Fa = 1.784 | ta = 1.985 |
| | heterogeneous | homogeneous |
| R. Buktyrma–village Lesnaya Pristan |
| 1958–2000 | F = 2.285 | t = 2.859 |
| 2000–2021 | Fa = 1.867 | ta = 1.989 |
| | not homogeneous | not homogeneous |
| R. Aksu–s. Aksu |
| 1958–1980 | F = 1.272 | t = 1.013 |
| 1981–2021 | Fa = 1.963 | ta = 1.995 |
| | homogeneous | homogeneous |
Table 6.
Statistical characteristics of the Buktyrma River basin runoff.
Table 6.
Statistical characteristics of the Buktyrma River basin runoff.
| Hydropost | Periods, Years | Parameters of Supply Curves | Water-Flow Rates of Different Availability, m3/s |
|---|
| Q | C V | C S | 5% | 10% | 25% | 50% | 75% | 90% | 95% |
|---|
| R. Buktyrma–village. Berel | 1958–2021 | 37.4 | 0.25 | 0.50 | 53.9 | 49.7 | 43.3 | 36.7 | 30.8 | 26.0 | 23.5 |
| 1958–1980 | 32.5 | 0.20 | 0.30 | 43.7 | 41.0 | 36.7 | 32.2 | 28.0 | 24.4 | 22.4 |
| 1981–2021 | 40.1 | 0.23 | 0.46 | 56.4 | 52.3 | 46 | 39.4 | 33.6 | 28.8 | 26.2 |
| total | | | | 51.8 | 48.2 | 42.7 | 36.8 | 31.5 | 27.3 | 24.8 |
| R. Buktyrma–village. Pechi | 1958–2021 | 106 | 0.21 | 0.42 | 145 | 135 | 120 | 104 | 90.2 | 78.7 | 72.3 |
| 1958–1990 | 103 | 0.24 | 0.48 | 147 | 136 | 119 | 101 | 85.4 | 72.8 | 66.0 |
| 1991–2021 | 108 | 0.18 | 0.36 | 142 | 134 | 121 | 107 | 94.4 | 83.9 | 78.3 |
| total | | | | 144 | 135 | 120 | 104 | 89.8 | 78.2 | 71.9 |
| R. Buktyrma–village. Lesnaya Pristan | 1958–2021 | 218 | 0.24 | 0.48 | 310 | 287 | 251 | 214 | 181 | 154 | 140 |
| 1958–2000 | 206 | 0.21 | 0.32 | 281 | 263 | 234 | 204 | 176 | 152 | 139 |
| 2001–2021 | 242 | 0.26 | 0.60 | 355 | 326 | 281 | 236 | 197 | 166 | 151 |
| total | | | | 305 | 283 | 250 | 214 | 183 | 157 | 143 |
| R. Aksu–s. Aksu | 1958–2021 | 17.1 | 0.27 | 0.54 | 25.3 | 23.2 | 20 | 16.7 | 13.8 | 11.5 | 10.3 |
| 1958–1980 | 16.3 | 0.32 | 0.64 | 25.7 | 23.2 | 19.5 | 15.7 | 12.5 | 10.1 | 8.78 |
| 1981–2021 | 17.6 | 0.24 | 0.48 | 25.1 | 23.2 | 20.3 | 17.3 | 14.6 | 12.4 | 11.3 |
| total | | | | 25.3 | 23.2 | 20 | 16.7 | 13.9 | 11.6 | 10.4 |
| R. Akberel–p. Berel | 1958–2021 | 33.9 | 0.25 | 0.5 | 48.9 | 45.1 | 39.3 | 33.3 | 27.9 | 23.6 | 21.3 |
| 1958–1980 | 25.7 | 0.2 | 0.30 | 34.5 | 32.4 | 29 | 25.4 | 22.1 | 19.3 | 17.7 |
| 1981–2021 | 39.1 | 0.23 | 0.46 | 54.9 | 50.9 | 44.8 | 38.3 | 32.7 | 28.0 | 25.5 |
| total | | | | 47.6 | 44.3 | 39.1 | 33.7 | 28.9 | 24.9 | 22.7 |
| R. Sarymsakty–village. Sogornoye | 1958–2021 | 8.01 | 0.27 | 0.54 | 11.9 | 10.9 | 9.37 | 7.82 | 6.46 | 5.39 | 4.82 |
| 1958–1980 | 7.25 | 0.32 | 0.64 | 11.4 | 10.3 | 8.67 | 6.98 | 5.56 | 4.49 | 3.90 |
| 1981–2021 | 8.44 | 0.24 | 0.48 | 12.0 | 11.1 | 9.73 | 8.29 | 7.00 | 5.94 | 5.42 |
| total | | | | 11.8 | 10.8 | 9.35 | 7.82 | 6.48 | 5.42 | 4.87 |
| R. Chernevaya-village Draft | 1958–2021 | 6.35 | 0.27 | 0.54 | 9.39 | 8.61 | 7.42 | 6.20 | 5.12 | 4.27 | 3.82 |
| 1958–1980 | 5.79 | 0.32 | 0.64 | 9.14 | 8.25 | 6.94 | 5.59 | 4.46 | 3.58 | 3.12 |
| 1981–2021 | 6.69 | 0.24 | 0.48 | 9.56 | 8.84 | 7.73 | 6.59 | 5.56 | 4.72 | 4.30 |
| total | | | | 9.41 | 8.63 | 7.45 | 6.23 | 5.16 | 4.31 | 3.88 |
Table 7.
Statistical characteristics of the river basin runoff of the Buktyrma.
Table 7.
Statistical characteristics of the river basin runoff of the Buktyrma.
| Hydropost | Mean River Discharge for Periods
(m3/s) | Increased Flow |
|---|
| 1958–1980 | 1981–2021 | m3/s | % |
|---|
| R. Buktyrma–village Berel | 32.5 | 40.1 | 7.6 | 24 |
| R. Buktyrma–village Pechi (1958–1990) | 103 | 108 | 5.0 | 5 |
| R. Buktyrma–village Lesnaya Pristan (1958–2000) | 206 | 242 | 36.4 | 18 |
| R. Akberel–s. Berel * | 25.7 | 39.1 | 13.4 | 52 |
| R. Aksu–s. Aksu | 16.3 | 17.6 | 1.3 | 8 |
| R. Chernevaya–village Draft * | 5.8 | 6.69 | 0.9 | 16 |
| R. Sarymsakty–village Sogornoye * | 7.25 | 8.41 | 1.2 | 16 |
| Disclaimer/Publisher’s Note: The statements, opinions and data contained in all publications are solely those of the individual author(s) and contributor(s) and not of MDPI and/or the editor(s). MDPI and/or the editor(s) disclaim responsibility for any injury to people or property resulting from any ideas, methods, instructions or products referred to in the content. |
© 2024 by the authors. Licensee MDPI, Basel, Switzerland. This article is an open access article distributed under the terms and conditions of the Creative Commons Attribution (CC BY) license (https://creativecommons.org/licenses/by/4.0/).

 ,
, 


