Abstract
Low-impact developments (LIDs) have emerged as effective strategies for mitigating the adverse impacts of urbanization on river environments. This study aims to enhance river environment quality by examining the effects of LIDs and land use/cover change (LUCC) in the context of river environment and hydrological conditions. Using the Stormwater Management Model (SWMM) in an urban river setting, the study investigates the impact of LIDs on urban river water volume. An analysis of river runoff quality and quantity is conducted, followed by the development of an optimal river water regulation scheme through a multi-objective ecological scheduling model. The results reveal that the incorporation of LIDs can substantially decrease river runoff yield for varying recurrence periods of design rainstorms. Consequently, the flood peak reduction rate ranged from 10% to 18%, and the flood volume experienced a reduction of 10–29% in the study area. The combination of river water regulation, LIDs and LUCC leads to a decrease in river water volume within the lower river channel by up to 47% especially in a typical dry year and dry season, accompanied by a decline in river flow velocity and water self-purification capacity. A risk-based multi-objective stochastic optimization model is employed to ensure sustainable management of urban river runoff in terms of both quantity and quality. This research contributes to the advancement of knowledge in sustainable basin management practices and offers practical insights for policymakers involved in the management of water resources and environmental conservation in semi-arid basins.
1. Introduction
Human activities have caused significant changes in the basin hydrological cycle. Serious water problems such as floods, drought, and environmental pollution are therefore encountered in many regions [1,2,3]. Urban floods cause significant damage to buildings and infrastructure every year. As a management solution, there is a growing tendency to collect and reuse urban stormwater to mitigate the destructive inundation effects.
In recent years, low-impact developments (LIDs) have been continuously established in the semi-arid areas of China, where they are recommended as an alternative to conventional urban stormwater management practices. Low-impact developments are effective at mitigating the impacts of urbanization; however, they cause radical changes in urban river water recharge and modify existing mechanisms, such as the conversion between surface water and groundwater [4,5,6]. The changes in urban river hydrology increase the risks and uncertainties in the management of urban river water resources and the protection of the hydro-ecological environment [4,5,6,7,8]. Previous studies have shown that human activities led to the evolution of the underlying surface, the confluence of urban rainwater and sewage pipelines, and a design standard of urban drainage pipe networks that is insufficient for modern society, all of which have led to urban waterlogging [8,9,10,11,12,13,14]. Sponge city construction based on urban LIDs has a significant effect on the utilization of water resources and the alleviation of urban floods [8,15]. A variety of rain-flood models have been developed and used to simulate urban rainfall–runoff, and their results can be used to guide the construction of sponge cities [16,17,18]. The Stormwater Management Model (SWMM 5.0) developed by the United States Environmental Protection Agency (EPA) is a highly utilized software tool in urban stormwater management. It is a dynamic simulation model that can evaluate the performance of LID practices and design and optimize stormwater management strategies for specific sites. SWMM can simulate the hydrologic and hydraulic behaviour of catchments, sewer networks, and treatment systems, incorporating LID practices such as green roofs and rain gardens into the model [19,20,21,22,23]. SWMM has been utilized extensively in studies to assess the effectiveness of LID schemes in reducing runoff volume and pollutant loads in urban areas [24,25,26]. The model can be used to optimize the design of LID practices by simulating various scenarios and evaluating the performance of different configurations. Moreover, SWMM can be employed to assess the impact of LID practices on the hydrology and water quality of a catchment and compare the performance of different LID practices [27,28,29,30,31,32]. Numerous hypotheses have proposed regarding the influence of urban rainfall in the context of LID technologies. The utilization of SWMM is a viable approach for simulating and assessing the effects of large-scale LID implementation, as well as for managing floods within the basin [12].
With the rapid evolution of land use/cover change (LUCC), LIDs have emerged as vital measures to mitigate the vulnerability to flooding. However, as the increase in LIDs gains momentum, concomitant challenges in the water environment domain have manifested [33,34,35,36]. Recent investigations have revealed that the reduction in river self-purification efficacy attributable to LIDs predominantly emanates from the curtailment in water flow velocity, the decrease in dissolved oxygen (DO) concentration, and the increase in suspended particulate matter [37,38,39]. Also, the reduction in the self-purification competence of rivers can be attributed to the decrease in aquatic organism populations and the cut in organic matter content within the watery milieu [38,39,40,41]. In response to these intricacies, researchers have proffered an array of strategies aimed at mitigating the impact of LIDs on river self-purification capacity. These encompass the construction of artificial wetlands, the adoption of green roofs, and the implementation of permeable pavement. For a holistic and sustainable management framework encompassing urban stormwater dynamics and the riverine, it is imperative to broaden the scope of consideration beyond hydraulic and engineering facets to incorporate the broader ambit of riverine environmental aspects [33,34,35].
The Qinling mountains are positioned within a transitional zone that extends from the arid and semi-arid regions of northern China to the comparatively more humid areas of southern China. The basin hydro-ecosystems of the Qinling Mountains have specific features that are characteristic of this geographical location [42]. Guanzhong Plain urban agglomeration is located at the northern edge of the Qinling Mountains and covers Shaanxi, Gansu, and Shanxi provinces. There are 11 cities (i.e., Xi’an City) located in the Guanzhong Plain urban agglomeration area, with a total population of 40 million. Rivers in the northern foothills of the Qinling Mountains provide the primary water source for the Guanzhong Plain urban agglomeration [43]. Recently, the accelerating urbanization in the region has significantly affected the quality of surface water and groundwater in the basins. Due to the shortage of water resources in these basins, many studies have been conducted to ensure the effective development and use of water resources, and hydro-ecological management has been applied to solve problems such as the severe degradation of hydro-ecosystems [44,45]. Low-impact developments have been implemented in the Guanzhong Plain urban agglomeration area to mitigate the impacts of LUCC and alleviate urban flooding.
Xi’an is a major city in the central-northwest region of China, and the Bahe (BH) River, a typical urban river in the northern foothills of the Qinling Mountains and an important waterway that runs through the city (Figure 1), was selected for investigation in this study. We adjusted the structure calibrated the parameters of the SWMM and inversed the runoff generation and concentration processes in the BH River Basin. We addressed the cumulative influence of LIDs and water conservancy projects on urban river hydrology by assessing the effects of three standard LIDs (rain gardens, permeable pavements, and a combination of the two LIDs) on the hydrological environment. We analysed the changes in the hydrological regime and water environment following LUCC, LIDs, and rubber dam projects. We also constructed a water regulation model by taking into consideration the impacts of LID construction and rubber dam projects in the lower urban reaches with the constraints of runoff processes, water self-purification capacity, and the ecological base flow. The model was used to determine the optimal hydro-ecological regulation scheme for rubber dam reservoirs, to improve the river self-purification capacity in the lower urban reaches.
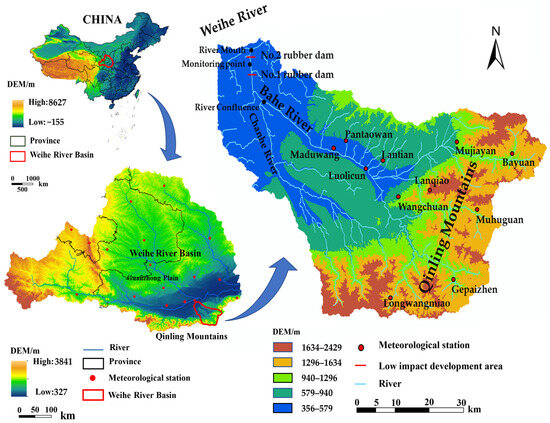
Figure 1.
Location of the BH River Basin.
2. Overview of the Study Area
2.1. River Basin Overview
The BH River, which is a first-class tributary of the Weihe River, is located southeast of Xi’an City (E 109 00′–109 47′, N 33 50′–34 27′), with a total basin area of 2581 km2. The BH River Basin has a warm temperate semi-humid continental monsoon climate, with distinct cold, warm, dry, and wet seasons. Precipitation is distributed unevenly during the year, and the precipitation from July to October accounts for more than 60% (maximum recorded, 77.1%) of the year. The annual precipitation varies greatly, with a maximum yearly precipitation of 999.0 mm, which is two to three times the minimum annual precipitation [45]. The coefficient of variation (CV) of annual precipitation varies from 0.20 to 0.30. The average annual surface water resources in the BH River Basin are about 609.8 million m3, equivalent to a runoff depth of about 236.3 mm.
The BH River Basin has been a crucial region for agriculture and forestry since the 1980s. The urbanization process in the river’s lower reaches accelerated after 2004 (as illustrated in Figure 1, where the lower reaches refer to the area below the confluence of the Chanhe River and the BH River). Since 2005, rubber dams have been constructed in the lower reaches of the river, thereby creating a continuous water landscape within the river channel (refer to Figure 1 for the precise locations of the rubber dams). Following 2016, the urbanization of land use expanded to the middle reaches of the river. After 2016, low-impact development (LID) technologies were implemented in both the middle and lower reaches of the BH River Basin. See Figure 1 for the exact location of the basin.
2.2. Overview of the River Environment in the River Basin
In recent years, the water quality of the BH River has deteriorated due to a variety of environmental factors, including agricultural pollution, sewage discharge, and urban runoff. The water quality of the BH River has been seriously affected, with high concentrations of ammonia nitrogen (NH3-N), total phosphorus (TP), chemical oxygen demand (COD), and other pollutants, which has compromised the safety of drinking water sources and the ecological environment of the river basin [45]. In recent years, the rapid increase in population and constant expansion of the urban area in the region has led to a shortage of regional water resources and the deterioration of the river water environment [42,43,44,45,46]. Between 2005 and 2016, water flows decreased by approximately 20% [44,45,46].
According to the water quality monitoring data from 2010 to 2020 (as shown in Table 1), the water quality of the river was lower than the Class IV surface water environmental quality standard throughout the entire year. The water quality of the river changes significantly with the season. The water quality of the river is best in autumn and worst in winter. In autumn, more precipitation can dilute the pollutants in the river water, resulting in lower COD, NH3-N, and TP values. In winter, the lower temperatures and precipitation increase the concentration of pollutants in the river water, resulting in higher COD, NH3-N, and TP levels. At the same time, the poor regulation of the rubber dam and LUCC resulted in a decreased water flow and reduced self-purification capacity of the water body. This is an important reason for the serious water pollution throughout the year.

Table 1.
The seasonal variation of selected water quality parameters in BH River, 2010–2020.
As shown in Figure 2, the water quality improved over the past decade, as evidenced by the decreasing values of COD, NH3-N and TP, and increasing values of DO. The COD decreased by 53.2% from 2011 to 2020, while NH3-N decreased by 79.7%, TP decreased by 41.4%, and DO increase by 8.1% in the same period. The changes in these water quality indicators were mainly attributed to the natural environment and human activities, such as temperature, precipitation, water flow, and wastewater discharge. Since 2011, the water quality has improved, which was mainly due to the improvement of environmental protection policies and the implementation of pollution control measures.
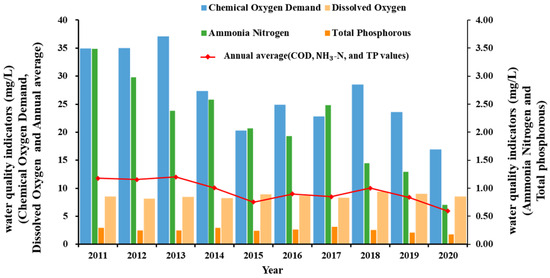
Figure 2.
The annual variation of water quality in BH River from 2011 to 2020.
According to the water quality monitoring data, the most significant source of water pollution in the BH River is agricultural runoff from farms located upstream [41,42,44]. Fertilizers and pesticides used in the farmland are flushed into the river, leading to an increase in nutrient levels and algae. This can lead to a decrease in oxygen levels in downstream water bodies, which is not conducive to the growth of aquatic organisms. Domestic sewage discharge from the middle and downstream regions is another major source of water pollution in the BH River. Sewage treatment plants in the city often do not function properly, allowing untreated sewage to flow into the river. Additionally, urban runoff from the middle and downstream regions is one of the main sources of pollution in the BH River. With the continuous expansion of cities, increases in impermeable surfaces, such as roads and buildings, hinder the natural infiltration of water into the ground [46]. Therefore, rainwater and other runoff flow directly into rivers, bringing pollutants such as grease and other chemicals.
To reduce water pollution in the BH River, the local government has implemented several measures [44,45,46]. These include the construction of wastewater treatment plants, the implementation of pollution control regulations, and the promotion of public awareness of water pollution. Rubber dams have been built in downstream river areas to create scenic features and regulate urban floods. The locations and image of rubber dam projects are shown in Figure 1 and Figure 3. Rubber dams are based on their structure and filling drainage system, by filling with water to expand the dam body, thereby raising the water level and intercepting the flow of water. However, the operation of cascade rubber dams has caused a decrease in the river flow velocity, increased water consumption (e.g., evaporation and infiltration), a weakening of the self-purification capacity of water, and an aggravation of river water environmental pollution [45,46].
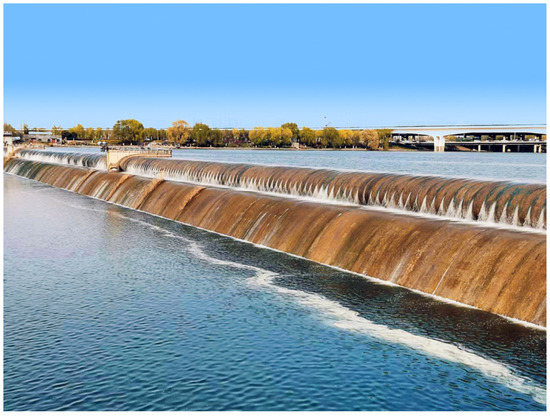
Figure 3.
The image of rubber dam project.
2.3. Data
For this study, 30 m grid LUCC data from 1990 to 2020 was obtained from Yang et al. (https://doi.org/10.5281/zenodo.4417810) (accessed on 24 August 2023) [47]. The digital elevation model (DEM) data were derived from SRTM (https://earthexplorer.usgs.gov/) (accessed on 24 August 2023) [48] with 30 m spatial resolution. The hydrometeorological data, i.e., precipitation, flood runoff, etc., were obtained from the hydrological yearbook and China Meteorological Data Network (http://data.cma.cn) (accessed on 24 August 2023) [49], which included the measured hydrometeorological data of one controlled hydrological station, and 10 weather stations in the basin from 1959 to 2010. The data were used to analyse the change in hydrometeorological conditions.
2.4. LUCC in the River Basin
In this study, 30 m grid LUCC data from 1990 to 2020 was used to analyse the spatial LUCC in the BH River Basin. Based on the original land use map, we reclassified the land uses as follows: (1) cropland, including orchards, dry fields, and paddy fields; (2) forest, including evergreen, deciduous, and mixed forests; (3) grassland, including shrub grassland and sparse forest grassland, with a coverage rate of more than 5%; (4) water, including ponds, lakes, rivers, reservoirs, swamps, and wetlands; (5) built-up land, including residential land, commercial and industrial land, roads, airports, and other unique impermeable surfaces. The classification accuracy was verified using field survey data and high-resolution Google Earth images.
Figure 4 shows land use statistics for the BH River Basin from 1990 to 2020. In 2007, the largest land use type became forest. The forest and built-up land in the BH River Basin continuously increased. The forest area increased from 38.9% in 1990 to 46.8% in 2020. The built-up land expanded approximately three-fold in 30 years, accounting for 15.5% of the total area of the basin. The size of the cropland and grassland decreased obviously. The cropland area decreased from 49.3% in 1990 to 36.4% in 2020. In 1990, the grassland area accounted for 6.11% of the total river basin area, and in 2020, the grassland area accounted for 0.82% of the entire river basin area. The water area first decreased and then increased, accounting for 0.48% of the whole basin area in 2020. In 2007, the forest area was the same as the cropland area. Land use in the river basin has undergone significant transformation over time, with the forest area emerging as the dominant land use type. The completion of sponge city construction after 2020, as depicted in Figure 1, necessitated the division of land use and cover change (LUCC) data into two distinct periods during the study period: 1990–2007 and 2007–2020.
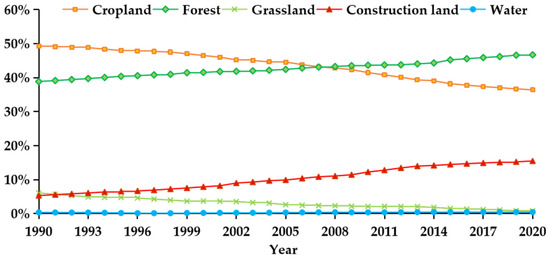
Figure 4.
Land use type distribution in the BH River Basin in different years.
Figure 5 shows the spatial change in land use in the BH River Basin for the periods of 1990–2007 and 2007–2020. From 1990 to 2007, the largest area of land use conversion occurred for the transfer of cropland to built-up land, which was 157.18 km2 in the downstream urban area. A grassland area of 94.68 km2 was converted to forest land close to the mountains. From 2008 to 2020, a large area of cropland (135.04 km2) in the urban areas in the lower reaches of the BH River Basin was transferred to built-up land, and the amount of cropland that transferred to forest also increased significantly, which was due to the measures taken to return farmland to forest to promote soil conservation in the study area. Since 2008, the constant intensification of urbanization in the middle and lower reaches of the basin has had a significant impact on the river water volume, water quality, and the ecological environment of the river [43,44,45,46].
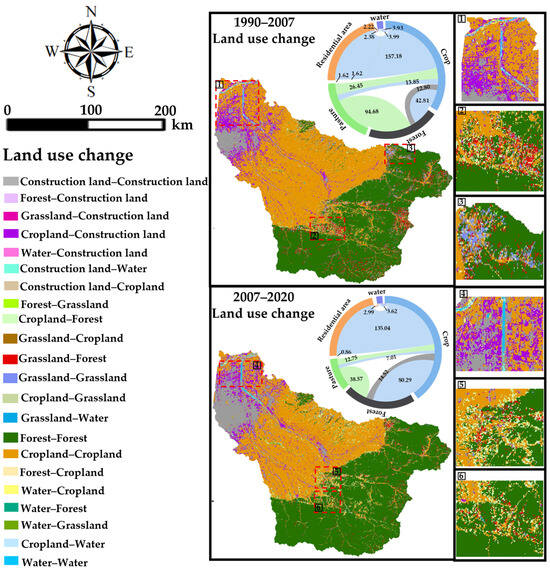
Figure 5.
Land use type transfers in the BH River Basin.
3. Research Outline and Methods
3.1. Research Outline
The SWMM model was constructed for the BH River Basin to simulate the rainfall–runoff process in different recurrence periods and for typical rainfall processes (measured rainfall process on 9 June 2015, was a unimodal rainfall process, with a cumulative rainfall of 35.2 mm (2 years)). The variation of the flood peak and volume under various LID measures was analysed. A multi-objective ecological scheduling model of the river reach was constructed to analyse the changes in river water quantity, flow velocity, river leakage (groundwater recharge in the riverside zone), and the possible water quality and environmental impact after urban LIDs and LUCC. The model technology roadmap is shown in Figure 6. The model also enabled the hydrological impact of LIDs and LUCC to be determined.
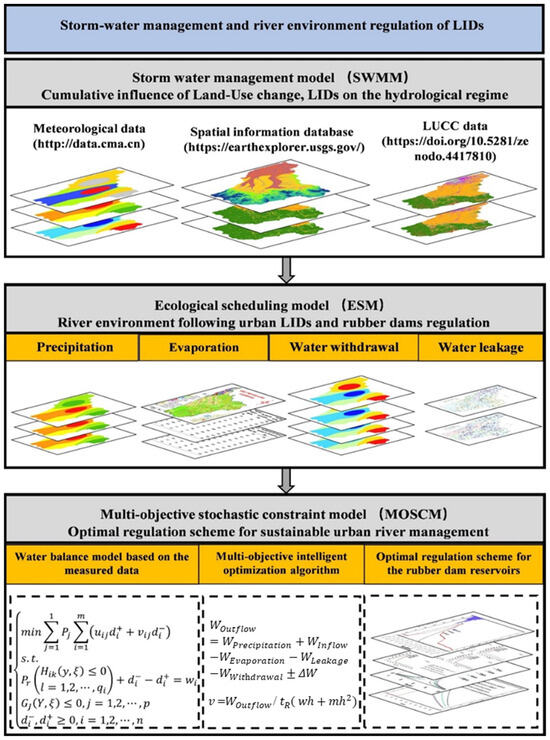
Figure 6.
The technical route of stormwater management and river environment optimal regulation based on multiple satellite data.
3.2. Principle of the SWMM
The SWMM is a rainfall–runoff simulation model based on hydrodynamics. The model can simulate hydrological processes such as time-varying precipitation, surface water evaporation, depression interception, precipitation infiltration, groundwater recharge, water exchange, slope runoff generation, and the occurrence of confluences [50,51], and it is widely used in rainfall–runoff simulations in urban areas. The data needed for SWMM construction include meteorological data, pipe network data, and underlying surface data, among which the meteorological data includes rainfall, flow rates, and other factors. The underlying surface data includes land use, slope, soil type, and other factors. The core hydrological simulation models in the SWMM model are a surface runoff generation model, surface confluence model, and pipe network confluence model [52,53].
Based on the SWMM calculation, the river reach was generalized as a pipeline according to the river topography, with an irregular shape [52]. The whole drainage area was demarcated based on the slope, water system, and hydrogeological zoning of the basin, after fully considering the underlying surface information of the modelling area and the distribution of confluence lines. The main calculations and principles of runoff in the model were as follows [50,51,52,53,54].
In the model, the catchment area was divided into a permeable area and an impermeable area. The impermeable area was further divided into impermeable areas with water storage capacity and impermeable areas without a water storage function.
(1) Permeable area yield,
where Q1 is the yield, mm; i is the rainfall intensity, mm/s; fa is the infiltration rate, mm/s; and Δt is the infiltration time, s.
(2) Runoff yield of depressions,
where Q2 is the surface runoff, mm; P is precipitation, mm; and D is the water storage capacity of a depression, mm.
(3) Water storage in the impermeable area and runoff yield of an area with no depression,
where Q3 is surface runoff, mm; P is precipitation, mm; and E is evaporation, mm.
3.3. Surface Confluence Model
The surface confluence in the SWMM was realized by approximating each catchment area as a nonlinear reservoir, combining the Manning formula and continuity equation, and solving it iteratively with the finite difference method and Newton method. The continuity equation is:
where s is the sub-catchment area, m2; t is the time, s; V is the total water storage in the sub-catchment area, m3; P′ is the net rain depth, m; h is the water depth, m; and q is the runoff, m3,
3.4. Construction and Application of the SWMM Model
3.4.1. Model Generalization
The SWMM model was used to calculate the whole drainage area, which was divided into 93 catchment areas, 56 catchment nodes, and two drainage outlets, according to the slope, water system, and hydrogeological zoning of the basin, after fully considering the underlying surface information and the distribution of confluence lines in the modelling area. Based on the land use situation of the underlying surface of the basin, the basin area was divided into sub-basins, and the infiltration parameter zoning was formulated. See Figure 7 below for the specific spatial extraction results.
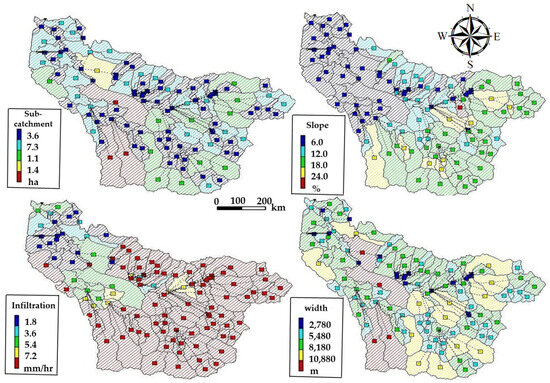
Figure 7.
The sub-basin division, width, area, slope, and an infiltration map of the BH River Basin.
3.4.2. Parameter Determination
In reference to the contemporary research findings of Hou et al. and Kim [22,25], and drawing upon the model parameter selection methodology elucidated within the Stormwater Management Model (SWMM) user manual, it has been ascertained that the optimal depression storage depths are 2.0 mm for impermeable surfaces and 7.0 mm for permeable areas. The impermeability roughness coefficient and permeability roughness coefficient were calculated by weighting the sizes of the different land types in each sub-basin. The rainfall infiltration adopted the Horton formula to simulate and calculate the infiltration in the catchment area. Based on the determination of the other parameters of the model, the infiltration rate was calibrated with the actual investigation data of rainfall and inundation depth. At the same time, the hydraulic conductivity values of different saturated soils were weighted and averaged according to the area of each soil type in the basin. The minimum infiltration rate of the basin was determined using the saturated soil hydraulic conductivity table provided in the manual [55]. The implementation plan of Xi’an LIDs and the SWMM user manual were consulted to determine the principal parameter values of the basin, as shown in Table 2.
Table 2.
The main hydrological parameters of the basin.
3.4.3. Rainfall Processes at Different Design Frequencies in the BH River Basin
By incorporating the recent research findings of Hou et al. [15], in conjunction with the recorded data on the precipitation patterns within the BH River Basin, the assessment discerned that within the urban confines of Xi’an, short-duration rainstorms tend to exhibit concentrated of rainfall characteristics. Of notable prevalence among the varied precipitation forms was the occurrence of single-peak rainfall patterns. Therefore, the Chicago rain type was selected as the design rainfall, and the peak ratio r = 0.48 was used to represent the rainfall type [15,22]. The urban rainstorm and flood management model SWMM was used to simulate and calculate the design floods with design rainstorm recurrence periods of 5, 10, 20, 50, and 100 years, and the simulation results of the model were verified according to the design flood results of the Xi’an Practical Hydrological Manual, as shown in Table 2. After passing the verification and evaluation, the design flood calculation of the BH River Basin was conducted. The rainfall processes at different design frequencies (rainstorm recurrence periods T = 5, 10, 20, 50, and 100 years) are shown in Figure 8.
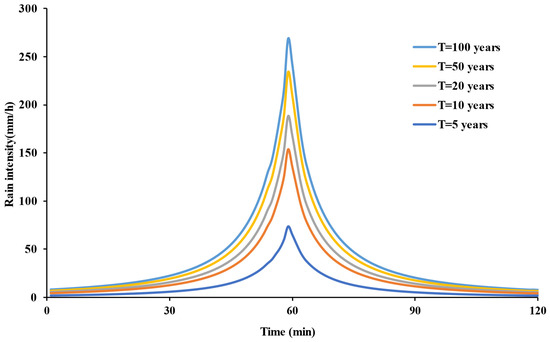
Figure 8.
Rainfall processes at different recurrence periods.
3.4.4. LID Construction
Regarding the establishment of construction parameters and primary engineering interventions for the sponge city initiative within the downstream vicinity of the BH River, three distinct urban LID strategies have been devised. These strategies encompass: LID 1 rainwater garden construction; LID 2 porous paved road construction; and LID 3 rainwater garden and permeable pavement. See Figure 1, which delineates the specific locations within the basin where LID technologies have implemented. These strategies are central to our study and their spatial distribution is crucial to understanding their potential impact on the watershed’s overall hydrology and river environment.
3.5. Multi-Objective Ecological Scheduling Model and Intelligent Optimization Algorithm
Based on the water balance principle in river reaches, we constructed a multi-objective ecological scheduling model of river reaches using two constraints, i.e., the inflow process from the upper river channel simulated by the SWMM and the mean critical flow velocity in the cross-section [45]. The model was used to calculate the mean flow velocity in the cross-section, interval water consumption, and leakage in the rubber dam reservoirs, with the rubber dams being elevated to different heights. In artificial lake environments, experimental studies have demonstrated that an increase in water flow velocity enhances the self-purifying capacity of the lake water, ultimately reducing pollutant concentrations [45,46]. Furthermore, our experimental research conducted in an artificial lake downstream of the BH River indicates that when the river flow rate exceeds 0.299 m3/s (corresponding to an average cross-sectional velocity of greater than 0.01 m/s), the concentrations of total phosphorus (TP), chemical oxygen demand (COD), and ammonia-nitrogen (NH3-N) in the river water significantly decrease. Therefore, we set the constraint of water flow in the two rubber dam reservoirs as a mean flow velocity in the cross-section greater than 0.01 m/s to improve the water self-purification capacity.
The water balance model was based on the measured river runoff, precipitation, and evaporation data, as well as the relationship between the water level of the rubber dam reservoir and the storage capacity. Referring to the current research results of Sun [44], the changes in the water volume in a certain period, the average storage capacity in a certain period, the actual evaporation on the reservoir surface, and the leakage of the river section over a certain period were estimated. According to the test results, the average comprehensive permeability coefficient of the rubber dam reservoir was set to 0.066 m/d. The water balance calculation formula based on the water balance method was as follows [45],
where WPrecipitation is the total precipitation of the reservoir area, WInflow is the total runoff of the inflow area, WEvaporation is the total evaporation of the water surface (calculated by the monthly average evaporation) multiplied by the area, i.e., the total evaporation of the corresponding period, WLeakage is the total of lateral leakage and bottom leakage in the river channel, WWithdrawal is the total water withdrawal from the river, and ΔW is the change in the total storage of the rubber dam reservoir.
Estimation of cross-section area and mean flow velocity in the cross-section:
where w is the bottom width of the river channel, m is the side slope, h is the water depth in the river channel, v is the mean flow velocity in the cross-section, and Rt is the detention time in the reservoirs.
The ecological scheduling model, which is grounded in a water balance equation, is formulated based on the principle of multi-objective random constraints. The solutions for this model can be described as follows. The main purpose of the multi-objective optimization of relevant opportunities is to minimize the deviation from the objectives after the decision maker provides the optimization objectives, and to then provide reasonable solutions for random variables according to the given priority. The optimal water storage height of rubber dam projects in the lower urban reaches was finally determined using a self-developed stochastic simulation and intelligent optimization algorithm [45,56]. Within the range of rubber dam height adjustment (0–3.0 m), the average flow velocity, flow rate, and leakage rate of the rubber dam reservoir area was calculated and simulated 5000 times to ensure an accuracy of more than 90%. At the same time, the Tennant method was used to estimate the ecological base flow, and the value is controlled at more than 10% of the upstream inflow [45,56,57,58].
The basic framework of the multi-objective random constraint model was as follows [45,54]:
Here, Pj is the priority factor, representing the importance of the target (for all cases, Pj is much greater than Pj+1); Uij is the weight factor of the positive deviation for the i-th goal of priority j; vij is the weight factor of the negative deviation for the i-th goal of priority j; is the negative deviation between the target and target value; e is the positive deviation between the target and target value; Hik is the real-valued function in the target constraint; Gj is the real-valued function in the uncertain environment; wi is the target value of the i-th goal; l is the number of priority levels; and m is the number of target constraints.
4. Results
4.1. Verification of the Measured Rainfall–Runoff Process in the BH River Basin
The measured precipitation and runoff process on 9 June 2015 were used to verify the model. The model verification results are shown in Figure 9, which shows that the simulated runoff process was consistent with the measured runoff process. It was considered that the model parameters were appropriately selected and could be used for the simulation of urban rainwater control and utilization in this region.
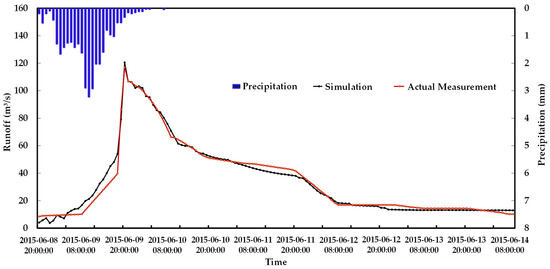
Figure 9.
Model validation results.
4.2. Evaluation of the Design Flood Simulation Results in the Lower Reaches of the BH River Basin
In Table 3, the simulation results of the model are compared with the design flood results in the Xi’an Practical Hydrological Manual. The flood peak simulation error was between 2.2% and 11%, which met the requirement of 20% of the measured runoff error in the Hydrological Information and Forecasting Code (SL250-2000, Hydrological Information and Forecasting Code [S]). This confirmed that the model accurately captured the relationship between precipitation and runoff yield in the basin, and that the model construction and parameter interval selection were reasonable. Refer to Figure 1 for the location of the monitoring point.
Table 3.
Evaluation of the design flood simulation results of the SWMM model in the BH River Basin.
4.3. Analysis of the Changes in the River Hydrological System after Urban LIDs
4.3.1. Flood Process Response to LID Construction
The SWMM model was used to simulate and calculate the hydrological changes in the lower reaches of the river after the construction of a sponge city in the cities and towns in the BH River Basin. A comparison of the flood processes before and after the implementation of LID measures under different design rainstorm recurrence periods is shown in Figure 10.
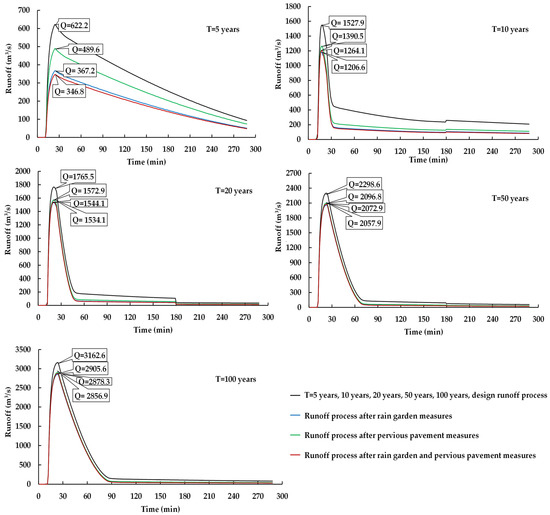
Figure 10.
Comparison of basin flood process before and after implementation of LIDs under different design rainstorm recurrence periods.
Based on the analysis, Figure 10 illustrates the outcomes for different recurrence periods of design rainstorms. The study reveals that the most substantial reduction in the design flood peak occurred when the design rainstorm recurrence period was 10 years. Moreover, for a designed rainstorm recurrence period of 5 years, the flood volume experienced a reduction of 13–20%. However, when the design rainstorm recurrence period exceeded 20 years, the flood peak reduction rate was approximately 10%. In terms of total flood volume, a decrease of 25–29% was observed when the design rainstorm recurrence period was 10 years. Similarly, a reduction of 13–20% was recorded for a designed rainstorm recurrence period of 5 years. For design rainstorm recurrence periods exceeding 20 years, the flood peak reduction rate ranged from 10% to 18%.
4.3.2. Hydrological Response of an Urban River Section Constructed by LIDs
The water discharge strategy of the cascade rubber dams in the lower reaches of the BH River is designed to optimize water storage while satisfying the ecological base flow requirements, with the aim of fulfilling the demands of the regional water landscape. The analysis of Figure 10 reveals that the construction of a sponge city can significantly alleviate floods and mitigate urban waterlogging; however, it may simultaneously cause a reduction in river water inflow, particularly during typical dry years and dry seasons (when precipitation, from November to the next May, accounts for less than 20% of the entire year). To address this potential consequence, by examining the rainfall process of a typical dry year (2015) with a designed 2-year rainstorm recurrence period, this study applied the SWMM model and water balance equation within the rubber dam reservoir to simulate and calculate the potential impact of LIDs on the river water inflow.
The typical rainfall process in a typical dry year and the simulation results of the SWMM model are shown in Figure 11. Table 4 shows the results of the changes in water quantity in the rubber dam reservoirs in the lower reaches of the BH River before and after the LIDs.
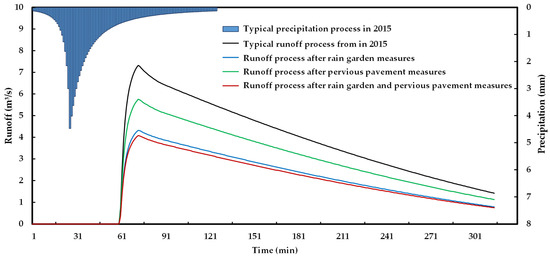
Figure 11.
Changes in the typical runoff process following the LIDs in a typical dry year.
Table 4.
Changes in river water quantity for the rubber dam reservoirs following LIDs in a typical dry year.
The simulation of the typical rainfall–runoff generation process in the study area showed that the total river runoff decreased by about 28% after the implementation of LIDs (Figure 11). The calculated river water balance in the urban section showed that after the construction of the sponge city, the water quantity in the rubber dam reservoirs decreased, the flow velocity in the river channel slowed down by 16–50%, and the retention time increased (Table 4). Leakage decreased by about 35% with the reduction in the water storage level and water surface area.
4.4. Optimal Regulation of the Hydro-Ecology in the Lower Urban Reaches of the BH River
The implementation of LIDs and rubber dam projects in the lower reaches of the BH River has resulted in several issues, including a decrease in river water volume, a slowing of flow velocity, and other changes in hydrological conditions. These factors have contributed to the increased concentration of materials in the urban river water environment.
To investigate the downstream channel inflow process following the implementation of LIDs, the SWMM model was employed. The stochastic simulation results of the multi-objective ecological scheduling model, as presented in Table 5, indicate that the rubber dam projects in the lower reaches have led to a reduction in water in the downstream river sections. Using a local experimental study, optimal regulation was conducted to enhance the water self-purification capacity and minimize the impact of LIDs in the lower reaches.
Table 5.
The optimal river water regulation scheme for the rubber dams following LIDs with a designed rainstorm recurrence period of 2 years.
5. Discussion
(1) Based on the water quality monitoring data, the primary sources of water pollution in the BH River are identified as agricultural runoff from upstream farms, domestic sewage discharges, and urban runoff from middle and downstream regions. As evidenced by Figure 2 and Figure 4, the poor regulation of rubber dams and land use and cover change (LUCC) contribute to a decreased water flow, reduced water flow velocity, and diminished self-purification capacity of the water body. This is a significant factor contributing to the severe water pollution observed in the study area.
In order to effectively enhance water quality, the implementation of additional environmental protection policies and the establishment of pollution control measures across the entire BH River, particularly the optimal regulation of hydro-ecology in urban areas, are of paramount importance. These measures have the potential to significantly improve water quality in the BH River and mitigate the adverse effects of pollution in the region.
(2) After the implementation of LIDs in the middle and lower reaches of the BH River, there was more water stored in the urban area, and the flood runoff of the BH River decreased. The simulation results showed that the implementation of LIDs can significantly reduce floods and alleviate urban waterlogging, but at the same time may reduce the inflow of river water. Taking the typical rainfall process in a typical dry year (2015) as an example, the results revealed that the adoption of LIDs strategies led to a substantial reduction in total runoff in the lower river channel of approximately 28%. Additionally, the flow velocity in the river decreased within a range of 16–50%. It is noteworthy that the duration of water retention in the rubber dam reservoirs experienced a significant change as well.
As a direct result of the reduction in water quantity, the decrease in water storage level and water surface area caused a corresponding reduction in river leakage, amounting to approximately 35%. The implementation of LIDs in the BH River has the potential to exacerbate the accumulation of pollutants within the river and rubber dam reservoir area, thereby aggravating the issue of environmental water pollution, particularly in dry year and during the dry season.
(3) The proposed optimal regulation scheme of rubber dams, based on locally measured data and remote sensing data such as LUCC and DEM, is a promising approach to ensure the environmental flow in river channels. The increase in water flow and flow velocity resulting from this scheme may improve the water environment’s self-purification capacity and mitigate the impact of LIDs. The implementation of these schemes can effectively reduce the concentration of pollutants in heavily polluted urban rivers in semi-arid areas, and this has significant implications for protecting regional water resources.
(4) As human activity and rapid urbanization in the BH River Basin continue to increase, the evolutionary mechanism of flood processes will become more complex, and the uncertainty of flood simulations will increase. The performance of the proposed models was constrained by the availability of data records. To enhance the performance of the proposed regulation scheme, it is suggested to use a reasonable water quality data length that exceeds the smallest cryptic period of the runoff time series. Hence, there is a need to study the urban flood runoff evolutionary mechanism that is affected by typical human activities and LIDs and optimize the model’s structure accordingly to improve its simulation accuracy in future research.
6. Conclusions
The study aims to assess the efficacy of LIDs in mitigating the adverse impacts on the water environment. The findings contribute to a comprehensive understanding of the potential improvements in the hydrological system and offer insights into the challenges faced by the water environment following LID implementation.
Several urban rainwater and flood management strategies have been proposed to mitigate the impact of urbanization. However, the potential deterioration of urban river water quality resulting from the implementation of such strategies, particularly LIDs, has not been adequately considered. Thus, comprehensively addressing the issue of urban rainstorm flood management and the potential decline in river water quality is a practical problem that needs to be addressed, especially for urban rivers with severe water pollution, such as the BH River. The optimized scheme proposed in this study for the regulation of rubber dams is an effective way to ensure the environmental discharge of rivers. The increase in water flow and velocity brought about by this scheme can improve the self-purification capacity of water environment and mitigate the impact of LIDs. The findings of this study can assist in implementing sustainable basin management and offer valuable insights for basin managers and planners. The ramifications of the findings derived from this study carry profound implications for the holistic administration and stewardship of urban rivers situated in the arid and semi-arid expanses of northern China.
Author Contributions
All authors contributed to the work. C.L. and J.L. conceived and de-signed the study; X.F., P.L. and D.M. offered technical guidance; P.G. and Y.Z. supply the data; C.L. performed the computations and data analysis; W.Y. and A.H. proofread and edited the manuscript. All authors have read and agreed to the published version of the manuscript.
Funding
We sincerely thank the Key Laboratory of Subsurface Hydrology and Ecological Effects in the Arid Region, Ministry of Education. This research was funded by the Shaanxi Postdoctoral Science Foundation 2018 (2018BSHEDZZ21), the National Natural Science Foundation of China (Grant No. 42261144749) and International Science and Technology Cooperation Program of Shaanxi Province (Grant No. 2024GH-ZDXM-24), and the General Financial Grant from the China Postdoctoral Science Foundation (2017M623088). Yinshanbeilu Grassland Eco-Hydrology National Observation and Research Station, China Institute of Water Resources and Hydropower Research, Beijing 100038, China, Grant NO. YSS2022004. And the APC was funded by the Fundamental Research Funds for the Central Universities, CHD (300102292903) and the Shaanxi Provincial Department of Education Service Local Special Plan Project (23JE007).
Data Availability Statement
The data that support the findings of this study are available from the corresponding author, Jiqiang Lyu, upon reasonable request.
Conflicts of Interest
The authors declare no conflicts of interest.
References
- Desta, H.; Lemma, B.; Gebremariam, E. Identifying sustainability challenges on land and water uses: The case of Lake Ziway watershed, Ethiopia. Appl. Geogr. 2017, 88, 130–143. [Google Scholar] [CrossRef]
- Xia, J.; Liu, C.Z.; Ren, G.Y. Opportunity and Challenge of the Climate Change Impact on the Water Resource of China. Adv. Earth Sci. 2011, 26, 1–12. [Google Scholar]
- Xia, J.; Sun, X.T.; Feng, H.L. Challenge of ecological water requirement of the west in China. China Water Resour. 2003, 483, 57–60. [Google Scholar]
- Guo, P.; Lyu, J.Q.; Yuan, W.N.; Zhou, X.W.; Mo, S.H.; Mu, D.R.; Luo, P.P. Detecting the Quantitative Hydrological Response to Changes in Climate and Human Activities at Temporal and Spatial Scales in a Typical Gully Region of the Loess Plateau, China. Water 2022, 14, 257. [Google Scholar] [CrossRef]
- Luo, P.P.; Zhang, Y.; Wang, Y.Y.; Shi, P.; Yu, W.; Zhu, X.; Huo, A.; Wang, Z.; He, B.; Nover, D. Comparative Assessment of Sponge City Constructing in Public Awareness, Xi’an, China. Sustainability 2022, 14, 11653. [Google Scholar] [CrossRef]
- Zhang, J.; Song, X.; Wang, G.; He, R.; Wang, X. Development and challenges of urban hydrology in a changing environment: I: Hydrological response to urbanization. Adv. Water Sci. 2014, 25, 594–605. [Google Scholar]
- Vorosmarty, C.J.; McIntyre, P.B.; Gessner, M.O.; Dudgeon, D.; Prusevich, A.; Green, P.; Glidden, S.; Bunn, S.E.; Sullivan, C.A.; Liermann, C.R.; et al. Global threats to human water security and river biodiversity. Nature 2010, 467, 555. [Google Scholar] [CrossRef] [PubMed]
- Luo, P.P.; Luo, M.T.; Li, F.Y.; Qi, X.G.; Huo, A.D.; Wang, Z.H.; He, B.; Takara, K.; Nover, D.; Wang, Y.H. Urban flood numerical simulation: Research, methods and future perspectives. Environ. Model. Softw. 2022, 156, 105478. [Google Scholar] [CrossRef]
- He, H.; Zhang, Q.; Jie, Z.; Fei, J.; Xie, X. Coupling climate change with hydrological dynamic in qinling mountains, china. Clim. Change 2009, 94, 409–427. [Google Scholar] [CrossRef]
- Todorov, V.; Dimov, I. Innovative Digital Stochastic Methods for Multidimensional Sensitivity Analysis in Air Pollution Modelling. Mathematics 2022, 10, 2146. [Google Scholar] [CrossRef]
- Hu, M.; Zhang, X.; Siu, Y.L.; Li, Y.; Tanaka, K.; Yang, H.; Xu, Y. Flood Mitigation by Permeable Pavements in Chinese Sponge City Construction. Water 2018, 10, 172. [Google Scholar] [CrossRef]
- Choo, Y.; Sim, S.; Choe, Y. A study on urban inundation using swmm in busan, Korea, using existing dams and artificial underground waterways. Water 2021, 13, 1708. [Google Scholar] [CrossRef]
- Dimov, I.; Maire, S.; Todorov, V. An unbiased Monte Carlo method to solve linear Volterra equations of the second kind. Neural. Comput. Applic. 2022, 34, 1527–1540. [Google Scholar] [CrossRef]
- Lv, F.W.; Chen, Y.; Liu, F.; Mao, J.; Ding, Y.Y.; Yuan, S.C. Simulation study of the runoff control effects of LID facilities with different spatial placement strategies, China. China Rural. Water Hydropower 2023, 3, 120–129+143. [Google Scholar]
- Hou, J.; Guo, K.; Wang, Z.; Jing, H.; Li, D. Numerical simulation of design storm pattern effects on urban flood inundation. Adv. Water Sci. 2017, 28, 820–828. [Google Scholar]
- Mei, C.; Liu, J.; Wang, H.; Xiang, C.; Zhou, J. Review on urban design rainstorm. Chin. Sci. Bull. 2017, 62, 3873–3884. [Google Scholar] [CrossRef][Green Version]
- Kumar, K.; Kozak, J.; Hundal, L.; Cox, A.; Zhang, H.; Granato, T. In-situ infiltration performance of different permeable pavements in an employee used parking lot-A four-year study. J. Environ. Manag. 2016, 167, 8–14. [Google Scholar] [CrossRef]
- Price, R.K.; Vojinovic, Z. Urban flood disaster management. Urban Water J. 2008, 5, 259–276. [Google Scholar] [CrossRef]
- Xu, K.; Yang, Y.; Wu, C.; Xu, F. Research on Modulation Method for Non-inverting Buck-Boost Power Converter. Water Resour. Power 2011, 29, 171–173+195. [Google Scholar]
- Xu, D. An Overview of Storm Water Management Model (SWMM). Acta Sci. Circumst 2014, 33, 23–26. [Google Scholar]
- Marsalek, J.; Dick, T.M.; Wisner, P.E.; Clarke, W.G. Comparative Evaluation of Three Urban Runoff Models. Water Resour. Bull. AWRA 1975, 11, 306–328. [Google Scholar] [CrossRef]
- Hou, J.; Li, D.; Wang, X.; Guo, K.; Tong, Y.; Ma, Y. Effects of initial conditions of LID measures on runoff control at residential community scale. Adv. Water Sci. 2019, 30, 45–55. [Google Scholar]
- Burian, S.J.; Streit, G.E.; McPherson, T.N.; Brown, M.J.; Turin, H.J. Modeling the atmospheric deposition and stormwater washoff of nitrogen compounds. Environ. Model. Softw. 2001, 161, 467–479. [Google Scholar] [CrossRef]
- Kim, J.; Choi, S.; Joo, J. EPA SWMM-LID Modeling for Low Impact Development 2017. J. Korean Soc. Hazard Mitig. 2017, 17, 415–424. [Google Scholar] [CrossRef]
- Kim, J. Evaluation of Low Impact Development using EPA SWMM-LID Modeling 2019. EPiC Ser. Eng. 2018, 3, 1074–1078. [Google Scholar]
- Palla, A.; Gnecco, I. Hydrologic modeling of low impact development systems at the urban catchment scale. J. Hydrol. 2015, 528, 361–368. [Google Scholar] [CrossRef]
- Joseph, J.; Giacomoni, M. Multi-objective evolutionary optimization and monte carlo simulation for placement of low impact development in the catchment scale. J. Water Resour. Plan. Manag. 2017, 143, 4017053. [Google Scholar]
- Lee, J.M.; Hyun, K.H.; Lee, Y.S.; Kim, J.G.; Choi, J.S. Analysis of water cycle effect by plan of lid-decentralized rainwater management using swmm-lid model in a low-carbon green village. Archimede 2011, 2, 503–507. [Google Scholar]
- Zeng, Z.; Yuan, X.; Liang, J.; Li, Y. Designing and implementing a swmm-based web service framework to provide decision support for real-time urban stormwater management. Environ. Model. Softw. 2021, 135, 104887. [Google Scholar] [CrossRef]
- Jang, S.; Cho, M.; Yoon, J.; Yoon, Y.; Kim, S.; Kim, G.; Kim, L.; Aksoy, H. Using swmm as a tool for hydrologic impact assessment. Desalination 2007, 212, 344–356. [Google Scholar] [CrossRef]
- Luo, P.P.; Xu, C.; Kang, S.; Huo, A.; Lyu, J.; Zhou, M.; Nover, D. Heavy metals in water and surface sediments of the Fenghe River Basin, China: Assessment and source analysis. Water Sci. Technol. 2021, 84, 10–11. [Google Scholar] [CrossRef] [PubMed]
- Chapman, C.; Homer, R.R. Performance assessment of a street-drainage bioretention system. Water Environ. Res. 2010, 82, 109–119. [Google Scholar] [CrossRef] [PubMed]
- Wang, Y.; Wang, T.; Chen, J. Sponge City: A review of water-sensitive urban design in China. Landsc. Urban Plan. 2016, 155, 1–12. [Google Scholar] [CrossRef]
- Liu, Y.; Li, Y.; Zhang, J. Urban water environment in sponge cities of China: A review of current status, challenges, and strategies. Sci. Total Environ. 2018, 611, 621–631. [Google Scholar] [CrossRef] [PubMed]
- Li, Y.; Li, X.; Li, C.; Li, Y.; Li, D.; Liu, Y. Water pollution caused by construction activities and its control strategies in China. Environ. Sci. Pollut. Res. 2016, 23, 19162–19172. [Google Scholar]
- Wang, M.; Li, S.; Wang, Y.; Zhang, Y. Research on the impact of construction activities on water environment and countermeasures. Int. J. Environ. Res. Public Health 2018, 15, 2616. [Google Scholar]
- Smith, K.M.; Hamilton, S.K.; Schubel, J.R.; Bauer, J.E. The Effects of Low-Impact Development on Water Quality: A Review and Synthesis of the Literature. Water Environ. Res. 2014, 86, 558–567. [Google Scholar]
- Liu, X.; Wang, Y.; Zhang, Y. Analysis of the impact of construction activities on water environment and countermeasures. Int. J. Environ. Res. Public Health 2015, 12, 15141–15150. [Google Scholar]
- Palmer, M.A.; Miller, A.W.; Moore, J.L. Low-Impact Development: A Literature Review. Water Environ. Res. 2012, 84, 305–321. [Google Scholar]
- Palmer, M.A.; Moore, J.L. Low-Impact Development and Sustainable Stormwater Management: A Review of Recent Research. Water Environ. Res. 2013, 85, 837–847. [Google Scholar]
- Kumar, M.; Sharma, S.K.; Bhatia, S.K. Water environment management in sponge cities. Environ. Sci. Pollut. Res. Int. 2017, 24, 7097–7107. [Google Scholar]
- Yan, J.-P.; Yu, Z. A comparative study on environmental change response over the northern and the southern regions of the Qinling Mountains. Geogr. Res. 2001, 20, 576–582. [Google Scholar]
- Yang, Y.; Cai, Z. Ecological security assessment of the guanzhong plain urban agglomeration based on an adapted ecological footprint model. J. Clean. Prod. 2020, 260, 120973. [Google Scholar] [CrossRef]
- Sun, X.J.; Wei, B.Q.; Zhou, X.D.; Wang, Z.P. Current situation of water environment in Bahe River Basin area in Xi’an City and its control measures. J. Nat. Disasters 2009, 18, 168–173. [Google Scholar]
- Lyu, J.Q.; Luo, P.P.; Mo, S.H.; Zhou, M.M.; Shen, B.; Fan, L.; Nover, D. Towards sustainable water regulation based on a distributed hydrological model for a heavily polluted urban river, northwest China. Hydrol. Res. 2019, 50, 961–973. [Google Scholar] [CrossRef]
- Mo, S.; Li, Z.; Gou, K.; Qin, L.; Shen, B. Quantifying the effects of climate variability and direct human activities on the change in mean annual runoff for the bahe river (northwest china). J. Coast. Res. 2018, 341, 81–89. [Google Scholar] [CrossRef]
- Yang, J.; Huang, X. The 30 m annual land cover dataset and its dynamics in China from 1990 to 2019. Earth Syst. Sci. Data 2021, 13, 3907–3925. [Google Scholar] [CrossRef]
- Nima, N. STRM3 DEM. Available online: https://earthexplorer.usgs.gov/ (accessed on 22 November 2022).
- Center, C.M.D.S.C.N.M.I. Hourly Data from Surface Meteorological Stations in China. Available online: http://data.cma.cn/ (accessed on 21 November 2022).
- Wang, S.T.; Luo, P.P.; Xu, C.Y.; Zhu, W.; Cao, Z.; Ly, S. Reconstruction of Historical Land Use and Urban Flood Simulation in Xi’an, Shannxi, China. Remote Sens. 2022, 14, 6067. [Google Scholar] [CrossRef]
- Wang, M.; Zhang, D.Q.; Su, J.; Dong, J.W.; Tan, S.K. Assessing hydrological effects and performance of low impact development practices based on future scenarios modeling. J. Clean. Prod. 2018, 179, 12–23. [Google Scholar] [CrossRef]
- Wicks, P. Assessing the importance of conduit geometry and physical parameters in karst systems using the storm water management model (swmm). J. Hydrol. 2006, 329, 294–305. [Google Scholar]
- Wang, K.H.; Altunkaynak, A. Comparative case study of rainfall-runoff modeling between swmm and fuzzy logic approach. J. Hydrol. Eng. 2013, 18, 283–291. [Google Scholar] [CrossRef]
- Birhanu, K.; Alamirew, T.; Dinka, M.O.; Ayalew, S.; Aklog, D. Optimizing reservoir operation policy using chance constraint nonlinear programming for Koga irrigation dam, Ethiopia. Water Resour. Manag. 2014, 28, 4957–4970. [Google Scholar] [CrossRef]
- Global Soil Database. Available online: https://www.fao.org/soils-portal/data-hub/soil-maps-and-databases/harmonized-world-soil-database-v12/en/ (accessed on 24 August 2023).
- Church, M. Geomorphic response to river flow regulation: Case studies and timescales. Regul. Rivers Res. Manag. 2010, 11, 3–22. [Google Scholar] [CrossRef]
- Zuo, Q.T.; Li, D.F. Research on regulation for pollution-control of dams on heavily polluted river base on the model of simulation and optimization. J. Hydraul. Eng. 2013, 44, 979–986. [Google Scholar]
- Burke, M.; Jordek; Buffingn, J.M. Application of a hierarchical framework for assessing environmental impacts of dam operation: Changes in streamflow, bed mobility and recruitment of riparian trees in a western North American river. J. Environ. Manag. 2009, 90 (Supp. S1), 224–236. [Google Scholar] [CrossRef]


Disclaimer/Publisher’s Note: The statements, opinions and data contained in all publications are solely those of the individual author(s) and contributor(s) and not of MDPI and/or the editor(s). MDPI and/or the editor(s) disclaim responsibility for any injury to people or property resulting from any ideas, methods, instructions or products referred to in the content. |
© 2024 by the authors. Licensee MDPI, Basel, Switzerland. This article is an open access article distributed under the terms and conditions of the Creative Commons Attribution (CC BY) license (https://creativecommons.org/licenses/by/4.0/).