Abstract
To explore how environmental factors affect the structure of plankton in urban rivers, we analyzed the Caowangjing River, an urban river that passes through Wuxi, to survey the water environmental factors and plankton population in different seasons. We identified 103 phytoplankton species belonging to eight phyla, with Chlorophyta, Bacillariophyta, and Cyanobacteria being the dominant groups. A total of 45 zooplankton species belonged to three classes, with Rotifera being the dominant class. Phytoplankton density was highest in the autumn, followed by the spring, and the lowest in the summer. Phytoplankton biomass, along with zooplankton density and biomass, exhibited seasonal declines. The average values of the Shannon–Wiener index, Pielou’s evenness index, and Margalef richness index were 3.58 ± 0.50, 0.72 ± 0.76, and 2.03 ± 0.31, respectively, indicating the Caowangjing River was mildly polluted based on a water quality evaluation. Redundancy analysis showed that turbidity, water temperature, and ammonia nitrogen are the key factors of phytoplankton community distribution, while water temperature, the permanganate index, and ammonia nitrogen are the key factors of zooplankton community distribution.
1. Introduction
Urban rivers, essential elements of urban ecological infrastructure, perform several ecological functions, such as flood control and drainage, the provision of water, and landscape recreation [1]. Unlike large natural rivers, urban rivers are characterized by their abundance, small watershed scale, and considerable anthropogenic impact [2]. Anthropogenic activities along rivers lead to the direct discharge of large quantities of pollutants into the water, a process that, in turn, alters the water’s physicochemical conditions. Phytoplankton and zooplankton are fundamental components of aquatic ecosystems [3], characterized by a wide distribution and a short life cycle. The structure of plankton communities can respond rapidly and complexly to environmental changes [4] and thus be used as an excellent biological indicator of water quality and trophic states [5,6]. Changes in the concentration and form of water environmental factors will seriously affect the growth of plankton and the succession of community structures. For example, high concentrations of nitrogen and phosphorus lead to excessive phytoplankton proliferation [7,8], and ammonium is more accessible for use by cyanobacteria than nitrate [9]. The discharge of many pollutants decreases the diversity and stability of the plankton community structure in urban rivers, leading to an abnormal change in the structure and function of an aquatic ecosystem and the apparent deterioration of the water environment, ultimately triggering the eutrophication of water bodies [10,11]. Globally, urban black and odorous water and eutrophication have become the most pervasive water quality challenges [12,13]. Therefore, focusing on the spatial and temporal variations in plankton communities in urban rivers and their relationship with environmental factors is critical for assessing water quality conditions and controlling eutrophication and harmful algal blooms.
Some researchers have focused on the characteristics of the structure of plankton communities in urban rivers, such as Tang et al. [14], who modeled the relationship between plankton communities and environmental factors in urban rivers in Guangzhou. Li et al. [15] investigated phytoplankton and environmental factors and assessed the trophic state of rivers in northeastern China. However, currently, water ecological investigations regarding urban rivers are mainly concentrated on small-scale cities. Wuxi, a densely populated and highly urbanized city in China, has 5569 urban rivers, with a total water area of 243.77 km2 [16], yet pertinent research data are scarce. Yu et al. [17] studied the community structure of crustacean plankton in the Qinshui River, and Hao [18] investigated the community structure of phytoplankton in the Liangxi River. These studies primarily focused on the characteristics of plankton succession. However, few studies have evaluated water quality through changes in plankton community structure, leading to a poor understanding of the ecological health of Wuxi’s urban rivers. Therefore, in this research, we used the Caowangjing River as a case study to (1) investigate water quality indicators and plankton in different sections and seasons, (2) analyze the spatial and temporal changes in plankton community structure and identify the key environmental factors affecting its characteristics, and (3) assess water quality based on the analysis results, thereby providing a reference for evaluating water ecology health in urban rivers.
2. Materials and Methods
2.1. Investigated Area and Sampling Sites
The Caowangjing River originates from the Beijing–Hangzhou Grand Canal in the east and merges with Wuli Lake in the west, serving a crucial function in linking the lateral water system between the Grand Canal and Taihu Lake. In Liangxi District, this river has a total length of around 3.7 km and a width ranging from 20 to 30 m. Numerous tributaries exist along the northern and southern banks of Caowangjing. Due to the unstable water quality of its tributaries, the Caowangjing River is vulnerable to the effects of the surrounding water system. In addition, sluice construction has resulted in weak hydrodynamic conditions, limiting this water body’s ability to dilute, degrade, and transform pollutants. As an urban river, the Caowangjing River flows through industrial parks, residential districts, and farmland, with each stretch being subject to various degrees of human impacts and pressure.
We established five typical sampling sites, designated as S5 (120°33′ E, 31°53′ N), S4 (120°33′ E, 31°52′ N), S3 (120°32′ E, 31°52′ N), S2 (120°31′ E, 31°52′ N), and S1 (120°30′ E, 31°52′ N), from upstream to downstream, based on the unique characteristics of the water environment and shoreline situation of the Caowangjing River (Figure 1). As shown in the figure, sampling site S1 is adjacent to Li Lake, which is the confluence of several tributaries. A dense industrial area surrounds S2 and S3. S4 is surrounded by an industrial area in the north and a residential area in the south, both characterized by frequent human activity. S5 is adjacent to the Beijing–Hangzhou Canal, which is equipped with a sluice gate and pumps to regulate the water level of the river. In this study, river water quality and plankton surveys were carried out in the spring (March, April, and May), summer (June, July, and August), and autumn (September, October, and November) in 2023, with sampling and analysis carried out every 1 month. Each sampling point was repeated three times, and the average value was calculated for data analysis.
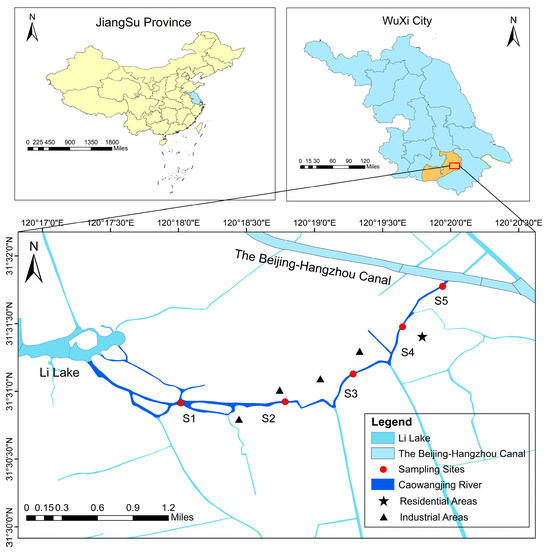
Figure 1.
Study area and location of environmental and biological monitoring samples.
2.2. Sample Collection and Determination
2.2.1. Determination of Water Quality Indicators
A multi-parameter water quality analyzer was employed to measure hydrogen ion concentration (pH), water temperature (WT), electrical conductivity (EC), and turbidity (T) on site. Simultaneously, water samples were taken to our laboratory for further detection. We used an electrochemical probe method to determine the amount of dissolved oxygen (DO) in the water [19], Nessler’s reagent spectrophotometry method to determine the amount of ammonia nitrogen (NH4+-N) in the water [20], and the spectrophotometric method to determine the amount of chlorophyll a (Chla) in the water [21]. The water quality permanganate index (CODMn) was determined with reference to national standards [22]. The chemical oxygen demand (COD) of water was determined using the dichromate method [23], and the total phosphorus (TP) content of water was determined using the ammonium molybdate spectrophotometric method [24].
2.2.2. Phytoplankton Collection and Identification
Water samples were collected from the upper, middle, and lower layers using a 5 L water sampler and mixed well. Then, a 1000 mL water sample was taken using a sampling cup and transferred to a sampling bottle for the analysis of phytoplankton. After being mixed well, 10 mL of 1% Lugol’s solution was added to the 1000 mL phytoplankton sample for fixation. The sample was shaken well and placed on a horizontal laboratory bench to let it settle for 48 h. After the sample had settled, the excess supernatant was removed using a siphon, and the final sample was concentrated to 30 mL. For phytoplankton counting, 0.1 mL of the well-shaken sample was pipetted into a phytoplankton-counting chamber. The phytoplankton species were counted three times under a microscope (Olympus Corporation, Tokyo, Japan) at 400× magnification, with 100 fields of view randomly selected for each count. The final data were the average of the three counts. Species identification was conducted based on references [25,26]. Microscope images of Pediastrum simplex, Aulacoseira granulata, and Cosmarium laeve species are shown in Figure 2.
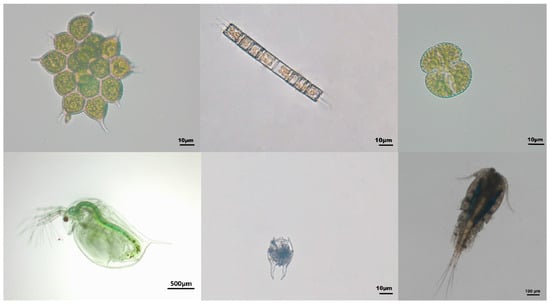
Figure 2.
Microscope images of some plankton species. (From top left to bottom right: Monactinus simplex, Aulacoseira granulata, Cosmarium spp., Daphnia magna, Brachionus farficula, and Mesocyclops leuckarti).
2.2.3. Zooplankton Collection and Identification
Water samples were collected from the upper, middle, and lower layers using a 5 L water sampler and mixed well at the sampling site. Then, each well-mixed water sample was filtered through a 300-mesh filter (pore size: 48 μm), and a total of 5 L of well-mixed river water was filtered. The filtrate was then brought to a final volume of 50 mL by adding 2 mL of formaldehyde and then mixed. Before identification, the samples were mixed well again, and 5 mL was taken each time and added to the zooplankton-counting chamber. Identification and counting were performed under a microscope (Olympus Corporation, Tokyo, Japan) at 40× magnification, wherein the counting field was able to cover the entire zooplankton-counting chamber. Each sample was counted three times, and the final result was the average of these counts. Species were identified based on references [27,28,29]. Microscope images of Daphnia magna, Brachionus farficula, and Mesocyclops leuckarti species are shown in Figure 2.
2.3. Data Analysis
The following formula was used to calculate phytoplankton density:
where N denotes the number of cells per liter of water sample (cells/L); A denotes the area of the counting frame (mm2); vs. denotes the volume of the concentrated water sample (mL), generally 30 mL or 50 mL; n denotes the number of counts; Ac denotes the counting area (mm2), with A being 400 mm2; and Va denotes the volume of the counting frame (mL), generally 0.1 mL.
The following formula was used to calculate zooplankton density:
where N denotes zooplankton density (ind/L); n denotes the number of zooplankton under the microscope at the time of counting; V1 denotes the constant volume (mL), usually 30 mL or 50 mL; V2 denotes the volume of the sample injected into the counting frame (mL), 5 mL; and V3 indicates the volume of the filtered water sample in the field (L), i.e., 5 L. The biomass is the individual biomass of zooplankton multiplied by the total number of zooplankton.
The dominance value (Y), the Shannon–Wiener diversity index (H′), Pielou’s evenness index (J), and the Margalef richness index (D) were used to characterize plankton community structure and evaluate river status. The calculation formula is as follows:
where ni and N are the number of species i and the total number of all kinds of species in the sample; fi is the occurrence frequency of species i; pi is calculated using the formula ni/N, representing the relative proportion of species i; and S represents the number of species in the sample. A species was considered dominant if Y was higher than or equal to 0.02 [30].
Eight characteristic indicators of plankton community structure were identified, comprising zooplankton density (ZD), phytoplankton density (PD), zooplankton biomass (ZB), phytoplankton biomass (PB), Cyanobacteria density, Bacillariophyta density, Chlorophyta density, and Rotifera density, as well as ten physicochemical indexes, including WT, pH, and DO. Data that did not conform to a normal distribution initially, except pH, were subjected to logarithm conversion. A Pearson correlation analysis of plankton and environmental parameters was conducted utilizing SPSS 26 software. Canoco 5.0 software was used to conduct detrended correspondence analysis (DCA) and redundancy analysis (RDA) between the dominant plankton species and environmental variables.
3. Results
3.1. Seasonal Variation in Environmental Factors
Table 1 shows the seasonal variation trend of environmental factors in the Caowangjing River in 2023. During the study period, there were no significant differences in the NH4+-N concentration, TP concentration, CODMn concentration, DO concentration, WT, and pH between seasons (ANOVA, p > 0.05). Among the seasons, the spring and summer NH4+-N concentrations, TP concentrations, and CODMn concentrations were higher than those in the autumn, whereas the DO concentration was lower than that in the autumn, thereby showing an opposite pattern with respect to the indexes of nutrient and organic pollution degree. The monthly average DO concentration varied from 6.07 ± 0.57 to 6.48 ± 0.66 mg/L, indicating the Caowangjing River has a strong water self-purification capacity. The WT was 18.74 ± 3.87 °C, 28.45 ± 2.03 °C, and 21.93 ± 5.28 °C in the spring, summer, and autumn, respectively. The pH range of the Caowangjing River was 5.89 ± 0.44–7.22 ± 1.40, indicating it was an acidic water body in the summer. There were significant seasonal differences in EC and T during the study period, with concentrations being significantly higher in the spring than in the other seasons (ANOVA, p < 0.05).

Table 1.
Seasonal variation in water quality indicators.
3.2. Plankton Species Composition and Dominant Species
In our study, a total of 103 species of phytoplankton from eight phyla were identified. Chlorophyta, Bacillariophyta, and Cyanobacteria were the most dominant, with Chlorophyta accounting for 49 species (47.57% of the total), followed by Bacillariophyta (18 species, or 17.48%) and Cyanobacteria (15 species, or 14.56%). The number of species was largest in the summer, followed by autumn, and lowest in the spring (Figure 3). Regarding spatial distributions, species richness decreased in the following order: S1 > S2 > S3 > S5 > S4; this result indicates a greater abundance of species downstream. Chlorophyta and Bacillariophyta were dominant at all sampling sites. Thirteen phytoplankton species were identified, belonging to six phyla, with dominance values ranging from 0.020 to 0.321. Three dominant species belonged to Chlorophyta and Cyanobacteria; two dominant species belonged to Cryptophyta, Bacillariophyta, and Xanthophyta; and one dominant species belonged to Euglenophyta. The dominant phytoplankton species varied greatly in the different seasons (Table 2), with Microcystis spp., Cyclotella spp., Tribonema minus, and Chlorella vulgaris being the common dominant species. Chlamydomonas braunii (0.192) species were the most dominant in the spring, while Microcystis spp. (0.264 and 0.321) dominated in the summer and autumn. Microscope images of the dominant phytoplankton species Microcystis spp. are shown in Figure 4.
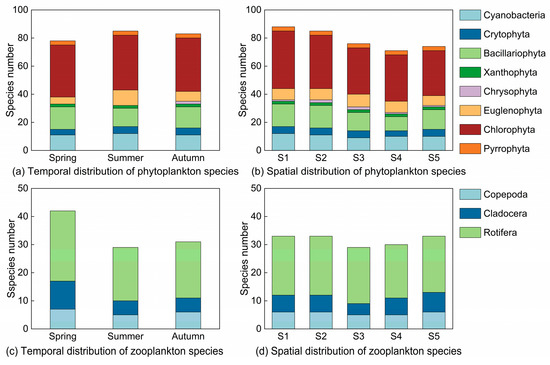
Figure 3.
Plankton species structure across sampling sites in three seasons.
Table 2.
Distributions of dominant phytoplankton and zooplankton species (data source: calculated based on the dominance value formula).
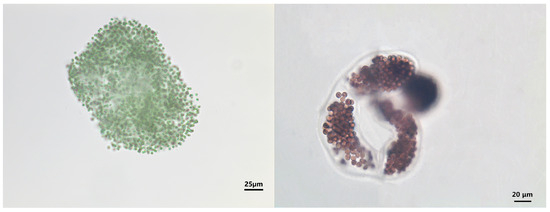
Figure 4.
Microcystis spp., a dominant phytoplankton species in the Caowangjing River.
In total, 45 zooplankton species from three classes were identified: twenty-eight from Rotifera, ten from Cladocera, and seven from Copepoda. Rotifera accounted for the highest proportion, representing 62.22% of all species. The number of zooplankton varied significantly throughout the seasons (p < 0.05) (Figure 3). Species richness peaked at 42 in the spring, followed by 29 in the summer and autumn, with Rotifera being the dominant species. The spatial distribution of species richness was relatively consistent across sampling sites, with Rotifera being the dominant group. The species richness at S1, S2, and S5 was comparatively high, each having 33 species, but that at S3 was the lowest (29 species). Thirteen dominant species from three classes were identified in all seasons, with dominance values ranging from 0.023 to 0.367 (Table 2). There were eight dominant Rotifera species, three dominant Copepoda species, and two dominant Cladocera species. Nauplius, Brachionus angularis, Brachionus budapestiensis, Polyarthra trigla, and Keratella cochlearis were the common dominant species in all seasons, with Nauplius having the highest dominance value (0.160 to 0.367). Microscope images of the dominant zooplankton species Nauplius and Keratella cochlearis are shown in Figure 5.
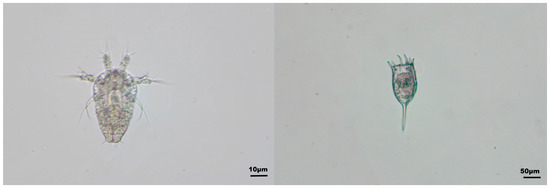
Figure 5.
The dominant species of zooplankton in the Caowangjing River, Nauplius (left) and Keratella cochlearis (right).
3.3. Spatial and Temporal Distribution of Plankton Density and Biomass
The density of phytoplankton varied from 1.10 to 10.47 × 10⁶ cell·L−1, with an average of 6.11 × 10⁶ cell·L−1. The highest density was recorded in autumn (33.38 × 10⁶ cell·L−1), and the lowest was found in the summer (26.93 × 10⁶ cell·L−1) (Figure 6). Chlorophyta accounted for 40.17% of the total density in the spring. In contrast, Cyanobacteria was predominant in the summer and autumn (accounting for 41.46% and 49.54%, respectively). The spatial distribution of density corresponded to the following order: S1 > S2 > S3 > S5 > S4; this order is consistent with the species richness pattern. The density of Chlorophyta was highest at S4. In contrast, the density of Cyanobacteria was highest at the remaining sampling sites. The phytoplankton biomass varied from 1.87 to 33.39 mL·L−1, with an average of 11.78 mL·L−1. Biomass was highest in the spring (86.98 mg·L−1) and lowest in autumn (33.12 mg·L−1), closely corresponding to the proportion of Chlorophyta. Chlorophyta were the dominant group in the spring, accounting for 56.67% of the total phytoplankton. In the summer, the distribution of Euglenophyta, Chlorophyta, and Bacillariophyta was equitable, with values of 28.41%, 28.13%, and 26.30%, respectively. In autumn, Bacillariophyta became dominant, accounting for 40.03% of all phytoplankton. The spatial distribution of biomass increased when moving from upstream to downstream, with Chlorophyta dominating at sites S1, S2, and S4 and Bacillariophyta being dominant at sites S3 and S5.
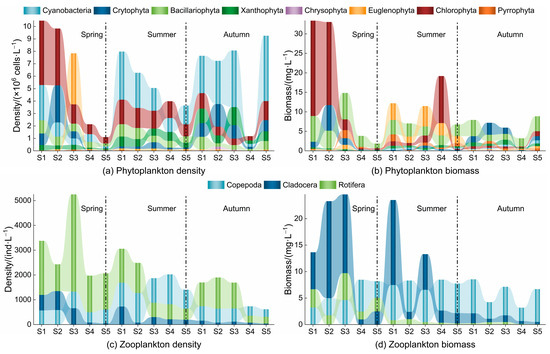
Figure 6.
Spatial and seasonal variation in plankton density and biomass.
For zooplankton, the densities varied from 617.4 to 5248.88 ind·L−1, with an average of 2171.91 ind·L−1. Significant seasonal differences (p < 0.05) in density were observed, with a peak in the spring (78.16 ind·L−1) and a trough in autumn (29.80 ind·L−1) (Figure 6). Rotifera dominated the zooplankton community in the spring and autumn, accounting for 67.07% and 57.27% of the total, respectively. However, Copepoda prevailed in the summer, comprising 47.25% of the total. The spatial density pattern corresponded to the following order: S3 > S1 > S2 > S4 > S5; it was primarily influenced by Rotifera, followed by Copepoda. The highest recorded density of Rotifera was 62.85% at S3. Zooplankton biomass ranged from 3.19 to 24.58 mL·L−1, averaging 11.59 mL·L−1. The difference in biomass between seasons was also significant (p < 0.05), and the trend aligned with the density. Cladocera dominated the spring zooplankton community, accounting for 55.78%. Copepoda dominated in the summer and autumn, accounting for 49.07% and 79.54%, respectively. The spatial biomass pattern corresponded to an order of S1 > S3 > S2 > S5 > S4, with Rotifera predominating at sites S1, S2, and S3, while Copepoda was prevalent at sites S4 and S5.
3.4. Diversity Index Variation Across Different Sections and Seasons
The Shannon–Wiener diversity index (H′) for phytoplankton varied from 3.17 to 4.49 during the investigation, with an average of 3.93. Pielou’s evenness index (J) ranged from 0.56 to 0.80, with an average of 0.70. The Margalef richness index (D) ranged from 1.59 to 2.47, with an average of 2.16. The H′ and D of phytoplankton during spring were significantly lower than those in the summer and autumn (Figure 7, p < 0.05). The diversity indices across several sampling sites exhibited no significant differences (p > 0.05). The spatial distribution patterns of H′ and J exhibited similarity, with the size orders of H′ and J being S4 > S5 > S1 > S2 > S3 and S4 > S5 > S2 > S1 > S3, respectively. For D, the order was S1 > S2 > S5 > S4 > S3 (Figure 8).
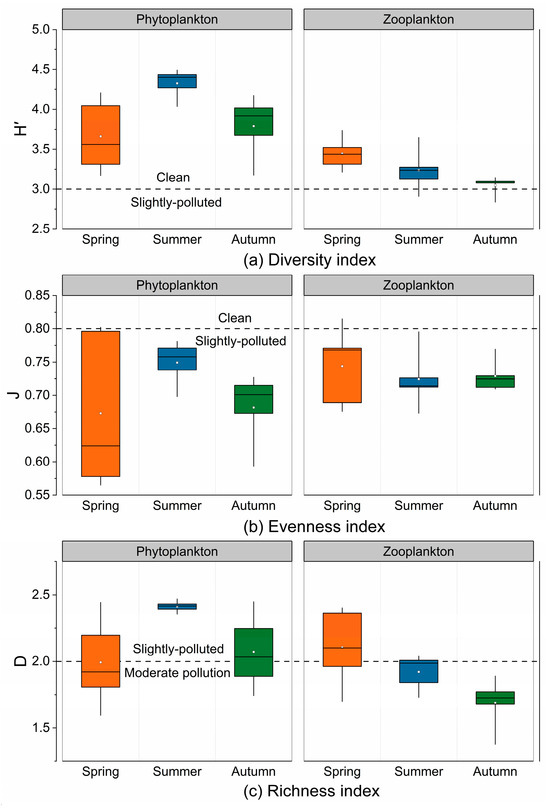
Figure 7.
Seasonal variation in plankton diversity indices.
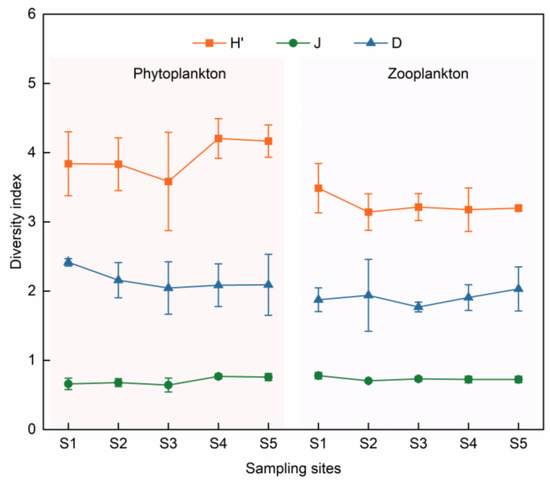
Figure 8.
The spatial distribution of plankton diversity indices.
The Shannon–Wiener diversity index (H′) for zooplankton varied from 2.84 to 3.74 during the survey period, with an average of 3.24. Pielou’s evenness index (J) ranged from 0.67 to 0.82, with an average of 0.73. The Margalef richness index (D) ranged from 1.38 to 2.40, with an average of 1.90. The seasonal differences in H′ and D were significant (p < 0.05), with the peak levels occurring in the spring and the lowest levels occurring in autumn (Figure 4). The spatial distributions of H′ and J were similar across sampling points, with an order of S1 > S3 > S5 > S4 > S2, whereas D was distributed in the following order: S5 > S4 > S2 > S1 > S3 (Figure 8).
3.5. Environmental Factors Associated with Community Construction
The Pearson correlation analysis results show (Figure 9) that the density of Chlorophyta is significantly positively correlated with COD (p < 0.05). Both zooplankton density and biomass had a significant positive correlation with EC and CODMn (p < 0.05). The results of the correlation analysis between phytoplankton and environmental factors varied among different phyla, with the density of Chlorophyta exhibiting a significant positive correlation with Chla (p < 0.05). The density of Cyanobacteria exhibited a significant positive correlation with WT (p < 0.05), indicating that an elevated WT facilitated the proliferation of Cyanobacteria. The density of Bacillariophyta exhibited a significant positive correlation with TP (p < 0.05), suggesting that phosphorus substantially influences Bacillariophyta.
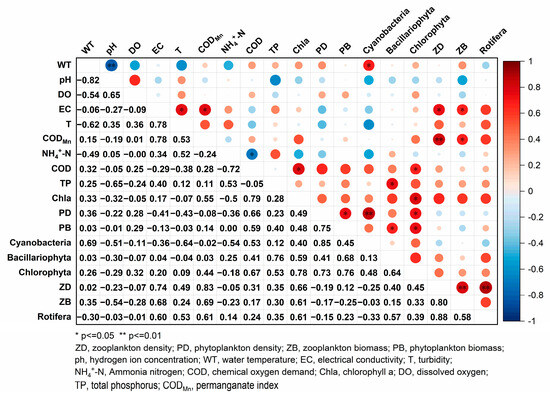
Figure 9.
Correlation coefficient matrix for plankton composition and environmental factors.
The results of DCA, in which dominant plankton species density was used as the response variable, showed that the ordination axis values were all below 3.0, suggesting that RDA could more effectively elucidate the relationship between dominant species and environmental factors.
The RDA diagram of the dominant phytoplankton species with respect to environmental factors indicated that the eigenvalues of the first two axes were 0.287 and 0.196, accounting for 58.24% of community variability (Figure 10). T, DO, TP, and Chla positively correlated with axis I. DO, T, CODMn, NH4+-N, and TP had positive correlations with axis II, with T demonstrating the highest positive correlation (0.9253), followed by NH4+-N (0.6228). In contrast, WT negatively correlated with axis II (−0.6190). The dominant species were mainly located in Quadrants I and IV and positively correlated with TP, DO, Chla, and WT. Chla and WT were also positively correlated while also being negatively correlated with T, CODMn, and NH4+-N. Cyclotella spp. showed a strong positive correlation with T and NH4+-N, whereas Planktothrix sp., Dolichospermum spp., and Tribonema affine demonstrated a strong positive correlation with WT. Our studies indicated that T, WT, and NH4+-N were the key environmental factors influencing which phytoplankton species was dominant in the Caowangjing River.
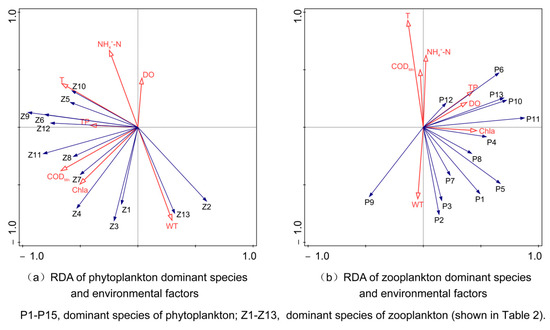
Figure 10.
RDA of dominant plankton species and environmental factors.
The RDA diagram of the dominant zooplankton species with respect to environmental factors indicated that the eigenvalues of the first two axes were 0.373 and 0.234, collectively accounting for 69.44% of community variability (Figure 10). WT exhibited a positive correlation with axis I. T, CODMn, NH4+-N, TP, and Chla negatively correlated with axis I. CODMn exhibited the highest positive correlation, amounting to 0.6655, followed by T, with a correlation of 0.6586. DO, T, and NH4+-N positively associated with axis II, with NH4+-N demonstrating the most substantial positive correlation: 0.5904. WT, CODMn, and Chla negatively correlated with Axis II, with WT demonstrating the greatest negative correlation: 0.7140. The dominant species were mainly distributed in the second and third quadrants, exhibiting positive correlations with T, TP, CODMn, Chla, and WT while also demonstrating negative correlations with DO and NH4+-N. Microcyclops varicans and Keratella valga had a strong positive correlation with WT, while Moina macrocopa and Polyarthra trigla demonstrated a positive correlation with CODMn. Additionally, Asplanchna priodonta and Filinia longiseta showed a strong positive correlation with NH4+-N. In summary, WT, CODMn, and NH4+-N were the key environmental factors influencing the dominant zooplankton species in the Caowangjing River.
4. Discussion
4.1. Spatial and Seasonal Dynamics of Plankton Communities
Throughout the study period, the phytoplankton species composition of the Caowangjing River was dominated by Chlorophyta, followed by Bacillariophyta and Cyanobacteria. The species count in the summer exceeded that for the spring and fall, consistent with findings from other urban-river studies [31,32]. Rotifera is the dominant species of zooplankton, which is small in size and has a brief life cycle and a high reproductive rate [33]. They can rapidly adapt to changes in the physicochemical environment of water and frequently appear in river and lake habitats [34,35]. Seasonal variations in plankton density and biomass were observed in this study. Phytoplankton density peaked in autumn (33.38 × 10⁶ cell·L−1), followed by the spring (31.38 × 10⁶ cell·L−1), and was lowest in the summer (26.93 × 10⁶ cell·L−1), showing a high imbalance with respect to biomass. Chlorophyta and Bacillariophyta have a larger mass of single cells than Cyanobacteria [36], and this is the main factor determining biomass. Attributable to the feeding relationship, zooplankton density and biomass decreased concomitantly with the seasonal variation in phytoplankton biomass. During the spring, abundant sunlight, suitable temperatures, and increased nutrient levels in the river facilitated the growth of Chlorophyta and Bacillariophyta, which, in turn, supplied sufficient food for zooplankton. In particular, Rotifera prefers to feed on Chlorophyta, leading to the former’s proliferation in the spring [37]. In the summer, Cyanobacteria constitute the dominant phylum, but their low nutritional value and toxin production adversely affect zooplankton growth [38]. Nonetheless, some Copepoda and Cladocera species, such as Moina, can graze on and digest filamentous cyanobacteria while sustaining high biomass levels.
There were noticeable spatial differences in the density and biomass of plankton, which were higher at all the sampling sites, with an increasing trend from upstream to downstream. This finding may relate to the river reaches’ varying geographic locations and watershed habitats [39]. Sampling site S1 was diverse in zooplankton species, with a relatively uniform density of various species, potentially attributable to its being located near the confluence of tributaries. The two tributaries flowing through the residential area significantly enhance the nutrients of this water body, thereby increasing levels of organic debris and zooplankton algae. The upstream section of the Caowangjing River intersects with the Beijing–Hangzhou Canal, and the introduction of clean water accelerates the flow rate when the water gates are opened at S5. Yu et al. [40] experimentally showed that a rapid flow may be the primary factor leading to a decrease in Cyanobacteria density and an increase in Bacillariophyta density. Conversely, the industrial parks at S2, S3, and S4 had high population densities. A great deal of exogenous organic matter entered the river via surface runoff, resulting in an uneven distribution of plankton species and a corresponding increase in plankton density and biomass, suggesting that the water body in this region was polluted to some degree.
The plankton diversity index helps researchers evaluate the stability of species composition, abundance distribution uniformity, and community structure characteristics [41]. Increases in H′, J, and D are primarily considered markers of nutritional status improvement and community stability [42,43]. Our results show that H′ ranged from 2.84 to 4.49. At the same time, J consistently exceeded 0.3 at all sampling sites, signifying rich planktonic biodiversity in the Caowangjing River and a more equitable distribution of individual species. Our thorough assessment revealed that the plankton community structure in the Caowangjing River was relatively stable.
4.2. Influence of Environmental Factors on Communities
Multiple environmental factors influence plankton community structure. Sun et al. [44] identified nitrate nitrogen, WT, total nitrogen (TN), and total suspended solids as the main factors affecting the phytoplankton communities in rivers in Changzhou. Zhang et al. [45] proved that pH, NH4+-N, COD, and TP were the major environmental factors influencing the phytoplankton community in the Majiagou River, which flows through Harbin. Mutethya et al. [46] found that TN, TP, pH, DO, Chla, and EC significantly impacted the structure of the zooplankton community in rivers in Haikou. Our RDA analysis indicated that T, WT, and NH4+-N were the key environmental factors influencing the distribution of the phytoplankton community. Accordingly, WT, CODMn, and NH4+-N were the critical environmental factors affecting the distribution of the zooplankton population. The results indicate that variations in plankton community structure in different water bodies are influenced by different environmental factors, a phenomenon that may be related to the habitat conditions of each river. Rosas et al. [47] found that phytoplankton growth tends to be slower in highly turbid rivers due to high anthropogenic activities. This is because turbidity greatly affects phytoplankton photosynthesis [48]. In this study, turbidity was negatively correlated with the most dominant phytoplankton species. During the rainy season, sediment necessary for the water body substrate is prone to turbulence and re-suspension, resulting in high-turbidity regions that restrict phytoplankton photosynthesis. Simultaneously, most urban rivers are gate-controlled and were subject to frequent water level regulation for flood control during the study period. The reduced phytoplankton density in the spring and summer observed in this study may be associated with this phenomenon. Therefore, the frequency of water level regulation can be appropriately adjusted to ensure flood control while also considering the long-term management and maintenance of urban gate-controlled rivers. CODMn is a vital target reflecting the extent of water body nitrification, which indirectly influences zooplankton community composition by altering the nature of food resources, such as algae [49]. In our investigation, we identified a positive correlation between CODMn and Brachionus spp. This genus serves as an indicator species for eutrophic water bodies. Nonetheless, other studies have shown that elevated CODMn concentrations have an inhibitory effect that impedes the proliferation of Rotifera and Cladocera, which inhabit clear-water environments [50]. These findings indicate that zooplankton may face survival challenges in rivers and lakes with substantial organic pollution [51,52].
Water temperature significantly affects phytoplankton growth and community composition [53]. Different algae have different water temperature requirements [54,55]. This study revealed a high positive correlation between Cyanobacteria and WT, reflecting their optimal growth in warm aquatic environments, particularly within 25–35 °C [56]. In contrast, Bacillariophyta and Cryptophyta mainly inhabit cold-water environments [57]. WT significantly influences zooplankton metabolism [58]: various zooplankton exhibit different temperature tolerances, resulting in seasonal succession within the community structure. In this study, we found a favorable correlation between the dominant species of Cladocera and Copepoda and water temperature. Favorable temperatures enhance the production and predation rates of large filter-feeding zooplankton (such as Daphnia) [59]. This may explain the seasonal peaks in the density and biomass of these two zooplankton species over the summer. The RDA ordination diagram showed that the most dominant phytoplankton species was negatively correlated with ammonia nitrogen, indirectly influencing the zooplankton community via the food chain. Ammonia nitrogen serves as a directly utilizable nitrogen supply for algae, and numerous studies have demonstrated its substantial impact on algal growth [60,61]. The diminished ammonia-n concentration in the Caowangjing River during high-temperature periods may result from nitrogen consumption by phytoplankton multiplication. Nitrogen in urban rivers mainly originates from anthropogenic activities, including domestic sewage and industrial wastewater discharge, nitrogen fertilizer leaching, and surface runoff [62,63]. High levels of ammonia nitrogen can impede the proliferation of algae and Rotifera [64,65] and may result in fish mortality [66], inflicting significant harm to the ecosystem. In conclusion, regulating nitrogen input and mitigating organic pollution are essential strategies for diminishing eutrophication and safeguarding the health and stability of aquatic ecosystems.
4.3. Water Quality Assessment
Plankton community structure is a significant indication of water quality. A dominant Bacillariophyta population often signifies a mesotrophic water body, whereas Chlorophyta and Cyanobacteria predominantly thrive in eutrophic environments [67]. The dominant plankton species identified in the Caowangjing River, including Microcystis spp., Chlorella vulgaris, Cyclotella spp., Brachionus angularis, Brachionus budapestiensis, and Keratella cochlearis, are all highly pollutant-tolerant species [68,69]. Consequently, it was initially determined that the Caowangjing water body is categorized as moderately eutrophic water. The biodiversity index can be used to indicate water quality, and several researchers have examined water quality based on this metric [70,71,72]. In this study, we assessed the water quality of the Caowangjing River using the phytoplankton diversity index (Table 3), concluding that the water was mildly polluted. According to the water quality evaluation standard [73], all water quality indicators in the other seasons met the requirements for Class III water quality, except for NH4+-N in the spring, for which the Class IV water quality requirements were met. Consequently, the overall water quality of the Caowangjing River was between Class III and Class IV. The evaluation of the water quality of the Caowangjing River using the above two evaluation methods revealed similar results, both indicating that the water in this river is mildly polluted. Based on historical data [74], the Caowangjing River has transitioned from being heavily polluted to lightly polluted, suggesting an overall improvement in water quality; nonetheless, the middle reaches remain moderately polluted. This finding mainly pertains to the impact of human disturbance, including the aggregation of industrial zones, residential pollution emissions, seasonal agricultural activities, and other forms of non-point-source pollution, which contribute to river water pollution. It is necessary to strengthen the monitoring of this river and carry out further river management work.
Table 3.
Assessment standards of diversity indexes [70,71,72].
5. Conclusions
(1) We elucidated the characteristics of the spatial and seasonal dynamics of the plankton community in the Caowangjing River. We identified 103 phytoplankton species from eight phyla, predominantly Chlorophyta, Bacillariophyta, and Cyanobacteria. There are 45 species of zooplankton distributed among these three phyla, with Rotifera being the dominant class.
(2) The phytoplankton community distribution in autumn was less similar to that in the spring and summer, and the primary environmental factors that affected the structure of the phytoplankton community were T, WT, and NH4+-N. There was a significant seasonal difference in the distribution of the zooplankton community, with WT, CODMn, and NH4+-N identified as the primary environmental factors influencing this distribution.
(3) With the rise in temperature and the onset of the rainy season, local river managers should adjust the frequency of water level regulation and control nutrient discharges into the Caowangjing River. Doing so will radically reduce the input of pollutants from N sources and thus reduce the eutrophication level of the Caowangjing River.
Author Contributions
Conceptualization, X.W. and X.H.; methodology, X.H.; writing—original draft preparation, B.X.; writing—review and editing, B.X. and K.X.; visualization, B.X.; supervision, X.W. All authors have read and agreed to the published version of the manuscript.
Funding
This research was funded by the Wuxi Science and Technology Development Fund under grant number M20221002.
Data Availability Statement
Data are available upon request from the authors.
Conflicts of Interest
Author Xiaofeng Huang was employed by the company Wuxi Taihu Lake Remediation Co., Ltd. The remaining authors declare that the research was conducted in the absence of any commercial or financial relationships that could be construed as a potential conflict of interest.
References
- Savio, D.; Sinclair, L.; Ijaz, U.Z.; Parajka, J.; Reischer, G.H.; Stadler, P.; Blaschke, A.P.; Blöschl, G.; Mach, R.L.; Kirschner, A.K. Bacterial diversity along a 2600 km river continuum. Environ. Microbiol. 2015, 17, 4994–5007. [Google Scholar] [CrossRef] [PubMed]
- Zhang, H.; Zong, R.; He, H.; Liu, K.; Yan, M.; Miao, Y.; Ma, B.; Huang, X. Biogeographic distribution patterns of algal community in different urban lakes in China: Insights into the dynamics and co-existence. J. Environ. Sci. 2021, 100, 216–227. [Google Scholar] [CrossRef] [PubMed]
- Manickam, N.; Bhavan, P.S.; Santhanam, P.; Muralisankar, T.; Kumar, S.D.; Balakrishnan, S.; Ananth, S.; Devi, A.S. Phytoplankton biodiversity in the two perennial lakes of Coimbatore, Tamil Nadu, India. Acta Ecol. Sin. 2020, 40, 81–89. [Google Scholar] [CrossRef]
- Kim, H.G.; Hong, S.; Kim, D.-K.; Joo, G.-J. Drivers shaping episodic and gradual changes in phytoplankton community succession: Taxonomic versus functional groups. Sci. Total Environ. 2020, 734, 138940. [Google Scholar] [CrossRef]
- Guo, C.; Liu, H.; Zheng, L.; Song, S.; Chen, B.; Huang, B. Seasonal and spatial patterns of picophytoplankton growth, grazing and distribution in the East China Sea. Biogeosciences 2014, 11, 1847–1862. [Google Scholar] [CrossRef]
- Rosińska, J.; Kozak, A.; Dondajewska, R.; Gołdyn, R. Cyanobacteria blooms before and during the restoration process of a shallow urban lake. J. Environ. Manag. 2017, 198, 340–347. [Google Scholar] [CrossRef]
- Li, Y.; Jin, H.; Chen, J.; Wang, D.; Yang, Z.; Wang, B.; Zhuang, Y.; Wang, R. Nitrogen removal through sediment denitrification in the Yangtze Estuary and its adjacent East China Sea: A nitrate limited process during summertime. Sci. Total Environ. 2021, 795, 148616. [Google Scholar] [CrossRef]
- Carpenter, S.R. Phosphorus control is critical to mitigating eutrophication. Proc. Natl. Acad. Sci. USA 2008, 105, 11039–11040. [Google Scholar] [CrossRef]
- Paerl, H.W.; Xu, H.; McCarthy, M.J.; Zhu, G.; Qin, B.; Li, Y.; Gardner, W.S. Controlling harmful cyanobacterial blooms in a hyper-eutrophic lake (Lake Taihu, China): The need for a dual nutrient (N & P) management strategy. Water Res. 2011, 45, 1973–1983. [Google Scholar] [CrossRef]
- Wu, T.; Qin, B.; Brookes, J.D.; Yan, W.; Ji, X.; Feng, J. Spatial distribution of sediment nitrogen and phosphorus in Lake Taihu from a hydrodynamics-induced transport perspective. Sci. Total Environ. 2019, 650, 1554–1565. [Google Scholar] [CrossRef]
- Sabater-Liesa, L.; Ginebreda, A.; Barceló, D. Shifts of environmental and phytoplankton variables in a regulated river: A spatial-driven analysis. Sci. Total Environ. 2018, 642, 968–978. [Google Scholar] [CrossRef] [PubMed]
- Foden, J.; Devlin, M.J.; Mills, D.K.; Malcolm, S.J. Searching for undesirable disturbance: An application of the OSPAR eutrophication assessment method to marine waters of England and Wales. Biogeochemistry 2011, 106, 157–175. [Google Scholar] [CrossRef]
- Zhu, X.; Wang, L.; Zhang, X.; He, M.; Wang, D.; Ren, Y.; Yao, H.; Pan, H. Effects of different types of anthropogenic disturbances and natural wetlands on water quality and microbial communities in a typical black-odor river. Ecol. Indic. 2022, 136, 108613. [Google Scholar] [CrossRef]
- Tang, D.; Liu, X.; Wang, X.; Yin, K. Relationship between the main communities and environments of an urban river and reservoir: Considering integrated structural and functional assessments of ecosystems. Int. J. Environ. Res. Public Health 2018, 15, 2302. [Google Scholar] [CrossRef]
- Li, Z.; Lu, X.; Fan, Y. Seasonal shifts in assembly dynamics of phytoplankton communities in a humans-affected river in NE China. J. Oceanol. Limnol. 2022, 40, 1985–2000. [Google Scholar] [CrossRef]
- Wuxi Municipal Government Office. Wuxi Pioneers as the First Full-Domain Water Protection Pilot in Jiangsu Province. Available online: http://www.jiangsu.gov.cn/art/2023/12/22/art_33718_11108719.html (accessed on 22 December 2023).
- Yu, D.Q.; Guo, N.C.; Tang, X.M.; Guo, L. Community structure of crustacean zooplankton in the Qinshui River during ecological restoration, Study on the community structure of zooplankton in Wuxi Qingshui River during ecological restoration. J. Hydroecology 2016, 37, 70–77. [Google Scholar] [CrossRef]
- Hao, Y. Study on the Bloom Characteristics and Influencing Factors of Urban Landscape Rivers—Taking Liangxi River as an Example. Master’s Thesis, Inner Mongolia University of Science and Technology, BaoTou, China, 2020. [Google Scholar]
- HJ 506; Water Quality—Determination of Dissolved Oxygen-Electrochemical Probe Method. Ministry of Ecology and Environment the People’s Republic of China: Bejing, China, 2009.
- HJ 535; Water Quality—Determination of Ammonia Nitrogen―Nessler’s Reagent Spectrophotometry. Ministry of Ecology and Environment the People’s Republic of China: Bejing, China, 2009.
- HJ 897; Water Quality—Determination of Chlorophyll a—Spectrophotometric Method. Ministry of Ecology and Environment the People’s Republic of China: Bejing, China, 2017.
- GB/T 11892; Water Quality—Determination of Permanganate Index. Ministry of Ecology and Environment the People’s Republic of China: Bejing, China, 1989.
- GB/T11914; Water Quality—Determination of the Chemical Oxygen Demand—Dichromate Method. Ministry of Ecology and Environment the People’s Republic of China: Bejing, China, 1989.
- GB/T 11893; Water Quality—Determination of Total Phosphorus—Ammonium Molybdate Spectrophotometric Method. Ministry of Ecology and Environment the People’s Republic of China: Bejing, China, 1989.
- Zhang, Z.S.; Huang, X.F. Freshwater Plankton Research Methods; Science Press: Beijing, China, 1991; pp. 2–63. [Google Scholar]
- Wei, Y.; Hu, J. The Freshwater Algae of China-Systems, Taxonomy and Ecology; Science Press: Beijing, China, 2006; pp. 5–265. [Google Scholar]
- Wang, J. Chinese Freshwater Rotifers; Science Press: Beijing, China, 1961. [Google Scholar]
- Jiang, X.; Du, N. Fauna Sinica: Crustacea: Freshwater Cladocera; Science Press: Beijing, China, 1979. [Google Scholar]
- Chinese Academy of Sciences. Fauna Sinica: Copepoda: Freshwater Copepods; Science Press: Beijing, China, 1979. [Google Scholar]
- Meng, Z.; Chen, K.; Liu, L.; Hu, F.; Zhu, Y.; Li, X.; Yang, D. Niche and interspecific association with respect to the dominant phytoplankton species in different hydrological periods of Lake Wuchang, China. Front. Environ. Sci. 2022, 10, 985672. [Google Scholar] [CrossRef]
- Chen, H.; Liu, Q.; Pan, J.X.; Wang, S.; Wang, Z.Z. Spatial and temporal variation of the plankton community and its relationship with environmental factors in the city section of the Ba River. Acta Ecol. Sin. 2019, 39, 173–184. [Google Scholar] [CrossRef]
- Yu, X.K.; Fan, T.Y.; Wang, X.M.; Wang, X.; Zhou, W. Distribution of phytoplankton functional groups in Wuhu River and their relationship with environmental factors. Sci. Technol. Eng. 2022, 22, 8546–8553. [Google Scholar]
- Wen, X.; Zhai, P.; Feng, R.; Yang, R.; Xi, Y. Comparative analysis of the spatio-temporal dynamics of rotifer community structure based on taxonomic indices and functional groups in two subtropical lakes. Sci. Rep. 2017, 7, 578. [Google Scholar] [CrossRef]
- Hromova, Y.; Brauns, M.; Kamjunke, N. Lagrangian dynamics of the spring zooplankton community in a large river. Hydrobiologia 2024, 851, 3603–3621. [Google Scholar] [CrossRef]
- Divya, K.R.; Zhao, S.; Chen, Y.; Cheng, F.; Zhang, L.; Qin, J.; Arunjith, T.S.; Schmidt, V.B.; Xie, S. A comparison of zooplankton assemblages in Nansi Lake and Hongze Lake, potential influences of the East Route of the South-to-North Water Transfer Project, China. J. Oceanol. Limnol. 2021, 39, 623–636. [Google Scholar] [CrossRef]
- Xu, J.H.; Zhai, H.Y.; Sun, L.; Luo, W.; Qiu, C.; Lu, Z.; Mu, Y. Algal characteristics and deposition in regulating tank of a terminal pumping station belonged to the South-to-North Water Diversion Project. China Water Wastewater 2024, 40, 34–42. [Google Scholar] [CrossRef]
- Gutiérrez, S.G.; Sarma, S.; Nandini, S. Seasonal variations of rotifers from a high altitude urban shallow water body, La Cantera Oriente (Mexico City, Mexico). Chin. J. Oceanol. Limnol. 2017, 35, 1387–1397. [Google Scholar] [CrossRef]
- Yang, G.; Qin, B.; Tang, X.; Gong, Z.; Zhong, C.; Zou, H.; Wang, X. Contrasting zooplankton communities of two bays of the large, shallow, eutrophic Lake Taihu, China: Their relationship to environmental factors. J. Great Lakes Res. 2012, 38, 299–308. [Google Scholar] [CrossRef]
- Barrenha, P.I.I.; Tanaka, M.O.; Hanai, F.Y.; Pantano, G.; Moraes, G.H.; Xavier, C.; Awan, A.T.; Grosseli, G.M.; Fadini, P.S.; Mozeto, A.A. Multivariate analyses of the effect of an urban wastewater treatment plant on spatial and temporal variation of water quality and nutrient distribution of a tropical mid-order river. Environ. Monit. Assess. 2018, 190, 43. [Google Scholar] [CrossRef]
- Yu, Q.; Chen, Y.; Liu, Z.; van de Giesen, N.; Zhu, D. The influence of a eutrophic lake to the river downstream: Spatiotemporal algal composition changes and the driving factors. Water 2015, 7, 2184–2201. [Google Scholar] [CrossRef]
- Meng, F.; Li, Z.; Li, L.; Lu, F.; Liu, Y.; Lu, X.; Fan, Y. Phytoplankton alpha diversity indices response the trophic state variation in hydrologically connected aquatic habitats in the Harbin Section of the Songhua River. Sci. Rep. 2020, 10, 21337. [Google Scholar] [CrossRef]
- Arab, S.; Hamil, S.; Rezzaz, M.A.; Chaffai, A.; Arab, A. Seasonal variation of water quality and phytoplankton dynamics and diversity in the surface water of Boukourdane Lake, Algeria. Arab. J. Geosci. 2019, 12, 29. [Google Scholar] [CrossRef]
- Yang, B.; Jiang, Y.-J.; He, W.; Liu, W.-X.; Kong, X.-Z.; Jørgensen, S.E.; Xu, F.-L. The tempo-spatial variations of phytoplankton diversities and their correlation with trophic state levels in a large eutrophic Chinese lake. Ecol. Indic. 2016, 66, 153–162. [Google Scholar] [CrossRef]
- Sun, L.; Wang, H.; Kan, Y.; Wang, S. Distribution of phytoplankton community and its influence factors in an urban river network, East China. Front. Environ. Sci. Eng. 2018, 12, 13. [Google Scholar] [CrossRef]
- Zhang, Y.; Yu, H.; Liu, J.; Guo, Y. Analysis of water quality and the response of phytoplankton in the low-temperature environment of Majiagou Urban River, China. Heliyon 2024, 10, e25955. [Google Scholar] [CrossRef] [PubMed]
- Mutethya, E.; Yongo, E.; Qi, L.; Liu, X.; Guo, Z.; Ye, C. Spatial and seasonal dynamics of zooplankton functional groups and their relationship with environmental factors in urban rivers in Haikou City, China. Limnologica 2024, 108, 126200. [Google Scholar] [CrossRef]
- Rosas, R.S.; Azevedo-Cutrim, A.C.G.; Cutrim, M.V.J.; da Cruz, Q.S.; Souza, D.S.C.; dos Santos Sá, A.K.D.; Oliveira, A.V.G.; Santos, T.P. Spatial heterogeneity of zooplankton community in an eutrophicated tropical estuary. Aquat. Sci. 2024, 86, 102. [Google Scholar] [CrossRef]
- Lenhart, C.F.; Brooks, K.N.; Heneley, D.; Magner, J.A. Spatial and temporal variation in suspended sediment, organic matter, and turbidity in a Minnesota prairie river: Implications for TMDLs. Environ. Monit. Assess. 2010, 165, 435–447. [Google Scholar] [CrossRef]
- Gao, Y.; Lai, Z.; Liu, E.; Yang, W.; Liu, Q. Spatiotemporal Variation of Planktonic Rotifers in Surface Water of a Eutrophic Reservoir in the Southern Subtropical Region of China (2011–2020). Inland Water Biol. 2023, 16, 255–265. [Google Scholar] [CrossRef]
- Ji, Y.; Zhang, J.; Sun, X.; Ma, X. Spatio-temporal distribution characteristics of zooplankton and water quality assessment in middle and lower reaches of Ganjiang River. J. Hohai Univ. Nat. Sci. 2012, 40, 509–513. [Google Scholar] [CrossRef]
- Frau, D.; Gutierrez, M.F.; Regaldo, L.; Saigo, M.; Licursi, M. Plankton community responses in Pampean lowland streams linked to intensive agricultural pollution. Ecol. Indic. 2021, 120, 106934. [Google Scholar] [CrossRef]
- Houssou, A.; Adjahouinou, D.; Bonou, C.; Montchowui, E. Plankton Index of Biotic Integrity (P-IBI) for assessing ecosystem health within the Ouémé River basin, Republic of Benin. Afr. J. Aquat. Sci. 2020, 45, 452–465. [Google Scholar] [CrossRef]
- Su, X.; Steinman, A.D.; Xue, Q.; Zhao, Y.; Tang, X.; Xie, L. Temporal patterns of phyto-and bacterioplankton and their relationships with environmental factors in Lake Taihu, China. Chemosphere 2017, 184, 299–308. [Google Scholar] [CrossRef]
- Chao, C.; Lv, T.; Wang, L.; Li, Y.; Han, C.; Yu, W.; Yan, Z.; Ma, X.; Zhao, H.; Zuo, Z. The spatiotemporal characteristics of water quality and phytoplankton community in a shallow eutrophic lake: Implications for submerged vegetation restoration. Sci. Total Environ. 2022, 821, 153460. [Google Scholar] [CrossRef] [PubMed]
- Yongo, E.; Mutethya, E.; Xu, J.; Yu, H.; Yu, W.; Guo, Z. Assessing ecological status using phytoplankton functional groups in three urban rivers in Hainan Island, China. Environ. Sci. Pollut. Res. 2024, 31, 58054–58068. [Google Scholar] [CrossRef] [PubMed]
- Nalley, J.O.; O’Donnell, D.R.; Litchman, E. Temperature effects on growth rates and fatty acid content in freshwater algae and cyanobacteria. Algal Res. 2018, 35, 500–507. [Google Scholar] [CrossRef]
- Saros, J.; Anderson, N. The ecology of the planktonic diatom Cyclotella and its implications for global environmental change studies. Biol. Rev. 2015, 90, 522–541. [Google Scholar] [CrossRef]
- Casas, L.; Pearman, J.K.; Irigoien, X. Metabarcoding reveals seasonal and temperature-dependent succession of zooplankton communities in the Red Sea. Front. Mar. Sci. 2017, 4, 241. [Google Scholar] [CrossRef]
- Abrantes, N.; Antunes, S.; Pereira, M.; Gonçalves, F. Seasonal succession of cladocerans and phytoplankton and their interactions in a shallow eutrophic lake (Lake Vela, Portugal). Acta Oecologica 2006, 29, 54–64. [Google Scholar] [CrossRef]
- Yamaguchi, H.; Sakamoto, S.; Yamaguchi, M. Nutrition and growth kinetics in nitrogen-and phosphorus-limited cultures of the novel red tide flagellate Chattonella ovata (Raphidophyceae). Harmful Algae 2008, 7, 26–32. [Google Scholar] [CrossRef]
- Ma, B.; Zhang, H.; Huang, T.; Chen, S.; Sun, W.; Yang, W.; Liu, H.; Liu, X.; Niu, L.; Yang, F. Cooperation triggers nitrogen removal and algal inhibition by actinomycetes during landscape water treatment: Performance and metabolic activity. Bioresour. Technol. 2022, 356, 127313. [Google Scholar] [CrossRef]
- Bi, E.G.; Monette, F.; Gasperi, J. Analysis of the influence of rainfall variables on urban effluents concentrations and fluxes in wet weather. J. Hydrol. 2015, 523, 320–332. [Google Scholar] [CrossRef]
- Cloern, J.E. Patterns, pace, and processes of water-quality variability in a long-studied estuary. Limnol. Oceanogr. 2019, 64, S192–S208. [Google Scholar] [CrossRef]
- Glibert, P.M.; Wilkerson, F.P.; Dugdale, R.C.; Raven, J.A.; Dupont, C.L.; Leavitt, P.R.; Parker, A.E.; Burkholder, J.M.; Kana, T.M. Pluses and minuses of ammonium and nitrate uptake and assimilation by phytoplankton and implications for productivity and community composition, with emphasis on nitrogen-enriched conditions. Limnol. Oceanogr. 2016, 61, 165–197. [Google Scholar] [CrossRef]
- Zhang, S.; Niu, C.; Yin, X. Combined effect of pH and un-ionized ammonia on population growth, reproduction and survival rates of the rotifer Brachionus urceolaris. Acta Ecol. Sin. 2008, 28, 4815–4822. [Google Scholar]
- Xia, F.; Jiang, Q.-Y.; Zhu, T.; Zou, B.; Liu, H.; Quan, Z.-X. Ammonium promoting methane oxidation by stimulating the Type Ia methane-oxidizing bacteria in tidal flat sediments of the Yangtze River estuary. Sci. Total Environ. 2021, 793, 148470. [Google Scholar] [CrossRef] [PubMed]
- Negro, A.I.; De Hoyos, C.; Vega, J.C. Phytoplankton structure and dynamics in Lake Sanabria and Valparaíso reservoir (NW Spain). In Proceedings of the Trophic Spectrum Revisited: The Influence of Trophic State on the Assembly of Phytoplankton Communities Proceedings of the 11th Workshop of the International Association of Phytoplankton Taxonomy and Ecology (IAP), Shrewsbury, UK, 15–23 August 1998; pp. 25–37. [Google Scholar]
- Rangel, L.M.; Soares, M.C.S.; Paiva, R.; Silva, L.H.S. Morphology-based functional groups as effective indicators of phytoplankton dynamics in a tropical cyanobacteria-dominated transitional river–reservoir system. Ecol. Indic. 2016, 64, 217–227. [Google Scholar] [CrossRef]
- May, L.; Spears, B.M.; Dudley, B.J.; Gunn, I.D. The response of the rotifer community in Loch Leven, UK, to changes associated with a 60% reduction in phosphorus inputs from the catchment. Int. Rev. Hydrobiol. 2014, 99, 65–71. [Google Scholar] [CrossRef]
- Bai, H.F.; Wang, Y.R.; Song, J.X.; Kong, F.H.; Zhang, X.X.; Li, Q. Characteristics of plankton community structure and its relation to environmental factors in Weihe River, China. Ecol. Environ. Sci. 2022, 31, 117–130. [Google Scholar] [CrossRef]
- Kuang, Q.J.; Ma, P.M.; Hu, Z.Y.; Zhou, G.J. Study on the evaluation and treatment of lake eutrophication by means of algae biology. J. Saf. Environ./Anquan Yu Huanjing Xuebao 2005, 5, 87–91. [Google Scholar]
- Qiu, Y.L.; Lin, Y.Q.; Liu, J.J.; Tang, L.; Guan, T.S.; Chen, Q.W.; Chen, K.; Wang, L. The biodiversity assessment of phytoplankton community in summer within main stream and tributary of Huaihe River. J. Environ. Sci.-China 2017, 38, 1665–1672. [Google Scholar]
- GB 3838-2002; Environmental Quality Standards for Surface Water. Ministry of Ecology and Environment the People’s Republic of China: Bejing, China, 2002.
- Shen, H.; Shi, P.L.; Wu, Y.; Li, Y.; Huang, X.F.; Li, H.N.; Qiu, W.J.; Xie, P. Macrozoobenthos community structure and water quality bioassessment of the Liangtang River. Acta Hydrobiol. Sin. 2016, 40, 203–210. [Google Scholar] [CrossRef]
Disclaimer/Publisher’s Note: The statements, opinions and data contained in all publications are solely those of the individual author(s) and contributor(s) and not of MDPI and/or the editor(s). MDPI and/or the editor(s) disclaim responsibility for any injury to people or property resulting from any ideas, methods, instructions or products referred to in the content. |
© 2024 by the authors. Licensee MDPI, Basel, Switzerland. This article is an open access article distributed under the terms and conditions of the Creative Commons Attribution (CC BY) license (https://creativecommons.org/licenses/by/4.0/).