Article

Temporal Changes in the Average Contribution of Land Uses in Sediment Yield Using the 137Cs Method and Geochemical Tracers

by
Negin Ghaderi Dehkordi
1,
Abdulvahed Khaledi Darvishan
1,*,
Mohamad Reza Zare
2 and
Paolo Porto
3,4
1
Department of Watershed Management, Faculty of Natural Resources, Tarbiat Modares University, Noor P.O. Box 4641776489, Iran
2
Department of Physics, Faculty of Sciences, University of Isfahan, Isfahan P.O. Box 8174673441, Iran
3
Department of Agraria, University Mediterranea of Reggio Calabria, 89124 Calabria, Italy
4
Faculty of Geographical Sciences, Kazimierz Wielki University, 85-064 Bydgoszcz, Poland
*
Author to whom correspondence should be addressed.
Water 2025, 17(1), 73; https://doi.org/10.3390/w17010073
Submission received: 28 November 2024 / Revised: 27 December 2024 / Accepted: 29 December 2024 / Published: 31 December 2024

Abstract

:
The study highlights the increasing significance of understanding sediment sources and their contributions within a watershed, particularly in relation to different land use types. As the demand for effective source apportionment grows, this research aims to quantify how various land uses—specifically rangeland, rainfed agriculture, irrigated agriculture, and orchards—contribute to sediment yield over time. To achieve this, the researchers employed geochemical tracers and 137Cs to assess sediment contributions in a small sub-basin located in western Iran. The methodology involved creating a working unit map by overlaying land use maps from 1967 and 2021 with a slope map of the region. A total of 75 and 31 soil samples were systematically collected across different land uses to ensure a representative analysis of 137Cs and geochemical methods, respectively. The study utilized specific models to calculate the average contributions of each land use type. For non-agricultural lands, a diffusion and migration model was applied, while agricultural lands were analyzed using a mass balance type II model. The FingerPro program in R software 4.2.2 facilitated the selection of suitable tracers and allowed for the determination of sediment source contributions through a multivariate mixed model algorithm. The findings revealed significant changes in sediment yield contributions over the past 60 years. In 2021, rainfed agriculture accounted for 72.26% of sediment yield, down from 85.49% six decades earlier. Conversely, irrigated agriculture showed an increase from 1.80% to 15.06%. Rangeland and orchard contributions remained relatively stable but low, at approximately 8% and 4%, respectively. The total erosion rate for the sub-basin was estimated at 526.87 t y−1, with rainfed agriculture being responsible for the majority at 450.43 t y−1.

Graphical Abstract

1. Introduction

Soil is a fundamental element of ecosystems and a critical resource for food production, playing an essential role in human survival. Consequently, it is vital to support and protect soil while preventing erosion, as soil erosion and sediment transfer to waterways represent significant environmental challenges and concerns for sustainable development [1]. Soil erosion, the most prevalent form of land degradation, results from the interplay of human activities and natural phenomena [2]. This process has historically been a major contributor to land degradation, leading to various environmental and ecological issues, including limitations on agricultural production, hindrances to regional economic development, and deteriorating living conditions [3,4]. The intensity of soil erosion directly correlates with its impacts and is influenced by numerous natural and human factors. Among these factors, land use emerges as a crucial determinant affecting both the intensity of soil erosion and its spatial distribution [5,6]. Specifically, converting land for agricultural use on lower slopes exacerbates soil erosion, highlighting the necessity for targeted land management practices [7].
To effectively implement soil conservation measures, a precise understanding of sediment sources and their contributions to sediment yield is essential. This knowledge aids in identifying sensitive areas within watersheds. However, traditional assessment methods—such as visual inspections, field surveys using erosion plots to measure soil loss, and monitoring rills and gullies—face significant challenges related to time constraints and operational demands. These methods often require substantial financial resources [8,9] and are primarily designed for measuring erosion rather than sediment yield. Consequently, they fall short in estimating the sediments that reach the end of the basin or in linking these sediments back to their primary sources. In summary, addressing soil erosion requires innovative approaches that go beyond traditional methods to effectively relate sediment sources to rivers and sediment yield at the basin’s end [8].
There are various methods for determining and identifying sediment sources and their contributions, with the source tracing or fingerprinting method gaining significant attention from researchers due to its efficiency. Source tracing involves measurement techniques based on field surveys that apportion eroded soil from multiple sources using tracer properties and composite mathematical models [10]. In recent years, this sediment source tracing method has been recognized as a reliable approach for determining the contributions of primary sediment sources and assessing their relative importance [11,12]. This technique operates by comparing the physical and chemical characteristics of sediment sources with those of sediments produced at the basin outlet, allowing for the identification of high-risk areas for sediment yield [13,14]. The effectiveness of sediment source tracing lies in its ability to demonstrate the relative importance of potential sediment sources [11]. It offers simple and cost-effective principles for collecting spatial and temporal data across various watershed scales [8,11]. In employing the sediment source tracing method, it is crucial that sediment sources are distinguishable based on tracer properties [9]. One notable tracer used in this context is 137Cs, a radionuclide resulting from nuclear activities during the period extending from the 1950s to the 1970s. This radionuclide is deposited into soil and serves as a marker for assessing soil erosion across different regions. With a half-life of 30.1 years, 137Cs provides valuable information about changes in soil surface conditions and erosion rates. The initial research utilizing radionuclides to estimate soil erosion was conducted by Menzel in 1960, followed by studies from [15,16], who further explored the impact of 137Cs in soil erosion assessments.
Materials derived from different parent rocks exhibit distinct geochemical characteristics, which are preserved in sediments resulting from erosion. This retention of geochemical properties allows researchers to identify the relative contributions of various sediment sources [17,18,19,20,21]. In the early 1980s, Walling pioneered the use of geochemical tracers as an innovative method for identifying sediment sources within watersheds. This approach has proven highly effective in distinguishing contributions from various sources, particularly land uses, and has gained widespread acceptance in the field. A significant advancement stemming from these developments is the creation of FingerPro package, a specialized tool for source tracing integrated into R software 4.2.2, which is freely available for users interested in sediment source analysis [22]. Additionally, understanding soil particle displacement and redistribution processes due to erosion is crucial for effective soil conservation management at various scales, from individual plots to entire watersheds. Spectroscopy of fallout radionuclides plays a key role in this understanding, with 137Cs being particularly useful for quantifying soil particle displacement [23].
This study employs the 137Cs method to assess the average contributions of different land uses over the past 60 years in the Khamsan representative paired watershed located in Kurdistan Province. The contributions will be compared against current land use shares, enabling an examination of changes in land use contributions and the specific share attributed to each land use type.

2. Materials and Methods
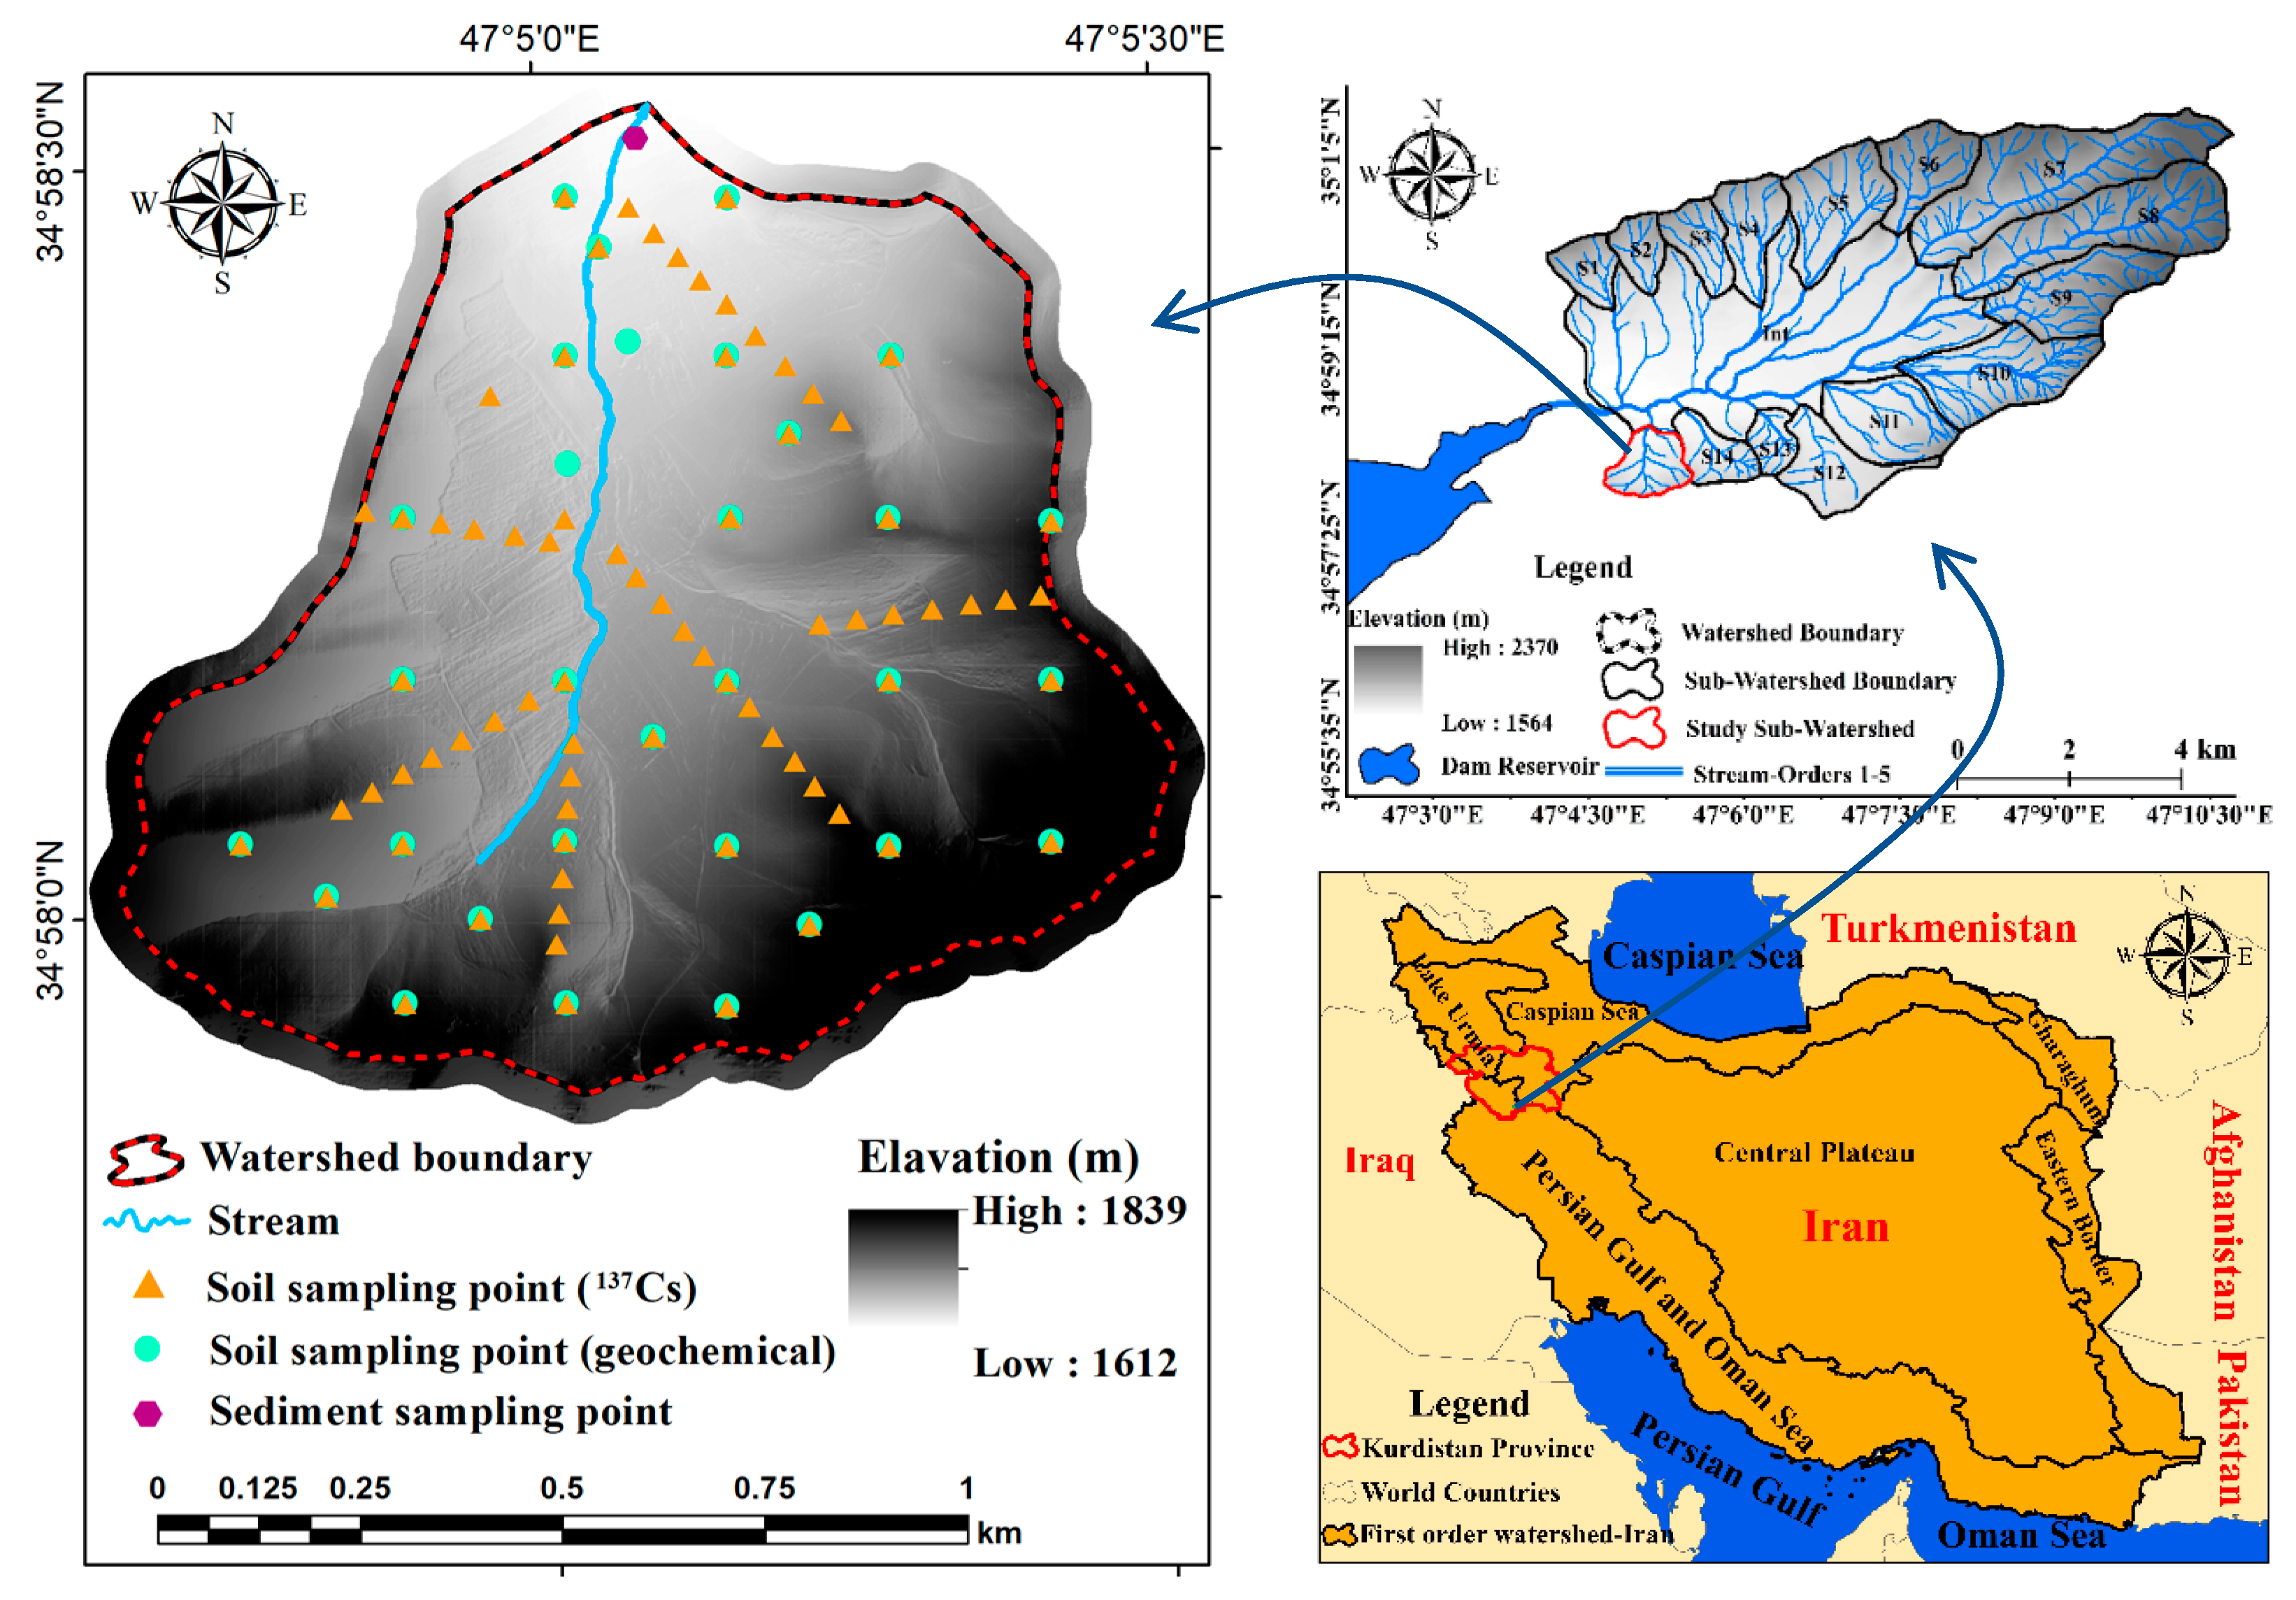
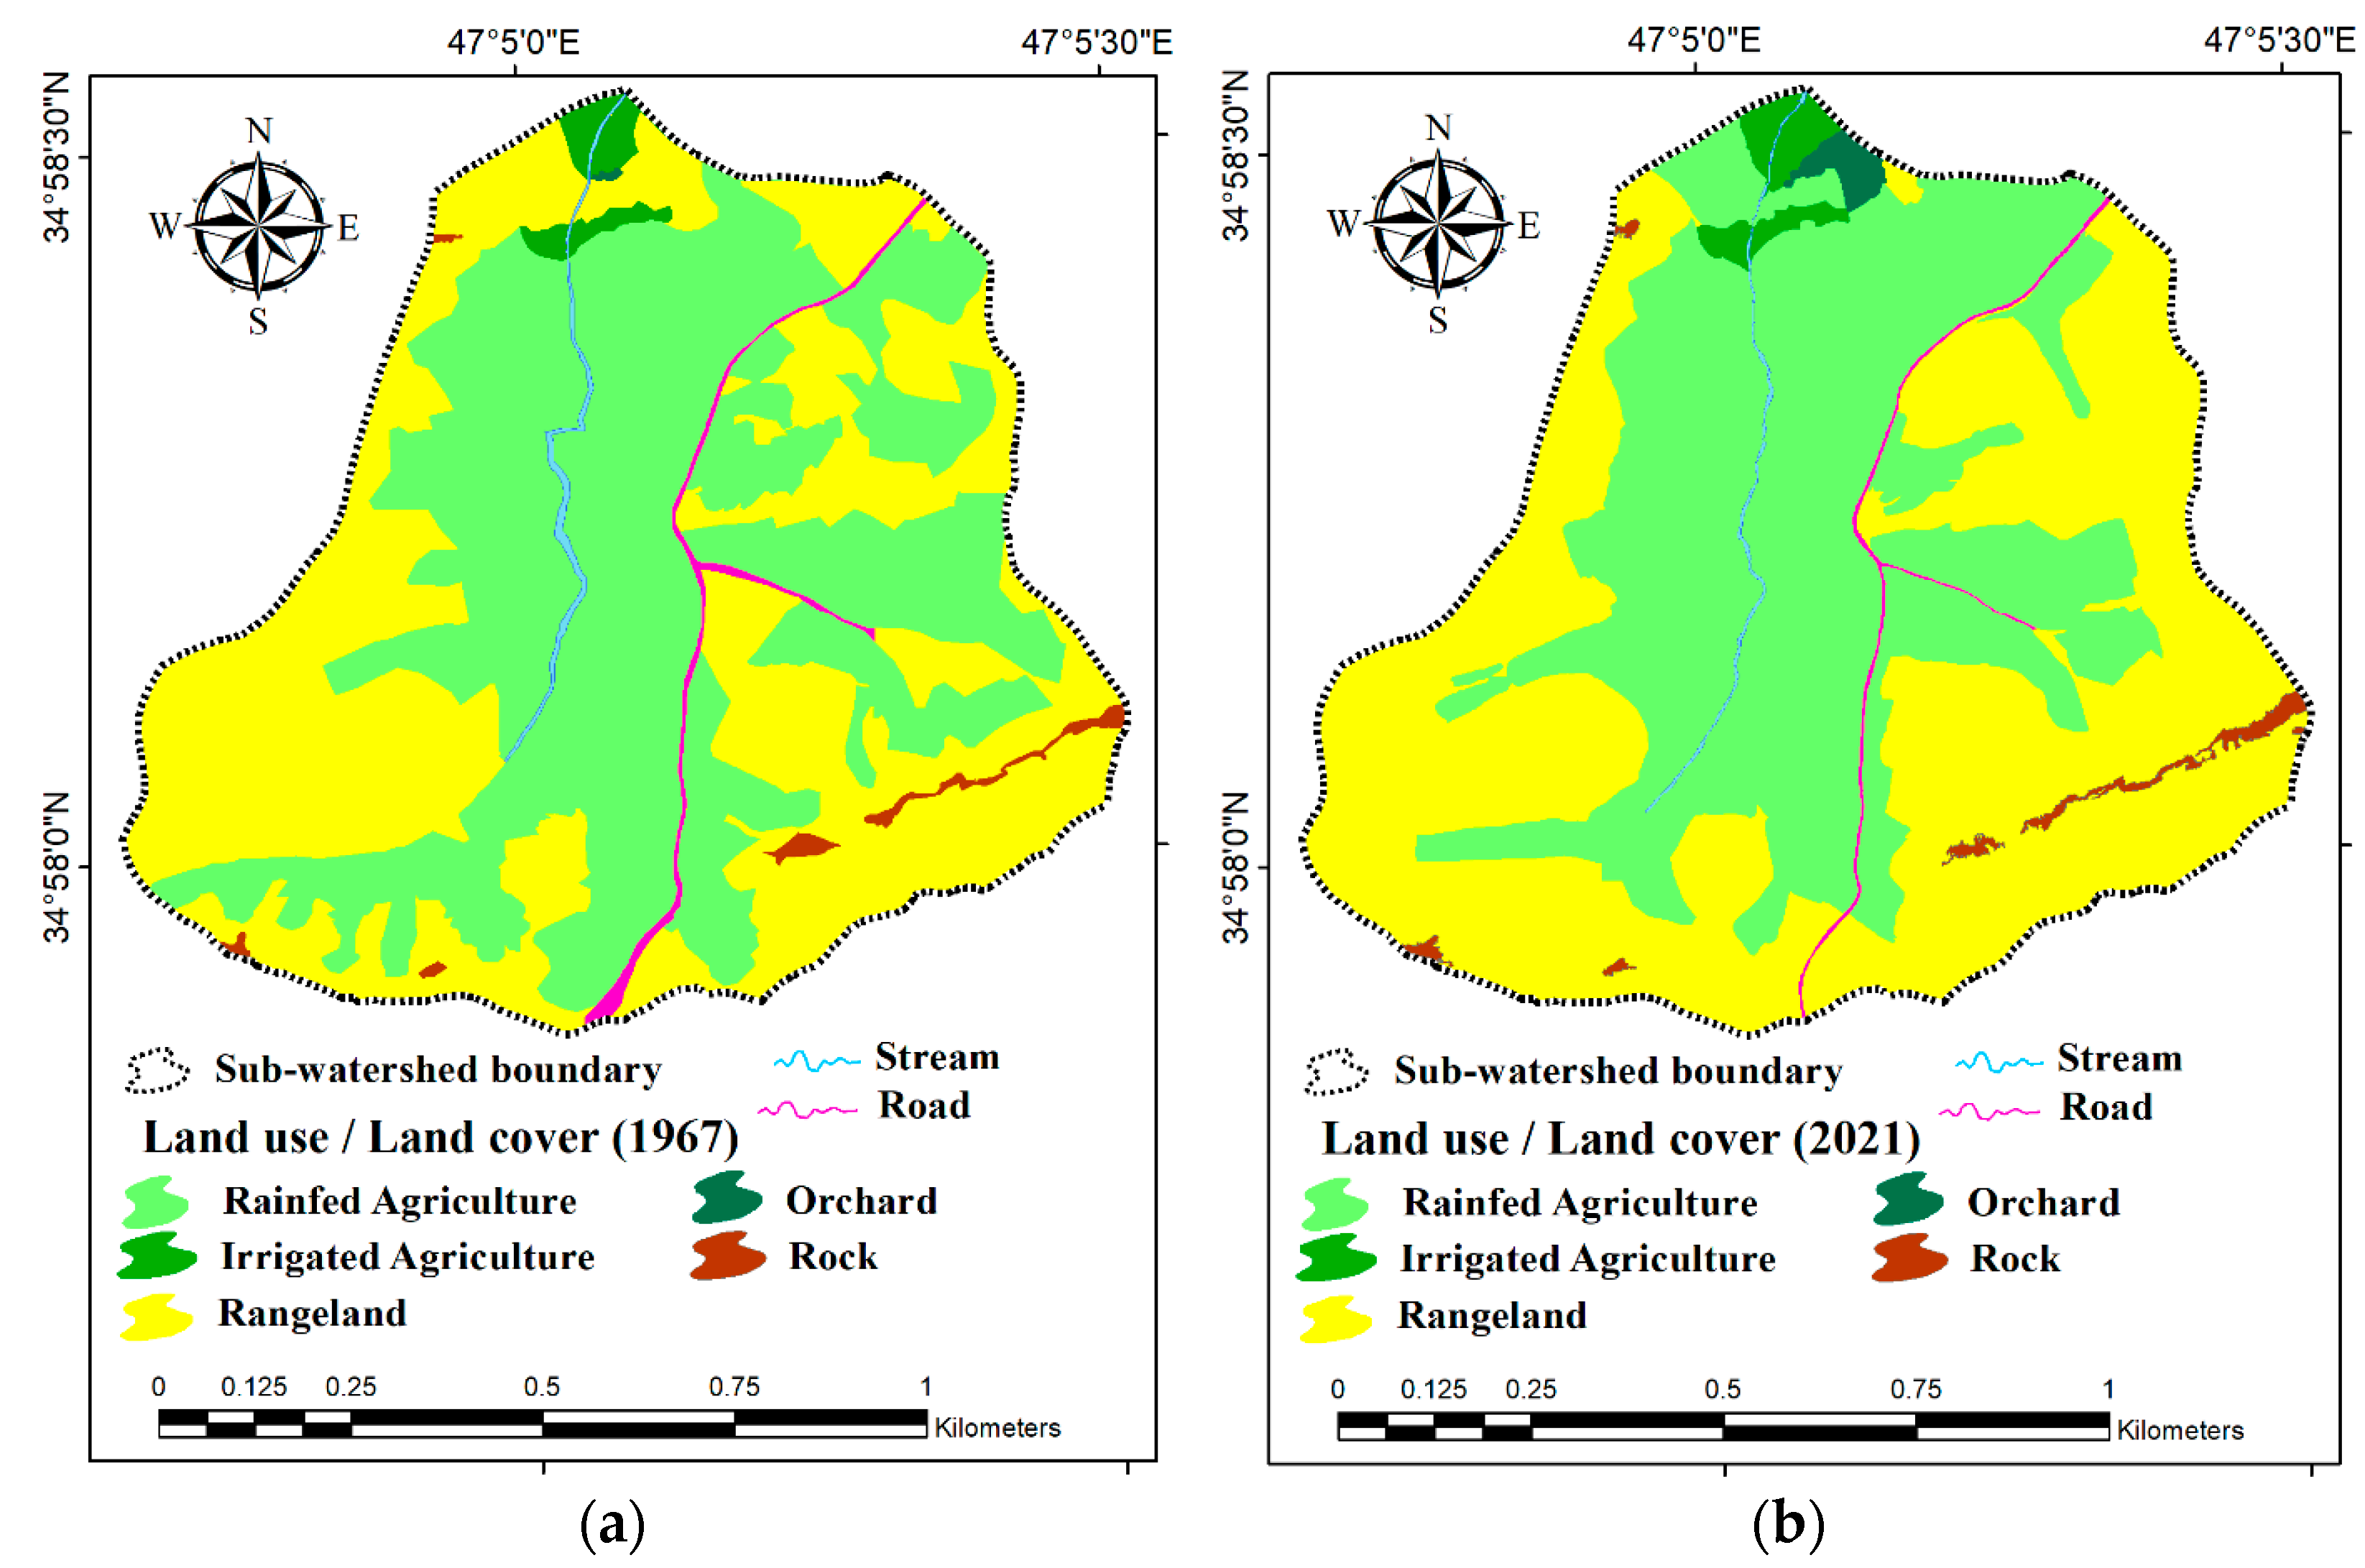
2.1. Study Area

The control sub-watershed, located in the southwest of the Khamsan representative paired watershed, is characterized by the absence of watershed management operations. According to a digital elevation model derived from photogrammetric drone data, this sub-watershed covers an area of approximately 102.14 hectares, features an average slope of 28%, and has an average elevation of 1712 m above sea level. Its geographical coordinates range from 47°4′39″ to 47°5′31″ E longitude and 34°57′52″ to 34°58′33″ N latitude (see Figure 1). Climate data from the Khamsan climatology station indicate that the average annual temperature in this region is 12.5 °C, with average annual precipitation recorded at 428 mm. The study area encompasses four types of land use/covers: orchards, rainfed agriculture, irrigated agriculture, and rangeland. The predominant type of erosion observed in this area is surface erosion [7,24].
In areas surrounding the main stream channel near the watershed outlet, the soil depth exceeds one meter. The hydrologic group of this soil is Group B, and the soil texture is clay loam, which is suitable for agriculture. Consequently, this part of the watershed is used for orchard and irrigated agriculture. However, frequent plowing typically disrupts the natural soil layers. In the central part of the watershed, the soil depth is approximately 50–60 cm, and the hydrologic group is Group C. The soil texture here is loam, but due to unfavorable economic conditions, this area is mainly under rainfed agriculture. Plowing has led to the destruction of the natural soil layers. In the upper part of the watershed, which features rock outcrops and debris falls, the soil depth varies between 10 and 20 cm, with some limited areas exceeding 20 cm. The hydrologic group of this soil is also Group C. Due to the absence of plowing and the presence of rangeland cover, the natural soil layers are visible in this region. The O horizon has a thin layer (a few millimeters), followed by a loam-textured layer with a high percentage of gravel. The dominant vegetation types in these rangelands include species of Astragalus and Festuca.
Approximately 65% of the sub-watershed area is composed of black, dark gray, and yellow shales, silty shale, and phyllitic shale with minor sandstone and micritic limestone intercalations. Medium-level alluvial deposits cover 15% of the watershed area around the main channel. Additionally, tuff, which is light blue and thinly to medium-bedded with abundant calcite veins, is observed in the highlands of the sub-watershed, covering 14% of the area. In the western part of the sub-watershed, pink to purple, thin-bedded pelagic limestone with calcite veins constitutes 4% of the area, while 2% consists of light green to gray calcareous shale interlayered with limestone and sandstone.
To create the land use map related to 60 years ago, aerial photographs from 1967 were utilized. For the current land use map, satellite images were prepared using Google Earth Pro software 7.3.6 (see Figure 2).

2.2. Estimating the Average Contribution of Land Uses in Sediment Yield Using 137Cs

In measuring soil erosion using 137Cs, the first step involves identifying reference points that have remained undisturbed by human activity since the radioactive elements were deposited into the soil. These reference points should have undergone minimal cultivation and movement, and they must not have experienced significant erosion or deposition processes, ensuring that only the natural decay of 137Cs has occurred. Typically, reference sites include protected areas such as cemeteries and parks [25]. For this study, a total of 12 undisturbed samples were collected from the reference area, ensuring a coefficient of variation in radioactive element activity of less than 20%. Four samples were obtained through incremental sampling (layered), while the remaining samples were collected using depth sampling (bulk or integrated) to analyze variations in radioactive element activity across different soil depths. The average of these 12 points was calculated within a specified confidence level to establish an acceptable reference value. Results from previously selected reference areas in this watershed were utilized [7,24]. Following this, soil sampling in the control sub-watershed was conducted using the radioactive core method, with samples proportionately distributed across all land uses/covers and varying slopes. To enhance the accuracy of erosion and deposition measurements while accounting for the combined effects of land use/cover and slope aspect, systematic-random sampling was employed [26]. A regular grid with 200 m intervals was implemented, supplemented by additional samples to ensure comprehensive coverage of different land uses/covers. In total, 31 soil samples were collected following a grid scheme, and 44 samples were taken along six transects aligned with the main slope direction of the hills, resulting in a total of 75 soil samples from the sub-watershed surface. For layered sampling, a sampling box measuring 40 × 20 × 30 cm was utilized, while depth samples were collected using an auger with a height of 25 cm and a diameter of 8 cm.
Each sample was placed in an aluminum container and dried in an oven at 105 °C for 24 h. After drying, the samples were weighed and passed through a 2 mm sieve, then ground in an industrial mill and passed through a 63 mm sieve [27]. Finally, 293 g of each sample was placed in commercial containers, coded, and sent to the Institute of Applied Physics laboratory for spectroscopy and measurement of 137Cs activity using high-purity germanium detectors. The process of preparing soil and sediment samples in the laboratory is illustrated in Figure 3.
The cumulative amount of 137Cs in different soil layers was measured based on activity per unit mass (Bq kg−1). To calculate erosion/deposition, the activity was converted to the inventory of 137Cs in the unit area of the soil (Bq m−2) using Equation (1) [28].
C P I = C i B i D i 10 3
where Ci is the activity of 137Cs in the soil (Bq kg−1), which is the measured amount for each sample in the laboratory; Bi is the bulk density of the soil (g cm−3); Di is the sampling depth (m), equal to 0.25 m; and CPI is the inventory of 137Cs in the soil (Bq m−2).
This method allows for a comprehensive assessment of soil erosion and deposition by converting the activity measurements into a spatially relevant inventory metric. To analyze changes in radioactive nuclei levels in the soil and their relationship with soil displacement volumes, conversion models were employed. These models facilitate comparisons between the radioactive element inventory in field soils and that in reference areas [23,29]. The International Atomic Energy Agency has developed an Excel-based macro software package designed to convert radioactive element inventories into estimates of soil redistribution using various models. Initially created for 137Cs, this software has since been adapted for other radionuclides such as 7Be and 210Pbex [26,29]. In this study, the software was utilized to convert 137Cs inventory data into erosion and deposition rates. Different models have been proposed by researchers depending on land use types. Given that no material displacement was observed in the reference soil profile from previous studies and field surveys, a diffusion and migration model was applied for non-agricultural lands (undisturbed soil). For agricultural lands, where uncertainties regarding rainfall patterns, tillage timing, and soil displacement from plowing exist, the Mass Balance Model II was employed [7,24,26]. The necessary information for utilizing this software according to each of the two selected models is summarized in Table 1.
After converting the 137Cs inventory in the soil from Becquerels per square meter to erosion and deposition values [28], the output data from the conversion models, which include both negative and positive values, were analyzed using an Excel-based macro package designed by the International Atomic Energy Agency. This analysis involved determining the erosion and deposition ranges using the following equations:
Boundary between steady state and erosion = Mean – 95% confidence interval
Boundary between steady state and sedimentation = Mean + 95% confidence interval
In these equations, the mean represents the average 137Cs inventory, while the 95% confidence interval indicates a confidence level with a 10% error margin between the 137Cs inventory and 210Pbex inventory in the reference area. The range defined by these erosion and deposition limits is considered stable, suggesting a relative balance between erosion and deposition processes over time [26].
The land use map from approximately 60 years ago was compared with the 2021 land use map, revealing significant changes primarily from rangeland to rainfed agriculture. To ascertain the approximate year of land use conversion and the initiation of plowing for these lands, interviews were conducted with residents of Khamsan village. This information was subsequently integrated into the conversion models for these specific points.
At each point of interest, any increase or decrease in 137Cs activity that fell outside the Mean ± 95% confidence interval range relative to the reference area indicated whether erosion or deposition processes had dominated over the past 60 years.

2.3. Estimating the Average Contribution of Land Uses in Sediment Yield Using Geochemical Characteristics

Soil samples for fingerprinting studies utilizing geochemical characteristics were collected from the surface layer at a depth of 0 to 2.5 cm [30]. Initially, a thin layer of surface horizon, consisting of plant residues and organic materials, was carefully removed. Following this, a uniform mixture of the 2.5 cm surface soil layer was collected, totaling approximately 500 g. The sampling conditions ensured appropriate moisture levels, with no rainfall occurring five days prior to sampling. In this study, fine sediment bed sampling was performed using a plastic trowel, which minimizes the impact on heavy metals and other geochemical characteristics of the sediment [31,32,33]. This sampling targeted the 5 cm surface layer of the streambed.
After collection, soil and sediment samples were dried in a freeze dryer for 24 h, then ground in a porcelain mortar and passed through a 63-micron sieve. Approximately 10 g of each sample were prepared and coded for further analysis [34,35,36]. The laboratory preparation process for soil and sediment samples is illustrated in Figure 4.
To measure geochemical elements, 31 soil samples and a target sediment sample underwent a process of acid digestion. Specifically, 3 g of dried samples, which were smaller than 63 microns, were treated with aqua regia solution—a mixture of concentrated hydrochloric acid and nitric acid in a 3:1 ratio—for two hours in a water bath. After cooling, the samples were carefully filtered using filter paper with a pore diameter of 0.2 microns. The geochemical characteristics were then measured in micrograms per gram of soil sample (ppm) using the ICP-OES Integra device (manufactured by GBC, sourced in Beijing, China), along with standard Merck samples and calibration curve plotting [37].
To assess the relative contributions of various land uses and covers, the open-source FingerPro software package, developed in the R programming language, was employed. This package is specifically tailored for sediment fingerprinting and calculates sediment source contributions by selecting suitable tracers and applying multivariate mixing model algorithms. One of the standout features of the FingerPro package is its user-friendly interface, which aids users in selecting the best tracers and visualizing results through advanced R graphical plots. This functionality allows for determining sediment source contributions without requiring extensive experience or knowledge of software [23]. The selection of tracer sets was conducted using range test (RT) methods, Kruskal–Wallis (KW) tests, and relative source contribution calculations to sediment yield through a multivariate mixing model. This systematic approach enables users to accurately identify suitable tracers and obtain precise results regarding the contributions of different land uses. This meticulous methodology underscores the importance of integrating geochemical analyses with innovative software tools to enhance our understanding of sediment dynamics within watersheds. By utilizing these techniques, we can better inform land management practices aimed at mitigating erosion and improving soil conservation efforts.
In this study, 56 elements were initially selected as potential tracers. Following this, statistical methods were employed to identify an optimal combination of tracers that could effectively distinguish between different sediment sources. The performance of source identification is influenced by the number of tracers utilized; generally, a greater number of tracers leads to reduced uncertainty in the results [38,39,40,41]. The process for selecting tracers and applying the mixing model to ascertain the relative contributions of various land uses in sediment yield was executed using coded methods within the FingerPro package in R software [22]. The stability of the geochemical characteristics of the tracers was assessed using the range test available in the FingerPro package. Tracers that exhibited significant differences between sources were subsequently selected through the Kruskal–Wallis test. After identifying suitable tracers from these two tests, the relative contributions of sediment sources to sediment yield were determined using a multivariate mixing model. To explore the various combinations of each source’s contribution—ranging from 0 to 100%—Latin hypercube sampling was employed. The quality of results regarding source contributions to sediment yield was evaluated using the Goodness of Fit (GOF) index, which is based on the sum of relative error squares. The Goodness of Fit metric assesses how well a model aligns with observed data and is calculated using Equation (4) [22].
G O F = 1 1 n × j = 1 n b i j = 1 m w j a i , j i   0     w j     1
where bi is the tracer property i (i = 1 to n) of the sediment mixture, ai,j represents the tracer property i in the source type j (j = 1 to m), wj is the unknown relative contribution of the source type j, m represents the number of potential sediment sources and n is the number of tracer properties selected.

3. Results and Discussion

3.1. Results of the Average Contribution of Land Uses in Sediment Yield Using 137Cs

The comparison of land use maps from 1967 and 2021 reveals significant transformations in land use patterns. Notably, the area dedicated to rainfed agriculture has decreased during this period, particularly in regions characterized by higher elevations and steeper slopes. Elevation and slope are critical factors influencing the intensity of agricultural land abandonment. The newly abandoned rainfed lands have considerable impacts on erosion and sedimentation, primarily due to declines in soil quality, limited vegetation recovery, and the effects of tillage operations along the slope. In the early years following abandonment, sediment yield tends to increase, but this trend reverses over the long term, a phenomenon confirmed by numerous researchers, e.g., [42,43,44,45,46,47,48,49]. Therefore, it is essential to plan and manage land abandonment alongside soil erosion control strategies over several years to prevent further land degradation. Table 2 presents the average contributions of various land uses to soil erosion intensity over the past 60 years, as assessed using the 137Cs method. These data underscore the profound impact of agricultural activities on soil erosion dynamics. This thorough analysis highlights the need for effective land management practices that consider both current land use and historical changes.
The data presented in Table 2 reveal that over 85% of soil erosion in the study area occurs within rainfed agricultural land. Interestingly, irrigated agricultural land, which comprises small, low-slope areas near the sub-watershed outlet, exhibits low erosion intensity and is considered a stable area, contributing minimally to overall sub-watershed erosion. Rangeland, covering 45% of the study area, accounts for only 8.93% of sediment yield. Although soil erosion does occur in a significant portion of this land use, the intensity remains low. According to the 95% confidence interval criterion, these areas are deemed stable and are excluded from calculations regarding sediment yield contributions. Among the four potential sediment sources analyzed, rainfed agriculture and rangeland emerged as the primary sediment sources in the study area, contributing 85.49% and 8.93% of total sediments, respectively. In contrast, the contributions from orchard and irrigated agriculture land uses were considerably lower, at 3.78% and 1.80%. It is important to note that rainfed agriculture and rangeland together comprise more than 96% of the total watershed area, which is why specific contributions from each land use were also calculated. The specific contributions per hectare for rainfed agriculture, orchards, irrigated agriculture, and rangeland were found to be 1.63%, 94.50%, 1.40%, and 0.19%, respectively. Orchards exhibited the highest specific contribution despite constituting only 0.04% of the total watershed area. This significant increase can be attributed to practices such as deep and frequent plowing, excessive use of chemical fertilizers, pit digging, soil amendment with sand, sapling planting, and other activities that lead to soil compaction and disrupt natural soil structure—all of which significantly contribute to soil erosion. Following orchards, rainfed agriculture has the next highest specific contribution with a substantial margin.

3.2. Results of the Average Contribution of Land Uses in Sediment Yield Using Geochemical Characteristics

After conducting the range test, which compared the minimum and maximum values of geochemical tracer characteristics in sediment sources using 31 soil samples, a total of 11 elements—including Al, Ba, Be, Fe, Ga, Lu, Pb, Sn, Sr, Te, and Tm—were eliminated from subsequent analyses as they fell outside the selected sources’ range. The remaining elements were retained in the tracer set for further evaluation. Based on the results from the non-parametric rank-based Kruskal–Wallis test, an additional 42 elements—such as Na, K, Ca, Mg, Li, B, Sc, Ti, V, Cr, Mn, Co, Cu, Zn, Ge, As, Se, Rb, Y, Zr, Nb, Sb, Cs, La, Ce, Pr, Nd, Sm, Eu, Gd, Tb, Dy, Ho, Er, Yb, Ta, W, Hg, Tl, Bi, Th, and U—were also removed from the tracer set. Ultimately, only three elements—Ni, Mo, and Hf—remained as optimal tracers after this rigorous selection process. These results are summarized in Table 3 and include both the range and Kruskal–Wallis test outcomes for selecting the optimal combination of tracers. The characteristics of the selected tracers are visually represented using box plots for each land use in Figure 5. A box plot is an effective visual tool that illustrates data distribution through quartiles. In evaluating the performance of the remaining tracers, Ni consistently showed higher concentrations across all four land uses. The concentration order was as follows: rainfed agriculture had the highest concentration, followed by irrigated agriculture and orchard land; rangeland exhibited the lowest concentration. According to the box plots presented in Figure 5, rainfed agriculture emerged as the primary source for all three selected tracers.
The DFA plot effectively separates sediment sources by identifying a linear combination of the selected tracers and presenting the results in a 3D format. Principal Component Analysis (PCA) was employed as a complementary visual tool to aid in the correct selection of optimal tracers. Figure 6 illustrates both the DFA plot and the PCA plot, showcasing the distribution of sediment sources based on the selected optimal tracers.
The results from the Principal Component Analysis (PCA) plot indicated that most of the arrows representing the optimal tracers converged, suggesting a positive correlation among the tracers. This finding aligns with previous studies by [39,50], which also demonstrated similar positive correlations between tracer elements in their analyses. Following the identification of sediment sources and their contributions using the FingerPro package in R software, the calculations and results detailing the contribution levels of various sediment sources—including rainfed agriculture, rangeland, irrigated agriculture, and orchards—are presented in Table 4. The findings reveal that rainfed agricultural lands, identified as a primary sediment source, contributed 72.26% of the total sediment yield. In addition, the relative contributions from other sources were 15.06% from irrigated agricultural lands, 7.96% from rangelands, and 4.72% from orchards. The dominance of rainfed agricultural lands in sediment yield can be attributed to improper and suboptimal land use management practices, particularly unsustainable agricultural methods such as plowing along slopes on hillsides. This observation has been corroborated by numerous studies conducted in the watershed. Moreover, the results obtained from the FingerPro package indicated that the Goodness of Fit (GOF) index for sediment source tracing was 0.78. This value is considered acceptable, especially in light of recent scientific findings suggesting that a GOF index above 0.60 is indicative of a reliable model [22,41,51,52,53]. The advanced capabilities of the FingerPro technique have significantly enhanced our understanding of sediment sources and enabled a more precise and comprehensive analysis of data.
The specific contributions of various land uses to sediment yield were calculated and are presented in Table 4. Among the four potential sediment sources, irrigated agriculture and orchards emerged as significant contributors in the study area, with specific contributions of 9.78% and 7.49% per hectare, respectively. In contrast, the relative specific contributions from rainfed agriculture and rangeland were considerably lower, estimated at 1.58% and 0.15% per hectare, respectively. It is noteworthy that irrigated agriculture comprises only 1.51% of the total watershed area, while orchards account for 0.62%. These findings underscore the critical importance of targeted land management strategies in controlling erosion and sediment yield within the watershed. They highlight that having accurate information on soil erosion and sediment yield across different areas of a watershed is essential for planning effective soil conservation management strategies. To provide a visual comparison, Figure 7 presents a chart illustrating the percentage of relative and specific contributions of each land use to sediment yield, utilizing both the 137Cs method and geochemical analyses.
Based on the results obtained from comparing contributions of rangeland, rainfed agriculture, irrigated agriculture, and orchards within the study area, it can be concluded that over the past 60 years, rangeland—occupying nearly half of the sub-watershed and characterized by steeper slopes compared to other land uses—has exhibited the lowest specific contribution to sediment yield, as clearly illustrated in Figure 7. The contribution of rainfed agriculture to sediment yield was estimated at over 85% using the 137Cs method for the average of the last 60 years, while the geochemical method indicated a contribution of over 72% for the present period. This clearly demonstrates that rainfed agriculture is the primary source of sediment yield in the control sub-watershed. Furthermore, irrigated agriculture and orchards have shown the highest specific contributions during both time periods, largely due to soil displacement resulting from tillage activities, particularly practices such as pit digging and soil transfer during orchard establishment. The comparative analysis of contributions from various land uses over the past 60 years to the present period revealed a decrease of approximately one times in both rainfed agriculture and rangeland, while irrigated agriculture and orchards experienced increases of about eight and one times, respectively. Specifically, the contributions of rainfed agriculture, rangeland, orchards, and irrigated agriculture have decreased by factors of 1.03, 1.27, and 12.62, respectively, while increasing by a factor of 6.99 for irrigated agriculture. Interestingly, the relative and specific contributions of rangeland in sediment yield have remained relatively constant over the past 60 years compared to the present period. Other human-induced changes, such as soil compaction, the effects of drainage systems, infrastructures, and the length, width, and type of the roads, had not occurred significantly. During this period, a land use change (abandonment of rangeland) has been observed. Field visits to the studied sub-watershed indicated that the reduction in sediment yield from rainfed agriculture is primarily due to a decrease in the area dedicated to this land use. Additionally, the decrease in rainfall and the change in rainfall patterns across large parts of the Zagros Mountains and the associated watersheds [54], along with the barriers created, particularly plowing even within the main stream channel, have prevented runoff and sediment from rainfed agriculture from reaching the sub-watershed outlet.
Moreover, both the 137Cs and geochemical methods reveal that sediment yield in rainfed agriculture is approximately 10 times higher than that in rangeland. These findings highlight significant issues regarding adherence to soil management and agricultural principles on rainfed lands, including improper plowing techniques and a lack of conservation methods. Such practices have led to reduced soil fertility and increased runoff and sedimentation. This underscores the critical importance of precise land use management and implementing effective conservation practices, particularly to prevent land use conversion in sloped areas.

4. Limitations

Source fingerprinting procedures often encounter significant challenges and limitations [3]. Although a total number of 106 soil samples were analyzed for four different land uses in a 102 h area, the distribution of the samples in each land use may still be considered as a source of uncertainty in this research. Using aqua regia digest to extract tracers from source materials and target sediment samples produced pseudo-concentrations rather than total concentrations. Tracer selection relied more on the success reported in previous global studies than on physico-chemical reasoning, resulting in statistical solutions for source discrimination and apportionment. Despite these constraints, virtual mixture tests demonstrated acceptable accuracy levels for source apportionment (Table 5).

5. Conclusions

Soil erosion is a significant challenge in watersheds, and sediment fingerprinting methods can identify sediment sources. Studies show that the contributions of land uses/covers to sediment yield have changed significantly over the past 60 years compared to the present situation. Specifically, in rainfed agriculture and rangeland, the contributions have decreased by approximately 1.2 times, while in irrigated agriculture and orchards, they have increased by about 8 times and 1.2 times, respectively. Additionally, the specific contributions of rainfed agriculture, rangeland, orchards, and irrigated agriculture over the past 60 years compared to the present period have decreased by 1.03, 12.62, and 1.27 times, respectively, and increased by 7.04 times. Field visits to the study area indicated that the reduction in sediment yield in rainfed agriculture was due to the decreased area of this land use. Additionally, over time, the study area has undergone changes such as land degradation and the creation of obstacles, especially plowing along the main watercourse and even planting crops in parts of the stream, which has prevented runoff and sediment from rainfed agriculture from reaching the sub-watershed outlet. Climate change and reduced rainfall have significantly accelerated trends in soil erosion and sediment yield, particularly in agricultural settings. The results indicate that erosion and sediment yield in irrigated agriculture have increased over the past six decades, primarily due to tillage operations that compromise soil stability and elevate sediment levels. Notably, both the 137Cs and geochemical methods reveal that sediment yield in rainfed agriculture is approximately 10 times higher than that in rangeland. This finding underscores the critical need for precise land use management and the implementation of conservation practices, especially to prevent land use conversion in sloped areas, mitigating the adverse effects of plowing along slopes. The findings from this study highlight that analyzing temporal changes in land use contributions to soil erosion and sediment yield offers valuable insights into the impacts of human activities over recent decades. Such insights are essential for developing effective management plans and implementing soil and water conservation measures. However, there are undoubtedly uncertainties in our results, and it is important to acknowledge that any scientific study contains uncertainties, chiefly when we use models. Simplification of natural conditions is a key task of any model, especially when it comes to the effects of soil disturbance and the fact that the sensitivity of the model to its inputs is not well defined.

Author Contributions

Conceptualization, A.K.D. and P.P.; methodology, N.G.D., A.K.D., M.R.Z. and P.P.; software, N.G.D., A.K.D., M.R.Z. and P.P.; validation, N.G.D., A.K.D. and P.P.; formal analysis, N.G.D., A.K.D., M.R.Z. and P.P.; investigation, N.G.D., A.K.D. and P.P.; resources, N.G.D., A.K.D. and P.P.; data curation, N.G.D. and A.K.D.; writing—original draft preparation, N.G.D.; writing—review and editing, A.K.D. and P.P.; visualization, N.G.D. and A.K.D.; supervision, A.K.D., M.R.Z. and P.P.; project administration, A.K.D. All authors have read and agreed to the published version of the manuscript.

Funding

This research received no external funding.

Data Availability Statement

The raw data supporting the conclusions of this article will be made available by the authors on request.

Acknowledgments

The current research was undertaken as the doctoral dissertation of Negin Ghaderi Dehkordi, with the financial support of Tarbiat Modares University, Iran. Authors would like to thank Hamid Khodamoradi for his helps in the field sampling.

Conflicts of Interest

The authors declare no conflicts of interest.

References

  1. Alatorre, L.; Beguería, S.; García-Ruiz, J. Regional scale modeling of hillslope sediment delivery: A case study in the Barasona Reservoir watershed (Spain) using WATEM/SEDEM. J. Hydrol. 2010, 391, 109–123. [Google Scholar] [CrossRef]
  2. Bhattacharya, R.; Chatterjee, N.; Das, K. Estimation of erosion susceptibility and sediment yield in ephemeral channel using RUSLE and SDR model: Tropical Plateau Fringe Region, India. In Gully Erosion Studies from India and Surrounding Regions; Springer: Berlin/Heidelberg, Germany, 2020; pp. 163–185. [Google Scholar] [CrossRef]
  3. Collin, A.L.; Pulley, S.; Foster, I.D.L.; Gellis, A.; Porto, P.; Horowitz, A.J. Sediment source fingerprinting for catchment management: A review. J. Environ. Manag. 2017, 194, 86–108. [Google Scholar] [CrossRef] [PubMed]
  4. Chen, F.; Chen, S.; Zhang, X.; Chen, J.; Wang, X.; Gowan, E.J.; Qiang, M.; Dong, G.; Wang, Z.; Li, Y.; et al. Asian dust-storm activity dominated by Chinese dynasty changes since 2000 BP. Nat. Commun. 2020, 11, 992. [Google Scholar] [CrossRef] [PubMed]
  5. Bastala, S.; Dialynas, Y.G.; Bras, R.L.; Noto, L.V.; Istanbulluoglu, E. The role of vegetation on gully erosion stabilization at a severely degraded landscape: A case study from Calhoun Experimental Critical Zone Observatory. Geomorphology 2018, 308, 25–39. [Google Scholar] [CrossRef]
  6. Devátý, J.; Dostál, T.; Hösl, R.; Krása, J.; Strauss, P. Effects of historical land use and land pattern changes on soil erosion—Case studies from Lower Austria and Central Bohemia. LUP 2019, 82, 674–685. [Google Scholar] [CrossRef]
  7. Zarei, R.; Khaledi Darvishan, A.; Porto, P.; Zare, M.R. Using radiotracers and topographic metrics for sediment budgeting at pixel and hillslope scales: A case study from western Iran. Ecol. Indic. 2024, 167, 112711. [Google Scholar] [CrossRef]
  8. Collins, A.L.; Walling, D.E. Documenting catchment suspended sediment sources: Problems, approaches and prospects. Prog. Phys. Geogr. 2004, 28, 159–196. [Google Scholar] [CrossRef]
  9. Franz, C.; Makeschin, F.; Weiß, H.; Lorz, C. Sediments in urban river basins: Identification of sediment sources within the Lago Paranoá catchment, Brasilia DF, Brazil—Using the fingerprint approach. Sci. Total Environ. 2014, 466–467, 513–523. [Google Scholar] [CrossRef]
  10. Gruszowski, K.E.; Foster, I.D.L.; Lees, J.A.; Charlesworth, S.M. Sediment sources and transport pathways in a rural catchment, Herefordshire, UK. Hydrol. Proc. 2003, 17, 2665–2681. [Google Scholar] [CrossRef]
  11. Walling, D.E. Tracing suspended sediment sources in catchments and river systems. Sci. Total Environ. 2005, 344, 159–184. [Google Scholar] [CrossRef]
  12. Koiter, A.J.; Owens, P.N.; Petticrew, E.L.; Lobb, D.A. The behavioural characteristics of sediment properties and their implications for sediment fingerprinting as an approach for identifying sediment sources in river basins. Earth-Sci. Rev. 2013, 125, 24–42. [Google Scholar] [CrossRef]
  13. Martínez-Carreras, N.; Krein, A.; Gallart, F.; Iffly, J.F.; Pfister, L.; Haffman, L.; Owens, P.N. Assessment of different parameter for discriminating potentioal suspende sediment sources and provenance: A multi scale study in Luxembourg. Geomorphology 2010, 11, 118–129. [Google Scholar] [CrossRef]
  14. Porto, P.; Walling, D.E.; Callegari, G. Investigating sediment sources within a small catchment in southern Italy. In Sediment; Budgets, I., Walling, D.E., Horowitz, A.J., Eds.; IAHS Publication 291; IAHS Press: Wallingford, UK, 2005; pp. 113–122. [Google Scholar]
  15. Rogowsky, A.S.; Tamura, T. Movement of 137Cs by runoff, erosion and infiltration on the alluvial Captina silt loam. Health Phys. 1965, 11, 1333–1340. [Google Scholar] [CrossRef]
  16. Ritchie, J.C.; McHenry, J.R. Determination of fallout 137CS and naturally occurring gamma-ray emitters in sediments. Int. J. Appl. Radiat. Isot. 1973, 24, 575–578. [Google Scholar] [CrossRef]
  17. Motha, J.A.; Wallbrink, P.J.; Hairsine, P.B.; Grayson, R.B. Tracer properties of eroded sediment and source material. Hydrol. Proc. 2002, 16, 1983–2000. [Google Scholar] [CrossRef]
  18. Caitcheon, G.; Douglas, G.; Palmer, M. Sediment Source Tracing in the Lake Burragorang Catchment. CSIRO Land Water Sci. Rep. Canberra 2006, 47, 28. [Google Scholar]
  19. Douglas, G.; Caitcheon, G.; Palmer, M. Sediment source identification and residence times in the Maroochy River estuary, southeast Queensland, Australia. Environ. Geol. 2009, 57, 629–639. [Google Scholar] [CrossRef]
  20. Hughes, A.O.; Olley, J.M.; Croke, J.C.; McKergow, L.A. Sediment source changes in a dry-tropical catchment. Geomorphology 2009, 104, 262–275. [Google Scholar] [CrossRef]
  21. D’Haen, K.; Verstraeten, G.; Dusar, B.; Degryse, P.; Haex, J.; Waelkens, M. Unravelling changing sediment sources in a Mediterranean mountain catchment: A Bayesian fingerprinting approach. Hydrol. Proc. 2013, 27, 896–910. [Google Scholar] [CrossRef]
  22. Lizaga, I.; Latorre, B.; Gaspar, L.; Navas, A. FingerPro: An R package for tracking the provenance of sediment. Water Resour. Manag. 2020, 34, 3879–3894. [Google Scholar] [CrossRef]
  23. Zapata, F. Handbook for the Assessment of Soil Erosion and Sedimentation Using Environmental Radionuclides; Kluwer Academic Publishers: Dordrecht, The Netherland, 2003; Volume 219, pp. 9348054–9348059. [Google Scholar] [CrossRef]
  24. Sedighi, F.; Khaledi Darvishan, A.; Zare, M.R. Effect of watershed geomorphological characteristics on sediment redistribution. Geomorphology 2021, 375, 107559. [Google Scholar] [CrossRef]
  25. Dercon, G.; Deckers, J.; Govers, G.; Poesen, J.; Sánchez, H.; Vanegas, R.; Ramírez, M.; Loaiza, G. Spatial variability in soil properties on slow-forming terraces in the Andes region of Ecuador. Soil Tillage Res. 2003, 72, 31–41. [Google Scholar] [CrossRef]
  26. Walling, D.E.; He, Q.; Zhang, Y. Conversion models and related software. In: Guidelines for Using Fallout Radionuclides to Assess Erosion and Effectiveness of Soil Conservation Strategies. In IAEA-TECDOC-1741; IAEA Publisher: Vienna, Austria, 2014; Volume 46, pp. 125–148. [Google Scholar]
  27. Chiu, Y.J.; Chang, K.T.; Chen, Y.C.; Chao, J.H.; Lee, H.Y. Estimation of soil erosion rates in a subtropical mountain watershed using 137Cs radionuclide. Nat. Hazards 2011, 59, 271–284. [Google Scholar] [CrossRef]
  28. Walling, D.E.; He, Q.; Whelan, P.A. Using 137Cs measurements to validate the application of the AGNPS and ANSWERS erosion and sediment yield models in two small Devon catchments. Soil Tillage Res. 2003, 69, 27–43. [Google Scholar] [CrossRef]
  29. Porto, P.; Walling, D.E.; Callegari, G. Using repeated 137Cs and 210Pbex measurements to establish sediment budgets for different time windows and explore the effect of connectivity on soil erosion rates in a small experimental catchment in Southern Italy. Land Degrad. Dev. 2018, 29, 1819–1832. [Google Scholar] [CrossRef]
  30. Lamba, J.; Karthikeyan, K.G.; Thompson, A.M. Apportionment of suspended sediment sources in an agricultural watershed using sediment fingerprinting. Geoderma 2015, 239–240, 25–33. [Google Scholar] [CrossRef]
  31. Smith, H.G.; Blake, W.H. Sediment fingerprinting in agricultural catchments: A critical re-examination of source discrimination and data corrections. Geomorphology 2014, 204, 177–191. [Google Scholar] [CrossRef]
  32. Boudreault, M.; Koiter, A.J.; Lobb, D.A.; Liu, K.; Benoy, G.; Owens, P.N.; Li, S. Comparison of sampling designs for sediment source fingerprinting in an agricultural watershed in Atlantic Canada. J. Soils Sediments 2019, 19, 3302–3318. [Google Scholar] [CrossRef]
  33. Li, T.; Sun, G.; Yang, C.; Liang, K.; Ma, S.; Huang, L.; Luo, W. Source apportionment and source-to-sink transport of major and trace elements in coastal sediments: Combining positive matrix factorization and sediment trend analysis. Sci. Total Environ. 2019, 601, 344–356. [Google Scholar] [CrossRef] [PubMed]
  34. Wallbrink, P.J.; Croke, J. A combined rainfall simulator and tracer approach to assess the role of Best Management Practices in minimising sediment redistribution and loss in forests after harvesting. For. Ecol. Manag. 2002, 170, 217–232. [Google Scholar] [CrossRef]
  35. Collins, A.L.; Walling, D.E.; Webb, L.; King, P. Apportioning catchment scale sediment sources using a modified composite fingerprinting technique incorporating property weightings and prior information. Geoderma 2010, 155, 249–261. [Google Scholar] [CrossRef]
  36. Gholami, H.; Middleton, N.; NazariSamani, A.A.; Wasson, R. Determining contribution of sand dune potential sources using radionuclides, trace and major elements in central Iran. Arab. J. Geosci. 2017, 10, 163–171. [Google Scholar] [CrossRef]
  37. Nosrati, K.; Ahmadi, F. Investigating of Seasonal Change Effects on Suspended Sediment Yield Using Geochemical Tracers. Iran J. Geol. 2018, 12, 60–73. Available online: http://geology.saminatech.ir/en/Article/9601 (accessed on 28 September 2024).
  38. Smith, H.G.; Karam, D.S.; Lennard, A.T. Evaluating tracer selection for catchment sediment fingerprinting. J. Soils Sediments 2018, 18, 3005–3019. [Google Scholar] [CrossRef]
  39. Vale, S.; Swales, A.; Smith, H.G.; Olsen, G.; Woodward, B. Impacts of tracer type, tracer selection, and source dominance on source apportionment with sediment fingerprinting. Sci. Total Environ. 2022, 831, 154832. [Google Scholar] [CrossRef] [PubMed]
  40. Haji, K.; Khaledi Darvishan, A.; Mostafazadeh, R. Soil erosion and sediment sourcing in the Hyrcanian forests, Northern Iran: An integration approach of the G2loss model and sediment fingerprinting technique. Model. Earth Syst. Environ. 2024, 10, 1897–1914. [Google Scholar] [CrossRef]
  41. Mohammadi, M.; Khaledi Darvishan, A.; Bahramifar, N.; Alavi, S.J. Spatio-temporal suspended sediment fingerprinting under different land management practices. Int. J. Sediment. Res. 2023, 38, 481–493. [Google Scholar] [CrossRef]
  42. Lesschen, J.P.; Cammeraat, L.H.; Nieman, T. Erosion and terrace failure due to agricultural land abandonment in a semi-arid environment. Earth Surf. Process. Landf. 2008, 33, 1574–1584. [Google Scholar] [CrossRef]
  43. Cerdà, A.; Rodrigo-Comino, J.; Novara, A.; Brevik, E.C.; Vaezi, A.R.; Pulido, M.; Giménez-Morera, A.; Keesstra, S.D. Long-term impact of rainfed agricultural land abandonment on soil erosion in the Western Mediterranean basin. Prog. Phys. Geogr. 2018, 42, 202–219. [Google Scholar] [CrossRef]
  44. Rodrigo-Comino, J.; Martínez-Hernández, C.; Iserloh, T.; Cerdà, A. Contrasted impact of land abandonment on soil erosion in Mediterranean agriculture fields. Pedosphere 2018, 28, 617–631. [Google Scholar] [CrossRef]
  45. Kheirfam, H.; Sadeghi, S.H.; Darki, B.Z. Soil conservation in an abandoned agricultural rain-fed land through inoculation of cyanobacteria. Catena 2020, 187, 104341. [Google Scholar] [CrossRef]
  46. Lana-Renault, N.; Nadal-Romero, E.; Cammeraat, E.; Llorente, J.A. Critical environmental issues confirm the relevance of abandoned agricultural land. Water 2020, 12, 1119. [Google Scholar] [CrossRef]
  47. Liu, M.; Han, G.; Li, X. Contributions of soil erosion and decomposition to SOC loss during a short-term paddy land abandonment in Northeast Thailand. Agric. Ecosyst. Environ. 2021, 321, 107629. [Google Scholar] [CrossRef]
  48. Khorchani, M.; Gaspar, L.; Nadal-Romero, E.; Arnaez, J.; Lasanta, T.; Navas, A. Effects of cropland abandonment and afforestation on soil redistribution in a small Mediterranean mountain catchment. Int. Soil Water Conserv. Res. 2023, 11, 339–352. [Google Scholar] [CrossRef]
  49. Sitaula, R.; Sharma, P.; Chidi, C.L. Agricultural land abandonment and its impact on soil erosion in the Madi Watershed, Gandaki Province, Nepal. Geogr. J. Nepal. 2024, 19, 53–70. [Google Scholar] [CrossRef]
  50. Lizaga, I.; Gaspar, L.; Latorre, B.; Navas, A. Variations in transport of suspended sediment and associated elements induced by rainfall and agricultural cycle in a Mediterranean agroforestry catchment. J. Environ. Manag. 2020, 272, 111020. [Google Scholar] [CrossRef]
  51. Chen, F.; Wang, X.; Li, X.; Wang, J.; Xie, D.; Ni, J.; Liu, Y. Using the sediment fingerprinting method to identify the sediment sources in small catchments with similar geological conditions. Agric. Ecosyst. Environ. 2019, 286, 106655. [Google Scholar] [CrossRef]
  52. Gaspar, L.; Blake, W.H.; Lizaga, I.; Latorre, B.; Navas, A. Particle size effect on geochemical composition of experimental soil mixtures relevant for unmixing modelling. Geomorphology 2022, 403, 108178. [Google Scholar] [CrossRef]
  53. Karimi, N.; Gholami, L.; Kavian, A.; Khaledi Darvishan, A. Determination of specific contribution of suspended sediment sources in Vaz watershed using geochemical properties. J. Ecohydrol. 2022, 9, 705–718. (In Persian) [Google Scholar] [CrossRef]
  54. Eblaghian, A.; Ali, A.A.; Radmanesh, F.; Zarei, H. Trend Analysis of Temperature, Precipitation, and Relative Humidity Changes in Iran. Irrig. Sci. Eng. 2019, 42, 197–212. [Google Scholar]
Figure 1. The location of the control sub-watershed of Khamsan representative paired watershed in Iran, along with the soil and sediment sampling points in the study area.
Water 17 00073 g001
Figure 2. Land use/land cover maps of the study area based on the 1967 aerial photos (a) and satellite images of the 2021 (b).
Water 17 00073 g002
Figure 3. Preparation steps of soil and sediment samples in the laboratory for 137Cs method.
Water 17 00073 g003
Figure 4. Preparation of soil and sediment samples in the laboratory for geochemical sourcing.
Water 17 00073 g004
Figure 5. Box plot of changes in concentration of final tracers (mg kg−1) in different sediment sources (RA: rainfed agriculture, R: rangeland, IA: irrigated agriculture, O: orchard).
Water 17 00073 g005
Figure 6. Discriminant Function Analysis (a) and Principal Component Analysis (b) plots (RA: rainfed agriculture, R: rangeland, IA: irrigated agriculture, O: orchard).
Water 17 00073 g006
Figure 7. Comparing the relative (a) and specific (b) contribution of land use/land covers in sediment yield using 137Cs and geochemical methods.
Water 17 00073 g007
Table 1. Required information for the implementation of transformation models.
Transformation ModelModel Inputs
Mass balance model IIYear of Tillage Commencement, Bulk density of soil, Tillage depth
Proportion factor (ϒ), Relaxation depth (H), Migration rate (V), Annual fallout of radionuclide
Diffusion and migration model
Table 2. Average contribution of land uses in sediment yield in the last 60 years (by 137Cs method).
Land Uses/CoversOrchardRangelandIrrigated AgricultureRainfed AgricultureRoadStreamRockTotal
Area (ha)0.0446.171.2952.321.030.540.75102.14
Area (%)0.0445.201.2651.221.010.530.73100.00
Contribution (%)3.788.931.8085.49----
land uses erosion (t y−1)−19.90−47.02−9.51−450.43----
Specific Contribution (% per ha)94.500.191.401.63----
Gross erosion (t y−1)−526.87----
Table 3. Results of the Kruskal–Wallis and Range Tests for choosing the optimal combination of tracers.
Test Removed Trackers Remaining Trackers
RT Al, Ba, Be, Fe, Ga, Lu, Pb, Sn, Sr, Te, TmNa, K, Ca, Mg, Li, B, Sc, Ti, V, Cr, Mn, Co, Cu, Zn, Ge, As, Se, Rb, Y, Zr, Nb, Sb, Cs, La, Ce, Pr, Nd, Sm, Eu, Ni, Mo, Hf, Gd, Tb, Dy, Ho, Er, Yb, Ta, W, Hg, Tl, Bi, Th, U
KW Na, K, Ca, Mg, Li, B, Sc, Ti, V, Cr, Mn, Co, Cu, Zn, Ge, As, Se, Rb, Y, Zr, Nb, Sb, Cs, La, Ce, Pr, Nd, Sm, Eu, Gd, Tb, Dy, Ho, Er, Yb, Ta, W, Hg, Tl, Bi, Th, UNi, Mo, Hf
Table 4. Average contribution of land use/land covers in sediment yield by geochemical method (percentage).
Land Uses/CoversOrchardRangelandIrrigated AgricultureRainfed AgricultureRoadStreamRockTotal
Area (ha)0.6352.541.5445.650.590.360.81102.14
Area (%)0.6251.451.5144.690.580.350.80100.00
Contribution (%)4.727.9615.0672.26----
Specific Contribution (% per ha)7.490.159.781.58----
GOF0.78----
Table 5. The known and predicted relative contributions to virtual sediment mixtures, along with the corresponding root mean square error (RMSE) and mean absolute error (MAE).
Known Sediment Source Contributions (%)Predicted Sediment Source Contributions (%)RMSEMAE
RARIAORARIAO
2525252524.219.928.127.83.33.0
10000090.70.76.02.65.74.7
0100001.987.25.65.37.56.4
0010002.63.191.52.84.94.3
0001000.42.63.793.34.03.4
502512.512.542.928.78.719.75.75.5
255012.512.520.948.814.815.52.92.7
256.2556.2512.526.95.462.55.24.94.1
7010101075.46.713.94.04.84.7
8555579.14.613.62.75.34.3
Average4.94.3
Disclaimer/Publisher’s Note: The statements, opinions and data contained in all publications are solely those of the individual author(s) and contributor(s) and not of MDPI and/or the editor(s). MDPI and/or the editor(s) disclaim responsibility for any injury to people or property resulting from any ideas, methods, instructions or products referred to in the content.

