Abstract
During the sudden closure of gates in long-distance gravity flow water supply projects, intense water hammer waves are generated. These waves can cause severe damage to the water supply tunnel structure, posing a significant threat to project safety. To develop an economical and effective hydraulic safety control strategy, this study uses the example of a specific gravity flow water supply project with long-distance and multi-fluctuation pressure tunnels in Zhejiang Province. A novel combined protection strategy was investigated, involving the conversion of construction branch tunnels into branch tunnel surge tanks combined with an overflow surge tank. Numerical simulations of gate closure-induced water hammer pressures were conducted using the method of characteristics. Additionally, the effectiveness of the overflow surge tank on controlling the surge water level in the branch tunnels was analyzed with respect to variations in its height, diameter, and impedance hole diameter. The results indicate that a 300 s linear gate closure without any protective measures induces severe water hammer pressure. Extending the closure time to 1200 s still results in pressures far exceeding the safety threshold. Converting construction branch tunnels into surge tanks effectively controlled the water hammer pressure; however, overflow issues emerged in some branch tunnels. The subsequent addition of an overflow surge tank at the end of the water supply system successfully eliminated the risk of overflow in the branch tunnels. Building upon this, multi-parameter optimization analysis was used to determine the optimal configuration for the overflow surge tank. This solution ensures hydraulic safety while maintaining cost-effectiveness. Both the maximum pressure and the minimum pressure along the water supply tunnel, as well as the surge water levels in all branch tunnels, meet the code requirements. Furthermore, the reduced size of the surge tank significantly lowered construction costs. The findings of this research provide theoretical foundations and technical support for similar long-distance gravity flow water supply projects.
1. Introduction
Water hammer protection remains a critical technical challenge for ensuring operational safety in long-distance water supply systems. As water hammer pressure exhibits complex fluctuation characteristics influenced by factors such as pipeline layout and valve operation, optimizing protective measures for diverse project scenarios continues to be a key research focus. Ikeo et al. [1] demonstrated that dual-valve regulation significantly outperforms single-valve regulation in pipeline systems, with intermediate valve placement and closure sequence affecting the maximum pressure rise. Lohrasbi et al. [2] showed that valve operation induces flow oscillations, with numerical calculations confirming that shorter closing times generate substantial water hammer pressure. Afshar [3] established an optimal valve closing sequence via an optimization algorithm, significantly reducing maximum system pressure. Zhu et al. [4] used the method of characteristics to analyze transient flow in long-distance gravity systems, finding central valve control superior to downstream control in pipelines with elevated ends and a depressed center, thereby reducing working pressure and costs. Yang et al. [5] experimentally demonstrated that check valves can effectively mitigate water hammer pressure from a parallel twin pump operation in nuclear circuits. Bettaieb et al. [6], using MATLAB-based transient analysis, illustrated that valve combinations with optimized closure rates markedly diminish transient pressure.
Beyond valve control, air valves and air chambers are essential for water hammer mitigation, with significant progress in structural optimization and functional analysis. Stephenson [7] proposed that a vertical connecting pipe between the pipeline and air valve mitigates pressure spikes from rapid closure, providing a basis for improved installation. Lee et al. [8] found that air valve inlet/outlet flow coefficients substantially influence protection efficacy. Bergant et al. [9] established that air valves mitigate pressure fluctuations and prevent structural damage from excessive pressure differentials. Huang et al. [10] systematically evaluated air valve configurations, finding that both the quantity and positioning of these valves critically impact protection. Coronado-Hernández et al. [11] developed and validated a mathematical model for negative pressure water hammer during pipe drainage, confirming air valve effectiveness. Stephenson [12] identified key air chamber factors, providing a sizing methodology and pressure estimation tables. Izquierdo et al. [13] built a model for optimizing air chambers using neural networks and developed transient analysis software (DYAGATS). Ramalingam et al. [14] similarly optimized air chamber parameters for water distribution networks. Ilić Jovan et al. [15] devised a novel vented air chamber, with simulations showing enhanced protection.
Surge tanks are crucial protective structures, with an ongoing focus on design and optimization. Kim [16] optimized surge tank dimensions and placement using genetic algorithms, balancing safety and cost. Kendir and Ozdamar [17] numerically analyzed surge tanks in terms of hydropower, optimizing layouts using the method of characteristics and finite differences. Bubalo et al. [18] studied the effects of small losses at the connection between the surge tank and the tunnel, and found a strong match between their calculated level changes and real-world data. Mahmoudi-Rad et al. [19] used the method of characteristics to study how water moves in and out of a surge tank at a hydropower dam, discovering that a surge tank with a diameter of 6 m and a connecting pipe of 3.4 m can effectively lessen pressure changes. Wan et al. [20] suggested a unique spring-adaptive auxiliary control scheme. They formulated an ideal design methodology for spring-adaptive surge tanks by examining the relationship between the geometric characteristics of the surge tank and the efficacy of water hammer protection.
Recognizing the limitations of individual measures, researchers increasingly focus on integrated protection techniques. Li et al. [21] introduced a synergistic technique using an overpressure relief valve and air chamber, reducing air valve quantity while maintaining protection. Liao et al. [22] found that using a combination of an air valve, a one-way surge tank, and a two-stage check valve greatly improves the system’s negative pressure after the pump is turned off. Chen et al. [23] confirmed via modeling that simultaneous air chamber and air valve use is more effective for water hammer control in large diversions. Lyu [24] introduced a combined air chamber and safety valve system, enhancing safety while minimizing chamber volume. Shi et al. [25] presented an integrated strategy using an overflow surge tank and control valve, reducing well elevation and construction costs.
Although existing research has yielded substantial achievements in water hammer protection, studies on utilizing construction branch tunnels as pressure control measures in long-distance gravity flow water supply projects remain relatively scarce. Taking a gravity flow water supply project with long-distance and multi-fluctuation pressure tunnels as the research object, this study proposes a combined protection strategy involving the conversion of construction branch tunnels into surge tanks coupled with an overflow surge tank, based on actual project conditions. A numerical model was established to simulate the hydraulic transient process. This study systematically analyzes the effectiveness of converted branch tunnel surge tanks in controlling water hammer pressure along the tunnel, with a focus on investigating the impact of overflow surge tank parameter variations on the surge water levels in branch tunnels, to formulate an optimal hydraulic safety control strategy.
2. Methods
2.1. Basic Equations of Water Hammer
Water hammer in pressurized pipelines is an unsteady flow process. Therefore, its fundamental differential equations consist of the equations of motion and continuity; thus, it is a one-dimensional wave equation.
According to the elastic water column theory, it can be divided into the following two equations [26]:
The motion differential equation is as follows:
The continuity differential equation is as follows:
where H is the head of the pipeline, m; V is the flow velocity in the pipeline, m/s; ƒ is the friction coefficient of the pipeline; a is the propagation velocity of the water hammer wave, m/s; α is the angle between the pipeline and the horizontal plane, (°); D is the diameter of the pipeline, m; g is the gravitational acceleration, m2/s; x is the distance traveled by the water hammer wave, m; and t is the time taken for the water hammer wave to propagate, s.
2.2. Method of Characteristics
The method of characteristics (MOC) is a widely used approach for water hammer calculations. Equations (1) and (2) are hyperbolic partial differential equations with two characteristic lines. By applying the method of characteristics, these partial differential equations can be transformed into ordinary differential equations. Through subsequent integration of these equations, with flow velocity V replaced by discharge Q, the characteristic equations can be obtained [26]. The computational grid for the method of characteristics is illustrated in Figure 1.
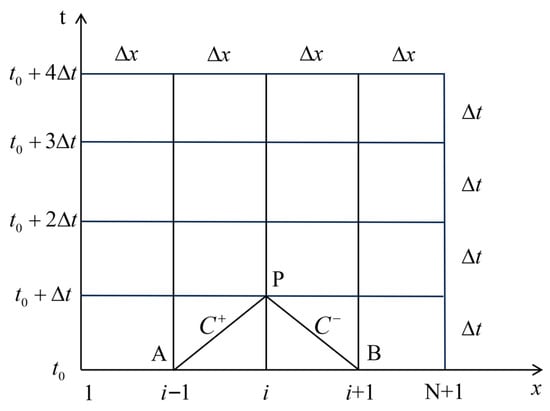
Figure 1.
Computational grid of the method of characteristics.
The positive characteristic equation C+ is as follows:
The negative characteristic equation C− is as follows:
where HPi is the head of section i at time t0 + Δt, m; QPi is the discharge of section i at time t0 + Δt, m3/s; CP and BP are the parameters of the C+ characteristic line; and CM and BM are the parameters of the C− characteristic line. The formulas for CP, CM, BP, and BM are shown in Equations (5)–(8), respectively:
where Hi−1 and Hi+1 are the heads of sections i − 1 and i + 1, m; Qi−1 and Qi+1 are the discharges of section i − 1 and i + 1, m3/s; B is the coefficient, calculated as ; A is the cross-sectional area of the pipeline, m2; R is the coefficient, calculated as ; and Δx is the spatial step, m.
2.3. Boundary Conditions of Upstream and Downstream Reservoirs
In actual water supply projects, pipelines are typically connected to large reservoirs at both upstream and downstream ends. During transient calculations, the water level fluctuations in these reservoirs are negligible. Therefore, the reservoir water level can be regarded as constant, expressed as follows:
where H1 is the head at the pipeline inlet, m; and Hu is the water level of the upstream reservoir, m.
Substituting Equation (9) into Equation (4), the equation can be obtained as follows:
where Q1 is the discharge at the pipeline inlet, m3/s.
Similarly, when the downstream end of the pipeline is a reservoir,
where Hns is the head at the pipeline outlet, m; Hd is the water level of the downstream reservoir, m.
Substituting Equation (11) into Equation (3), the equation can be obtained as follows:
where Qns is the discharge at the pipeline outlet, m3/s.
2.4. Boundary Conditions of Terminal Gate
If the discharge through the gate is Qv and the head loss caused by the gate is ΔH, their relationship can be expressed as follows:
where is the head loss at the gate, m; Qv is the discharge through the gate, m3/s; Av is the flow area of the gate, m2; k1 is the resistance coefficient at the gate; and C is the product of the gate opening area and the flow coefficient.
The relationship between k1 and C can be expressed as follows:
By simultaneously solving Equations (3), (4) and (14), the discharge for different gate openings and the upstream and downstream pressure heads can be determined at any given time.
2.5. Boundary Conditions of Overflow Surge Tank
The overflow surge tank is equipped with an overflow weir at the top and connected to the pressurized pipeline at the bottom via a small-area orifice or connecting pipe [25]. The schematic diagram is shown in Figure 2.
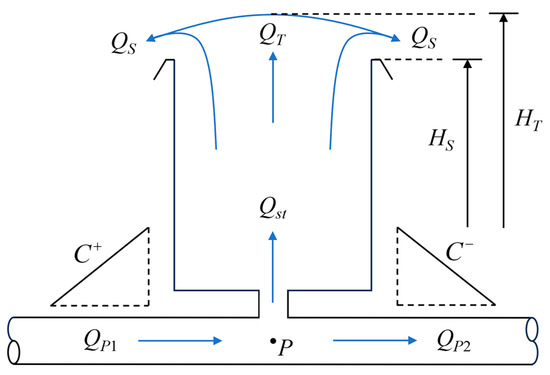
Figure 2.
Schematic diagram of overflow surge tank [25].
The continuity equations are as follows:
where QP1 is the discharge of the pipeline before the surge tank, m3/s; QP2 is the discharge of the pipeline after the surge tank, m3/s; Qst is the discharge into or out of the surge tank, with positive values indicating inflow and negative values indicating outflow, m3/s; QT is the discharge in the surge tank, m3/s; and QS is the overflow discharge of the surge tank, m3/s.
The relationship between the water level and the discharge in the surge tank is as follows:
where Ac is the cross-sectional area of the surge tank, m2; and HT is the water level in the surge tank, m.
The pressure balance equation is as follows:
where k2 is the head loss coefficient of the connecting pipe.
The weir flow equation is as follows:
where m is the flow coefficient of the overflow weir; B1 is the width of the overflow weir, m; and HS is the elevation of the weir crest, m.
Since the time step Δt is very small, Equations (14) and (15) can be simplified as follows:
where HT0 is the value of HT at time t0, m; and QT0 and Qst0 are the values of QT and Qst at time t0, m3/s.
2.6. Numerical Model Development and Validation
This study developed a numerical model based on the Method of Characteristics and implemented it using the Fortran 90 programming language. The model incorporates all relevant boundary conditions, including upstream and downstream reservoirs, gates, branch tunnel surge tanks, and overflow surge tanks. It also accounts for factors such as friction resistance in water supply pipelines or tunnels. To validate the accuracy and reliability of the model, the experimental data from the RPV (reservoir-pipe-valve) valve closure pressure tests conducted by Yu et al. [27] were applied to the model for simulation. The experimental system comprised an upstream water tank with a water level of 6.06 m, a 150 m long steel pipeline with an internal diameter of 0.05 m, and a flow velocity of 0.118 m/s. A butterfly valve (DN50) was installed 2 m from the pipeline outlet and was closed within 0.039 s. The simulated pressure variations at the valve were compared with the experiment results, and the comparison is presented in Figure 3.
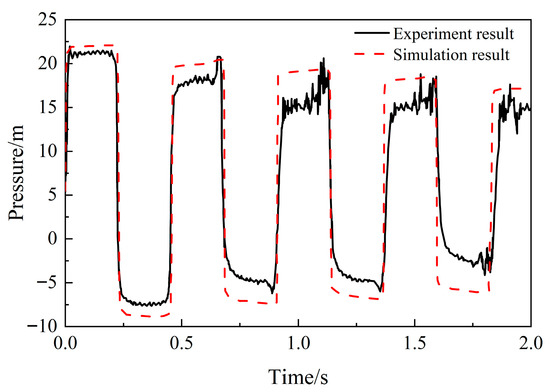
Figure 3.
Pressure variation curves at the valve.
As can be observed from Figure 3, during the initial stage of the water hammer wave (the first positive pressure wave), the numerical simulation results are in good agreement with the measured data, showing largely consistent variation trends, with a maximum error of 5.8%. As the water hammer wave gradually attenuates, the pressure wave in the simulation results decays at a slower rate. This discrepancy is primarily ascribed to the fact that pipe friction is the main factor influencing pressure wave attenuation, and the constant friction coefficient used in the simulation differs somewhat from the actual friction characteristics of the pipeline. Furthermore, potential incomplete valve closure leading to leakage during the actual valve shutdown operation may further intensify the attenuation of the water hammer wave. Although certain deviations exist between the simulation results and the experiment results from the literature, both datasets exhibit highly consistent variation trends and very close extreme pressure values, demonstrating the reliability and validity of the model established in this study.
3. Case Study
3.1. Project Overview
The gravity flow water supply project with long-distance and multi-fluctuation pressure tunnels is located in northern Zhejiang Province. The project consists primarily of an upstream reservoir, water supply tunnels, construction branch tunnels, a control gate, and a downstream reservoir. The total length of the water supply route is 111.96 km, comprising a 104.81 km concrete-lined tunnel section with a diameter of 6.7 m and a roughness coefficient of 0.013 and a 7.15 km steel-lined section with a diameter of 6 m and a roughness coefficient of 0.012. The upstream reservoir has a dam crest elevation of 115 m, with maximum and minimum operating water levels of 108 m and 86 m, respectively. The downstream reservoir operates between maximum and minimum water levels of 70 m and 68 m. The design maximum discharge is 52.2 m3/s, while the minimum discharge is 38.8 m3/s. The geographical location of the study area created by ArcGIS 10.8 software (https://www.arcgis.com) is shown in Figure 4, and the centerline elevation of the water supply tunnel is shown in Figure 5.
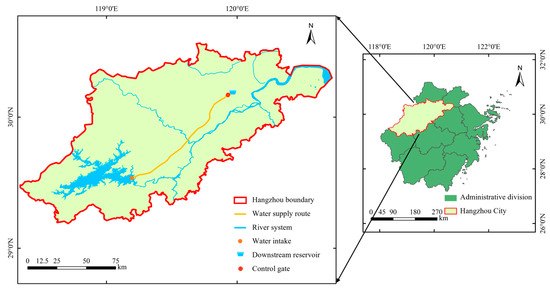
Figure 4.
Geographical location of the study area.
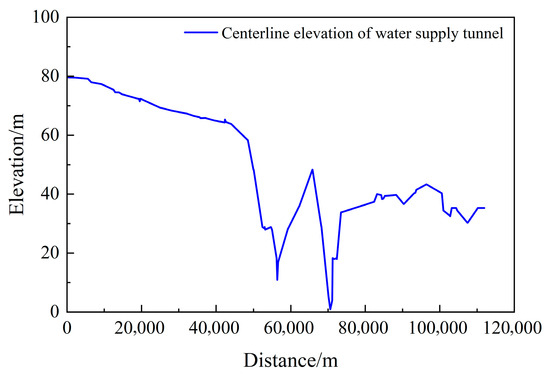
Figure 5.
Centerline elevation of the water supply tunnel.
3.2. Calculation Control Standards
According to the relevant standards and specifications in China, such as “Standard for Design of Outdoor Water Supply Engineering” (GB 50013-2018) [28], “Specification for Design of Hydraulic Tunnel” (SL 279-2016) [29], and “Design Specifications for Surge Chamber of Water Resources and Hydropower Project” (SL 655-2014) [30], combined with the layout and operation characteristics of the project’s water supply system, the calculation control standards are determined as follows:
- (1)
- Water column separation shall be prevented in the water supply system. The instantaneous maximum pressure shall not exceed 1.3 to 1.5 times the working pressure. Considering the water supply tunnel layout and structural requirements of the project, the maximum internal water pressure along the tunnel is controlled not to exceed 120 m.
- (2)
- Under the most unfavorable operating conditions, the minimum pressure at the tunnel crown shall not be less than 2 m. Given that the water hammer pressure obtained from hydraulic transient analysis is calculated at the tunnel centerline, and the main tunnel diameter of this project is 6.7 m, the minimum internal water pressure is controlled not to be lower than 5.4 m.
- (3)
- Overflow shall not be permitted in any branch tunnel surge tank. The freeboard between the maximum surge level and the top elevation of the surge tank shall be controlled to be not less than 1 m, while the safety clearance between the minimum surge level and the crown of the water supply tunnel shall be controlled to be not less than 2 m.
- (4)
- According to the operation requirements of the gate, the gate closure time shall be controlled to be no less than 300 s.
3.3. Selection of Working Conditions
Based on experience from similar projects, closing the gate under short duration, high water level, and large discharge represents the most hazardous working condition. When the gate is closed, it generates a severe water hammer impact that causes a rapid pressure surge along the water supply tunnels and pipelines. The effect can lead to the structural failure of the tunnel or pipe bursts. Therefore, the control condition for hydraulic transition process analysis was selected with the following parameters: a linear gate closure time of 300 s, an upstream reservoir level of 108 m, a downstream reservoir level of 68 m, and a discharge of 52.2 m3/s. If the maximum and minimum water hammer pressures within the supply system satisfy the project design requirements under this working condition, other working conditions will inherently be satisfied. Building upon this, the changes in water hammer pressure before and after converting the construction branch tunnels into surge tanks are compared, and an overflow surge tank is added at the end to reduce the risk of overflow from these branch tunnels. Furthermore, while ensuring the safe operation of the water supply system, the parameters of the overflow surge tank are optimized, and an economically and safety-balanced control strategy is formulated.
4. Results and Analysis
4.1. Numerical Simulation of Hydraulic Transition Process Without Protective Measures
Numerical simulations of the hydraulic transition process were initially performed under a 300 s linear gate closure condition, as specified in Section 3.3, without any additional pressure protection measures along the tunnel. Since extending the closure period is often regarded as a basic mitigation strategy, a comparative scenario with a 1200 s closure duration was analyzed to assess its efficacy in reducing water hammer pressures. Simulation results (Figure 6 and Figure 7) indicated severe water hammer fluctuations during gate closure. For the 300 s closure scenario, the maximum pressure reached 294.27 m, located at stake number 70 + 587.99, while the minimum pressure dropped to −137.25 m, located at stake number 42 + 459.10 (since in practical projects, water vaporizes when the pressure head is lower than −10 m, the calculated result of the minimum pressure only indicates the severity of the negative pressure). Both values significantly exceeded pressure control thresholds.
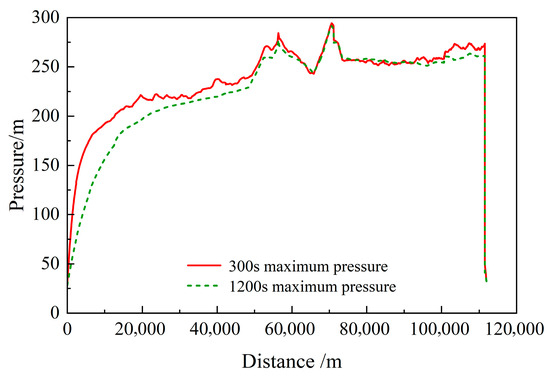
Figure 6.
Variation in maximum pressure along the tunnel under different gate closure times.
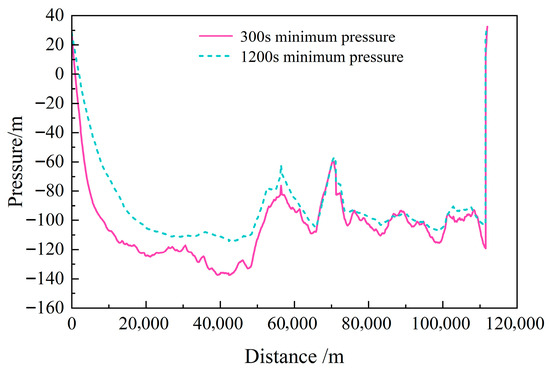
Figure 7.
Variation in minimum pressure along the tunnel under different gate closure times.
Extending the closure time to 1200 s resulted in a moderate reduction in pressure, with the maximum and minimum values reaching 291.44 m and −114.04 m, respectively. However, these values still fall outside the allowable pressure-bearing range of the tunnel, significantly exceeding the upper limit of 120 m and dropping below the lower limit of 5.4 m. Moreover, a longer closure duration prolongs the gate’s exposure to hydraulic impact, accelerating wear and potentially shortening its service life. More critically, a closure operation lasting 1200 s is impractical in emergency situations—such as maintenance or leakage incidents—where rapid flow shutdown is essential. This extended closure time considerably compromises the system’s emergency response capacity. Therefore, increasing the gate closure time is ineffective in ensuring the operational safety of the water supply system, underscoring the necessity of adopting alternative protective measures.
4.2. Numerical Simulation of Hydraulic Transition Process with Multiple-Branch Tunnel Surge Tank Protection
The project has 12 inclined construction branch tunnels along the route. These branch tunnels were originally excavated as temporary access adits during the main tunnel construction phase to provide additional working faces, facilitate material transportation, and accommodate ventilation and drainage systems, thereby significantly enhancing construction efficiency. The arrangement position of the branch tunnels is shown in Figure 8. Prior to repurposing, a comprehensive geological and topographical analysis was conducted for each branch tunnel. This analysis assessed factors such as the stability of the surrounding rock mass, the suitability of the geological conditions for long-term operation as a surge tank, and the alignment and elevation of the branch tunnel relative to the main tunnel and the ground surface. This evaluation ensured the selected branch tunnels were structurally sound and appropriately positioned to function effectively as surge tanks. To reduce project investment and maximize utilization of these construction branch tunnels, all 12 were repurposed as surge tanks based on this favorable assessment. Since construction branch tunnels differ structurally from conventional surge tanks, their cross-sections were converted to equivalent surge tank diameters during calculations based on the principle of volume equivalence. The parameters of each construction branch tunnel and corresponding equivalent surge tank diameters are shown in Table 1.
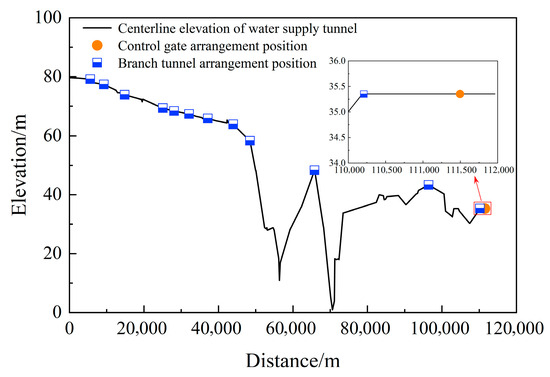
Figure 8.
Arrangement position of branch tunnels.

Table 1.
Parameters of construction for branch tunnels and converted equivalent diameters.
Numerical simulations were conducted for the solution, incorporating multiple branch tunnel surge tanks. The results presented in Figure 9 indicate significant improvements in both the maximum and minimum pressures along the water supply tunnel compared to the scenario without surge tanks. The maximum pressure was reduced by 61.30% to 113.87 m, while the minimum pressure increased notably by 105.09% to 6.98 m, transitioning from negative to positive values. This improvement is attributed to the bidirectional protective function of the branch tunnel surge tanks: when pressure in the water supply tunnel decreases, the surge tanks rapidly supply water to prevent negative pressure formation; when pressure rises, high-pressure water flows into the surge tanks, effectively cushioning the water hammer pressure surge. Consequently, both pressure values meet the established safety standards. However, varying degrees of overflow occurred in several branch tunnel surge tanks, specifically at branches 7#, 8#, 9#, 10#, 11#, and 12#, with overflow volumes of 1633.88 m3, 3172.36 m3, 1171.94 m3, 1061.66 m3, 418.85 m3, and 5320.85 m3, respectively. The total overflow volume reached 12,779.54 m3, resulting in significant water resource losses and substantial disruption to residents’ daily lives along the water supply route.
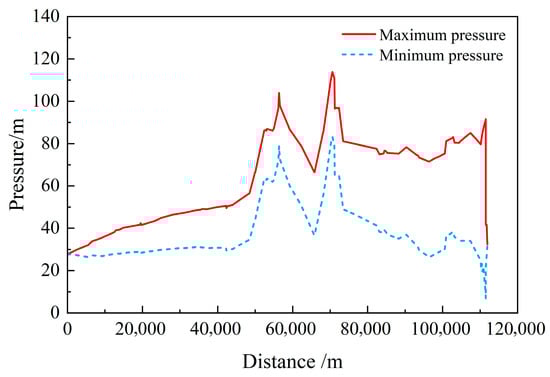
Figure 9.
Pressure envelope curves along the tunnel with the addition of branch tunnel surge tanks.
4.3. Optimization of Overflow Surge Tank and Calculation of Hydraulic Transition Process
To mitigate the adverse effects caused by overflow from multiple branch tunnels, an overflow surge tank was added at stake number 111 + 433.00 along the water supply route to control water level fluctuations in the branch tunnels. When the water level exceeds the top elevation of the overflow surge tank, water discharges directly into the downstream regulating reservoir through overflow facilities. Considering both the operational safety of the water supply system and the imperative to minimize construction costs, a systematic multi-parameter optimization analysis was conducted to determine the optimal dimensions for the overflow surge tank. The primary objective was to identify the configuration that ensures hydraulic safety (meeting all pressure and surge water level control standards) while achieving the smallest possible physical size, thereby significantly reducing excavation volume and associated costs. It should be noted that the excavation volume is primarily a function of the surge tank’s height (difference between top and bottom elevation) and its cross-sectional area (determined by diameter). Based on project conditions, preliminary dimensions were set as follows: bottom elevation is 38.7 m, top elevation is 110 m, diameter is 10 m, and impedance hole diameter is 5 m. Parametric optimization was subsequently conducted on the height, diameter, and impedance hole diameter of the overflow surge tank. Hydraulic transient analysis calculations were performed to determine the maximum and minimum water hammer pressures throughout the water supply system, as well as the maximum and minimum surge water levels in all branch tunnels under various dimension configurations. Through comparative analysis, an optimal design ensuring operational safety while minimizing excavation volume was identified, ultimately defining the optimal height, diameter, and impedance hole diameter. Computational results of hydraulic parameters for different dimensions are presented in Table 2, Table 3, Table 4, Table 5, Table 6 and Table 7 and Figure 10.
The optimization process commenced with an analysis of the surge tank’s height. Scenarios with different top elevations (110 m, 109 m, 108 m, and 107 m) were analyzed while keeping the bottom elevation (38.7 m), diameter (10 m), and impedance hole diameter (5 m) constant. The computational results are presented in Table 2 and Table 3. To ensure that the water supply system reached a fully stabilized state under all scenarios during the calculation process, particularly regarding the post-stabilization overflow condition of the overflow surge tank, the simulation adopted a sufficiently long duration (12,000 s). The variation of overflow discharge from the overflow surge tank with time for different heights is shown in Figure 10.
Table 2.
Pressure extremes along the tunnel under different heights of the overflow surge tank.
Table 2.
Pressure extremes along the tunnel under different heights of the overflow surge tank.
| Scenario | Top Elevation (m) | Bottom Elevation (m) | Diameter (m) | Impedance Hole Diameter (m) | Maximum Pressure (m) | Minimum Pressure (m) |
|---|---|---|---|---|---|---|
| 1 | 110 | 38.7 | 10 | 5 | 113.24 | 23.91 |
| 2 | 109 | 38.7 | 10 | 5 | 112.77 | 23.91 |
| 3 | 108 | 38.7 | 10 | 5 | 111.87 | 23.91 |
| 4 | 107 | 38.7 | 10 | 5 | 111.02 | 23.91 |
Table 3.
Surge water levels in branch tunnels under different heights of the overflow surge tank.
Table 3.
Surge water levels in branch tunnels under different heights of the overflow surge tank.
| Branch Tunnel Number | Scenario 1 | Scenario 2 | Scenario 3 | Scenario 4 | ||||
|---|---|---|---|---|---|---|---|---|
| Hmax (m) | Hmin (m) | Hmax (m) | Hmin (m) | Hmax (m) | Hmin (m) | Hmax (m) | Hmin (m) | |
| 1# | 110.93 | 105.54 | 110.92 | 105.54 | 110.89 | 105.54 | 110.87 | 105.54 |
| 2# | 112.24 | 104.24 | 112.21 | 104.24 | 112.16 | 104.24 | 112.11 | 104.24 |
| 3# | 113.03 | 102.21 | 112.96 | 102.21 | 112.85 | 102.21 | 112.75 | 102.21 |
| 4# | 112.27 | 99.18 | 112.13 | 99.18 | 111.94 | 99.18 | 111.76 | 99.18 |
| 5# | 112.79 | 98.62 | 112.20 | 98.62 | 111.63 | 98.62 | 111.19 | 98.62 |
| 6# | 113.39 | 98.01 | 112.82 | 98.01 | 112.29 | 98.01 | 111.78 | 98.01 |
| 7# | 113.75 | 96.36 | 113.23 | 96.36 | 112.73 | 96.36 | 112.24 | 96.36 |
| 8# | 114.04 | 94.04 | 113.44 | 94.04 | 112.93 | 94.04 | 112.45 | 94.04 |
| 9# | 114.40 | 92.92 | 113.78 | 92.92 | 113.01 | 92.92 | 112.37 | 92.92 |
| 10# | 115.00 | 84.93 | 114.64 | 84.93 | 113.75 | 84.93 | 112.89 | 84.93 |
| 11# | 112.36 | 69.43 | 111.57 | 69.43 | 110.57 | 69.43 | 109.73 | 69.43 |
| 12# | 112.78 | 59.75 | 112.39 | 59.75 | 110.79 | 59.75 | 109.73 | 69.43 |
Notes: Hmax represents the maximum surge water level, and Hmin represents the minimum surge water level.

Figure 10.
Overflow discharges under different heights of the overflow surge tank: (a) the top elevation is 110 m; (b) the top elevation is 109 m; (c) the top elevation is 108 m; (d) the top elevation is 107 m.
Figure 10.
Overflow discharges under different heights of the overflow surge tank: (a) the top elevation is 110 m; (b) the top elevation is 109 m; (c) the top elevation is 108 m; (d) the top elevation is 107 m.

As indicated by the computational results in Table 2 and Table 3, the maximum pressure in the system for Scenarios 1 to 4 ranged from 111.02 m to 113.24 m, while the minimum pressure remained stable at 23.91 m. The water hammer pressure fluctuations consistently fell within safe limits, satisfying operational requirements for the water supply system. With the decreasing height of the overflow surge tank, the maximum surge water levels in all branch tunnels progressively decreased, whereas the minimum surge water levels showed no significant variation.
In Scenarios 1 and 2, the maximum surge water levels in some branch tunnels approached or reached the top elevation (the top elevation of each branch tunnel is shown in Table 1; if the maximum surge level matches the top elevation, it means the tunnel had overflowed). The safety margin was less than 1 m, failing to ensure hydraulic safety. Although Scenarios 3 and 4 met control requirements for both maximum and minimum surge water levels, the overflow volume of the overflow surge tank increased substantially with the reduction in height. As shown in Figure 8, constrained by the maximum operating water level of the upstream reservoir, persistent overflow occurred when the top elevation of the overflow surge tank was below 108 m after stabilization, resulting in failure to completely cut off flow after gate closure. Scenarios 1 to 3 exhibited no overflow after system stabilization, while Scenario 4 yielded a stabilized overflow volume of 10.7 m3/s. Consequently, Scenario 3 (where the top elevation is 108 m) emerged as the optimum among the four scenarios.
Subsequently, with the height of the overflow surge tank now fixed at its optimal value (top elevation 108 m, bottom elevation 38.7 m) and the impedance hole diameter held constant at 5 m, the optimization focused on the tank diameter. A smaller diameter directly translates to reduced excavation volume and lower construction costs. Scenarios with diameters of 9 m, 8 m, 7 m, 6 m, and 5 m were analyzed. The water hammer pressures in the water supply system and the surge water levels in branch tunnels were calculated for varying diameters. The calculation results are presented in Table 4 and Table 5.
Table 4.
Pressure extremes along the tunnel under different diameters of the overflow surge tank.
Table 4.
Pressure extremes along the tunnel under different diameters of the overflow surge tank.
| Scenario | Top Elevation (m) | Bottom Elevation (m) | Diameter (m) | Impedance Hole Diameter (m) | Maximum Pressure (m) | Minimum Pressure (m) |
|---|---|---|---|---|---|---|
| 5 | 108 | 38.7 | 9 | 5 | 111.89 | 22.83 |
| 6 | 108 | 38.7 | 8 | 5 | 111.95 | 23.10 |
| 7 | 108 | 38.7 | 7 | 5 | 111.93 | 22.61 |
| 8 | 108 | 38.7 | 6 | 5 | 112.01 | 22.48 |
| 9 | 108 | 38.7 | 5 | 5 | 111.98 | 22.32 |
Table 5.
Surge water levels in branch tunnels under different diameters of the overflow surge tank.
Table 5.
Surge water levels in branch tunnels under different diameters of the overflow surge tank.
| Branch Tunnel Number | Scenario 5 | Scenario 6 | Scenario 7 | Scenario 8 | Scenario 9 | |||||
|---|---|---|---|---|---|---|---|---|---|---|
| Hmax (m) | Hmin (m) | Hmax (m) | Hmin (m) | Hmax (m) | Hmin (m) | Hmax (m) | Hmin (m) | Hmax (m) | Hmin (m) | |
| 1# | 110.98 | 105.55 | 111.04 | 105.55 | 111.11 | 105.56 | 111.14 | 105.56 | 111.19 | 105.56 |
| 2# | 112.28 | 104.25 | 112.36 | 104.25 | 112.46 | 104.26 | 112.51 | 104.27 | 112.58 | 104.27 |
| 3# | 113.00 | 102.23 | 113.09 | 102.24 | 113.23 | 102.25 | 113.27 | 102.26 | 113.27 | 102.26 |
| 4# | 112.11 | 99.20 | 112.19 | 99.22 | 112.38 | 99.23 | 112.41 | 99.24 | 112.53 | 99.25 |
| 5# | 111.59 | 98.64 | 111.62 | 98.66 | 111.81 | 98.68 | 111.83 | 98.69 | 111.95 | 98.70 |
| 6# | 112.29 | 98.03 | 112.32 | 98.05 | 112.30 | 98.06 | 112.32 | 98.07 | 112.31 | 98.08 |
| 7# | 112.80 | 96.38 | 112.85 | 96.39 | 112.88 | 96.41 | 112.91 | 96.42 | 112.94 | 96.43 |
| 8# | 113.06 | 94.06 | 113.13 | 94.08 | 113.23 | 94.10 | 113.27 | 94.11 | 113.35 | 94.12 |
| 9# | 113.04 | 92.95 | 113.04 | 92.97 | 113.16 | 92.99 | 113.16 | 93.00 | 113.24 | 93.01 |
| 10# | 113.76 | 84.96 | 113.83 | 84.99 | 113.82 | 85.01 | 113.85 | 85.03 | 113.85 | 85.05 |
| 11# | 110.60 | 69.47 | 110.65 | 69.50 | 111.02 | 69.53 | 111.24 | 69.56 | 111.48 | 69.58 |
| 12# | 110.70 | 59.81 | 109.09 | 59.68 | 111.46 | 59.56 | 110.39 | 59.94 | 110.59 | 59.77 |
Table 4 and Table 5 demonstrate that reducing the overflow surge tank diameter (from 9 m to 5 m) while maintaining constant height and impedance hole diameter induced only marginal variations in the maximum and minimum pressures along the water supply tunnel. Specifically, the maximum pressure increased by merely 0.12 m, while the minimum pressure decreased by 0.51 m; both remained well within safe operational limits. These results indicated that the pressure control effectiveness was not significantly compromised by reducing the diameter within this range. Concurrently, the maximum and minimum surge water levels in all branch tunnels exhibited a progressively rising trend characterized by a rapid initial increase followed by gradual growth as the tank diameter decreased. When the diameter was reduced to 5 m (matching the impedance hole diameter), all surge water levels still satisfied hydraulic control requirements.
Considering that smaller tank diameters significantly reduced excavation volume, whereas decreasing the impedance hole diameter elevated surge water levels in upstream branch tunnels, we implemented the co-optimization of these two parameters based on Scenario 9. This co-optimization objective was used to determine if further reductions in size were possible while maintaining safety margins. The computational results are presented in Table 6 and Table 7.
Table 6.
Pressure extremes along the tunnel under different diameters and impedance hole diameters of the overflow surge tank.
Table 6.
Pressure extremes along the tunnel under different diameters and impedance hole diameters of the overflow surge tank.
| Scenario | Top Elevation (m) | Bottom Elevation (m) | Diameter (m) | Impedance Hole Diameter (m) | Maximum Pressure (m) | Minimum Pressure (m) |
|---|---|---|---|---|---|---|
| 10 | 108 | 38.7 | 4.5 | 4.5 | 112.02 | 22.14 |
| 11 | 108 | 38.7 | 4 | 4 | 112.06 | 21.15 |
| 12 | 108 | 38.7 | 3.5 | 3.5 | 112.17 | 19.95 |
Table 7.
Surge water levels in branch tunnels under different diameters and impedance hole diameters of the overflow surge tank.
Table 7.
Surge water levels in branch tunnels under different diameters and impedance hole diameters of the overflow surge tank.
| Branch Tunnel Number | Scenario 10 | Scenario 11 | Scenario 12 | |||
|---|---|---|---|---|---|---|
| Hmax (m) | Hmin (m) | Hmax (m) | Hmin (m) | Hmax (m) | Hmin (m) | |
| 1# | 111.22 | 105.56 | 111.25 | 105.56 | 111.29 | 105.56 |
| 2# | 112.62 | 104.28 | 112.68 | 104.28 | 112.73 | 104.28 |
| 3# | 113.43 | 102.27 | 113.50 | 102.27 | 113.57 | 102.27 |
| 4# | 112.61 | 99.25 | 112.71 | 99.26 | 112.80 | 99.26 |
| 5# | 112.03 | 98.70 | 112.13 | 98.70 | 112.22 | 98.70 |
| 6# | 112.32 | 98.08 | 112.34 | 98.09 | 112.39 | 98.09 |
| 7# | 112.97 | 96.43 | 113.01 | 96.43 | 113.05 | 96.44 |
| 8# | 113.40 | 94.12 | 113.45 | 94.12 | 113.49 | 94.13 |
| 9# | 113.29 | 93.02 | 113.36 | 93.02 | 113.41 | 93.02 |
| 10# | 113.89 | 85.05 | 113.94 | 85.06 | 114.05 | 85.06 |
| 11# | 111.65 | 69.58 | 111.82 | 69.59 | 112.00 | 69.59 |
| 12# | 110.52 | 60.00 | 110.82 | 59.86 | 110.88 | 59.97 |
Table 6 and Table 7 present variations in the water hammer pressures within the water supply system and in the surge water levels in the branch tunnels when both the diameter and the impedance hole diameter of the surge tank are synchronously reduced, while its top elevation remains fixed at 108 m. All three scenarios demonstrated maximum and minimum water hammer pressures that satisfied operational safety requirements. According to Table 7, the differences between the minimum surge water levels and the corresponding tunnel invert elevations exceeded 2 m in all scenarios, meeting the minimum surge control standard.
For maximum surge water levels, Scenarios 10 and 11 maintained a no-loss 1 m clearance to the top elevations without overflow occurrences in any branch tunnel. In contrast, Scenario 12 exhibited a maximum surge water level of 114.05 m in Branch Tunnel 10# against its top elevation of 115.00 m, resulting in an insufficient safety margin of 0.95 m. This scenario failed to meet the 1 m hydraulic safety threshold. Further reductions in diameters would have posed overflow risks in some branch tunnels. Comparative analysis showed that while both Scenarios 10 and 11 satisfied all control requirements, Scenario 11 featured a smaller overflow surge tank diameter and impedance hole diameter, resulting in a smaller excavation volume reduction. This reduction in dimensions translates directly into a smaller cross-sectional area and, consequently, a significant reduction in excavation volume for the overflow surge tank. Consequently, Scenario 11 was selected as the optimum among these scenarios due to its superior economic efficiency.
Comprehensive evaluation of all 12 scenarios against four criteria—water hammer pressure, branch tunnel surge water levels, overflow conditions, and construction costs—identified Scenario 11 (with a bottom elevation of 38.7 m, top elevation of 108 m, diameter of 4 m, and impedance hole diameter of 4 m) as the optimal configuration. Compared to the initial design (Scenario 1), this optimized design reduces the height by 2 m, the diameter by 6 m, and the impedance hole diameter by 1 m. These dimensional reductions result in an 84.5% reduction in the volume of the overflow surge tank, which corresponds to a significant 84.5% decrease in overall excavation volume. This configuration not only ensures operational safety but also substantially lowers construction difficulty and project costs, achieving an optimal balance between economic efficiency and hydraulic safety.
5. Conclusions
In response to the issue of hydraulic safety control in the gravity flow water supply project with long-distance and multi-fluctuation pressure tunnels, a mathematical model of the hydraulic transition process is established, and gate closure water hammer analysis and protection measure optimization are carried out based on the actual project conditions. The main conclusions are as follows:
- (1)
- Under unprotected conditions, even when extending the gate closure time from 300 s to 1200 s, the maximum water hammer pressure reached 291.44 m, and the minimum negative pressure was −114.04 m, far exceeding safe thresholds. Therefore, for high-head, long-distance, multi-fluctuation gravity flow supply systems, merely prolonging the closure time cannot resolve severe water hammer pressure fluctuations; additional protective measures are essential.
- (2)
- Converting construction branch tunnels into surge tanks allowed for resource reuse and reduced the investment required for dedicated surge tank construction. This measure lowered the maximum pressure to 113.87 m and raised the minimum pressure to 6.98 m, effectively controlling water hammer fluctuations. However, overflow occurred in multiple branch tunnels, with a total overflow volume of 12,779.54 m3. This indicates that while branch tunnel surge tanks can improve pressure fluctuations, they pose risks of excessively high surge water levels and overflow.
- (3)
- Adding an overflow surge tank at the end of the supply system effectively eliminated branch tunnel overflow. Through multi-parameter optimization analysis, an optimal scenario can be determined for the overflow surge tank related to the bottom elevation, top elevation, diameter, and impedance hole diameter. This scenario ensured no overflow in any branch tunnel while meeting surge level specifications, significantly reducing construction difficulty and investment costs. The combined protective strategy—converting construction branch tunnels into surge tanks coupled with the overflow surge tank—strikes a favorable balance between hydraulic safety and economic efficiency.
In summary, this study analyzed the effectiveness of a combined hydraulic safety control strategy—converting construction branch tunnels into surge tanks coupled with an overflow surge tank—for a gravity flow water supply project with long-distance and multi-fluctuation pressure tunnels, using the Method of Characteristics for hydraulic transient simulation. Although the approach demonstrated effective water hammer suppression and prevention of branch tunnel overflow in the selected project case, and an optimal control strategy balancing both economy and safety was identified—offering valuable insights for similar projects—the analysis was limited to a single engineering case. To derive more comprehensive and generalizable conclusions, future studies should incorporate a wider range of project examples for further analysis.
Author Contributions
Conceptualization, J.M. and J.H.; methodology, J.M., J.H., and Y.W.; software, J.M., J.H., and W.H.; validation, H.G., P.L., and Y.Z.; formal analysis, J.M.; investigation, J.M. and J.H.; resources, J.M.; data curation, J.M. and F.X.; writing—original draft preparation, J.M. and J.H.; writing—review and editing, J.M., J.H. and J.C.; visualization, Y.W.; supervision, H.G.; project administration, J.M.; funding acquisition, J.H. All authors have read and agreed to the published version of the manuscript.
Funding
This work is supported by the joint funds of the Zhejiang Provincial Natural Science Foundation of China (LZJWZ22E090004).
Data Availability Statement
The numerical simulation data and experimental data used to support the findings of this study are available from the corresponding author upon request.
Acknowledgments
The authors are grateful for the research collaboration.
Conflicts of Interest
Author Yichen Wang was employed by the company Yongding River Investment Co., Ltd. The remaining authors declare that the research was conducted in the absence of any commercial or financial relationships that could be construed as a potential conflict of interest.
References
- Ikeo, S.; Kobori, T. Water hammer caused by valve stroking in a pipe line with two valves. Bull. JSME 1975, 18, 1151–1157. [Google Scholar] [CrossRef][Green Version]
- Lohrasbi, A.R.; Attarnejad, R. Water hammer analysis by characteristic method. Am. J. Eng. Appl. Sci. 2008, 1, 287–294. [Google Scholar] [CrossRef]
- Afshar, H.; Kerachian, R.; Bazargan-Lari, M.R.; Niktash, A.R. Developing a closing rule curve for valves in pipelines to control the water hammer impacts: Application of the NSGA-II optimization model. In Pipelines 2008: Pipeline Asset Management: Maximizing Performance of our Pipeline Infrastructure; ASCE Library: Reston, VA, USA, 2008; pp. 1–10. [Google Scholar]
- Zhu, M.L.; Zhang, Y.H.; Wang, T. Discussion on operation mode of long distances gravity-fed pressure diversion project. Adv. Mater. Res. 2012, 433, 7125–7130. [Google Scholar] [CrossRef]
- Yang, Z.; Zhou, L.; Dou, H.; Lu, C.; Luan, X. Water hammer analysis when switching of parallel pumps based on contra-motion check valve. Ann. Nucl. Energy 2020, 139, 107275. [Google Scholar] [CrossRef]
- Bettaieb, N.; Taieb, E.H. Assessment of failure modes caused by water hammer and investigation of convenient control measures. J. Pipeline Syst. Eng. Pract. 2020, 11, 151–162. [Google Scholar] [CrossRef]
- Stephenson, D. Effects of air valves and pipework on water hammer pressures. J. Transp. Eng. 1997, 123, 101–106. [Google Scholar] [CrossRef]
- Lee, T.S. Air influence on hydraulic transients on fluid system with air valves. J. Fluids Eng. 1999, 121, 646–650. [Google Scholar] [CrossRef]
- Bergant, A.; Kruisbrink, A.; Arregui, F. Dynamic behaviour of air valves in a large-scale pipeline apparatus. J. Mech. Eng. 2012, 58, 225–237. [Google Scholar] [CrossRef]
- Huang, S.F.; Wang, F.; Xu, H.; Wei, X.X. Analysis on air valve placement in long-distance water conveyance pipeline system. Adv. Mater. Res. 2013, 610, 2513–2518. [Google Scholar] [CrossRef]
- Coronado-Hernández, O.E.; Fuertes-Miquel, V.S.; Besharat, M.; Ramos, H.M. Experimental and numerical analysis of a water emptying pipeline using different air valves. Water 2017, 9, 98–105. [Google Scholar] [CrossRef]
- Stephenson, D. Simple guide for design of air vessels for water hammer protection of pumping lines. J. Hydraul. Eng. 2002, 128, 792–797. [Google Scholar] [CrossRef]
- Izquierdo, J.; Lopez, P.A.; Lopez, G.; Martinez, F.J.; Perez, R. Encapsulation of air vessel design in a neural network. Appl. Math. Model. 2006, 30, 395–405. [Google Scholar] [CrossRef]
- Ramalingam, D.; Lingireddy, S. Neural network–derived heuristic framework for sizing surge vessels. J. Water Resour. Plan. Manag. 2014, 140, 678–692. [Google Scholar] [CrossRef]
- Ilić, J.; Božić, I.; Petković, A.; Karadžić, U. A Novel Approach to the Improvement of the Hydropower Plants Protective Measures—Modelling and Numerical Analyses of the Semi-Pneumatic Surge Tank. Appl. Sci. 2022, 12, 2353. [Google Scholar] [CrossRef]
- Kim, S.H. Design of surge tank for water supply systems using the impulse response method with the GA algorithm. J. Mech. Sci. Technol. 2010, 24, 629–636. [Google Scholar] [CrossRef]
- Kendir, T.E.; Ozdamar, A. Numerical and experimental investigation of optimum surge tank forms in hydroelectric power plants. Renew. Energy 2013, 60, 323–331. [Google Scholar] [CrossRef]
- Bubalo, A.; Torlak, M.; Isić, S. Estimation of the minor-loss at the junction of a headrace tunnel and a surge tank with an orifice. In Proceedings of the International Conference “New Technologies, Development and Applications”, Sarajevo, Bosnia and Herzegovina, 27–29 June 2019; pp. 523–529. [Google Scholar]
- Mahmoudi-Rad, M.; Najafzadeh, M. Effects of surge tank geometry on the water hammer phenomenon: Numerical investigation. Sustainability 2023, 15, 2312. [Google Scholar] [CrossRef]
- Wan, W.; Wang, Y.; Chen, X.; Zhan, H.; Wang, T.; Zhang, B. Investigation of partially expanded surge tank with self-adaptive auxiliary system controlling water hammer in pipelines. Eng. Sci. Technol. Int. J. 2023, 40, 101379. [Google Scholar] [CrossRef]
- Li, G.; Baggett, C.C.; Rosario, R.A. Air/vacuum valve breakage caused by pressure surges—Analysis and solution. In Proceedings of the World Environmental and Water Resources Congress: Great Rivers, Kansas City, MO, USA, 17–21 May 2009; pp. 1–10. [Google Scholar]
- Liao, G.L.; Zhong, L.T.; Jiang, H.X.; Yu, X. An analysis of hydraulic transition and research on water-hammer protection measures in long-distance pipeline. China Rural. Water Hydropower 2019, 31, 787–793. (In Chinese) [Google Scholar]
- Chen, X.; Zhang, J.; Yu, X.; Chen, S.; Shi, L. Study on joint protection of air tank and air valve in long-distance water supply system. J. Press. Vessel Technol. 2022, 144, 061701. [Google Scholar] [CrossRef]
- Lyu, J.; Zhang, J.; Wang, X.; Xu, T. A combined water hammer protective method for optimizing the volume of the air vessel in water supply systems. AQUA Water Infrastruct. Ecosyst. Soc. 2021, 70, 1217–1230. [Google Scholar] [CrossRef]
- Shi, L.; Zhang, J.; Yu, X.; Chen, S.; Zhao, W.; Chen, X. Water hammer protection for diversion systems in front of pumps in long-distance water supply projects. Water Sci. Eng. 2023, 16, 211–218. [Google Scholar] [CrossRef]
- Wylie, E.B.; Streeter, V.L.; Suo, L. Fluid Transients in Systems; Prentice Hall: Englewood Cliffs, NJ, USA, 1993; Volume 1. [Google Scholar]
- Yu, C.; Yu, X.; Zhang, L.; Neupane, B.; Zhang, J. Approximate approach for improving pressure attenuation accuracy during hydraulic transients. Water Supply 2022, 22, 3387–3398. [Google Scholar] [CrossRef]
- GB 50013-2018; Standard for Design of Outdoor Water Supply Engineering. China Planning Press: Beijing, China, 2018.
- SL 279-2016; Specification for Design of Hydraulic Tunnel. China Water & Power Press: Beijing, China, 2016.
- SL 665-2014; Design Specifications for Surge Chamber of Water Resources and Hydropower Project. China Water & Power Press: Beijing, China, 2014.


Disclaimer/Publisher’s Note: The statements, opinions and data contained in all publications are solely those of the individual author(s) and contributor(s) and not of MDPI and/or the editor(s). MDPI and/or the editor(s) disclaim responsibility for any injury to people or property resulting from any ideas, methods, instructions or products referred to in the content. |
© 2025 by the authors. Licensee MDPI, Basel, Switzerland. This article is an open access article distributed under the terms and conditions of the Creative Commons Attribution (CC BY) license (https://creativecommons.org/licenses/by/4.0/).