Abstract
Access to safe drinking water is a critical public health priority, particularly in arid regions such as Saudi Arabia where water scarcity and reliance on desalination present unique challenges. This study was conducted to evaluate the quality of drinking water in Madinah City and to examine the potential influence of the distribution system on water quality before it reaches consumers. Water samples were systematically collected from both primary and secondary reservoirs as well as from points within the distribution network. The samples were analyzed for key physical parameters, inorganic constituents, heavy metals, volatile organic compounds, and microbiological indicators using standard laboratory procedures. The results demonstrate that Madinah’s drinking water meets national and WHO drinking water quality standards, with most parameters well below the maximum contaminant levels (MCLs). Slight variations were observed between the primary and secondary reservoirs, likely due to the blending of desalinated seawater with groundwater. Importantly, six heavy metals—iron (115 µg/L), aluminum (48.5 µg/L), copper (58 µg/L), lead (0.22 µg/L), magnesium (7.15 µg/L), and strontium—were detected at higher concentrations in the distribution system compared to the reservoir sources (15, 15, 8.5, <0.05, and 0.71 µg/L, respectively). Although these values remained within acceptable limits, their presence suggests potential leaching from distribution pipes and underscores the need for continuous monitoring. This study provides an evidence-based assessment of water quality in Madinah, offering valuable insights for water authorities to strengthen monitoring programs and ensure long-term protection of public health.
1. Introduction
Ensuring the quality of drinking water is essential for protecting public health. Numerous documented outbreaks of waterborne diseases have been linked to contaminated drinking water, leading to substantial loss of life [1,2,3]. According to the World Health Organization (WHO), approximately 80% of global illnesses are linked to water-related issues. Furthermore, it is reported that over 783 million people around the world still lack access to safe drinking water [4,5]. While water treatment facilities in urban areas typically reduce contaminants in drinking water to safe levels, the quality of water often declines as it moves through the distribution network. Therefore, maintaining the safety and quality of drinking water depends not only on effective treatment processes but also on the condition of the distribution infrastructure.
Water quality degradation within distribution systems generally results from a combination of physical, chemical, and biological interactions. As such, preserving the structural and functional integrity of the distribution network is essential in preventing contamination. A robust distribution system must act as a protective barrier as water travels from treatment plants to end users. Factors that can compromise system integrity include infiltration from surrounding environments, backflow or back siphonage, the use of uncovered or poorly maintained storage tanks, and activities such as pipeline installation and repair [6,7].
Infiltration-related contamination occurs when pollutants from surrounding soil or groundwater penetrate low-pressure areas of the water distribution network. This typically happens through small openings such as corrosion-induced pinholes, structural cracks, or leaking pipe joints. These low-pressure conditions are often the result of high-water demand or inconsistent water supply—issues that are prevalent in water-scarce regions like Saudi Arabia.
Back siphonage is another concern, where polluted surface water is drawn into the distribution system through reverse flow. This usually takes place when a pressure drop coincides with a physical connection between the distribution pipes and a contaminated water source. Additionally, when treated water is stored in uncovered reservoirs before entering the distribution system, it becomes vulnerable to contamination [8].
Water quality can also decline during infrastructure work, such as pipeline maintenance, replacement, or expansion of the network. If pipes are exposed to dirt or debris during installation, or if proper cleaning and disinfection procedures are not followed, contaminants may enter the system. These materials can serve as nutrients that promote microbial growth inside the pipelines [9]. Such biological activity can significantly impair water quality and potentially impact public health. In the city of Madinah, efforts to expand the water distribution network are ongoing. Without strict adherence to best practices during pipe installation or repair, the risk of introducing contaminants into the drinking water supply increases, as outlined above.
Beyond the physical integrity of the distribution network, the type of piping material and the mineral characteristics of the source water play a crucial role in determining whether conditions conducive to corrosion exist within the system [10]. Studies have demonstrated that biological activity contributing to water quality degradation in distribution networks can be influenced by the mineral makeup of the incoming water [11,12]. Additional water chemistry factor such as alkalinity, pH, and levels of dissolved oxygen also impact the potential for corrosion.
Typically, corrosion within pipelines results in noticeable changes in water quality, including increased turbidity, discoloration, and elevated levels of pipe-related elements like iron. While corrosion products and deposits inside pipes may eventually stabilize in equilibrium with the treated water, any alterations in water chemistry or hydraulic flow can disrupt this balance. Such disturbances can trigger reactions between the water and pipe walls or accumulated deposits, ultimately impairing the quality of water delivered to end users [13]. Discoloration refers to visible changes in the appearance of drinking water, typically associated with a yellowish, brownish, or reddish tint. Such discoloration is generally caused by the presence of suspended particles, corrosion products (e.g., iron and manganese oxides) from distribution pipes, or the mobilization of sediments within the network.
Moreover, combining two or more treated water sources within the distribution system as is currently practiced in Madinah can result in water instability. Previous research has shown that blending different stable sources can lead to chemical imbalances, increasing the likelihood of corrosion product release into the flowing water [14].
In Madinah, drinking water quality is influenced by a combination of natural and anthropogenic factors, as well as past system-related concerns. Groundwater in the region naturally exhibits elevated salinity, hardness, and trace metal concentrations due to the underlying geology and arid climatic conditions, which increase the potential for scaling and corrosion within the distribution system [9,10,14]. At the same time, rapid urbanization, infrastructure expansion, and rising water demand have placed significant strain on the distribution network, often resulting in intermittent supply and pressure fluctuations that heighten the risks of back-siphonage and infiltration. Furthermore, past local reports have documented consumer complaints regarding taste, odor, and discoloration of tap water, suggesting that water quality deterioration may be linked more to distribution network degradation than to deficiencies in treatment processes [15,16]. Together, these factors highlight the critical importance of systematically assessing both water quality and distribution system performance to safeguard public health.
While many studies have evaluated drinking water quality in urban systems globally, very limited research has focused on the holy city of Madinah, an area of unique importance due to its rapidly growing population, arid climate, and reliance on multiple water sources [15,16,17]. Unlike previous studies that primarily characterize water quality at treatment plants, this study evaluates the performance of the distribution network and its role in water quality degradation. Furthermore, the simultaneous blending of different treated water sources within Madinah’s network provides a unique case for studying the impacts of mixing on water stability, corrosion, and end-user quality. These findings can inform not only Saudi Arabia but also other regions facing similar conditions (e.g., the Middle East or North Africa).
This study presents a comprehensive assessment of drinking water quality in Madinah City, Saudi Arabia, with a focus on understanding how the distribution network influences the water consumed by the public. To the best of our knowledge, this is the first in-depth investigation evaluating both the water quality and the performance of the distribution infrastructure in the city. Samples were collected from the main and secondary water reservoirs as well as five different locations across the distribution system. Water quality was analyzed and compared between the source reservoirs (prior to entering the distribution system) and the end points within the network. The findings of this study provide critical insights for municipal decision-makers and contribute to the broader understanding of how distribution systems affect the safety and quality of drinking water.
2. Materials and Methods
2.1. Study Area
Madinah City, situated in the western region of Saudi Arabia, lies within an arid climatic zone (see Figure 1). Over recent decades, the city has experienced substantial urban expansion, accompanied by a sharp population increase—from approximately 200,000 residents in 1981 to around 2,080,436 by 2016 [18,19]. In addition to its resident population, Madinah hosts several million visitors annually due to its religious significance as one of the holiest cities in Islam.
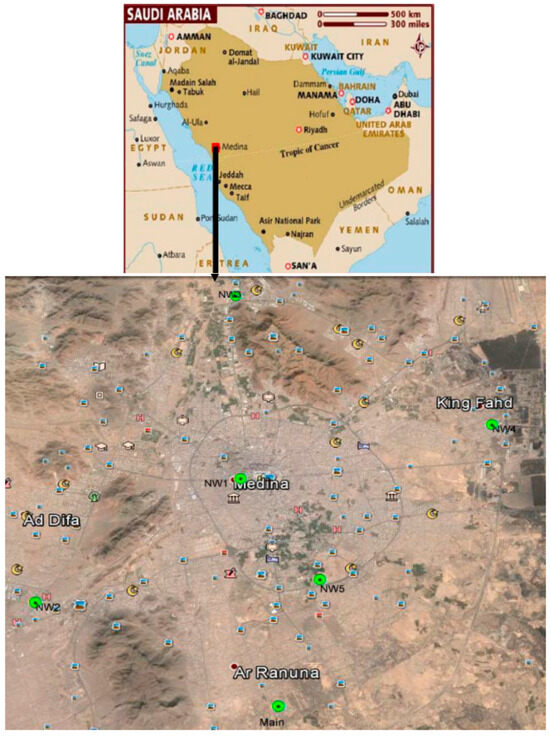
Figure 1.
Location of Madinah City and the sampling points from the drinking water network within the city (Main, NW1, NW2, NW3, NW4, and NW5).
Despite its growth, many areas of the city continue to experience intermittent access to drinking water, primarily due to limited water availability. The city’s potable water supply is primarily sourced from desalinated seawater, which is blended with groundwater at an estimated ratio of 3:1. The desalinated water originates from Yanbu, a coastal city on the Red Sea, and is transported to Madinah via two major transmission pipelines (Figure 2).
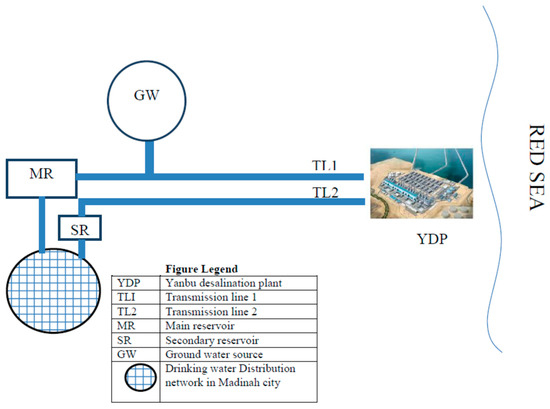
Figure 2.
Schematic representation of drinking water supply system to Madinah City (not to scale).
One of these pipelines mixes the desalinated water with groundwater before it is stored in a central reservoir, from which water is then distributed throughout the municipal network. The second pipeline transports desalinated water directly to a secondary reservoir located within Madinah. This supply framework is illustrated in Figure 2.
2.2. Sample Collection and Analyses
Water sampling was conducted at two primary locations in Madinah City the main and secondary storage reservoirs as well as at five separate points along the city’s main distribution lines (refer to Figure 1). The main reservoir, situated at an elevation of approximately 694 m above mean sea level, supplies water to the distribution system solely through gravity flow. To maintain sample integrity, clean plastic containers were used to collect water directly from the reservoirs.
Five sampling locations within the Madinah distribution network were selected to represent distinct hydraulic zones and geographic coverage (north, south, east, west, and central corridors). At each site, taps were disinfected (70% ethanol), then flushed for 2–4 min to remove stagnant water before sampling. For physicochemical analyses, water was collected in duplicate using clean polyethylene 200 mL containers (Saudi Basic Industries Corporation, Jubail Industrial City, Saudi Arabia); for microbiological analyses, duplicate samples were collected in sterilized 100 mL polyethylene containers. All personnel used appropriate PPE (e.g., gloves) during sample collection to prevent contamination. In situ measurements (e.g., temperature and pH, if applicable) were taken immediately after flushing. Samples were labeled, placed on ice (≤4°C), and transported the same day to the laboratory; holding times (6 h) and preservation followed (temperature (≤4°C) Standard Methods. Additionally, water samples from the main reservoir were taken over a span of three consecutive days to confirm the consistency of source water quality.
The collected samples were tested for a comprehensive range of water quality indicators. These included basic physicochemical parameters such as pH, temperature, turbidity, electrical conductivity (EC), total dissolved solids (TDS), dissolved oxygen (DO), total alkalinity, total hardness, and biochemical oxygen demand (BOD). Microbial assessments included total coliforms, fecal coliforms, and Escherichia coli (E. coli). Inorganic components analyzed were nitrate, nitrite, sulfate, carbonate, bicarbonate, ammonia, chloride, bromide, fluoride, calcium, potassium, sodium, silica, and magnesium. The study also evaluated concentrations of heavy metals including aluminum, arsenic, copper, lead, barium, boron, iron, manganese, chromium, cadmium, nickel, cobalt, mercury, strontium, zinc, and selenium as well as volatile organic compounds (VOCs).
Onsite measurements of pH and temperature were carried out using a Hach HQ440d (Sigma-Aldrich, Darmstadt, Germany) handheld meter (Hach, Loveland, Colorado, USA). For heavy metal testing, nitric acid (Sigma-Aldrich, Darmstadt, Germany) was added to the samples on site to lower the pH below 2. Sterilized plastic containers were used for microbiological analysis, with no acid was added to those samples. All testing procedures followed the Standard Methods for the Examination of Water and Wastewater [20], except VOCs, which were analyzed using U.S. EPA Method 8260B.
The concentrations of heavy metals in water samples were determined following the procedures outlined by the American Public Health Association (https://www.apha.org/ APHA, 8 August 2025 ). Water samples were collected in pre-cleaned polyethylene bottles and immediately acidified to pH < 2 using nitric acid (HNO3) (Sigma-Aldrich, Darmstadt, Germany) to prevent precipitation or adsorption of metals onto container walls, and were stored at 4 °C until analysis. Prior to analysis, samples were filtered through 0.45 µm membrane filters to remove suspended solids, and for certain metals, digestion was performed using a combination of nitric acid and perchloric acid (Sigma-Aldrich, Darmstadt, Germany) to convert all metal forms into soluble ionic species. The heavy metals were quantified using Atomic Absorption Spectrophotometry (AAS) (Thermo Fisher Scientific, Bremen, Germany). Calibration curves were prepared using standard metal solutions of known concentrations (AGQ Labs Arabi, Dammam, Saudi Arabia) and instrumental parameters were set according to manufacturer recommendations to ensure optimal sensitivity and accuracy. Each sample was measured in triplicate to ensure precision, while blanks and standard reference materials were analyzed alongside the samples to validate method accuracy. Recovery tests were conducted by spiking known concentrations of metals into water samples, with acceptable recovery ranging between 95 and 105%. The results are expressed in micrograms per liter (µg/L).
3. Results and Discussion
3.1. Source Water Quality
An initial evaluation was conducted on the quality of drinking water prior to its entry into Madinah City’s distribution network. This assessment covered both the main reservoir (designated as MR) and the secondary reservoir (designated as SR). As illustrated in Figure 2, the main reservoir receives a combination of desalinated seawater and groundwater via Transmission Line 1 and serves as the primary source of potable water for the city, supplying approximately 300,000 cubic meters per day. Transmission Line 2, by contrast, delivers desalinated water directly from the treatment plant to the secondary reservoir, contributing approximately 22,000 cubic meters per day to Madinah’s overall drinking water supply. The analytical results for inorganic constituents and microbiological indicators are summarized in Table 1.

Table 1.
Physical characteristics, chemical composition, and bacteriological parameters in Madinah City source drinking water.
As shown in Table 1, both the main reservoir (MR) and secondary reservoir (SR) reservoirs maintain good water quality. All measured parameters were well within the permissible limits set by the World Health Organization [5] and the Saudi Potable Water Quality Standards [21]. For instance, the total dissolved solids (TDS) a key indicator of overall dissolved content in water were measured at 530 mg/L in the main reservoir and 70 mg/L in the secondary reservoir. The TDS value of 530 mg/L remains below the WHO recommended threshold of 600 mg/L for drinking water.
The pH levels in both reservoirs also fell within the recommended range of 6 to 8. Within this pH range, carbonate concentrations tend to be minimal while bicarbonates are the dominant species, which aligns with the chemical profile shown in Table 1 [22].
Parameters such as biochemical oxygen demand (BOD) and microbial indicators including total coliforms, fecal coliforms, and Escherichia coli are crucial in evaluating the safety of drinking water. Total coliforms are widely recognized as indicators of the possible presence of pathogenic microorganisms in potable water [23]. The complete absence of total and fecal coliforms, as well as E. coli, in the tested samples confirms the microbiological safety of the water in both reservoirs, as demonstrated in Table 1.
It is also worth noting that concentrations of most water quality indicators were lower in the secondary reservoir than in the main reservoir. This difference is likely due to the main reservoir’s use of blended water where desalinated water is mixed with untreated groundwater (as shown in Figure 2) in contrast to the secondary reservoir, which receives only desalinated water.
In addition to assessing inorganic compounds and microbial indicators, evaluating the presence of heavy metals in drinking water is essential, as these elements can pose serious risks to human health. Certain heavy metals such as arsenic (As), chromium (Cr), selenium (Se), copper (Cu), mercury (Hg), and cadmium (Cd) are classified as primary contaminants due to their potential toxicity when concentrations exceed the maximum contaminant levels (MCLs) set by regulatory agencies.
Other metals including aluminum (Al), iron (Fe), manganese (Mn), and zinc (Zn) are considered secondary contaminants [24]. While these substances are generally not associated with direct health hazards at concentrations below their secondary maximum contaminant levels (SMCLs), they can negatively impact water quality in terms of appearance, taste, and odor, cause cosmetic issues such as dental staining, and lead to technical problems like equipment corrosion or damage [22].
Table 2 presents the heavy metal concentrations detected in the source water for Madinah City’s drinking water supply. As illustrated, several metals namely cadmium, cobalt, lead, and mercury were found at concentrations below the method detection limits. The remaining metals, though detectable, were well within the safe thresholds defined by their respective MCLs.
Table 2.
Heavy metal concentrations in Madinah City source drinking water.
Among the elements analyzed, boron and strontium showed relatively elevated levels compared to others, with measured concentrations of 930 µg/L and 240 µg/L, respectively. However, current USEPA guidelines do not assign either an MCL or a maximum contaminant level goal (MCLG) for these two elements, suggesting that their observed concentrations do not raise immediate health concerns [25]. That said, boron is subject to international regulatory limits with a WHO-recommended MCL of 2400 μg/L and a more stringent national limit of 500 μg/L according to the Saudi Water Quality Standards [18]. It is also worth noting that strontium is not currently regulated under the Saudi standards.
The levels of biochemical oxygen demand (BOD) in Madinah’s drinking water sources were found to be negligible. Furthermore, a broad range of volatile organic compounds (VOCs) including benzene, toluene, tetrachloroethene (PCE), and trichloroethene (TCE) were not detected, suggesting that the city’s water supply is free from contamination by industrial pollutants. Among all VOCs tested, only bromoform was detected, and even then, only in low concentrations 5 μg/L in the secondary reservoir and 7 μg/L in the main reservoir.
These findings clearly demonstrate that the drinking water entering the distribution network in Madinah is of excellent quality. All analyzed parameters remained well below their respective maximum contaminant levels (MCLs), with many constituents being undetectable, as summarized in Table 1 and Table 2. The only parameter approaching its MCL was the total dissolved solids (TDS) in the main reservoir, which measured 530 mg/L. This elevated TDS level is primarily attributed to the blending of desalinated water with local groundwater.
Supporting this, a detailed study by Khashogji and El Maghraby (2013) [26] in the Abar Al Mashi region where the blending occurs found that TDS levels in 36 groundwater wells ranged from 1178.3 mg/L to 3166.7 mg/L. This background explains the relatively higher TDS observed in the main reservoir [26].
However, high-quality source water does not guarantee that consumers will receive water of the same standard. As discussed earlier, water quality can degrade as it travels through the distribution system. To fully understand the condition of drinking water in Madinah, it was therefore necessary to compare the quality of source water with that of sample collected at various points throughout the distribution network. This comparison offers insight into the condition of the water that actually reaches consumers and reveals the influence of the distribution system on water quality.
3.2. Water Quality Within the Distribution System
To evaluate how the distribution network affects water quality, samples were collected from five different locations across Madinah’s water distribution system. These sites, illustrated in Figure 1, were selected to represent a wide spatial distribution. The goal was to compare water quality at these locations with that of the source water before it entered the network.
Table 3 summarizes the results for key parameters, including physical properties, inorganic compounds, and microbiological indicators, from each sampling location. The distribution samples are labeled NW1 through NW5 (NW = Network), while main reservoir and secondary reservoir refer to the main and secondary reservoirs, respectively.
Table 3.
Physical characteristics, chemical composition, and bacteriological parameters in the samples collected from the distribution network.
As shown in Table 3, BOD and microbial indicators total coliforms, fecal coliforms, and E. coli remained below detection limits in all five samples, mirroring the results found in the source water.
However, the levels of several inorganic elements reflected the mixing of water from both the main and secondary reservoirs within the distribution system. For example, TDS levels in the network ranged from 279 to 288 mg/L (specifically: 279, 282, 284, 288, and 284 mg/L at NW1 through NW5, respectively), as shown in Figure 3a. These values fall between the higher TDS level of the main reservoir (530 mg/L) and the lower level of the secondary reservoir (70 mg/L), confirming the blending effect. The duplicate sampling (10 samples total) revealed minimal variation in TDS across the five locations.
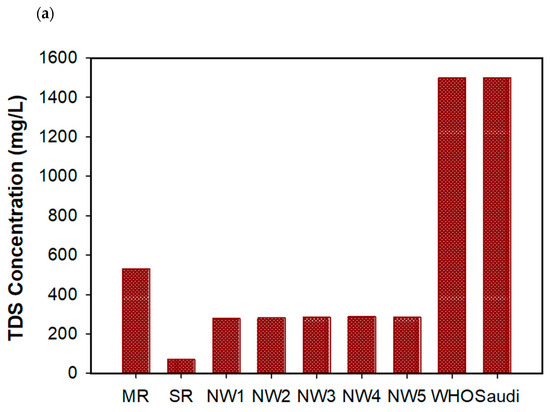
Figure 3.
Panel (a): Total Suspended Solids (TDS) concentration in the distribution system as compared to concentration in the secondary reservoir (SR) and main reservoir (MR). Panel (b): Turbidity in the distribution system as compared to turbidity in secondary and main reservoirs. WHO: MCL according to WHO; Saudi: MCL according to Saudi Arabia Authorities.
Turbidity, another important water quality indicator, was also measured. While TDS reflects the amount of dissolved solids, turbidity indicates the presence of suspended or insoluble particles in water [27]. Elevated turbidity can promote microbial growth by offering surfaces for microbial attachment [28] and may also signal internal pipe corrosion.
Figure 3b displays the turbidity measurements at all five sampling points within the network, compared to the source water values. All readings were well below the 5 NTU limit recommended by both Saudi regulations and WHO drinking water guidelines [5]. Additionally, no significant variation in turbidity was observed across the distribution system, further suggesting that the water quality remained stable during transit.
Several inorganic constituents specifically carbonate, fluoride, nitrite, phosphate, and potassium were not detected in either the source water or the samples collected from the distribution network, as presented in Table 3. For the remaining elements, their concentrations within the network generally fell between the values measured in the main and secondary reservoirs. This pattern reflects the blending of the two water sources within the city’s distribution infrastructure, as previously discussed. Moreover, the concentrations of these elements were consistent across all five sampling points, indicating uniform mixing and minimal spatial variability in water composition throughout the network.
Importantly, the levels of all detected inorganic elements remained below their respective maximum contaminant limits (MCLs), further confirming the overall high quality of the water delivered through the system in terms of both chemical and microbiological safety.
Table 4 presents the concentrations of heavy metals detected in the five distribution network samples, alongside comparative values from the main and secondary reservoirs. All measured heavy metals in the network samples were below their respective regulatory limits. In fact, several elements namely cadmium, cobalt, and mercury that were undetectable in the reservoirs remained below detection limits in the network samples as well. Other metals were present in small quantities, consistent with the levels found in the original source water, again underscoring the good performance of the distribution system in preserving water quality.
Table 4.
Heavy metal concentrations (μg/L) in the samples collected from the distribution network and in the main and the secondary reservoirs.
However, it is noteworthy that certain heavy metals including aluminum, iron, copper, manganese, strontium, and lead were found in the distribution network at concentrations noticeably higher than those observed in the main and secondary reservoirs. Figure 4 illustrates this discrepancy using lead and strontium as examples. Among these six metals, strontium exhibited the most significant increase in average concentration within the distribution system, while lead showed the smallest difference.
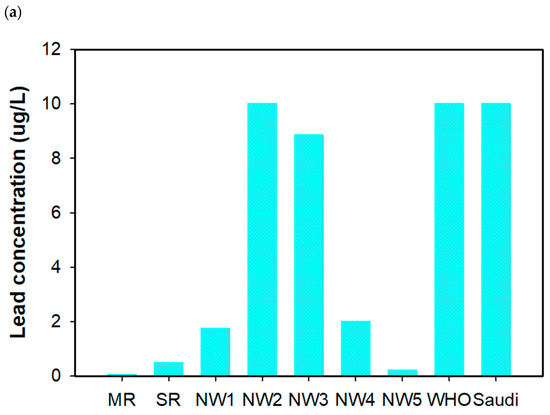
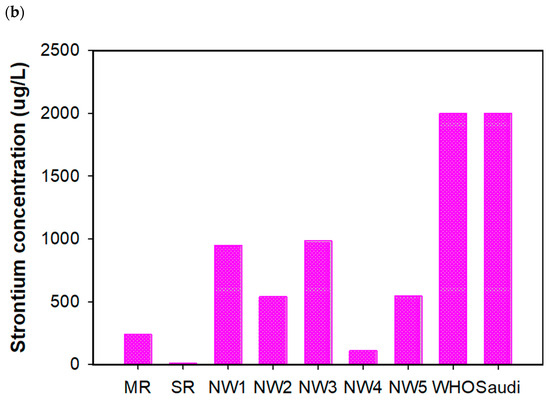
Figure 4.
Panel (a): Lead concentration in the distribution pipes as compared to the main and secondary reservoirs. Panel (b): Strontium concentration in the distribution pipes as compared to the main and secondary reservoirs. WHO: MCL according to WHO; Saudi: MCL according to Saudi Arabia Authorities.
Figure 5 further details the concentrations of all six metals across the five network sampling locations. While all concentrations remain below health-based MCLs, the elevated levels in the distribution network suggest that the infrastructure itself may be contributing to the presence of these metals. According to the Madinah Water Directorate’s Projects Department, approximately 90% of the city’s distribution system consists of ductile iron pipes, with the remainder comprising primarily PVC and a minimal amount of asbestos piping. This composition likely explains the increased levels of certain metals due to corrosion or leaching from pipe materials over time [29].
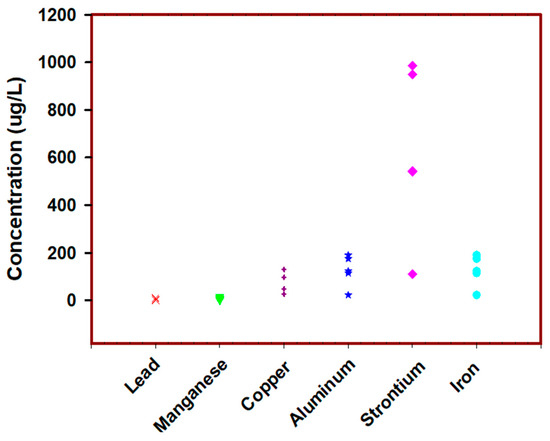
Figure 5.
The concentrations of the six heavy metals in the samples collected from the distribution network. These concentrations are higher than their concentrations in the reservoirs.
Iron is not the only metal potentially introduced into the water through the piping system—manganese and copper are also key constituents of ductile iron. As such, compounds containing these metals may leach from the pipe walls into the water, contributing to their elevated levels in the distribution network. Trace amounts of lead and aluminum are often added during the manufacturing process of ductile iron to enhance its mechanical properties [30]. Additionally, although polyvinyl chloride (PVC) pipes can also act as a source of lead contamination [31], they make up less than 10% of the distribution system in Madinah.
Another potential source of metal leaching is domestic plumbing. In older homes, fixtures and internal plumbing may contain lead or copper, which can be released into the water when it becomes corrosive—thus affecting concentrations measured in the distribution network even after water enters a building.
Among the elevated metals, strontium showed the highest increase in concentration in the distribution system relative to its levels in the reservoirs (see Figure 4 and Figure 5). Unlike aluminum, iron, and copper, strontium is not typically found in ductile iron or PVC materials. Instead, it naturally occurs in groundwater as a result of the weathering of sedimentary rock formations such as limestone, dolomite, and gypsum. In Madinah, groundwater samples have shown strontium levels as high as 14.8 mg/L. Similar findings have been reported in the United States, where finished drinking water was found to contain strontium in concentrations ranging from 0.01 to 3.68 mg/L, according to the ATSDR.
Previous studies, such as Gerke et al. (2014) [29,32], have investigated the occurrence of strontium in water distribution systems. They suggested that strontium can bind to iron oxide deposits along the internal surfaces of ductile iron pipes. If these deposits are disturbed—either through changes in hydraulic flow or chemical interactions—sudden spikes in strontium levels may occur [32].
Although the concentrations of strontium and the other six metals in the Madinah distribution system currently fall well below their regulatory limits, it is recommended that these parameters continue to be carefully monitored. Continuous oversight ensures early detection of any increase and enables timely intervention should levels approach thresholds of concern.
While Madinah is situated in a water-scarce environment, the city’s overall excellent water quality can be attributed to multiple factors, including the reliance on well-regulated groundwater sources, advanced and centralized water treatment facilities, and stringent government policies that enforce compliance with national and international drinking water standards. In addition, ongoing infrastructure development and investment in modern distribution networks have helped minimize risks of contamination compared to many other cities in the region. By situating the findings within this broader context, the study not only demonstrates the effectiveness of current practices in Madinah but also provides useful insights and transferable lessons for other arid and rapidly urbanizing regions facing similar water security challenges.
4. Conclusions
This study confirms that the drinking water supplied to residents of Madinah City, Saudi Arabia, is of good quality. All tested parameters—including physical characteristics, inorganic compounds, biological indicators, volatile organics, and heavy metals—were found to be within safe limits as defined by regulatory standards. In general, the concentrations of these constituents were slightly higher in the main reservoir than in the secondary reservoir, which is attributed to the blending of desalinated water with local groundwater prior to its transfer to the main storage facility. Water quality tests conducted at five different points within the city’s distribution network further demonstrated that all measured parameters remained below their respective maximum contaminant levels (MCLs). This consistency across the network reflects the overall reliability and sound condition of the city’s water infrastructure. However, six heavy metals, namely aluminum, iron, copper, manganese, lead, and strontium, were detected at notably higher concentrations in the distribution network than in the reservoirs. This suggests that materials used in the pipe system, particularly ductile iron, may be contributing to the leaching of some of these elements. Strontium, in particular, exhibited the most pronounced increase, likely due to interactions with deposits inside the pipe walls and the subsequent release of accumulated material during system disturbances. Despite these findings, all concentrations remained well below MCL thresholds, indicating that the water continues to be safe for public consumption. Nonetheless, regular monitoring of heavy metals in the network is strongly advised to ensure long-term water quality and to prevent potential future contamination.
Supplementary Materials
The following supporting information can be downloaded at: https://www.mdpi.com/article/10.3390/w17182711/s1.
Author Contributions
Conceptualization, M.B. and S.K.S.; methodology, M.B.; validation, I.H.; formal analysis, M.B. and S.K.S.; investigation, I.H.; resources, I.H.; data curation, S.K.S.; writing—original draft preparation, M.B., S.K.S., and I.H.; writing—review and editing, I.H.; visualization, I.H.; project administration, I.H.; funding acquisition, I.H. All authors have read and agreed to the published version of the manuscript.
Funding
This study was funded by the Deanship of Scientific Research, Taibah University, Saudi Arabia (research number 434/4507). Also, this project is funded by the New Brunswick Innovation Foundation (NBIF) Talent Recruitment Fund (TRF): 0000000149.
Disclaimer
The research presented was not performed or funded by the United States Environmental Protection Agency (EPA) and was not subject to the EPA’s quality system requirements. The views expressed in this article are those of the author(s) and do not necessarily represent the views or the policies of the U.S. Environmental Protection Agency.
Data Availability Statement
The original contributions presented in this study are included in the article/Supplementary Material. Further inquiries can be directed to the corresponding author(s).
Acknowledgments
The author is grateful to the head and the employees of the Madinah Water Directorate for assisting with sample collection and for the valuable information and discussion.
Conflicts of Interest
The authors would like to declare that there are no conflicts of interest with any third party regarding this manuscript.
References
- Sutomo, S.; Sagala, S.; Sutomo, B.; Winarti, S.; Sanjaya, G. Accelerating the Provision of Safe Water Supply in Urban and Rural Areas of Indonesia. Kesmas Natl. Public Health J. 2021, 16, 137–144. [Google Scholar] [CrossRef]
- Ercumen, A.; Gruber, J.S.; Colford, J.M., Jr. Water Distribution System Deficiencies and Gastrointestinal Illness: A Systematic Review and Meta-Analysis. Environ. Health Perspect. 2014, 122, 651–660. [Google Scholar] [CrossRef]
- Rhoads, W.J.; Keane, T.; Spencer, M.S.; Pruden, A.; Edwards, M.A. Did Municipal Water Distribution System Deficiencies Contribute to a Legionnaires’ Disease Outbreak in Quincy, IL? Environ. Sci. Technol. Lett. 2020, 7, 896–902. [Google Scholar] [CrossRef]
- UNESCO. UN-Water Annual Report. 2013. Available online: https://www.unwater.org/publications/un-water-annual-report-2013 (accessed on 8 August 2025).
- WHO. Guidelines for Drinking Water Quality, 4th ed.; World Health Organization: Geneva, Switzerland, 2011. [Google Scholar]
- Zhang, S.; Tian, Y.; Guo, Y.; Shan, J.; Liu, R. Manganese release from corrosion products of cast iron pipes in drinking water distribution systems: Effect of water temperature, pH, alkalinity, SO42—Concentration and disinfectants. Chemosphere 2021, 262, 127904. [Google Scholar] [CrossRef]
- Tang, Z.; Wu, W.; Han, X.; Zhao, M.; Luo, J.; Fu, C.; Tao, R. Numerical Modelling and Simulation of Two-Phase Flow Flushing Method for Pipeline Cleaning in Water Distribution Systems. Water 2020, 12, 2470. [Google Scholar] [CrossRef]
- Al-Hamdi, M.I. Contamination of Water Supply in Sana’a. In Competition for Scarce Groundwater in the Sana’a Plain, Yemen. A Study of the Incentive Systems for Urban and Agricultural Water Use; CRC Press: London, UK, 2021; pp. 49–69. [Google Scholar] [CrossRef]
- Blokker, M.; Smeets, P.; Medema, G. Quantitative Microbial Risk Assessment of Repairs of the Drinking Water Dis-tribution System. Microb. Risk Anal. 2018, 8, 22–31. [Google Scholar] [CrossRef]
- García-Ávila, F.; Flores del Pino, L.; Bonifaz-Barba, G.; Zhindón-Arévalo, C.; Ramos-Fernández, L.; García-Altamirano, D.; Vázquez-García, S.; Sánchez- Alvarracín, C. Effect of Residual Chlorine on Copper Pipes in Drinking Water Systems. J. Eng. Sci. Technol. 2019, 12, 119–126. [Google Scholar] [CrossRef]
- Elmouaden, K.; Jodeh, S.; Chaouay, A.; Oukhrib, R.; Salghi, R.; Bazzi, L.; Hilali, M. Sulfate-Reducing Bacteria Impact on Copper Corrosion Behavior in Natural Seawater Environment. J. Surf. Eng. Mater. Adv. Technol. 2016, 6, 36–46. [Google Scholar] [CrossRef]
- Gomez-Smith, C.K.; LaPara, T.M.; Hozalski, R.M. Sulfate Reducing Bacteria and Mycobacteria Dominate the Biofilm Communities in a Chloraminated Drinking Water Distribution System. Environ. Sci. Technol. 2015, 49, 8432–8440. [Google Scholar] [CrossRef] [PubMed]
- Kimbell, L.K.; Wang, Y.; McNamara, P.J. The impact of metal pipe materials, corrosion products, and corrosion inhibitors on antibiotic resistance in drinking water distribution systems. Appl. Microbiol. Biotechnol. 2020, 104, 7673–7688. [Google Scholar] [CrossRef]
- Szuster-Janiaczyk, A.; Zeuschner, P.; Noga, P.; Skrzypczak, M.; Cimochowicz-Rybicka, M. Monitoring of heavy metals in selected Water Supply Systems in Poland, in relation to current regulations. In Proceedings of the First Conference of the International Water Association IWA for Young Scientist in Poland “Water, Wastewater and Energy in Smart Cities”, Cracow, Poland, 12–13 September 2017; p. 01017. [Google Scholar]
- Hyarat, T.; Al Kuisi, M.; Saffarini, G. Assessment of groundwater quality using water quality index (WQI) and multivariate statistical analysis in Amman-Zarqa area/Jordan. Water Pract. Technol. 2022, 17, 1582–1602. [Google Scholar] [CrossRef]
- AI-Hamzah, A.; Fellows, C. Drinking Water Quality in the Kingdom of Saudi Arabia. Water 2024, 16, 1810. [Google Scholar] [CrossRef]
- Abdelkader, T. Water quality for irrigation and drinking water use of Aflaj in Oman. Water Supply 2015, 15, 421–428. [Google Scholar] [CrossRef]
- Bob, M.; Rahman, N.A.; Taher, S.; Elamin, A. Multi-objective Assessment of Groundwater Quality in Madinah City, Saudi Arabia. Water Qual. Expo. Health 2014, 7, 53–66. [Google Scholar] [CrossRef]
- General Authority for Statistics (GASTAT). Statistics, Population and Housing Census. 2021. Available online: https://www.stats.gov.sa/en/home (accessed on 1 August 2021).
- Rice, E.W.; Baird, R.B.; Eaton, A.D. Federation Standard Methods for the Examination of Water and Wastewater; American Public Health Association: Washington, DC, USA, 2005. [Google Scholar]
- Royal Commission Environmental Regulations (RCER). Regulations and Standards, Royal Commission for Jubail and Yanbu; RCER: Riyadh, Saudi Arabia, 2015.
- Huang, Y.; Rao, A.; Huang, S.; Chang, C.; Drechsler, M.; Knaus, J.; Chan, J.C.C.; Raiteri, P.; Gale, J.D.; Gebauer, D. Uncovering the Role of Bicarbonate in Calcium Carbonate Formation at Near-Neutral pH. Angew. Chem. Int. Ed. Engl. 2021, 60, 16707–16713. [Google Scholar] [CrossRef]
- Ohwo, O. The Impact of Pipe Distribution Network on the Quality of Tap Water in Ojota, Lagos State, Nigeria. Am. J. Water Resour. 2014, 2, 110–117. [Google Scholar] [CrossRef]
- USEPA. Drinking Water Standards and Health Advisories Table; EPA: Washington, DC, USA, 2018.
- USEPA. Secondary Drinking Water Regulations: Guidance for Nuisance Chemicals. 2013. Available online: http://water.epa.gov/drink/contaminants/secondarystandards.cfm (accessed on 8 August 2025).
- Khashogji, M.S.; El Maghraby, M.M.S. Evaluation of groundwater resources for drinking and agricultural purposes, Abar Al Mashi area, south Al Madinah Al Munawarah City, Saudi Arabia. Arab. J. Geosci. 2012, 6, 3929–3942. [Google Scholar] [CrossRef]
- Reynolds, R.P.T. Unit Operations and Processes in Environmental Engineering, 2nd ed.; PWS: Boston, MA, USA, 1995. [Google Scholar]
- Farrell, C.; Hassard, F.; Jefferson, B.; Leziart, T.; Nocker, A.; Jarvis, P. Turbidity composition and the relationship with microbial attachment and UV inactivation efficacy. Sci. Total. Environ. 2018, 624, 638–647. [Google Scholar] [CrossRef]
- Sarin, P.; Snoeyink, V.L.; Lytle, D.A.; Kriven, W.M. Iron Corrosion Scales: Model for Scale Growth, Iron Release, and Colored Water Formation. J. Environ. Eng. 2004, 130, 364–373. [Google Scholar] [CrossRef]
- Shayesteh-Zeraati, A.; Naser-Zoshki, H.; Kiani-Rashid, A.R.; Yousef-Sani, M.R. The effect of aluminium content on morphology, size, volume fraction, and number of graphite nodules in ductile cast iron. Proc. Inst. Mech. Eng. Part L J. Mater. Des. Appl. 2010, 224, 117–122. [Google Scholar] [CrossRef]
- Kumar, M.; Puri, A. A review of permissible limits of drinking water. Indian J. Occup. Environ. Med. 2012, 16, 40–44. [Google Scholar] [CrossRef] [PubMed]
- Gerke, T.L.; Little, B.J.; Luxton, T.P.; Scheckel, K.G.; Maynard, J.B.; Szabo, J.G. Strontium adsorption and desorption reactions in model drinking water distribution systems. J. Water Supply Res. Technol. 2014, 63, 449–460. [Google Scholar] [CrossRef]


Disclaimer/Publisher’s Note: The statements, opinions and data contained in all publications are solely those of the individual author(s) and contributor(s) and not of MDPI and/or the editor(s). MDPI and/or the editor(s) disclaim responsibility for any injury to people or property resulting from any ideas, methods, instructions or products referred to in the content. |
© 2025 by the authors. Licensee MDPI, Basel, Switzerland. This article is an open access article distributed under the terms and conditions of the Creative Commons Attribution (CC BY) license (https://creativecommons.org/licenses/by/4.0/).