Article

Assessment of Pluvial Flood Mitigation Ecosystem Service in a Riverside City Using the Integrated Valuation of Ecosystem Services and Tradeoffs Model for Ecological Corridor Mapping

by
Yajaira Castillo-Acosta
,
Berly Cárdenas-Pillco
and
Andrea Chanove-Manrique
*
Facultad de Arquitectura e Ingenierías Civil y del Ambiente, Universidad Católica de Santa María, Arequipa 040101, Peru
*
Author to whom correspondence should be addressed.
Water 2025, 17(2), 143; https://doi.org/10.3390/w17020143
Submission received: 27 November 2024 / Revised: 25 December 2024 / Accepted: 5 January 2025 / Published: 8 January 2025

Abstract

:
Riverside cities are vulnerable to pluvial flooding due to multiple factors, such as landscape fragmentation caused by land-use changes, which weakens the ecosystem service of pluvial flood mitigation. This ecosystem service is essential because it reduces the impact of this climatic event through water infiltration into the soil. The metropolitan area of Arequipa, Peru, a riverside city, is currently fragmented by accelerated population growth, which has filled the river buffer zones and agricultural areas with concrete, resulting in a fragile flood control ecosystem service. This research assesses the pluvial flood mitigation ecosystem service in the metropolitan area of Arequipa using the InVEST software 3.12.1 to map an ecological corridor. The results show low runoff control in urban environments but significant retention in agricultural and non-agricultural vegetation areas. Zero-runoff patches were identified as ecological sources, and a resistance surface map and least-cost path model were created, yielding a 57 km ecological corridor connecting 18 ecological sources across 12 of Arequipa’s 19 metropolitan districts. This study highlights the importance of integrating ecosystem services into urban planning to support green infrastructure initiatives, which contribute to sustainable and resilient cities by mitigating fragmentation and enhancing natural flood defenses.

1. Introduction

Riverside landscapes are considered ecotones due to the interaction between aquatic and terrestrial systems [1,2]. Thus, they are valued as unique and highly dynamic territories [3]; providing vital ecosystem services such as food supply, water supply, flood control, climate regulation, and cultural and aesthetic values [4].
Currently, landscapes face significant challenges due to anthropogenic pressures that disrupt their ecological functionality. Urban expansion, for instance, is one of the most pervasive and complex land-use changes to manage as it promotes land surface impermeabilization and landscape fragmentation. These processes collectively diminish both the quality and quantity of essential ecosystem services [5,6]. In Arequipa, Peru, the weakening of ecosystem services is evident in several areas, manifesting as biodiversity loss [7], the formation of urban heat islands [8], and increased flood risks [9]. The ecosystem service of flood mitigation is essential for reducing flood hazards through enhanced water infiltration [10]. However, evidence indicates that urban encroachment into natural and riparian zones exacerbates flood events, significantly increasing the city’s vulnerability.
Therefore, it is imperative to regulate urban expansion and promote ecological connectivity to safeguard the provision of ecosystem services. Urban landscapes characterized by fragmented green spaces and impermeable surfaces contribute to increased runoff [11] as urbanization significantly alters the structure and functionality of the landscape [12]. In this context, there is a clear negative relationship between landscape fragmentation and the provision of ecosystem services, particularly those related to water regulation and flood mitigation.
Researchers are increasingly focusing on integrated human-environment solutions, such as green infrastructure [13], which play a crucial role in improving urban livability and sustainability [14]. These infrastructures protect, manage, and restore ecosystems to address challenges and offer benefits for human and environmental well-being [15,16].
Consequently, ecosystem service assessments are becoming pivotal in green infrastructure projects as they strengthen decision-making [17]. Among various models, the “Integrated Valuation of Ecosystem Services and Tradeoffs” (InVEST) model is widely recognized for its practicality in assessing ecosystem service supply changes. Its urban pluvial flood risk mitigation model identifies flood-prone areas through the biophysical quantification of urban runoff production [18]. This feature is particularly useful for identifying ecological sources—patches with significant roles in ecosystems and sustainability [19]—due to their provision of ecosystem services, contribution to landscape integrity, and prevention of ecosystem degradation [20].
This study aims to evaluate the ecosystem service of pluvial flood mitigation to establish an ecological corridor within the urban area that can reconcile disturbed environments with natural ones, promote the integration of ecosystem service studies into green infrastructure projects in Peru, and advocate for green infrastructure solutions to transform Arequipa into a resilient metropolis.

2. Materials and Methods
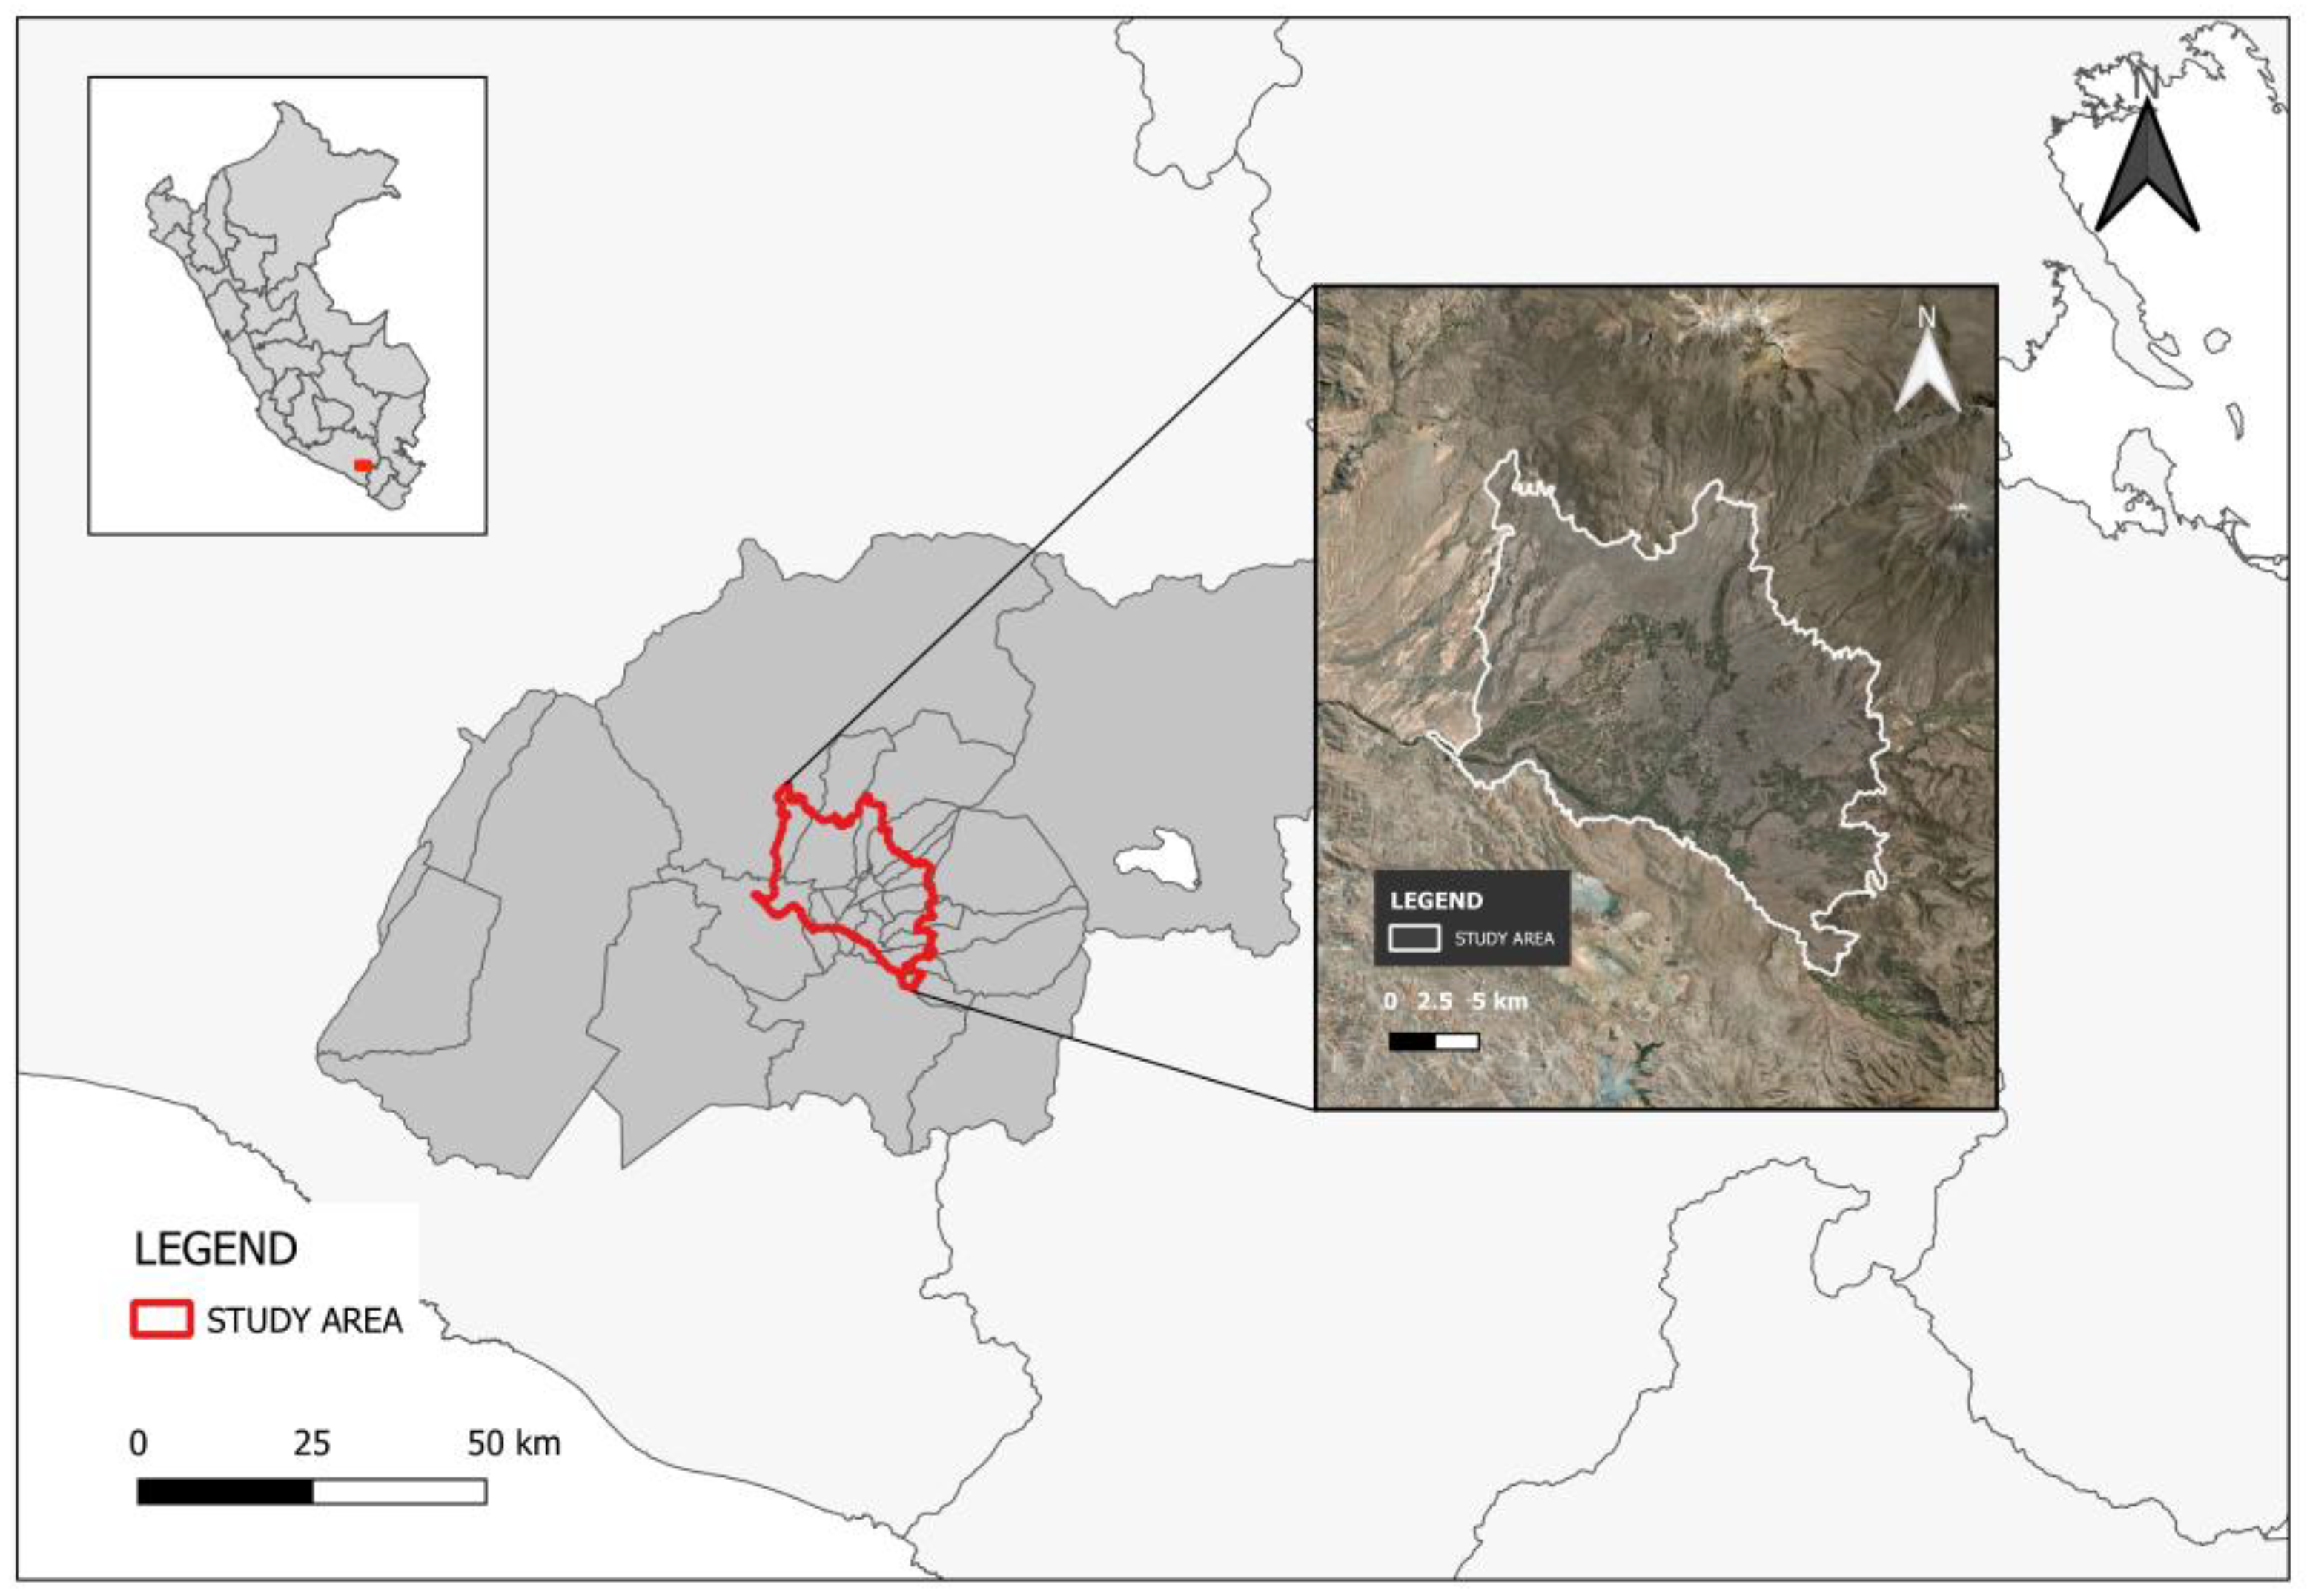
2.1. Study Area

The city of Arequipa, located in the province and region of the same name in Peru, is recognized as the second most important city in the country due to its geopolitical, economic, and demographic significance [21]. Consequently, it stands out as a development hub in southern Peru.
The study area for this research corresponds to the metropolitan area, comprising 19 of the 29 districts in the province of Arequipa [22], covering approximately 0.39 km2 (Figure 1). This area exhibits high vulnerability to precipitation events due to its dense urbanization, which has replaced riverbanks and other green areas with commercial, industrial, and residential infrastructure. As such, interventions in environments with these challenges are crucial and necessary.

2.2. Model Inputs

The methodological framework consists of two parts: the assessment of ecosystem services and the development of the ecological corridor (Figure 2).
The inputs for the “Pluvial Flood Mitigation” model in InVEST include the area of interest, rainfall depth, land-use, soil hydrologic group, and a biophysical table (Table 1).
Rainfall depth (in millimeters) was obtained from SENAMHI’s intensity–duration–frequency (IDF) curves for region A11, which covers the metropolitan area of Arequipa. A precipitation scenario with a return period of 2 years (the minimum offered by the platform) and a duration of 24 h (the maximum duration) was selected to simulate a frequently recurring scenario with significant impact, allowing the software to model runoff under high-impact conditions.
To create the land-use raster, cloud-free satellite images for 2023 were downloaded from the Landsat 8-9 OLI/TIRS C2 L2 dataset on Earth Explorer by USGS. These images were clipped using the vector file of the study area, preprocessed using the “Semi-Automatic Classification Plugin” (SCP) in QGIS version 3.28.2, merged, and classified into land-use categories via representative sampling using SCP Dock. The data were processed using the “Maximum Likelihood Classification” algorithm, noted for its accuracy [25,26,27]. The land-use classes were categorized as “non-agricultural vegetation”, “urban area”, “agricultural area”, and “bare soil”. Data on water bodies were obtained from the Instituto Geográfico Nacional, and a buffer of 70 m was applied [28], reflecting the estimated width of the hydrographic network in the study area. Finally, both results were combined and rasterized. For validation, the “polygon accuracy analysis” method was applied, yielding a high validation percentage that confirms the quality and reliability of the generated data. The complete accuracy assessment table is shown in Appendix A.
For the soil hydrologic group, raster data were downloaded from NASA’s Oak Ridge Laboratory Archive Center and clipped using the study area shapefile. The biophysical table was created in excel, assigning curve numbers for each soil type based on the hydrologic soil group, with pre-established values between 0 and 100.
These data inputs were processed in InVEST 3.12.1, generating spatial data on runoff retention, which were analyzed further.

2.3. Ecological Corridor Mapping

2.3.1. Resistance Surface

Resistance surfaces are made using georeferenced data such as land-use, slopes, road networks, and hydrographic networks [29,30,31] (Table 2). Each one of them was assigned a value from 1 to 5 based on its capacity to support ecological corridor connectivity, where 1 indicates low resistance and 5 indicates high resistance.
To assign weights to each criterion, the analytical hierarchy process (AHP) was applied using the pairwise comparison matrix. We placed the criteria in both the column and row entries then compared a column criterion with a row criterion. In this comparison, the one with greater importance was selected and assigned a score using Saaty’s nine-point scale (Table 3). The values for each column were then summed, and each element was divided by the total sum [32]. Finally, the average of each row became the weight of the criterion, which was multiplied with each raster using the raster calculator in QGIS software 3.28.2.
For consistency analysis, the following formula was used:
CR = CI/RI
CI = (λ − n)/(n − 1)
λ represents the average of the consistency vector, and n is the number of criteria. RI refers to the random index, which is a predefined value based on the number of criteria studied. For the case of 4 criteria, the RI value is 0.9, according to the literature. After solving the formula, the CR value was analyzed. If the CR value is less than 0.10, it indicates a reasonable level of consistency; otherwise, if the value is greater than 0.10, it suggests an inconsistent judgment.

2.3.2. Ecological Sources

The ecological corridor connects points, so ecological sources are required. These were selected based on the results from the InVEST software 3.12.1, which identified polygons with zero runoff values. For this research, larger patches and those located near each other were prioritized [33]. Thus, patches smaller than 10 hectares were excluded [34].
Subsequently, the connectivity probability (PC) parameter was evaluated using the Conefor 2.6 software, with a connection distance threshold of 500 m and a connection probability of 0.5 [29,34]. This analysis showed us the patch importance indices (dPC), which indicate the contribution of each patch to maintain or improve connectivity in a landscape [35]. Evaluating this parameter will allow us to prioritize patches that can promote connectivity. The patches selected as ecological sources were those with a dPC value greater than 1 [36].
Finally, the resistance surface map and the centroids of the ecological sources were input into the QGIS “Least-Cost Path” plugin, which applies the least-cost path model according in a faster way [37]. After processing the data, multiple corridors were generated, and the one with the best length, continuous connectivity, and site accessibility was selected [38].

3. Results

3.1. Ecosystem Service Evaluation

To evaluate the pluvial flood mitigation ecosystem service, a rainfall depth of 24 mm was input, along with a land-use map classified into five categories. The “urban area” was the land-use class with the highest coverage (41.3%), followed by bare soil (23.5%). Regarding green areas, agricultural land covered 15.2% of the study area, while non-agricultural vegetation accounted for 13.3%. Additionally, the soil hydrologic group raster file for the study area was used, showing three soil group classes (B for soils with moderate permeability, C for soils with low permeability, and D for soils with very low permeability) (Figure 3).
Finally, the data for the biophysical table were organized in the format required by the software (Table 4), where “cn” refers to the “curve number”—a term used in hydrology to refer to a value used in the quantification of surface runoff—and the letter next to it refers to the type of soil hydrologic group. It is important to note that water bodies were excluded from the curve number analysis since the analysis applies only to land or vegetation [39]. However, the software requires a value to be input, as the number of entries in the biophysical table must match the number of land-use classes considered in the study. The value of 100 was adopted for water bodies, as mentioned in the literature review.
After inputting the required data and running the model, InVEST 3.12.1 software generated raster files for runoff retention (%) and runoff (mm) (Figure 4). The runoff raster underwent an accuracy validation process, comparing it with polygons representing areas reported as flood zones between 2000 and 2023 and polygons that cover areas with good infiltration within the study area, according to the literature. This validation confirmed the reliability and underscores the utility of the model as a decision-support tool. The full accuracy assessment table is shown in Appendix A.

3.2. Ecological Corridor

To create a resistance surface map, a literature review was conducted to assign weights to each criterion and subcriterion, as shown in Table 5.
After the weights are assigned to each sub-criterion, a weight per criterion should be assigned too, using the analytical hierarchy method (Table 6). With these results, the consistency value was calculated, obtaining a value of 0.026.
The formula for generating the resistance surface map was acquired from Table 7, which allows us to identify areas with the potential to accommodate an ecological corridor. Additionally, it identifies areas with high vulnerability to flooding (Figure 5).
Resistance Surface Map = ([Land Use] × 0.45) + ([Proximity to hydrographic network] × 0.29 + ([Slope] × 0.18) + ([Proximity to road networks] × 0.08)
The runoff values derived from the InVEST 3.12.1 software were used to identify patches, considering areas with a runoff value of 0 mm. This indicates the provision of the ecosystem service of flood risk mitigation in the area. In this case, a total of 4085 patches with a runoff value of 0 mm were identified, which are considered potential ecological sources. Those were subjected to the metric evaluation of patch importance indices in landscape connectivity (dPC) to which we obtained values from 0.037 to 53.17. For this study, patches with a dPC value greater than 1 were selected as this is the reference value widely used in research focused on urbanized areas [36,50]. As a result, we identified a total of 26 ecological sources, representing 17.21% of the study area.
These patches were connected using the “Least-Cost Path” model. The QGIS plugin generated 26 possible corridors, from which the one with the lowest cost value and high patch connectivity was selected. The chosen corridor is 57.003 km long and connects 18 of the 26 ecological sources at the lowest surface resistance cost (Figure 6).

4. Discussion

In the evaluation of the ecosystem service, during the land-use map generation, it was identified that urban areas are the most common land-use type in the study area. This highlights the city’s vulnerability to fragmentation and the decline of ecosystem services. Similarly, according to the data obtained from a zoning map for the metropolitan area of Arequipa, we can also see an extensive concentration of urban areas; the author even identifies a segment in urban areas as a “special risk zone” due to its vulnerability [22].
This finding aligns with the InVEST model results, which show the lowest retention percentage in districts classified as “fully urban” [21]. These areas also correspond to those that, during the rainy season, experience large stormwater runoff along the streets [51]. This occurs because built environments such as sidewalks and roads prevent soil infiltration, resulting in greater volume and velocity of surface runoff [52]. Conversely, agricultural and non-agricultural vegetation areas showed the highest runoff retention, reaching up to 99% in areas where agriculture is practiced. Agricultural lands undergo tillage processes that promote the interception of large water volumes and increase infiltration capacity. Additionally, vegetation cover reduces the impact of raindrops through interception, thereby maintaining soil health during frequent and intense precipitation events [53,54].
It is worth mentioning that most of the tributaries of the hydrographic network are surrounded by urbanized or bare soil, posing a risk due to the increased likelihood of flooding. Thus, it can be confirmed that the riparian ecosystem’s capacity to regulate and mitigate pluvial flooding is compromised by the reduction in areas capable of retaining runoff, such as green environments or riverbanks, leading to significant consequences for communities today.
This highlights that land-use data provide diverse information regarding the interaction between natural and urban environments, allowing for the identification of conflicts and the proposal of solutions. In this regard, it is mention that land-use data demonstrate how humans interfere with the flow of materials and energy within ecosystems, making it an indispensable and relevant criterion [55]. However, it is important to complement these data with others that provide information on the degree of human disturbance, such as the “proximity to road network” criterion, or insights about the landscape, such as “slope”, both considered in this research.
The resistance surface map incorporates both nature–human interaction criteria and specific human or natural factors. We found that high-resistance areas are primarily located in zones with dense urbanization and a high concentration of road networks, along with some patches of moderately steep to steep slopes, which pose challenges for establishing the corridor. In contrast, the western part of the study area reveals low-resistance zones, corresponding to rural landscapes. It is important to remember that the river and its tributaries represent low-resistance environments that extend throughout the study area, so we can say that these areas are highly beneficial for patch connectivity and play a crucial role in enhancing the stability and sustainability of urban ecosystems [56].
Concerning ecological sources, the large patches located in proximity are beneficial for the flood regulation service provided by green infrastructure [57]. Based on this, patches smaller than 10 hectares and isolated patches were discarded, resulting in a total of 49 patches.
After further discarding based on their contribution to connectivity (dPC), 26 ecological sources were identified which were capable of providing ecosystem services, maintaining the continuity of natural processes, and preventing ecological degradation [31]. Accordingly, their connection is considered essential for the protection and maintenance of ecosystems [58]. Similarly, research on interventions of green infrastructure for flood regulation and mitigation services posited that patch connectivity enhances the provision of flood-related ecosystem services, aiding in counteracting vulnerability [59]. Likewise, a study on landscape patterns for reducing flood vulnerability suggested connecting urban green spaces through linear parks due to their effectiveness and efficiency in decreasing flood vulnerability [60]. Therefore, connecting green spaces emerges as a critical imperative.
Their connection was achieved by mapping an ecological corridor using the “least-cost path” model, which is considered an effective method [61] and very accessible for landscape planners [62]. Regarding the corridor, the authors recommend selecting the best option by considering its length, continuous connectivity, and site accessibility [38]. Also, most of them point out that corridors with high resistance value are considered of poor quality [63], so researchers must not consider those.
A significant proportion of the selected corridors overlaps with hydrographic networks. This highlights the role of rivers as natural corridors that provide essential ecosystem services, emphasizing the importance of protecting these areas from urban encroachment or recovering them. Planning buffer zones around rivers has been shown to effectively reduce flood risks in urban areas [64]. In line with this, various studies highlight the positive role of considering hydrographic networks in ecological corridors for flood mitigation. For instance, the Meramec Greenway in the United States preserves extensive tracts of land in the Meramec River floodplains to prevent flood damage [65]. Similarly, in Portugal, the Alenquer River project rehabilitated riverbanks to mitigate flooding issues as the river traverses the village’s downtown area [66]. It is also important to note that their inclusion in the corridor helps to minimize implementation costs as they are reported to generate lower initial total and per-hectare habilitation costs alongside increased financial and non-financial benefits [67]. As a result, considering these areas in green infrastructure projects will prove to be beneficial in the economic aspect.
By achieving the mapping of an ecological corridor with a connectivity and ecosystem service restoration approach, the viability of such work on nature-based solutions is possible, with their being multiple successful cases of these procedures in large metropolises [68,69]. For example, in the Pearl River Delta in China, the implementation of the greenway successfully bridged urban–rural gaps to restore ecosystem services, addressing the scarcity of green spaces [70]. Focusing on urban flooding issues, the case study of Raleigh in the United States reports that the implemented urban corridor protects “environmental sensitive areas” from flooding [71]. In the Global South, the implementation of strategies through green infrastructure is less studied [72]. However, some cases have been reported, such as the Ribeirão das Pedras greenway, which shows positive results in converging urban and rural environments for flood control [73]. This provides evidence for the implementation of ecological corridors effectively addressing issues related to the provision of ecosystem services.
Some evidence has indicated that these procedures have the potential to be replicated in systematically disadvantaged countries [74], as is shown in this research. Therefore, the theoretical application of a corridor to address flood-related issues is feasible. However, it is imperative to include additional simulations, generate field applications and involve stakeholders to refine the corridor design.
On the other hand, InVEST has proven to be a valuable tool for integrating natural infrastructure into urban planning [39], offering accessibility, ease of use [75], and the ability to perform large-scale quantitative evaluations, which enhances its practicality for decision-making [76]. Its open-access nature further addresses knowledge gaps by providing a cost-effective and efficient platform for analysis, which is greatly needed in Global South countries. However, this software has an important limitation: InVEST primarily relies on land-use composition data but does not incorporate landscape configuration data, which may result in an incomplete understanding of the influence of spatial patterns in ecosystem services [11]. To address this limitation, the use of complementary tools such as Conefor—designed for the assessment of patch connectivity and used in this study to identify ecological sources—is essential. Also, the decision to validate the data provided by InVEST is made for the purpose of offering reliable and updated data in a context where the study area lacks data regarding the situational state of an ecosystem service. This makes the research not only innovative but also foundational for future studies. In any case, for future investigations, the inclusion of informed experts remains crucial to provide a more localized context and to foster the adoption of nature-based solutions among stakeholders.

5. Conclusions

In this article, the ecosystem service of pluvial flood mitigation control was evaluated in a riverside area using the InVEST 3.12.1 software, identifying that this ecosystem service is weakened due to the reduction in areas with runoff capture capacity. The areas identified as “agricultural area” and “non-agricultural vegetation” showed optimal runoff retention (99%), while the “urban area” showed the lowest runoff retention value (45%). This is consistently observed annually during the rainy season, where urbanized areas are the most affected by flooding events.
These results not only demonstrate the negative effects of concrete and asphalt encroachment but also highlight the relationship between the loss of green areas and the provision of ecosystem services. Urban development projects that aim to “encapsulate” water bodies with asphalt and remove vegetation—often under the premise of mitigating flooding disasters—have not only proven ineffective but have also proven counterproductive in maintaining ecosystem service provision. This reality reaffirms the crucial link between ecological quality, achieved through connectivity, and the sustained provision of ecosystem services. In this context, infrastructure must align with nature rather than distance itself from it. This can be achieved through green infrastructure, where urban systems are inspired by natural processes and integrate elements such as green coverings, bioretention systems, and other nature-based solutions into ecological corridors.
In that context, green infrastructure proposals play an important role, especially when complemented with a prior evaluation of the ecosystem service to be restored. This would provide a holistic analysis of the terrain situation, ensuring that the measures implemented are suited to the context of each region.
In this case, the ecological corridor is a widely recognized green infrastructure for its benefits and proves to be both simple and necessary for the current state of Arequipa, a fragmented city that is increasingly vulnerable due to the loss of its riparian landscape. In this research, the ecological corridor for the metropolis of Arequipa would span 57 km, covering 12 out of 19 districts and connecting 18 out of 26 ecological sources responsible for controlling floods during precipitation events.
Finally, the study demonstrates that the use of geographic information systems (GIS) and software like InVEST makes it possible to generate proposals that reconcile the disturbed environment with the natural one in an integrated and simple way, contributing to the development of sustainable and resilient cities. Moreover, this research is particularly important for the study area as no studies have been found that promote the implementation of green infrastructure through the assessment of ecosystem services. Also, it is important to mention that this publication not only aims to contribute to the scientific body of knowledge but also directly supports local entities in the management and planning of green infrastructure and ecosystem services, considering that the concept of ecosystem services has only recently begun to be incorporated into urban environmental legislation, making this research highly relevant for the country’s urban planning framework. The results of this study are offered to public managers who support the preservation of fragile ecosystems, such as riversides, for the benefit of both the population and the environment.

Author Contributions

Conceptualization, A.C.-M.; methodology, Y.C.-A.; formal analysis, Y.C.-A.; investigation: Y.C.-A.; writing—original draft, Y.C.-A.; writing—review and editing, Y.C.-A., B.C.-P. and A.C.-M.; visualization, A.C.-M.; supervision, A.C.-M.; validation, B.C.-P.; software, Y.C.-A. and B.C.-P.; resources: B.C.-P. and A.C.-M. All authors have read and agreed to the published version of the manuscript.

Funding

The APC was funded by Universidad Católica de Santa María, RUC 2014163794.

Data Availability Statement

The data are contained within the manuscript.

Acknowledgments

We would like to express our gratitude to Universidad Católica de Santa María for providing the academic environment and resources for the development of this research. Additionally, we extend our sincere thanks to Lorenzo Carrasco for his support.

Conflicts of Interest

The authors declare no conflicts of interest.

Appendix A

Figure A1. Accuracy assessment for LULC classes in 2023.
Water 17 00143 g0a1
Figure A2. Accuracy assessment for runoff raster.
Water 17 00143 g0a2

References

  1. Crow, T.; Baker, M.; Barnes, B. Diversity in Riparian Landscapes. In Riparian Management in Forest of the Continental Eastern United States; Lewis Publishers: Boca Raton, FL, USA, 1999. [Google Scholar]
  2. Apan, A.A.; Raine, S.R.; Paterson, M.S. Mapping and analysis of changes in the riparian landscape structure of the Lockyer Valley catchment, Queensland, Australia. Landsc. Urban Plan. 2002, 59, 43–57. [Google Scholar] [CrossRef]
  3. Panareda, J. Evolution of Perception of Riparian Landscapes. Bol. Asoc. Geogr. Esp. 2009, 51, 233–429. [Google Scholar]
  4. Verdonschot, P.F.M.; Verdonschot, R.C.M. The role of stream restoration in enhancing ecosystem services. Hydrobiologia 2023, 850, 2537–2562. [Google Scholar] [CrossRef]
  5. Renner, I. Integración de los Servicios Ecosistémicos en la Planificación y Gestión Urbana: Un Enfoque Sistemático en Pasos para Profesionales, 1st ed.; Deutsche Gesellschaft für Internationale Zusammenarbeit (GIZ): Ciudad de México, México, 2019. [Google Scholar]
  6. Zhu, Y.; Burlando, P.; Tan, P.Y.; Blagojevic, J.; Fatichi, S. Investigating the influence of urban morphology on pluvial flooding: Insights from urban catchments in England (UK). Sci. Total Environ. 2024, 953, 176139. [Google Scholar] [CrossRef] [PubMed]
  7. Montesinos-Tubée, D.; Núñez, H.; Toni, B.; Álvarez, E.; Borgoño, A.; Zegarra, J.; Gutiérrez, G.; Maldonado, M.; Rodríguez, M.; Riveros, G.; et al. Diversidad florística, comunidades vegetales y propuestas de conservación del monte ribereño en el río Chili (Arequipa, Perú). Arnaldoa 2019, 26, 97–130. [Google Scholar] [CrossRef]
  8. Porras, P. Detección de Núcleos de Islas de Calor en la Ciudad de Arequipa. [Tesis de grado] Universidad Nacional Agraria La Molina. Facultad de Ciencias. 2018. Available online: https://hdl.handle.net/20.500.12996/3204 (accessed on 5 August 2024).
  9. Sardón, H.; Lavado, W.; Felipe, O. Inventario de Datos de Eventos de Inundaciones del Perú. Estudio Final. Servicio Nacional de Meteorología e Hidrología del Perú–SENAMHI. 2022. Available online: https://repositorio.senamhi.gob.pe/handle/20.500.12542/1786 (accessed on 23 December 2024).
  10. Li, P.; Sheng, M.; Yang, D.; Tang, L. Evaluating flood regulation ecosystem services under climate, vegetation and reservoir influences. Ecol. Indic. 2019, 107, 105642. [Google Scholar] [CrossRef]
  11. Jeitany, J.E.; Nussbaum, M.; Pacetti, T.; Schröder, B.; Caporali, E. Landscape metrics as predictors of water-related ecosystem services: Insights from hydrological modeling and data-based approaches applied on the Arno River Basin, Italy. Sci. Total Environ. 2024, 954, 176567. [Google Scholar] [CrossRef]
  12. Parsa, V.A.; Istanbuly, M.N.; Chalabiyani, B.; Russo, A.; Amiri, B.J. The role of urban landscape configuration in the provision of hydrological ecosystem services by trees. Ecosyst. Serv. 2024, 69, 101657. [Google Scholar] [CrossRef]
  13. Park, S.; Kim, J.; Yun, H.; Kang, J. Exploring the network structure of coupled green-grey infrastructure to enhance urban pluvial flood resilience: A scenario-based approach focusing on ‘centralized’ and ‘decentralized’ structures. J. Environ. Manag. 2024, 370, 122344. [Google Scholar] [CrossRef]
  14. Khalili, S.; Kumar, P.; Jones, L. Evaluating the benefits of urban green infrastructure: Methods, indicators, and gaps. Heliyon 2024, 10, e38446. [Google Scholar] [CrossRef]
  15. Langemeyer, J.; Baró, F. Nature-based solutions as nodes of green-blue infrastructure networks: A cross-scale, co-creation approach. Nat.-Based Solut. 2021, 1, 100006. [Google Scholar] [CrossRef]
  16. Cohen-Shacham, E.; Walters, G.; Janzen, C.; Maginnis, S. Soluciones Basadas en la Naturaleza para Abordar los Desafíos Sociales Globales; UICN: Gland, Switzerland, 2016; Volume 97, pp. 2016–2036. [Google Scholar]
  17. World Resources Institute. Ecosystem Services: A Guide for Decision Makers; Rnaganathan, J., Raudsepp-Hearne, C., Lucas, N., Irwin, F., Zurek, M., Bennett, K., Ash, N., West, R., Eds.; World Resources Institute Publisher: Washington DC, USA, 2008; Available online: https://www.wri.org/research/ecosystem-services (accessed on 15 March 2024).
  18. Quagliolo, C.; Roebeling, P.; Matos, F.S.; Pezzoli, A.; Comino, E. Pluvial flood adaptation using nature-based solutions: An Integrated biophysical-economic assessment. Sci. Total Environ. 2023, 902, 166202. [Google Scholar] [CrossRef]
  19. Kang, J.; Qing, Y.; Lu, W. Construction and optimization of the Saihanba ecological network. Ecol. Indic. 2023, 153, 110401. [Google Scholar] [CrossRef]
  20. Xie, L.; Wang, H.; Xie, P.; Liu, S. How to design an ecological restoration project in fragile inland basins: A case study in arid regions of China. Glob. Ecol. Conserv. 2022, 39, e02298. [Google Scholar] [CrossRef]
  21. Zeballos, C. Atlas Ambiental de Arequipa; Universidad Católica de Santa María: Arequipa, Peru, 2020. [Google Scholar]
  22. Instituto Municipal de Planeamiento. Memoria del PDM Arequipa Plan de Desarrollo Metropolitano de Arequipa. 2016. Available online: http://impla.gob.pe/publicaciones/pdm-2016-2025/2 (accessed on 20 January 2024).
  23. Autoridad Nacional del Agua. Generación del Mapa Temático de Curva Número. 2015. Available online: https://hdl.handle.net/20.500.12543/5675 (accessed on 13 July 2024).
  24. Servicio Nacional de Meteorología e Hidrología del Perú—SENAHMI. Sistemas de Seguimiento de la Escorrentía a Nivel Nacional. 2015. Available online: https://sigrid.cenepred.gob.pe/sigridv3/documento/1916 (accessed on 13 July 2024).
  25. Ragini, H.R.; Debnath, M.K.; Gupta, D.S.; Deb, S.; Ajith, S. Modelling and Monitoring land use: Land cover change dynamics of Cooch Behar District of West Bengal using Multi-Temporal Satellite data. Agric. Res. 2023, 12, 387–396. [Google Scholar] [CrossRef]
  26. Rahimi-Ajdadi, F. Land suitability assessment for second cropping in terms of low temperature stresses using LandsAT TIRS sensor. Comput. Electron. Agric. 2022, 200, 107205. [Google Scholar] [CrossRef]
  27. Rujoiu-Mare, M.; Mihai, B. Mapping land cover using remote sensing data and GIS techniques: A case study of Prahova subcarpathians. Procedia Environ. Sci. 2016, 32, 244–255. [Google Scholar] [CrossRef]
  28. Carpio, J.; Quispe, B.; Peña, F.; Sulca, P. Hidrogeología de la cuenca del río Quilca–Vitor–Chili (132). INGEMMET. Boletín Ser. H Hidrogeol. 2022, 15, 381. [Google Scholar]
  29. Yang, Y.; Feng, Z.; Wu, K.; Qi, L. How to construct a coordinated ecological network at different levels: A case from Ningbo City, China. Ecol. Inform. 2022, 70, 101742. [Google Scholar] [CrossRef]
  30. Wang, Y.; Qu, Z.; Zhong, Q.; Zhang, Q.; Zhang, L.; Zhang, R.; Yi, Y.; Zhang, G.; Li, X.; Liu, J. Delimitation of ecological corridors in a highly urbanizing region based on circuit theory and MSPA. Ecol. Indic. 2022, 142, 109258. [Google Scholar] [CrossRef]
  31. Cao, C.; Luo, Y.; Xu, L.; Xi, Y.; Zhou, Y. Construction of ecological security pattern based on InVEST-Conefor-MCRM: A case study of Xinjiang, China. Ecol. Indic. 2024, 159, 111647. [Google Scholar] [CrossRef]
  32. Kumar, M.; Shaikh, V.R. Site suitability analysis for urban development using GIS based Multicriteria evaluation technique. J. Indian Soc. Remote Sens. 2012, 41, 417–424. [Google Scholar] [CrossRef]
  33. Damschen, E.I.; Brodie, J.F. Landscape Corridors; En Elsevier eBooks; Elsevier: Amsterdam, The Netherlands, 2024; pp. 773–783. [Google Scholar] [CrossRef]
  34. Huang, X.; Wang, H.; Shan, L.; Xiao, F. Constructing and optimizing urban ecological network in the context of rapid urbanization for improving landscape connectivity. Ecol. Indic. 2021, 132, 108319. [Google Scholar] [CrossRef]
  35. Pan, J.; Wu, X.; Zhu, X. Optimizing the ecological source area identification method and building ecological corridors using a genetic algorithm: A case study in Weihe River Basin, NW China. Ecol. Inform. 2024, 80, 102519. [Google Scholar] [CrossRef]
  36. Liu, C.; Wang, J.; Sun, L.; Lv, C. Construction and optimization of green space ecological networks in urban fringe areas: A case study with the urban fringe area of Tongzhou district in Beijing. J. Clean. Prod. 2020, 276, 124266. [Google Scholar] [CrossRef]
  37. Wanghe, K.; Guo, X.; Wang, M.; Zhuang, H.; Ahmad, S.; Khan, T.U.; Xiao, Y.; Luan, X.; Li, K. Gravity model toolbox: An automated and open- source ArcGIS tool to build and prioritize ecological corridors in urban landscapes. Glob. Ecol. Conserv. 2020, 22, e01012. [Google Scholar] [CrossRef]
  38. Mckendry, T. Ecological Corridors in Urban Landscapes: Identifying and Assessing an Ecological Corridor in Johannesburg; University of the Witwatersrand: Johannesburg, South Africa, 2019; Available online: https://hdl.handle.net/10539/28052 (accessed on 27 September 2024).
  39. Costadone, L.; Lai, T.; Hurskainen, P.; Kopperoinen, L. Co-creating urban ecosystem accounting: Physical and monetary accounts of runoff retention service provided by urban green spaces. Ecosyst. Serv. 2024, 65, 101576. [Google Scholar] [CrossRef]
  40. Shen, J.; Zhu, W.; Peng, Z.; Wang, Y. Improving landscape ecological network connectivity in urbanizing areas from dual dimensions of structure and function. Ecol. Model. 2023, 482, 110380. [Google Scholar] [CrossRef]
  41. Chin, E.Y.; Kupfer, J.A. Identification of environmental drivers in urban greenway communities. Urban For. Urban Green. 2020, 47, 126549. [Google Scholar] [CrossRef]
  42. Lopes, I.J.C.; Biondi, D.; Dallacorte, A.P.; Reis, A.R.N.D.; Oliveira, T.G.S. A methodological framework to create an urban greenway network promoting avian connectivity: A case study of Curitiba City. Urban For. Urban Green. 2023, 87, 128050. [Google Scholar] [CrossRef]
  43. Blanco-Canqui, H.; Ruis, S.J.; Francis, C.A. Do organic farming practices improve soil physical properties? Soil Use Manag. 2023, 40, e12999. [Google Scholar] [CrossRef]
  44. Li, P.; Lyu, F.; Zhou, Y.; Yu, Z. Assessing whether peri-urban agricultural land or plantation forest is a better green infrastructure for ground arthropods at local and landscape scales. Ecol. Indic. 2024, 158, 111499. [Google Scholar] [CrossRef]
  45. Stanturf, J.A. Landscape Degradation and Restoration; En Elsevier eBooks; Elsevier: Amsterdam, The Netherlands, 2021; pp. 125–159. [Google Scholar] [CrossRef]
  46. Padeiro, M. Conformance in land-use planning: The determinants of decision, conversion and transgression. Land Use Policy 2016, 55, 285–299. [Google Scholar] [CrossRef]
  47. Rodrigues, B.N.; Molina, V.E.; Canteras, F.B. Green infrastructure as a solution to mitigate the effects of climate change in a coastal area of social vulnerability in Fortaleza (Brazil). Environ. Adv. 2023, 13, 100398. [Google Scholar] [CrossRef]
  48. Kaur, R.; Gupta, K. Blue-Green Infrastructure (BGI) network in urban areas for sustainable storm water management: A geospatial approach. City Environ. Interact. 2022, 16, 100087. [Google Scholar] [CrossRef]
  49. Mo, W.; Wang, Y.; Zhang, Y.; Zhuang, D. Impacts of road network expansion on landscape ecological risk in a megacity, China: A case study of Beijing. Sci. Total Environ. 2017, 574, 1000–1011. [Google Scholar] [CrossRef] [PubMed]
  50. Li, C.; Huang, L.; Xu, Q.; Cao, Z. Synergistic ecological network approach for sustainable development of highly urbanized area in the Bay Bottom region: A study in Chengyang District, Qingdao. Ecol. Indic. 2024, 158, 111443. [Google Scholar] [CrossRef]
  51. Rivera, M.; Vílchez, M.; Vela, J. Peligros por huaicos en la ciudad de Arequipa. In Proceedings of the Taller Internacional Fortalecimiento de Capacidades para Mitigar los Impactos de Huaicos en Perú, Arequipa, Perú, 15–19 October 2018; Available online: https://hdl.handle.net/20.500.12544/2589 (accessed on 14 August 2024).
  52. Dai, K.; Shen, S.; Cheng, C.; Song, Y. Integrated evaluation and attribution of urban flood risk mitigation capacity: A case of Zhengzhou, China. J. Hydrol. Reg. Stud. 2023, 50, 101567. [Google Scholar] [CrossRef]
  53. Taye, G.; Tesfaye, S.; Van Parijs, I.; Poesen, J.; Vanmaercke, M.; Van Wesemael, B.; Guyassaa, E.; Nyssen, J.; Deckers, J.; Haregeweyn, N. Impact of soil and water conservation structures on the spatial variability of topsoil moisture content and crop productivity in semi-arid Ethiopia. Soil Tillage Res. 2024, 238, 105998. [Google Scholar] [CrossRef]
  54. Cortinovis, C.; Olsson, P.; Boke-Olén, N.; Hedlund, K. Scaling up nature-based solutions for climate-change adaptation: Potential and benefits in three European cities. Urban For. Urban Green. 2022, 67, 127450. [Google Scholar] [CrossRef]
  55. Li, C.; Wu, Y.; Gao, B.; Zheng, K.; Wu, Y.; Wang, M. Construction of ecological security pattern of national ecological barriers for ecosystem health maintenance. Ecol. Indic. 2023, 146, 109801. [Google Scholar] [CrossRef]
  56. Lin, S.; Maruthaveeran, S.; Yusof, M.J.M. The Usage and Constraints of Urban River Corridor from a Socio-ecological Perspective: A Systematic Review. Landsc. Online 2024, 99, 1121. [Google Scholar] [CrossRef]
  57. Sohn, W.; Bae, J.; Newman, G. Green infrastructure for coastal flood protection: The longitudinal impacts of green infrastructure patterns on flood damage. Appl. Geogr. 2021, 135, 102565. [Google Scholar] [CrossRef] [PubMed]
  58. Yang, H.; Xu, W.; Chen, Z.; Xie, X.; Yu, J.; Lei, X.; Guo, S.; Zheng, D. Ecological network construction for bird communities in high-density urban areas: A perspective of integrated approaches. Ecol. Indic. 2024, 158, 111592. [Google Scholar] [CrossRef]
  59. Li, Y.; Ji, C.; Wang, P.; Huang, L. Proactive intervention of green infrastructure on flood regulation and mitigation service based on landscape pattern. J. Clean. Prod. 2023, 419, 138152. [Google Scholar] [CrossRef]
  60. Kim, M.; Song, K.; Chon, J. Key coastal landscape patterns for reducing flood vulnerability. Sci. Total Environ. 2020, 759, 143454. [Google Scholar] [CrossRef] [PubMed]
  61. Teng, M.; Wu, C.; Zhou, Z.; Lord, E.; Zheng, Z. Multipurpose greenway planning for changing cities: A framework integrating priorities and a least-cost path model. Landsc. Urban Plan. 2011, 103, 1–14. [Google Scholar] [CrossRef]
  62. Balbi, M.; Petit, E.; Croci, S.; Nabucet, J.; Georges, R.; Madec, L.; Ernoult, A. Title: Ecological relevance of least cost path analysis: An easy implementation method for landscape urban planning. J. Environ. Manag. 2019, 244, 61–68. [Google Scholar] [CrossRef]
  63. Yuan, Y.; Bai, Z.; Zhang, J.; Xu, C. Increasing urban ecological resilience based on ecological security pattern: A case study in a resource- based city. Ecol. Eng. 2022, 175, 106486. [Google Scholar] [CrossRef]
  64. Luo, Z.; Tian, J.; Zeng, J.; Pilla, F. Resilient landscape pattern for reducing coastal flood susceptibility. Sci. Total Environ. 2023, 856, 159087. [Google Scholar] [CrossRef]
  65. Kousky, C.; Walls, M. Floodplain conservation as a flood mitigation strategy: Examining costs and benefits. Ecol. Econ. 2014, 104, 119–128. [Google Scholar] [CrossRef]
  66. Ribeiro, L.; Barão, T. Greenways for recreation and maintenance of landscape quality: Five case studies in Portugal. Landsc. Urban Plan. 2005, 76, 79–97. [Google Scholar] [CrossRef]
  67. Agnew, D.; Fryirs, K.; Leishman, M.R. Cost-benefit analysis of working with recovery in river management using Marxan. Front. Environ. Sci. 2024, 12, 1425668. [Google Scholar] [CrossRef]
  68. Sini, R. Singapore’s Green Infrastructure and Biophilic Urbanism; Springer Nature: Singapore, 2020; pp. 211–251. [Google Scholar] [CrossRef]
  69. Chang, H.S.; Lin, Z.H.; Hsu, Y.Y. Planning for green infrastructure and mapping synergies and trade-offs: A case study in the Yanshuei River Basin, Taiwan. Urban For. Urban Green. 2021, 65, 127325. [Google Scholar] [CrossRef]
  70. Liu, Z.; Lin, Y.; De Meulder, B.; Wang, S. Can greenways perform as a new planning strategy in the Pearl River Delta, China? Landsc. Urban Plan. 2019, 187, 81–95. [Google Scholar] [CrossRef]
  71. Sharma, A. Urban greenways: Operationalizing design syntax and integrating mathematics and science in design. Front. Archit. Res. 2015, 4, 24–34. [Google Scholar] [CrossRef]
  72. Valente de Macedo, L.S.; Barda Picavet, M.E.; Puppim de Oliveira, J.A.; Shih, W.Y. Urban green and blue infrastructure: A critical analysis of research on developing countries. J. Clean. Prod. 2021, 313, 127898. [Google Scholar] [CrossRef]
  73. Frischenbruder, M.T.M.; Pellegrino, P. Using greenways to reclaim nature in Brazilian cities. Landsc. Urban Plan. 2004, 76, 67–78. [Google Scholar] [CrossRef]
  74. Lin, B.B.; Ossola, A.; Alberti, M.; Andersson, E.; Bai, X.; Dobbs, C.; Elmqvist, T.; Evans, K.L.; Frantzeskaki, N.; Fuller, R.A.; et al. Integrating solutions to adapt cities for climate change. Lancet Planet. Health 2021, 5, e479–e486. [Google Scholar] [CrossRef] [PubMed]
  75. Isely, E.S.; Isely, P.; Seedang, S.; Mulder, K.; Thompson, K.; Steinman, A.D. Addressing the information gaps associated with valuing green infrastructure in west Michigan: INtegrated Valuation of Ecosystem Services Tool (INVEST). J. Great Lakes Res. 2010, 36, 448–457. [Google Scholar] [CrossRef]
  76. Hu, W.; Li, G.; Gao, Z.; Jia, G.; Wang, Z.; Li, Y. Assessment of the impact of the Poplar Ecological Retreat Project on water conservation in the Dongting Lake wetland region using the InVEST model. Sci. Total Environ. 2020, 733, 139423. [Google Scholar] [CrossRef] [PubMed]
Figure 1. Study area.
Water 17 00143 g001
Figure 2. Methodological flow diagram for the assessment of pluvial flood mitigation ecosystem service using InVEST model for ecological corridor mapping.
Water 17 00143 g002
Figure 3. Input maps for the InVEST model: (a) land-use map—shows the classification of areas into urban, non-agricultural vegetation, agricultural area, bare soil and water; (b) soil hydrologic group map—indicates the types of soil hydrologic group in the study area.
Water 17 00143 g003
Figure 4. Results of the InVEST model: (a) runoff retention—identifies areas with high retention capacity, which is crucial for flood control; (b) runoff value—highlights areas most vulnerable to flooding due to low infiltration capacity.
Water 17 00143 g004
Figure 5. Resistance surface map depicting areas of high and low resistance to ecological connectivity. It is fundamental to identifying the most viable routes for ecological corridors.
Water 17 00143 g005
Figure 6. Ecological corridor map displaying the proposed corridor connecting the identified ecological sources.
Water 17 00143 g006
Table 1. Data inventory for model inputs.
Model InputsData Source
Rainfall DepthIntensity–duration–frequency curves and precipitation intensity data from SENAMHI
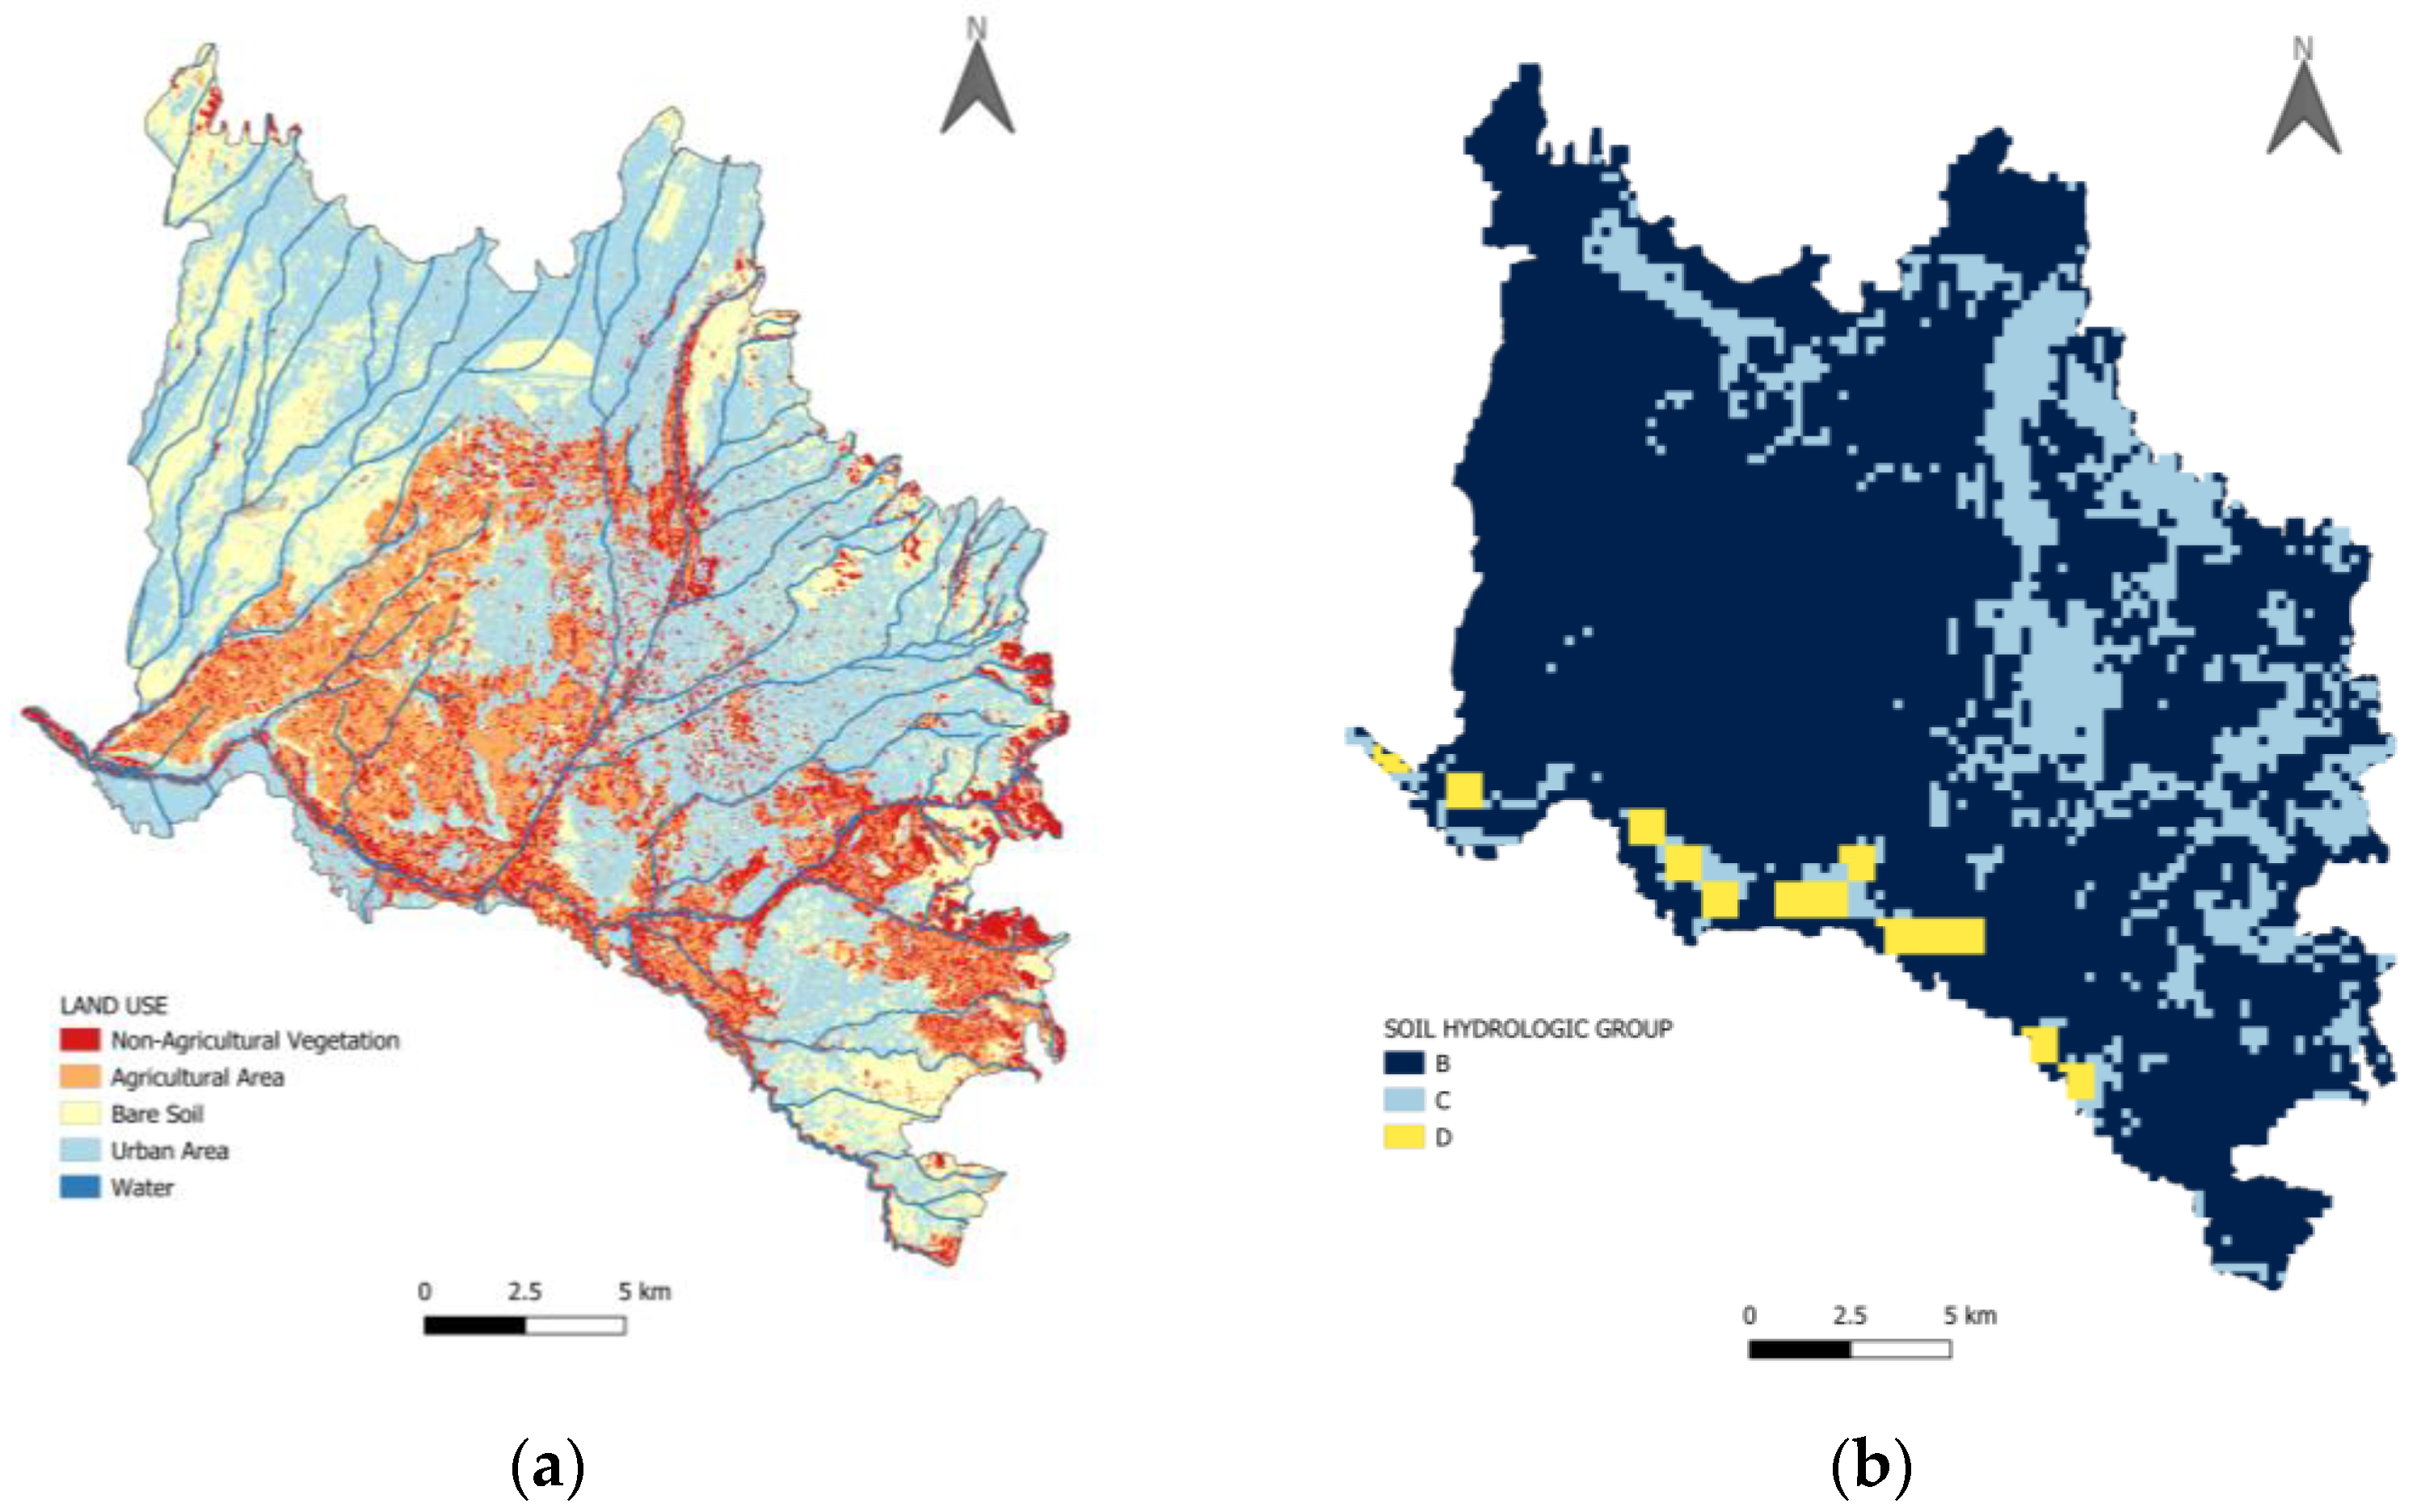
Land-UseLandsat 8-9 data from Earth Explorer and Geo Server of Instituto Geográfico Nacional
Soil Hydrologic GroupOak Ridge National Laboratory Distributed Active Archive Center (ORNL DAAC) from NASA
Biophysical TableData from [23,24]
Table 2. Data inventory for resistance surface inputs.
Model InputsData Source
Land-UseLandsat 8-9 data from Earth Explorer and GeoServer of Instituto Geográfico Nacional
SlopeDEM from Ministerio del Ambiente GeoServer
Proximity to RoadsGeoFabrik database from OpenStreetMap
Proximity to
Hydrographic Networks
GeoServer of Instituto Geográfico Nacional
Table 3. Saaty scale.
Intensity of ImportanceDescriptionSuitable Class
1Equal importanceLowest suitability
2Equal to moderate importanceVery low suitability
3Moderate importanceLow suitability
4Moderate to strong importanceModerately low suitability
5Strong importanceModerate suitability
6Strong to very strong importanceModerate high suitability
7Very strong importanceHigh suitability
8Very strong to extremely strong importanceVery high suitability
9Extremely importanceHighest suitability
Table 4. Biophysical table.
LucodeLand-UseCurve Number
cn_acn_bcn_ccn_d
1Non-agricultural vegetation49697984
2Agricultural area62717881
3Bare soil72828387
4Urban area80859095
5Water100100100100
Table 5. Classification by subcriteria.
CriteriaSubcriteriaValue
Land-useNon-agricultural vegetation1Contributes to ecological processes [40]. Helps maintain the health of urban ecosystems by providing ecosystem services [41].
Water bodies2Facilitate natural connectivity of ecologically relevant fragments [42]. Provide multiple ecosystem services.
Agricultural areas3Play a significant role in improving water and air quality and adapting to climate fluctuations [43]. Considered green infrastructure in urban areas [44]
Bare soil4Exposed to erosion, leading to loss of nutrients and permeability. Require stabilization through restoration plans, which increase resource costs [45].
Urban area5Fragment natural areas. Integrating ecological corridors in spaces with dense infrastructure presents logistical challenges and may lead to land-use conflicts [30,46].
Slope<4%2Steep slopes are not suitable for infiltration and retention measures. Green infrastructure is appropriate for slopes up to 20% [47]. Ideal
slopes are between 5% and 15% [48].
4–15%1
15–25%3
25–50%4
>50%5
Proximity to roads0–50 m5Roads represent an obstacle for establishing
corridors due to their social and economic
importance, making alteration difficult [49].
The surrounding environment suffers damage
and reduced capacity to resist
environmental risks.
50–100 m4
100–150 m3
150–200 m2
>200 m1
Proximity to hydrographic networks0 m1The environments surrounding water bodies provide multiple ecosystem services, which are intended to be enhanced. Additionally, hydrographic networks are natural corridors.
0–30 m2
30–100 m3
100–300 m4
>300 m5
Table 6. Pairwise comparison matrix.
CriteriaLand-UseProximity to Hydrographic NetworkSlopeProximity to Road Network
Land-use1234
Proximity to hydrographic network0.50124
Slope0.330.5013
Proximity to
road network
0.250.250.331
Total2.083.756.3312
Table 7. Normalized pairwise comparison matrix.
CriteriaLand-UseProximity to Hydrographic NetworkSlopeProximity to Road NetworkWeight
Land-use0.480.530.470.330.45
Proximity to hydrographic network0.240.270.320.330.29
Slope0.160.130.160.250.18
Proximity to
road network
0.120.070.050.080.08
Total1.001.001.001.001.00
Disclaimer/Publisher’s Note: The statements, opinions and data contained in all publications are solely those of the individual author(s) and contributor(s) and not of MDPI and/or the editor(s). MDPI and/or the editor(s) disclaim responsibility for any injury to people or property resulting from any ideas, methods, instructions or products referred to in the content.

